Cell-based HTS identifies a chemical chaperone for preventing ER protein aggregation and proteotoxicity
- Tokushima University, Japan
- Kawasaki Medical School, Japan
- The University of Tokyo, Japan
- Tokyo Medical and Dental University (TMDU), Japan
Figures
Figure 1 with 1 supplement
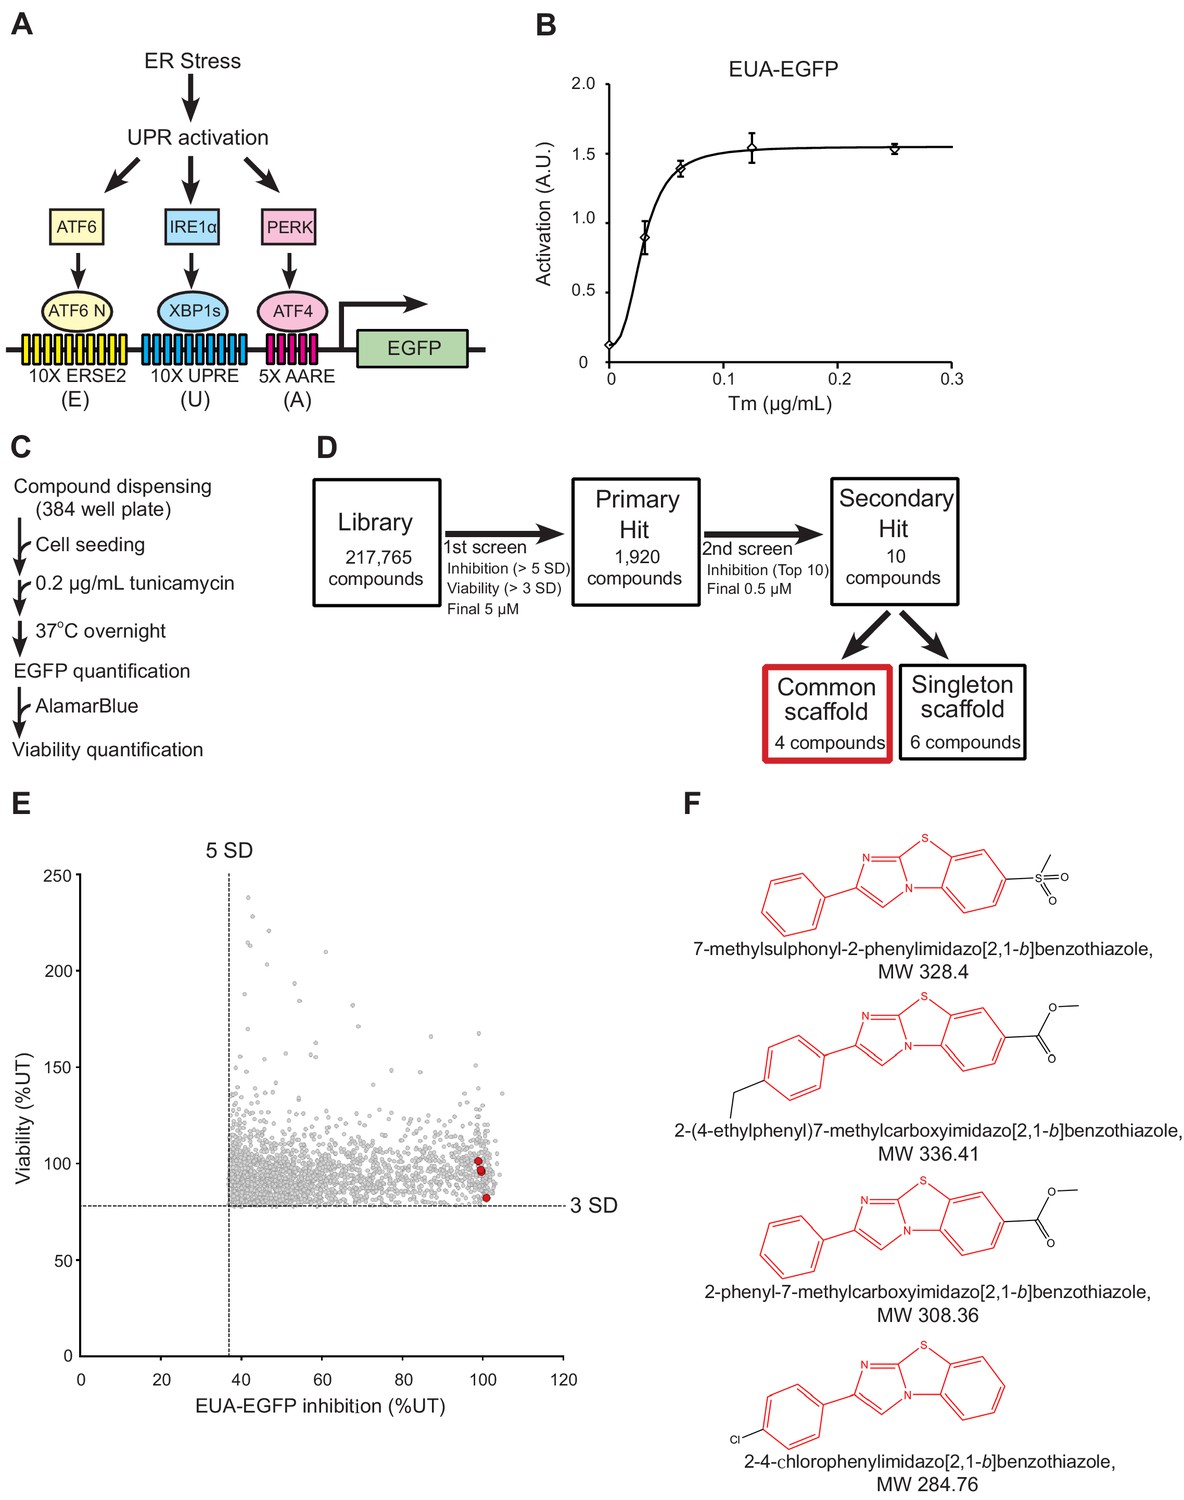
Cell-based high-throughput screening (HTS) for chemical chaperones.
(A) Schematic of the UPR activation reporter (EUA-EGFP) in our HTS that can sense the three branches of the UPR using three stress response elements. ERSE2, ER stress response element-2; UPRE, unfolded protein response element; AARE, amino acid response element. (B) Activation of EUA-EGFP in HEK293A cells treated with the indicated concentration of tunicamycin (Tm) treatment overnight. Error bars show the mean ± SD (n = 4). (C) HTS protocol for chemical chaperone identification. (D) Flow diagram for the identification of chemical chaperones. The hit selection criteria and criteria used for prioritizing compounds are shown. (E) Results of the primary screen. Four compounds with a common scaffold among the top 10 hit compounds are colored red. (F) Chemical structure of the four compounds with a common scaffold among the top 10 hit compounds. The 2-phenylimidazo[2,1-b]benzothiazole skeletal formula, which was the common scaffold, is shown in red.
-
Figure 1—source data 1
Dataset for Figure 1.
- https://cdn.elifesciences.org/articles/43302/elife-43302-fig1-data1-v2.xlsx
Figure 1—figure supplement 1
Valildation of the UPR activation EGFP reporter (EUA-EGFP) cell line.
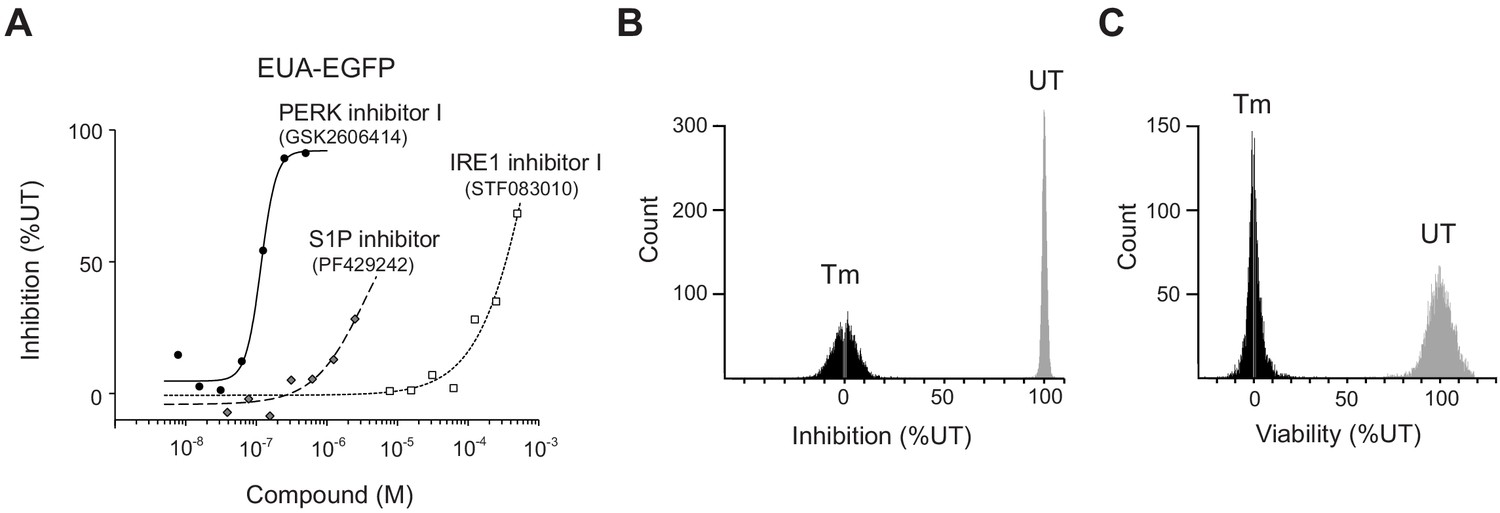
(A) Inhibition of the EUA-EGFP reporter in HEK293A cells treated with 0.2 μg/mL Tm in the presence of PERK inhibitor I (GSK2606414), IRE1 inhibitor I (STF083010) or Site-1-protease inhibitor (PF429242). (B–C) EUA-EGFP reporter activity and viability per well in the 1 st screen were counted.
-
Figure 1—figure supplement 1—source data 1
Dataset for Figure 1—figure supplement 1.
- https://cdn.elifesciences.org/articles/43302/elife-43302-fig1-figsupp1-data1-v2.xlsx
Figure 2 with 2 supplements
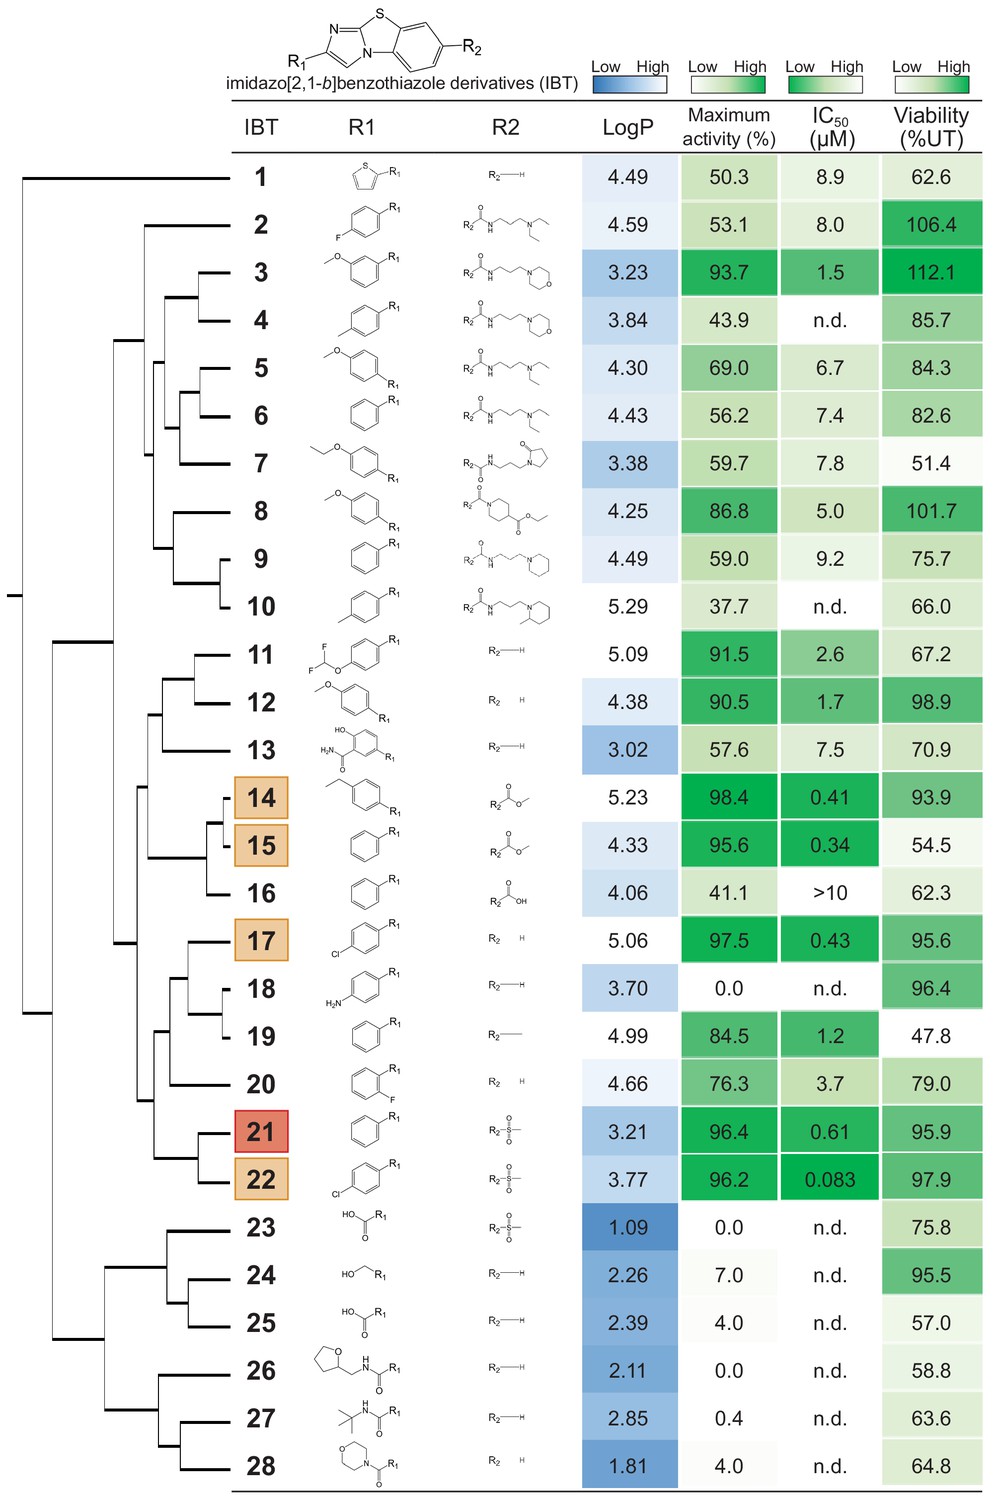
Structure-activity relationship study of imidazo[2,1-b]benzothiazole derivatives (IBTs).
The dendrogram for the hierarchical structural clustering of 28 IBTs is shown with the LogP, maximum activity (%),IC50 (μM) of EUA-EGFP and viability (%) of the cells treated with 0.2 μg/mL Tm overnight relative to that of the untreated cells. The top compound (IBT21) is highlighted in red and the 2nd to 5th compounds are highlighted in orange. n.d.: not-determined.
Figure 2—figure supplement 1
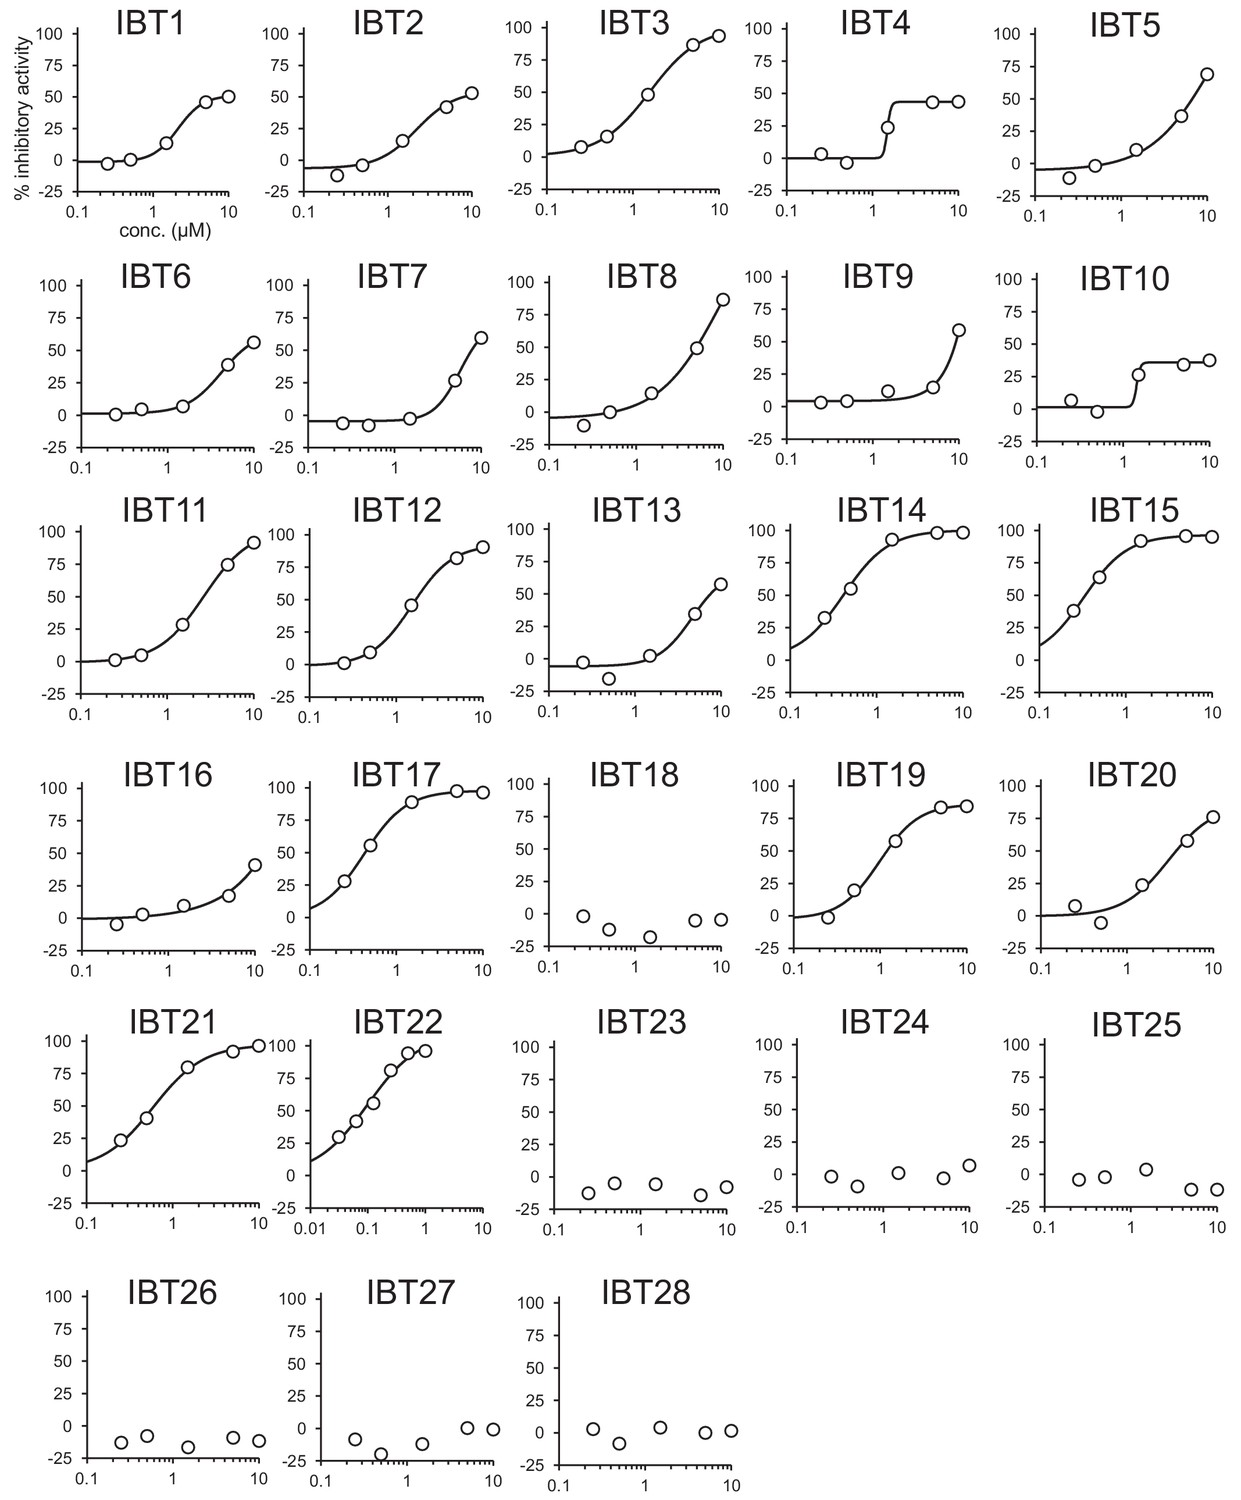
Inhibition of the EUA-EGFP reporter in HEK293A cells treated with 0.2 μg/mL Tm in the presence of IBTs at 5- or 6-point dose.
Error bars show the mean ± SD (n = 4–5).
-
Figure 2—figure supplement 1—source data 1
Dataset for Figure 2—figure supplement 1.
- https://cdn.elifesciences.org/articles/43302/elife-43302-fig2-figsupp1-data1-v2.xlsx
Figure 2—figure supplement 2
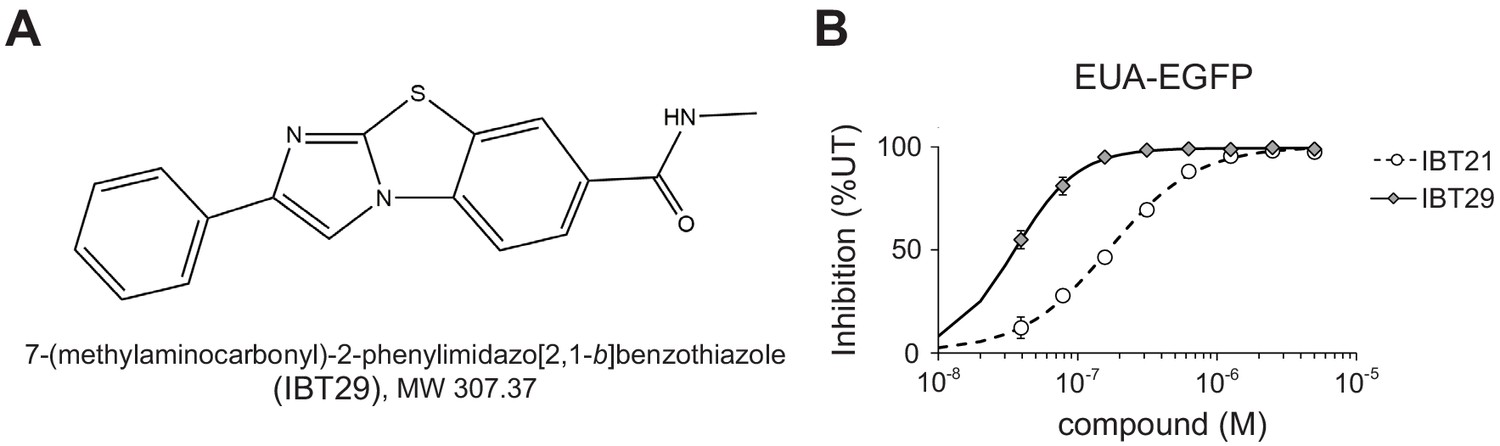
IBT29 exhibited higher activity than IBT21.
(A) Chemical structure of 7-(methylaminocarbonyl)−2-phenylimidazo[2,1-b]benzothiazole (IBT29). (B) Inhibition of the EUA-EGFP reporter in HEK293A cells treated with 0.2 μg/mL Tm in the presence of IBT21 or IBT29. Error bars show the mean ± SD (n = 4).
-
Figure 2—figure supplement 2—source data 1
Dataset for Figure 2—figure supplement 2.
- https://cdn.elifesciences.org/articles/43302/elife-43302-fig2-figsupp2-data1-v2.xlsx
Figure 3 with 1 supplement
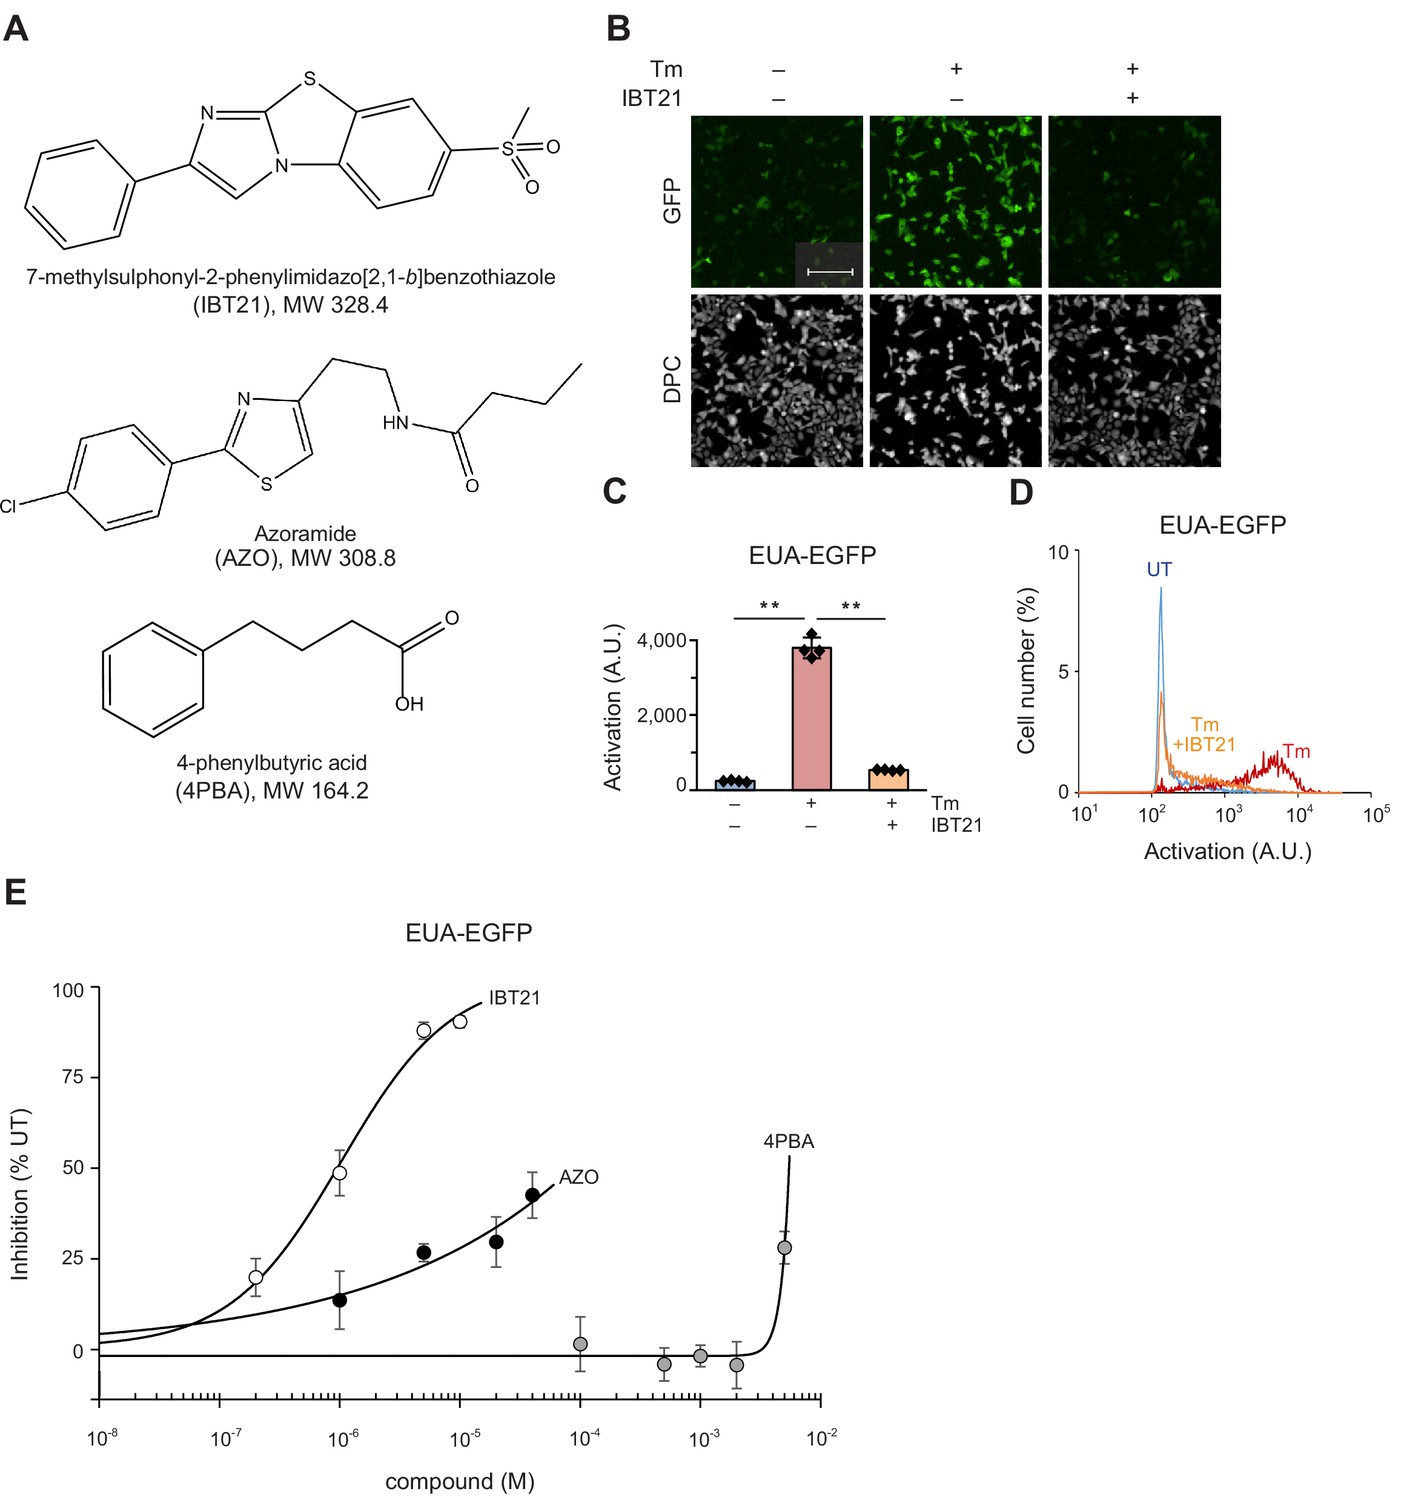
Comparison of IBT21 and the validated UPR modulator and chemical chaperone.
(A) Chemical structure of IBT21, azoramide (AZO) and 4PBA. (B) Representative images of HEK293A-EUA-EGFP cells treated with 0.2 μg/mL Tm in the presence or absence of 10 μM IBT21. DPC: digital phase contrast. The scale bar represents 200 μm. (C) GFP fluorescence intensities of the EUA-EGFP reporter with 0.2 μg/mL Tm in the presence or absence of 10 μM IBT21. Error bars show the mean ± SD (n = 4). Data were analyzed using one-way ANOVA with Tukey’s post hoc test, **p<0.01. (D) Distribution of GFP fluorescence from the EUA-EGFP reporter with 0.2 μg/mL Tm in the presence or absence of 10 μM IBT21. (E) Inhibition of the EUA-EGFP reporter in HEK293A cells treated with 0.2 μg/mL Tm in the presence of IBT21, AZO or 4PBA. Error bars show the mean ± SD (n = 4).
-
Figure 3—source data 1
Dataset for Figure 3.
- https://cdn.elifesciences.org/articles/43302/elife-43302-fig3-data1-v2.xlsx
Figure 3—figure supplement 1

Tm-induced UPR activation was inhibited by IBT21 also in another human cell line Hap1.
(A) Representative images of Hap1-EUA-EGFP cell line treated with 0.2 μg/mL Tm in the presence or absence of 10 μM IBT21. The scale bar shows 200 μm. (B) GFP fluorescence intensities of the Hap1-EUA-EGFP reporter with 0.2 μg/mL Tm in the presence or absence of 10 μM IBT21. Error bars show the mean ± SD (n = 5). Data were analyzed using one-way ANOVA with Tukey’s post hoc test, **p<0.01. (C) Distribution of GFP fluorescence for the Hap1-EUA-EGFP reporter with 0.2 μg/mL Tm in the presence or absence of 10 μM IBT21.
-
Figure 3—figure supplement 1—source data 1
Dataset for Figure 3—figure supplement 1.
- https://cdn.elifesciences.org/articles/43302/elife-43302-fig3-figsupp1-data1-v2.xlsx
Figure 4 with 5 supplements

Inhibitory effects of IBT21 on the activation of the three UPR branches under ER stress conditions.
(A–C) Inhibition of the 25X ERSE2-EGFP (A), 25X UPRE-EGFP (B) or 25X AARE-EGFP (C) reporters in HEK293A cells treated with 0.2 μg/mL Tm in the presence or absence of IBT21. Error bars show the mean ± SD (n = 4). (D) Representative immunoblots of ATF4, GADD34, CHOP, DNAJB9, SEL1L and HERPUD1 in HEK293A cells treated with 0.2 μg/mL Tm overnight in the presence or absence of IBT21 or AZO. β-actin was used as a loading control. (E) Representative immunoblots of ATF4, GADD34, CHOP, DNAJB9, SEL1L and HERPUD1 in HEK293A cells treated with 0.2 μg/mL Tm overnight in the presence or absence of 10 μM IBT21, 1 μM PERK inhibitor I (GSK2606414), 200 μM IRE1 inhibitor I (STF083010) or 2 μM Site-1-protease inhibitor (PF429242). β-actin was used as a loading control.
-
Figure 4—source data 1
Dataset for Figure 4.
- https://cdn.elifesciences.org/articles/43302/elife-43302-fig4-data1-v2.xlsx
Figure 4—figure supplement 1
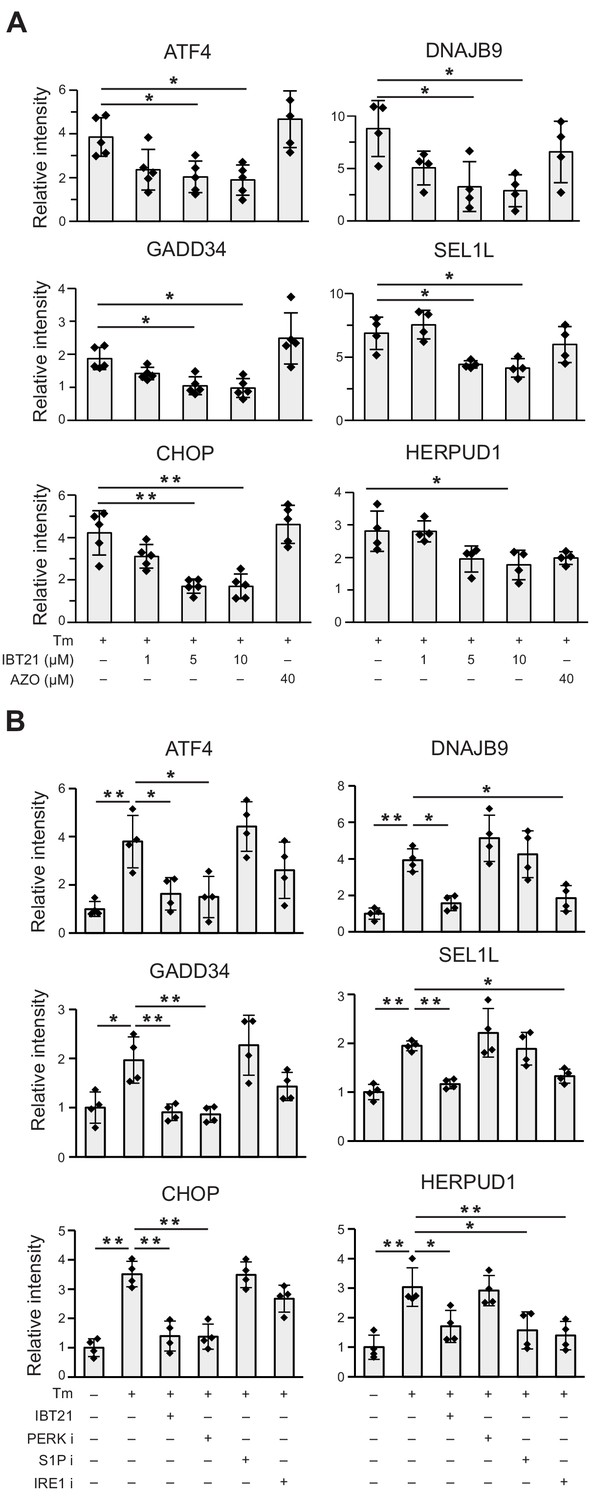
IBT21 treatment abolished Tm-induced induction of UPR downstream target genes.
(A) Densitometry quantification of the immunoblot analysis in Figure 4D. Error bars show the mean ± SD (n = 4). Data were analyzed by one-way ANOVA with Tukey’s post hoc test, *p<0.05 and **p<0.01. (B) Densitometry quantification of the immunoblot analysis in Figure 4E. Error bars show the mean ± SD (n = 4–5). Data were analyzed by one-way ANOVA with Tukey’s post hoc test, *p<0.05 and **p<0.01.
-
Figure 4—figure supplement 1—source data 1
Dataset for Figure 4—figure supplement 1B.
- https://cdn.elifesciences.org/articles/43302/elife-43302-fig4-figsupp1-data1-v2.xlsx
Figure 4—figure supplement 2

IBT21 does not affect the ability to induce UPR target genes.
(A) Representative immunoblots of ATF4, CHOP and 4E-BP1 in HEK293T cells overexpressing human ATF4 incubated with 10 μM IBT21 for 24 hr. β-actin was used as a loading control. (B) Densitometry quantification of the immunoblot analysis in A. Error bars show the mean ± SD (n = 4). Data were analyzed by one-way ANOVA with Tukey’s post hoc test, *p<0.05 and **p<0.01. n.s.: not significant. (C) Representative immunoblots of the nuclear form of ATF6 [ATF6 (N)] and BiP in HEK293A cells overexpressing human ATF6 (N) incubated with 10 μM IBT21 for 12 or 24 hr. β-actin was used as a loading control. (D) Densitometry quantification of the immunoblot analysis in C. Error bars show the mean ± SD (n = 4). Data were analyzed by one-way ANOVA with Tukey’s post hoc test, *p<0.05 and **p<0.01. n.s.: not significant.
-
Figure 4—figure supplement 2—source data 1
Dataset for Figure 4—figure supplement 1.
- https://cdn.elifesciences.org/articles/43302/elife-43302-fig4-figsupp2-data1-v2.xlsx
Figure 4—figure supplement 3

IBT21 does not affect protein translation.
(A) Representative immunoblots of puromycin in HEK293A cells treated with 10 μg/mL cycloheximide (CHX) or 10 μM IBT21 for 1–4 hr. Ponceau S was used as a loading control. (B) Densitometry quantification of the immunoblot analysis in A. Error bars show the mean ± SD (n = 4). Data were analyzed by one-way ANOVA with Tukey’s post hoc test, **p<0.01.
-
Figure 4—figure supplement 3—source data 1
Dataset for Figure 4—figure supplement 3.
- https://cdn.elifesciences.org/articles/43302/elife-43302-fig4-figsupp3-data1-v2.xlsx
Figure 4—figure supplement 4

IBT21 can also reduce ER stress caused by dithiothreitol (DTT).
(A) Representative images of HEK293A-EUA-EGFP cells treated with 5 mM DTT for 4 hr in the presence or absence of 10 μM IBT21. Compounds were washed out and incubated overnight. DPC: digital phase contrast. The scale bar shows 100 μm. (B) GFP fluorescence intensities of the EUA-EGFP reporter with 5 mM DTT in the presence or absence of 10 μM IBT21. Error bars show the mean ± SD (n = 5). Data were analyzed using one-way ANOVA with Tukey’s post hoc test, *p<0.05 and **p<0.01.
-
Figure 4—figure supplement 4—source data 1
Dataset for Figure 4—figure supplement 4.
- https://cdn.elifesciences.org/articles/43302/elife-43302-fig4-figsupp4-data1-v2.xlsx
Figure 4—figure supplement 5
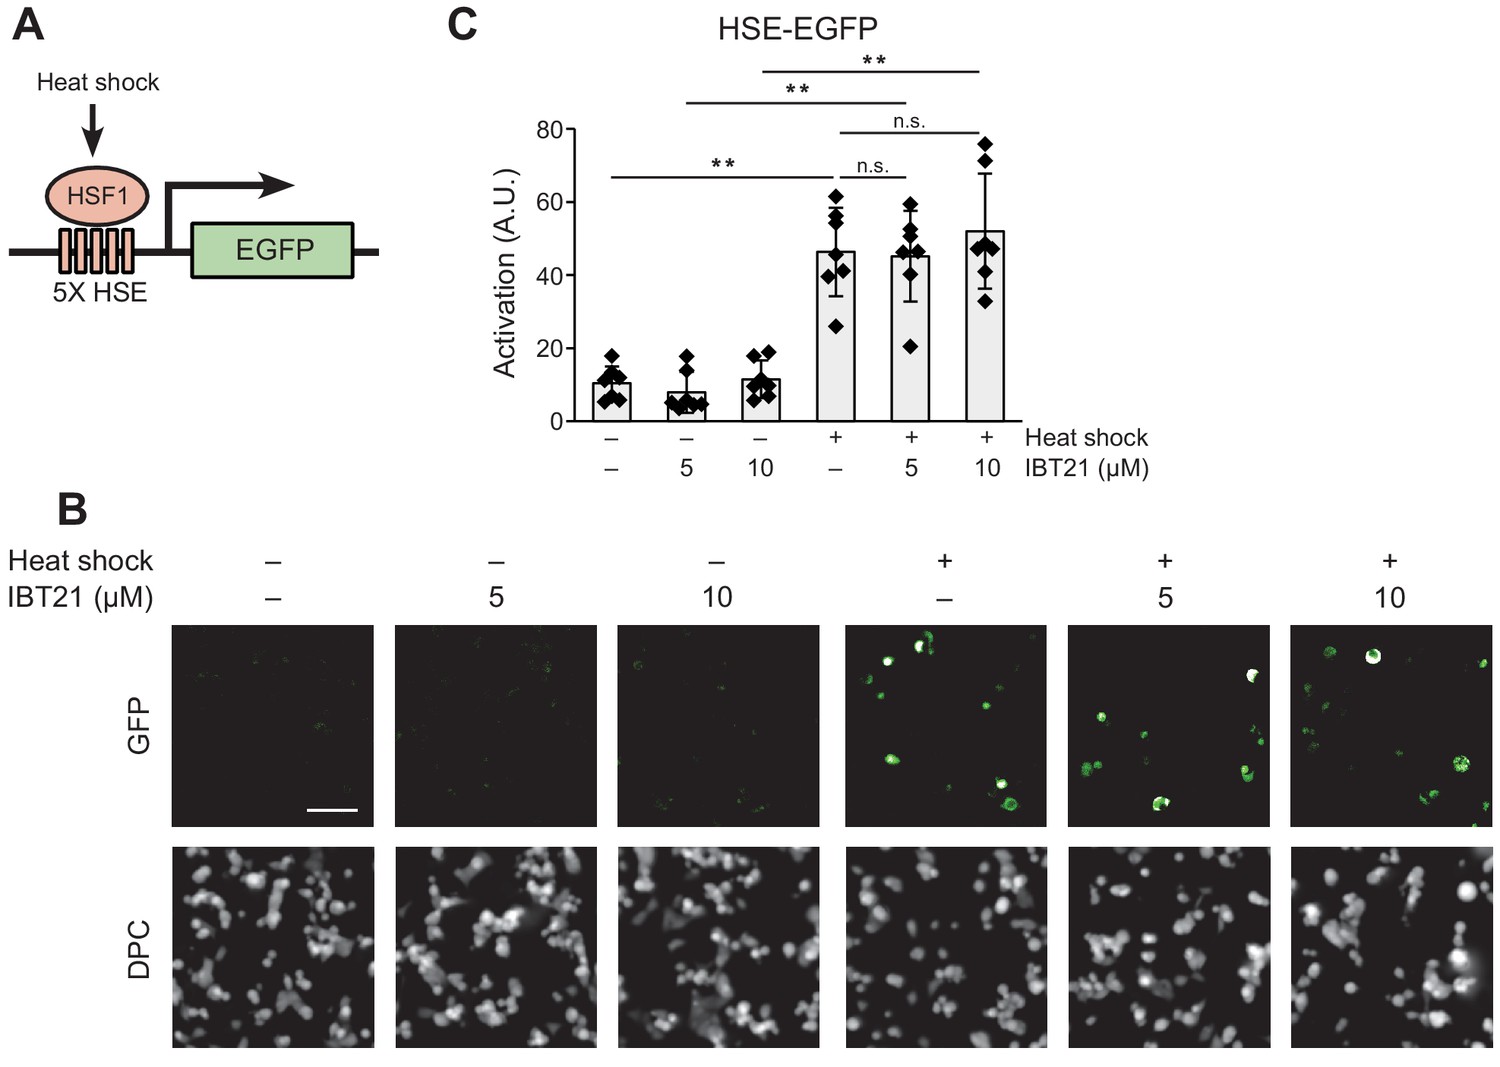
IBT21 could not suppress the induction of heat-shock response by heat shock.
(A) Schematic of the heat shock reporter (HSE-EGFP). HSE, heat shock element. (B) Representative images of HEK293A-HSE-EGFP cells exposed to hyperthermia at 42°C for 4 hr in the presence or absence of the indicated concentration of IBT21. DPC: digital phase contrast. The scale bar shows 100 μm. (C) Activation of HSE-EGFP in HEK293A cells exposed to hyperthermia at 42°C for 4 hr with the indicated concentration of IBT21. Error bars show the mean ± SD (n = 7). Data were analyzed using one-way ANOVA with Tukey’s post hoc test, **p<0.01. n.s.: not significant.
-
Figure 4—figure supplement 5—source data 1
Dataset for Figure 4—figure supplement 5.
- https://cdn.elifesciences.org/articles/43302/elife-43302-fig4-figsupp5-data1-v2.xlsx
Figure 5 with 1 supplement

In vivo effects of IBT21 on protein aggregation during ER stress.
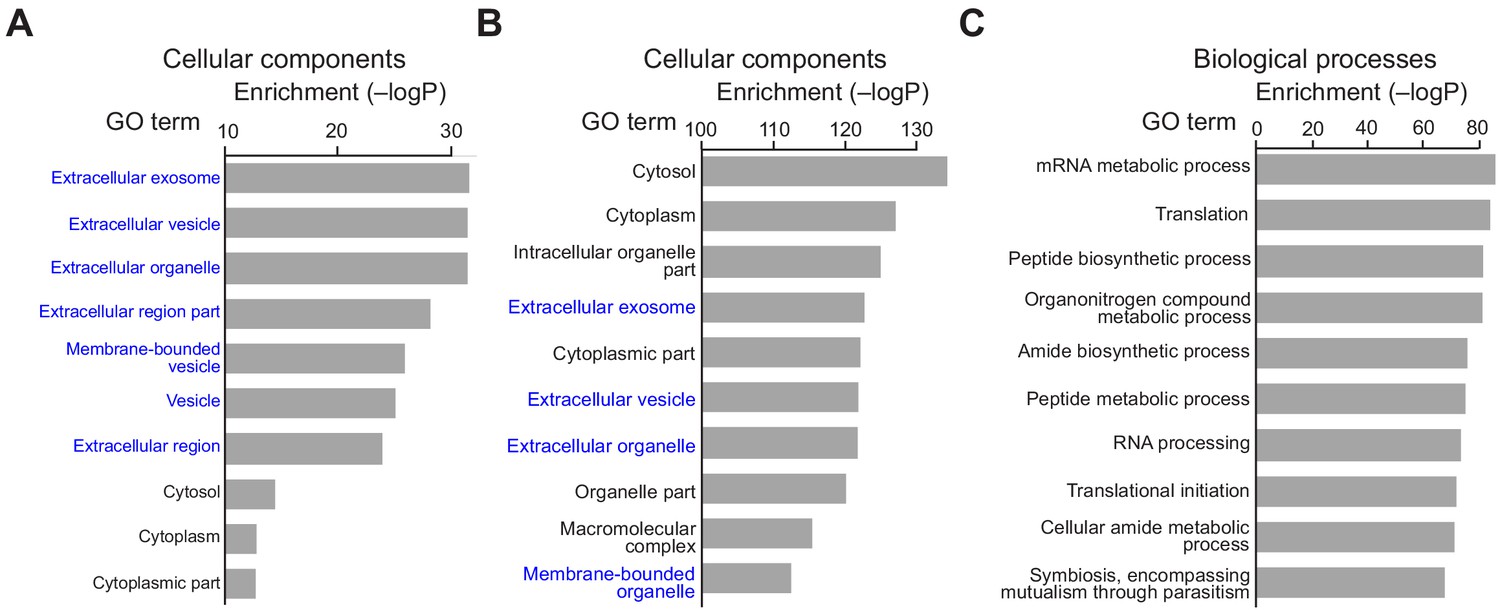
(A) Representative immunofluorescence images of protein aggregates stained with ProteoStat dye in HEK293A-EUA-EGFP cells treated with 0.2 μg/mL Tm in the presence or absence of 10 μM IBT21. MG132 was used as an aggregation control. The scale bar represents 50 μm. (B) Relative fluorescence intensities of aggresome staining in A. Error bars show the mean ± SD (n = 8). One-way ANOVA with Tukey’s post hoc test, **p<0.01. (C) Relative fluorescence intensities of insulin aggregates induced by DTT treatment and stained with ProteoStat dye with or without the indicated concentration of IBT21, 4PBA or AZO. Error bars show the mean ± SD (n = 3). One-way ANOVA with Tukey’s post hoc test, **p<0.01. (D) Protocol for high molecular weight (HMW) detergent-resistant complex separation. HEK293A cells treated with 0.2 μg/mL Tm in the presence or absence of 10 μM IBT21 were lysed in lysis buffer, adjusted to 0.8% SDS, loaded on separation buffer and then ultracentrifuged at 100,000 × g for 55 min. The pellet fraction (SDS-resistant HMW complex) was considered aggregated proteins (AGGREGATED). (E) Representative immunoblots of BiP in the AGGREGATED SDS-resistant HMW complexes and in the INPUT. (F) Densitometry quantification of the immunoblot analysis in E. The protein levels of BiP in the AGGREGATED and INPUT were normalized to β-actin levels in the INPUT. Error bars show the mean ± SD (n = 3). One-way ANOVA with Tukey’s post hoc test, *p<0.05, **p<0.01. n.s: not significant. (G) Bubble plot representation of HMW detergent-resistant aggregated proteins. The X-axis denotes the Tm to UT abundance ratio in the absence of IBT21. The Y-axis denotes the Tm to Tm+IBT21 abundance ratio. Each threshold is 1.5-fold-change. Representative hit proteins, such as HSPA5, PDIA4, ANXA1 and TAGLN2, are indicated. Peptide-spectrum matches (PSMs) are correlated with the size of the circle. (H–I) Functional classification of proteins protected from aggregation by IBT21. Aggregated proteins that were suppressed by IBT21 (Tm/UT > 1.5 and Tm/Tm+IBT21 >1.5) were categorized on the basis of cellular components (H) and biological processes (I) through Gene Ontology (GO) annotation.
-
Figure 5—source data 1
Dataset for Figure 5B, C and F.
- https://cdn.elifesciences.org/articles/43302/elife-43302-fig5-data1-v2.xlsx
-
Figure 5—source data 2
Dataset for Figure 5G.
- https://cdn.elifesciences.org/articles/43302/elife-43302-fig5-data2-v2.xlsx
-
Figure 5—source data 3
Dataset for Figure 5H.
- https://cdn.elifesciences.org/articles/43302/elife-43302-fig5-data3-v2.xlsx
-
Figure 5—source data 4
Dataset for Figure 5I.
- https://cdn.elifesciences.org/articles/43302/elife-43302-fig5-data4-v2.xlsx
Figure 5—figure supplement 1

IBT21 prevented Tm-induced protein misfolding.
(A) Reproducibility of Figure 5. Bubble plot representation of HMW detergent-resistant aggregated proteins. The threshold on the X-axis (Tm to UT abundance ratio) and Y-axis (Tm to Tm+IBT21 abundance ratio) are 1.5-fold changes. Representative hit proteins, such as HSPA5, PDIA4, ANXA1 and TAGLN2, are indicated with colors. Peptide-spectrum matches (PSMs) are correlated with the size of the circle. (B–C) Aggregated proteins that were suppressed by IBT21 (Tm/UT > 1.5 and Tm/Tm+IBT21 >1.5) were categorized on the basis of cellular components (B) and biological processes (C) through Gene Ontology (GO) annotation.
-
Figure 5—figure supplement 1—source data 1
Dataset for Figure 5—figure supplement 1A.
- https://cdn.elifesciences.org/articles/43302/elife-43302-fig5-figsupp1-data1-v2.xlsx
-
Figure 5—figure supplement 1—source data 2
Dataset for Figure 5—figure supplement 1B.
- https://cdn.elifesciences.org/articles/43302/elife-43302-fig5-figsupp1-data2-v2.xlsx
-
Figure 5—figure supplement 1—source data 3
Dataset for Figure 5—figure supplement 1C.
- https://cdn.elifesciences.org/articles/43302/elife-43302-fig5-figsupp1-data3-v2.xlsx
Figure 6 with 1 supplement

In vivo target protein identification of IBT21 during ER stress.
(A) Chemical structure of the diazido-IBT21 probe. (B) Inhibition of the EUA-EGFP reporter in HEK293A cells treated with 0.2 μg/mL Tm in the presence of IBT21, diazido-IBT21 or IBT22. Error bars show the mean ± SD (n = 4). (C) Protocol for IBT-BONDED protein identification. HEK293A cells treated with 0.2 μg/mL Tm and 1 μM diazido-IBT21 probe were crosslinked to interacting proteins and labelled with biotin. (D) Bubble plot representation of the IBT-BONDED proteins. The X-axis denotes the abundance ratio of IBT competitor to no competitor. The Y-axis denotes the abundance ratio of diazido-IBT21 probe to no probe. Each threshold represents a 1.5-fold-change. Peptide-spectrum matches (PSMs) are correlated with the size of the circle. (E) Pie chart representation for the categorization of the IBT-BONDED proteins identified in experiments comparing cells treated with probe/no-probe and probe/probe + competitor. Each threshold represents a 1.5-fold-change. (F) Flow diagram for the comparison between the IBT-SENSITIVE and Competed and Selective proteins. (G) Bubble plot representation of the Overlapped proteins. The X-axis denotes the abundance ratio of diazido-IBT21 probe to no probe. The Y-axis denotes the abundance ratio of IBT competitor to no competitor. Each threshold represents a 1.5-fold-change. Representative hit proteins, such as ANXA1 and TAGLN2, are indicated in blue. Peptide-spectrum matches (PSMs) are correlated with the size of the circle. (D) Functional classification of the Overlapped proteins.
-
Figure 6—source data 1
Dataset for Figure 6.
- https://cdn.elifesciences.org/articles/43302/elife-43302-fig6-data1-v2.xlsx
-
Figure 6—source data 2
Dataset for Figure 6D and E.
- https://cdn.elifesciences.org/articles/43302/elife-43302-fig6-data2-v2.xlsx
-
Figure 6—source data 3
Dataset for Figure 6G.
- https://cdn.elifesciences.org/articles/43302/elife-43302-fig6-data3-v2.xlsx
-
Figure 6—source data 4
Dataset for Figure 6H.
- https://cdn.elifesciences.org/articles/43302/elife-43302-fig6-data4-v2.xlsx
Figure 6—figure supplement 1
The Competed and Selective proteins largely cover the IBT21-targeted proteins corresponding to chemical chaperone activity.
(A) Overlapped proteins were categorized on the basis of cellular components. (B–C) Competed and Selective proteins were categorized on the basis of cellular components (B) and biological processes (C) through Gene Ontology (GO) annotation.
-
Figure 6—figure supplement 1—source data 1
Dataset for Figure 6—figure supplement 1A.
- https://cdn.elifesciences.org/articles/43302/elife-43302-fig6-figsupp1-data1-v2.xlsx
-
Figure 6—figure supplement 1—source data 2
Dataset for Figure 6—figure supplement 1B.
- https://cdn.elifesciences.org/articles/43302/elife-43302-fig6-figsupp1-data2-v2.xlsx
-
Figure 6—figure supplement 1—source data 3
Dataset for Figure 6—figure supplement 1C.
- https://cdn.elifesciences.org/articles/43302/elife-43302-fig6-figsupp1-data3-v2.xlsx
Figure 7
Cytoprotective effects of IBT21 during ER stress.
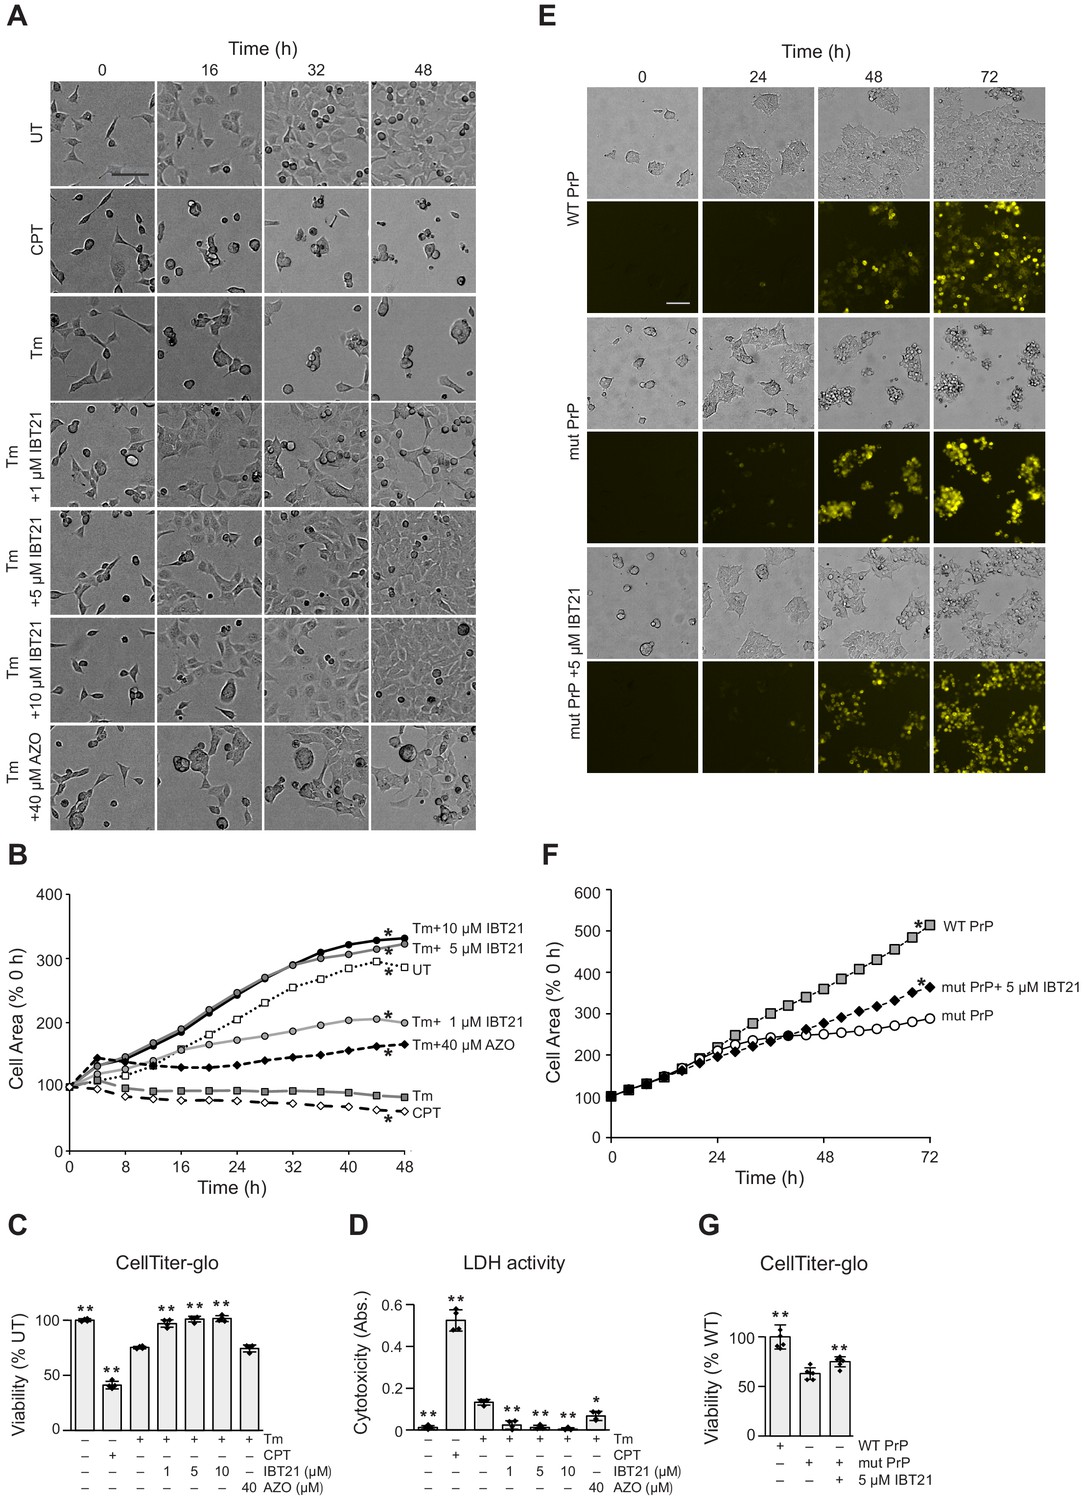
(A) Representative bright-field images of HEK293A cells treated with 0.2 μg/mL Tm in the presence or absence of compounds for the indicated times. Camptothecin (CPT) was used as a cell death control. The scale bar represents 100 μm. (B) Cell growth curve of HEK293A cells treated with 0.2 μg/mL Tm in the presence or absence of compounds for the indicated times. (n = 3); two-way ANOVA with Holm’s post hoc test, *p<0.05. (C–D) HEK293A cells were treated with 0.2 μg/mL Tm in the presence or absence of compounds for 48 hr. Cell viability was determined by an intracellular ATP assay (C) or LDH activity (D). Error bars show the mean ± SD (n = 4). One-way ANOVA with Tukey’s post hoc test, *p<0.05 and **p<0.01. (E) Representative bright-field and YFP images of HEK293T cells overexpressing YFP-tagged WT or YFP-tagged mutant prion protein (PrP) in the presence or absence of 5 μM IBT21 for the indicated times. The scale bar represents 100 μm. (F) Cell growth curve of HEK293T cells overexpressing YFP-tagged WT or YFP-tagged mutant prion protein (PrP) in the presence or absence of 5 μM IBT21 for the indicated times (n = 6). Two-way ANOVA with Holm’s post hoc test, *p<0.05. (G) Intracellular ATP assay of HEK293T cells overexpressing YFP-tagged WT or YFP-tagged mutant prion protein (PrP) in the presence or absence of 5 μM IBT21 for the indicated times. Error bars show the mean ± SD (n = 6). One-way ANOVA with Tukey’s post hoc test, *p<0.05 and **p<0.01.
-
Figure 7—source data 1
Dataset for Figure 7.
- https://cdn.elifesciences.org/articles/43302/elife-43302-fig7-data1-v2.xlsx
Scheme 1
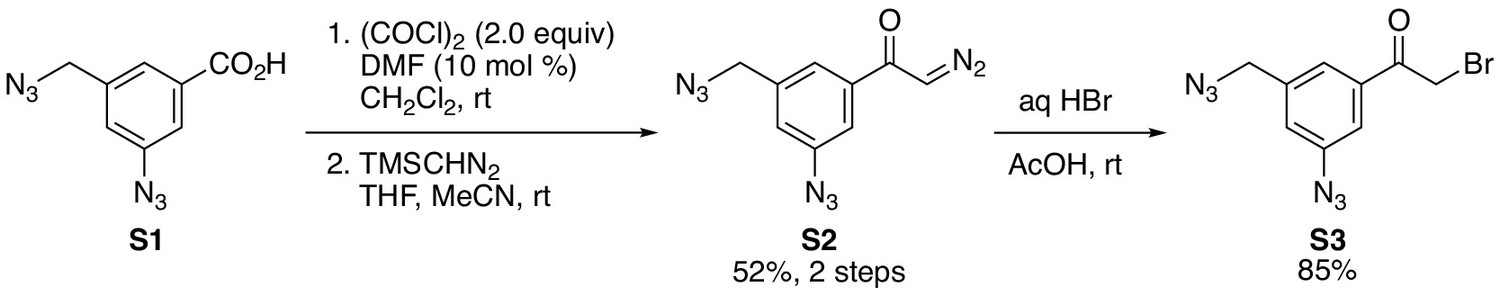
Synthesis of compounds S1 - S3.
Scheme 2
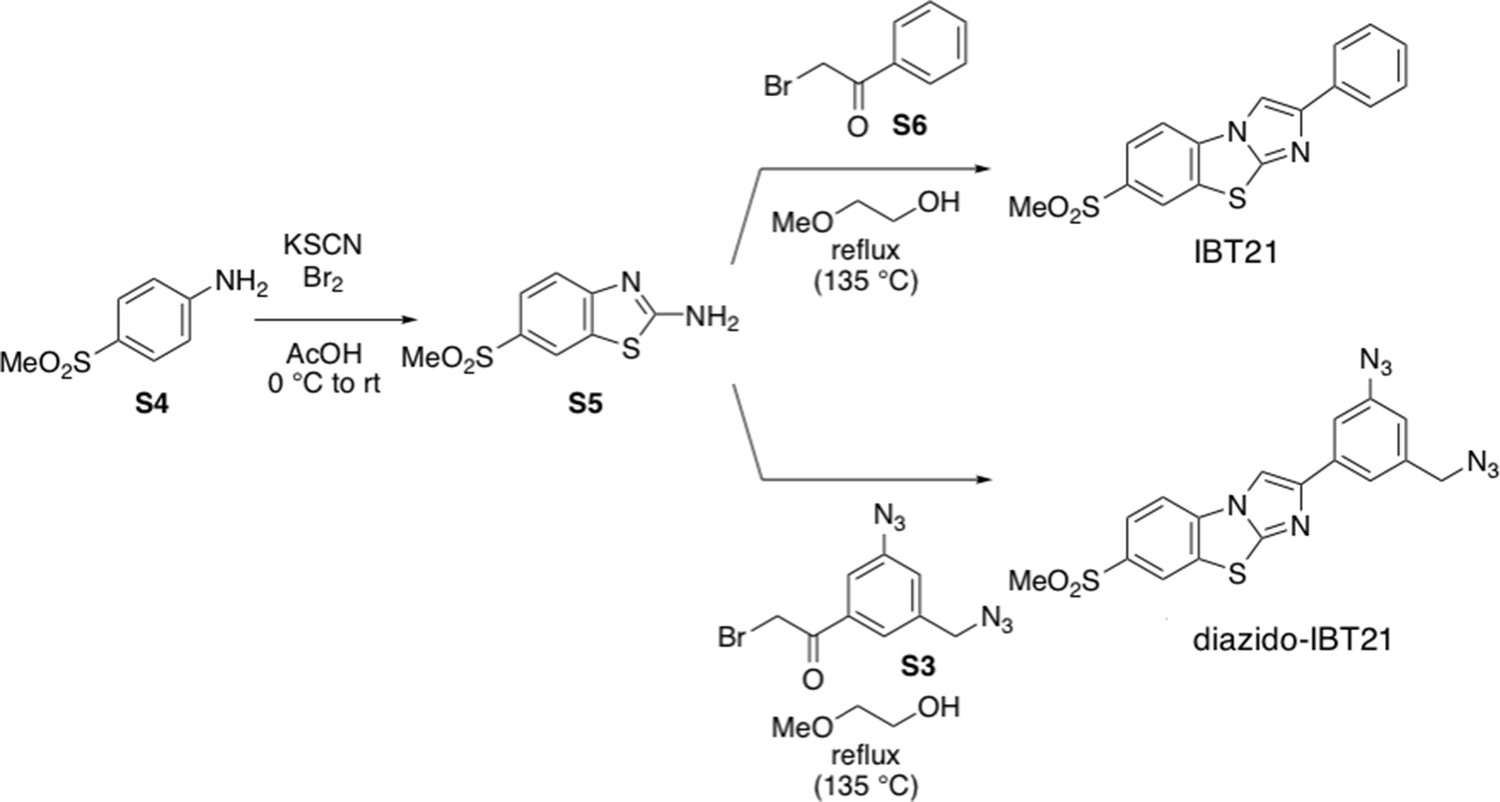
Synthesis of compounds S4 - IBT21 or diazido-IBT21.
Additional files
Download links
A two-part list of links to download the article, or parts of the article, in various formats.
Downloads (link to download the article as PDF)
Open citations (links to open the citations from this article in various online reference manager services)
Cite this article (links to download the citations from this article in formats compatible with various reference manager tools)
Cell-based HTS identifies a chemical chaperone for preventing ER protein aggregation and proteotoxicity
eLife 8:e43302.
https://doi.org/10.7554/eLife.43302


