Identification of EOMES-expressing spermatogonial stem cells and their regulation by PLZF
- The Jackson Laboratory, United States
Abstract
Long-term maintenance of spermatogenesis in mammals is supported by GDNF, an essential growth factor required for spermatogonial stem cell (SSC) self-renewal. Exploiting a transgenic GDNF overexpression model, which expands and normalizes the pool of undifferentiated spermatogonia between Plzf +/+ and Plzf lu/lu mice, we used RNAseq to identify a rare subpopulation of cells that express EOMES, a T-box transcription factor. Lineage tracing and busulfan challenge show that these are SSCs that contribute to steady state spermatogenesis as well as regeneration following chemical injury. EOMES+ SSCs have a lower proliferation index in wild-type than in Plzf lu/lu mice, suggesting that PLZF regulates their proliferative activity and that EOMES+ SSCs are lost through proliferative exhaustion in Plzf lu/lu mice. Single cell RNA sequencing of EOMES+ cells from Plzf +/+ and Plzf lu/lu mice support the conclusion that SSCs are hierarchical yet heterogeneous.
https://doi.org/10.7554/eLife.43352.001Introduction
Fertility in males is supported by a robust stem cell system that allows for continuous sperm production throughout the reproductive life of the individual. In humans this lasts for decades and in a mouse can last for nearly its entire lifetime. However, despite more than a half century of research, and intensive investigation by many labs over the last decade, the identity of the germline stem cell continues to be elusive and controversial.
Stem cell function clearly resides in a subpopulation of spermatogonia within the basal compartment of the seminiferous tubules. In 1971, Huckins and Oakberg proposed the ‘As’ model of spermatogonial stem cells (SSC) function where Asingle (As) SSCs divide in a linear and non-reversible manner to populate the spermatogenic lineage (Oakberg, 1971a; Oakberg, 1971b; Huckins, 1971). In this model, As spermatogonia are the SSCs, dividing symmetrically and with complete cytokinesis to form two daughter As cells for self-renewal, or dividing with incomplete cytokinesis to form Apaired (Apr) cells, which are irreversibly committed to differentiation. Apr cells, in turn, divide to form Aaligned (Aal) spermatogonia, which exist as chains of 4, 8, or 16 interconnected cells. The As, Apr, and Aal spermatogonia encompass the pool of undifferentiated spermatogonia that can be identified morphologically and are thought to share important functional properties distinct from the differentiated spermatogonia; A1-A4, intermediate and B (Chiarini-Garcia and Russell, 2001; Chiarini-Garcia and Russell, 2002).
Contrary to the Huckins/Oakberg As model, recent studies on the behavior of pulse-labeled spermatogonia populations suggest that Apr and Aal syncytia can fragment and revert to become As cells following transplantation as well as during steady state spermatogenesis (Nakagawa et al., 2010; Hara et al., 2014). This suggests that undifferentiated spermatogonia are not irreversibly committed to differentiation, allowing for an alternative mechanism for SSC self-renewal. Furthermore, As, Apr, and Aal spermatogonia are characterized by heterogeneous gene expression (Nakagawa et al., 2010; Hara et al., 2014; Suzuki et al., 2009; Nakagawa et al., 2007; Barroca et al., 2009; Sada et al., 2009) including recent descriptions of specific subpopulations of As cells with SSC activity expressing Id4, Pax7, Bmi1, T and Pdx1 (Chan et al., 2014; Aloisio et al., 2014; Komai et al., 2014; Tokue et al., 2017; La et al., 2018). These new data do not easily comport to a unifying model and imply that the mode of SSC function in the testes is more complex than the original Huckins-Oakberg As model suggests.
A majority of As and Apr cells express GFRA1, a GPI-anchored receptor for glial cell-derived neurotrophic factor (GDNF) (Buageaw et al., 2005; Naughton et al., 2006; Johnston et al., 2011; Sato et al., 2011; Grasso et al., 2012). GDNF is secreted by neighboring somatic Sertoli (Meng et al., 2000) and peritubular myoid (Chen et al., 2016) cells and is required for establishment and self-renewal of the SSC population in a dose-dependent manner (Meng et al., 2000). A decrease in GDNF levels results in germ cell loss, while overexpression of GDNF promotes accumulation of SSCs due to a block in differentiation (Meng et al., 2000; Sharma and Braun, 2018). Plzf (Zbtb16), which encodes a transcription factor expressed in As, Apr and Aal spermatogonia, is required for SSC maintenance, as mutation of Plzf results in age-dependent germ cell loss (Buaas et al., 2004; Costoya et al., 2004). The mechanisms by which PLZF regulates SSC maintenance are not yet known. We describe here the identification of a rare subpopulation of As cells whose cycling frequency is altered in Plzf lu/lu mutants, suggesting that PLZF regulates the proliferation of SSCs.
Results
GDNF increases the undifferentiated spermatogonial population in Plzf mutants
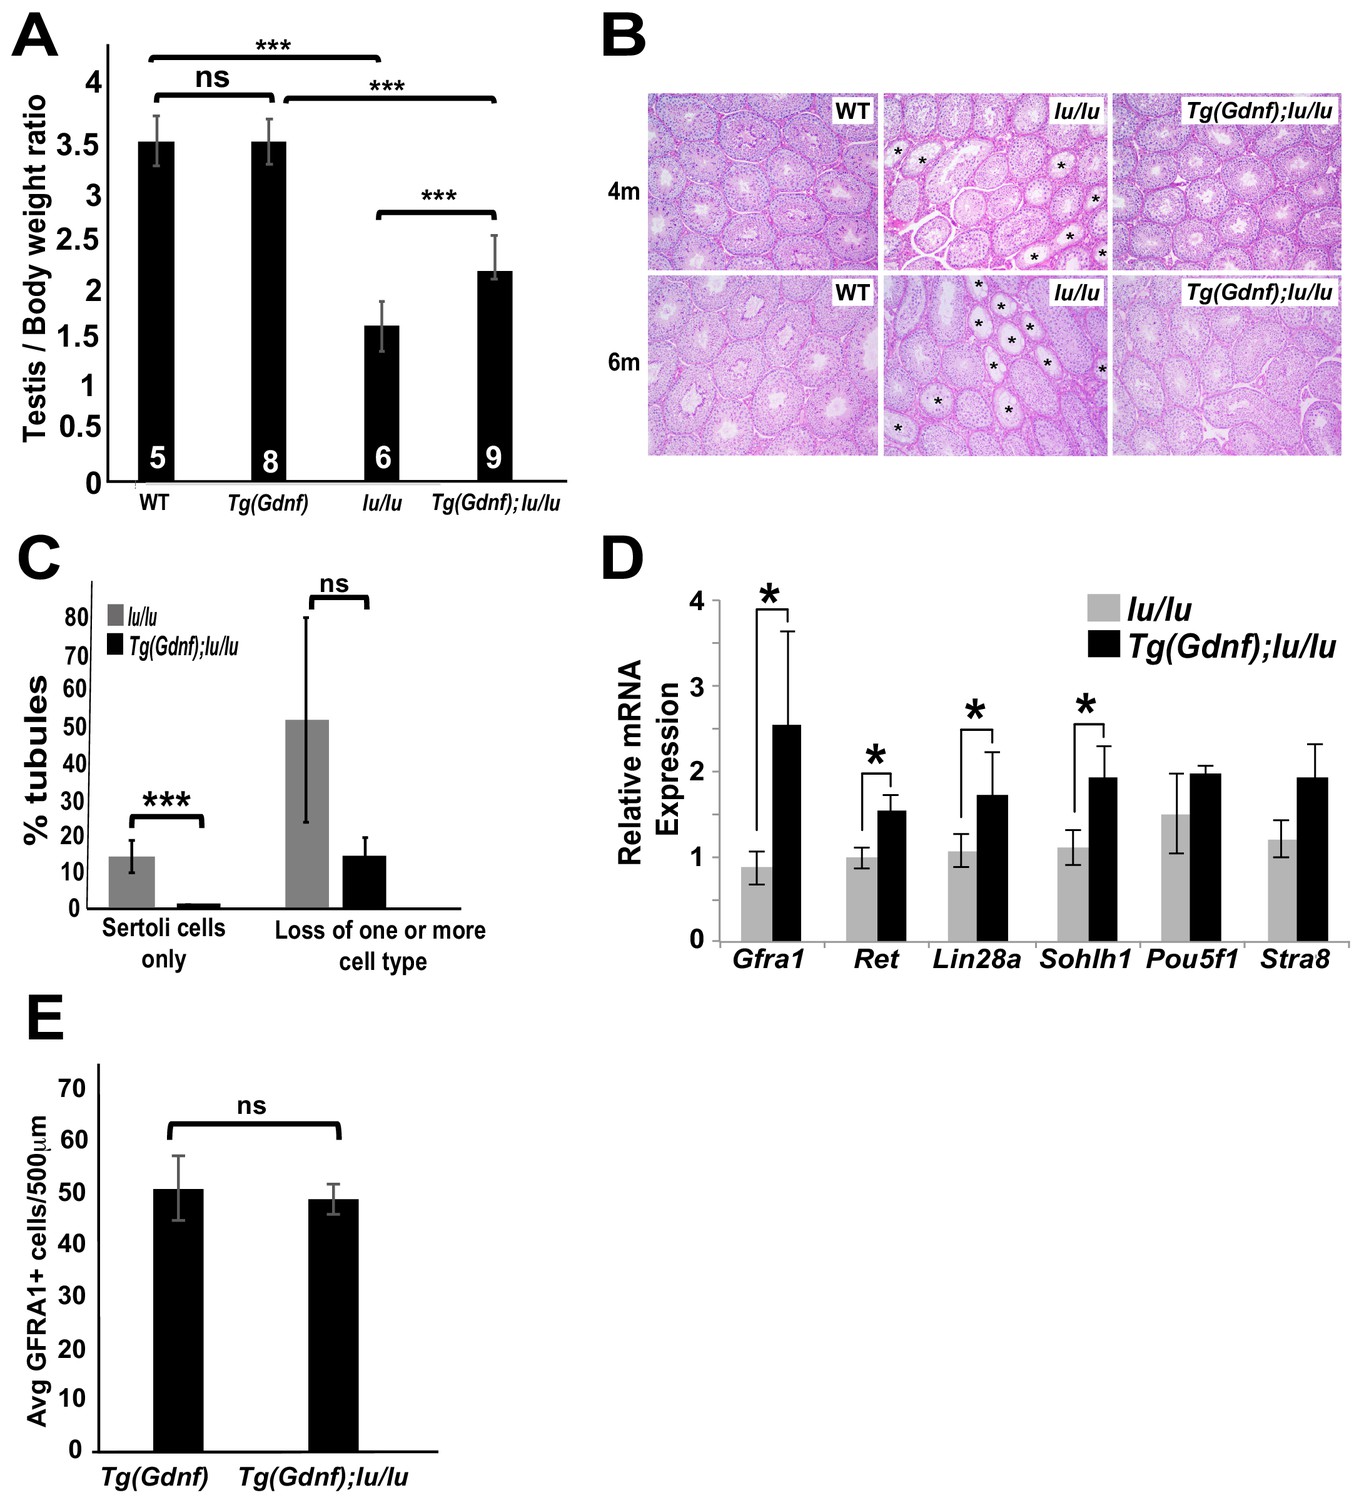
Stage-specific temporal ectopic expression of GDNF in supporting Sertoli cells results in the accumulation of large clusters of tightly-packed PLZF+ undifferentiated spermatogonia (Sharma and Braun, 2018; Yomogida et al., 2003). To determine whether overexpression of GDNF could rescue germ cell loss in luxoid (lu) mutants, we generated Tg(Ctsl-Gdnf)1Reb; Plzf lu/lu mice (referred to as Tg(Gdnf);lu/lu). While no difference was found in the testis/body weight ratio between WT and Tg(Gdnf) mice, the testis/body weight ratio was significantly higher in Tg(Gdnf);lu/lu mice compared to lu/lu (p=0.0005), although it was still lower than in Tg(Gdnf) (p=0.0001) animals (Figure 1A). At four months of age, Periodic acid-Schiff staining of testes sections showed fewer agametic tubules (referred to as Sertoli cell only) in Tg(Gdnf);lu/lu mice compared to lu/lu at both 4 and 6 months of age (Figure 1B and C). Increased testis/body weight in Tg(GDNF);lu/lu mice could therefore be due to an increase in the number of cells occupying individual tubules, reflected by a decrease in the number of tubules with a Sertoli cell only phenotype, and fewer tubules with loss of one or more cell populations at 6 months of age (Figure 1C).
Figure 1 with 1 supplement see all
Sertoli-cell overexpression of GDNF partially reverses the loss of undifferentiated spermatogonia in luxoid mice.
(A) Testis/body weight ratios. No significant (ns) difference was observed in testis/body weight between WT and Tg(Gdnf). Significant differences (***) were detected between WT and lu/lu (p=0.0001), Tg(Gdnf) and Tg(Gdnf);lu/lu (p=0.0001) and between lu/lu and Tg(Gdnf);lu/lu (p=0.0005). Number in bar = n animals. (B) Representative images of periodic-acid-Schiff stained cross-sections of 4- and 6 month old testes showing agametic tubules (asterisks) in lu/lu. (C) Fewer tubules with germ cell loss were present at 6 months in Tg(Gdnf):lu/lu. A total of 200–300 tubules were counted for each genotype (n = 3). p<0.005. (D) qRT-PCR on testis RNA from 4 month old mice shows a significant increase in SSC gene expression in lu/lu mice overexpressing GDNF in Sertoli cells. Relative mRNA levels are normalized to a β-actin internal control. *, p<0.01. (n = 3) (E) Average number of GFRA1+ cells per 500 μm length of tubules in Tg(Gdnf) and Tg(Gdnf);lu/lu in 10wk old mice (n = 3).
-
Figure 1—source data 1
Source file for Figure 1A, 1C and 1E.
- https://doi.org/10.7554/eLife.43352.005
To determine what germ cell populations were expanded in Tg(Gdnf);lu/lu testes, we immuno-stained both whole-mount tubules and sections for spermatogonia markers. Large clusters of GFRA1+ cells were observed in Tg(Gdnf);lu/lu tubules, suggesting an increased number of the earliest spermatogonial cell types, As and Apr (Figure 1—figure supplement 1A). Quantitation of LIN28A staining, which is detected in a subpopulation of As, and Apr, Aal and A1 spermatogonia (Chakraborty et al., 2014), on 12 week old testes sections (Figure 1—figure supplement 1B) showed that 75% of Tg(Gdnf);lu/lu tubule cross-sections had >5 LIN28A+ cells per tubule compared to 30% in lu/lu (Figure 1—figure supplement 1C, p<0.001). Only 8% of tubules lacked LIN28A-labeled cells compared to 30% in lu/lu testes (p<0.01). To determine whether the A1 to A4 differentiated spermatogonia population increased in Tg(Gdnf);lu/lu tubules, we immunostained for the marker SOHLH1, which is not expressed in PLZF+ As to Aal cells (Figure 1—figure supplement 1D). Similar to LIN28A, quantification of sectioned tubules revealed a significant increase in the percent of tubules with >5 SOHLH1+ cells (Figure 1—figure supplement 1E,F).
Using quantitative reverse transcriptase PCR (qRT-PCR), we compared mRNA levels of several known genes expressed in undifferentiated spermatogonia, using total RNA from 4 month-old lu/lu and Tg(Gdnf);lu/lu testes. Similar to our immunostaining results, we observed a significant increase in the undifferentiated spermatogonia markers Gfra1, Lin28a and Sohlh1 in Tg(Gdnf);lu/lu compared to lu/lu (Figure 1D). We also saw an increase in Ret, which encodes the GFRA1 co-receptor. Thus, temporal ectopic expression of GDNF significantly increases the numbers of tubules with both undifferentiated and differentiated spermatogonia, leading to a partial rescue of testis weight in lu/lu mice.
Unbiased discovery of genes whose expression is altered in Plzf mutants
Seminiferous tubules from Tg(Gdnf) mice have an expanded GFRA1+ population and enhanced ability to repopulate the spermatogonial lineage in testes transplants compared to WT (Sharma and Braun, 2018). Because Tg(Gdnf) and Tg(Gdnf);lu/lu testes have a comparable number of GFRA1+ spermatogonia (Figure 1E), we reasoned that these mice could be used as a valuable tool for the discovery of genes involved in self-renewal. Using RNAseq, we compared the transcriptomes of whole testes from Tg(Gdnf) and Tg(Gdnf);lu/lu mice and searched for genes with significant fold-changes in expression. Of 20,000 gene transcripts,~1500 were differentially expressed with an absolute log2 fold change >1.5 (FDR < 0.05). Of this subset, 150 were upregulated two-fold or more, and 60 were down-regulated two- to seven-fold in luxoid mutants.
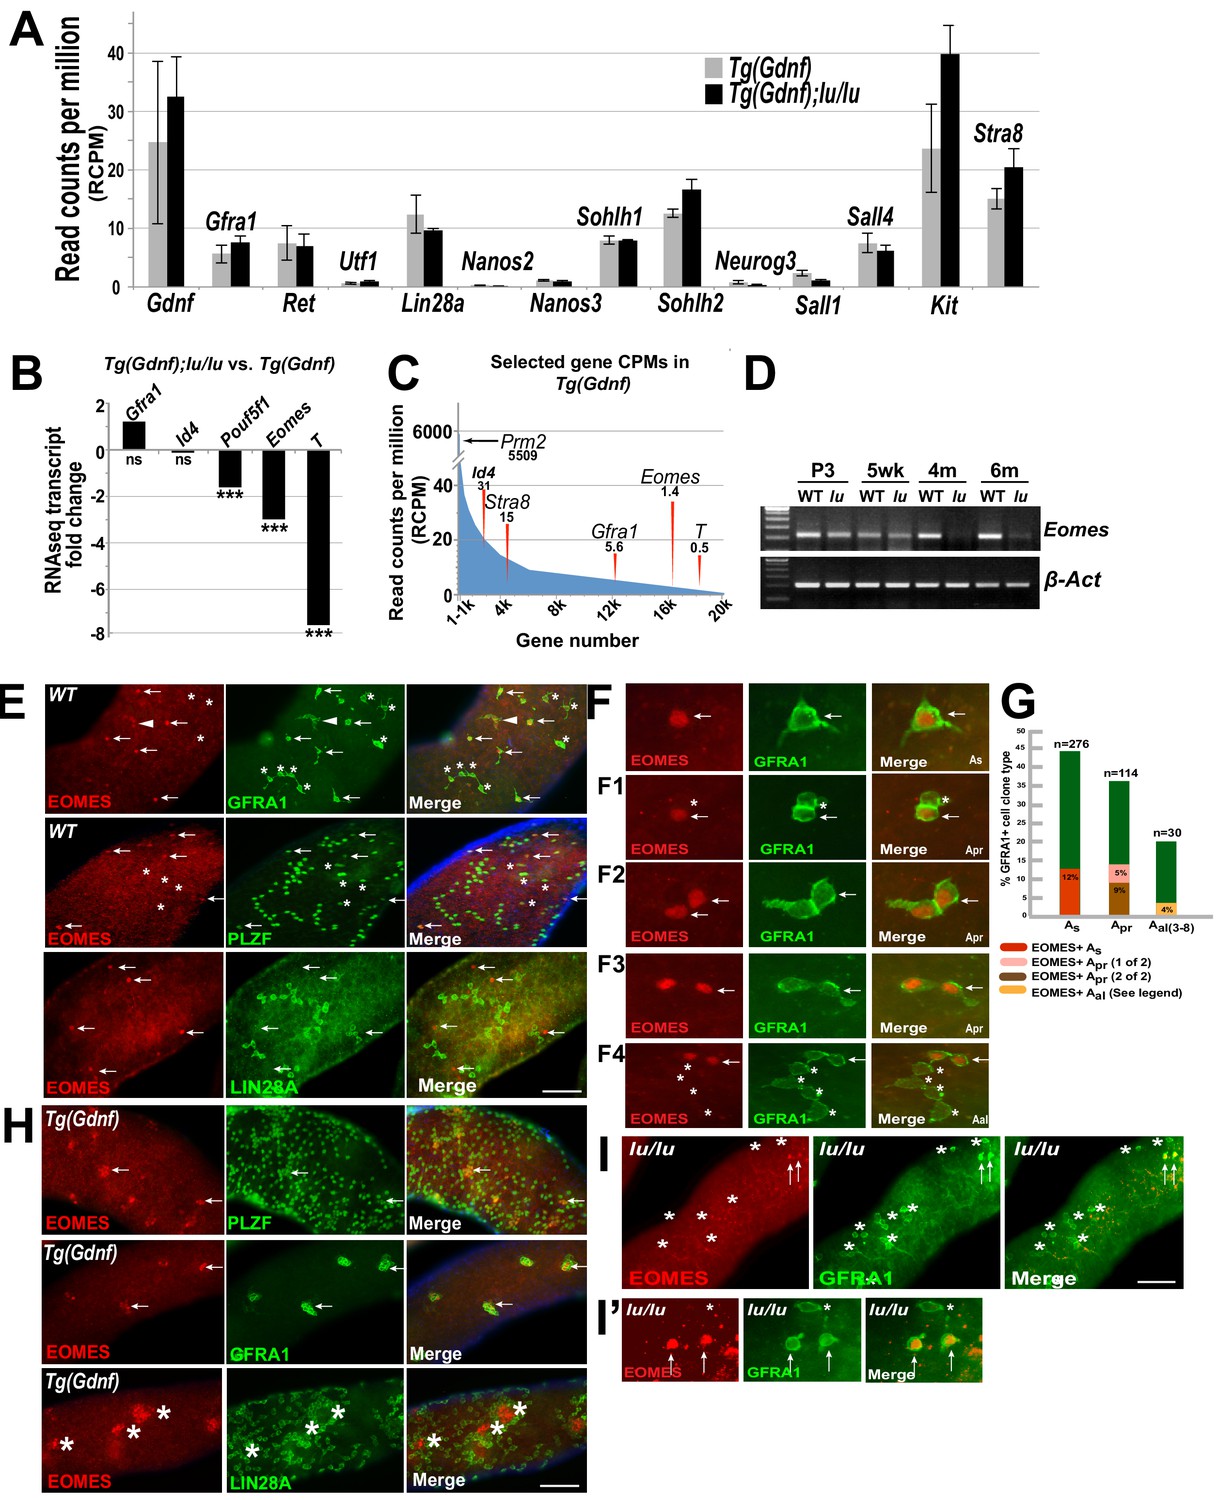
As expected, many previously known gene transcripts specific to undifferentiated spermatogonia had no significant change in expression between genotypes including: Gfra1, Ret, Lin28a, Utf1, Nanos2, Nanos3, Sohlh2, and Sall4 (Figure 2A), confirming that the undifferentiated spermatogonial populations were similar between the two genotypes. In the group of genes that were significantly down-regulated in Tg(Gdnf);lu/lu testes, we identified a number of genes that are involved in the maintenance of pluripotent stem cell fate or early embryonic development (Figure 2B) including: Pou5f1, Brachyury (T) and Eomes. Pou5f1, essential for maintaining pluripotency of ES cells and for maintaining viability of the mammalian germline (Nichols et al., 1998; Kehler et al., 2004), was down-regulated two-fold in luxoid testes overexpressing GDNF. Brachyury (T), down-regulated seven-fold in Tg(Gdnf);lu/lu testes, is a T-box transcription factor important for germ cell development that when overexpressed results in testicular germ-cell tumors (Sangoi et al., 2011; Tirabosco et al., 2008). Eomes, a T-box transcription factor that was down-regulated 3-fold in Tg(Gdnf);lu/lu testes, is known to play a critical role in embryonic development (Costello et al., 2011; Arnold et al., 2008). Notably, the read counts per million (RCPM) for the two highly down-regulated genes shown, Eomes and T, were very low in either genotype and found at the distant end of the expression spectrum amongst 20,000 transcripts (Figure 2C, far right). Eomes had a value of only 1.4 RCPM in Tg(Gdnf) testis RNA compared to 5,509 RCPM for Prm2, a gene expressed in spermatids. This suggests that Eomes and T are targets of PLZF and are down-regulated in lu/lu mice, or that T and EOMES are expressed in a small subset of germ cells that are specifically reduced in lu/lu mutants, possibly within a restricted population of As cells.
Figure 2
EOMES marks a subpopulation of SSCs.
(A) Relative gene expression (read counts per million, RCPM) of selected transcripts from RNAseq performed on testis RNA from 4 month old Tg(Gdnf) and Tg(Gdnf);lu/lu mice. No significant change is detected in known spermatogonial marker genes. (B) Fold change in RNAseq transcripts for a subset of pluripotency and developmental genes in Tg(Gdnf);lu/lu compared to Tg(Gdnf) testes. ***, p<0.0001. (C) Relatively low RCPM of the highest-fold change transcripts shown in (B), compared to the spermatid-expressed protamine two gene Prm2, and differentiating spermatogonia marker Stra8. X-axis represents 20,000 genes numbered in descending order by RCPM. (D) Semi-quantitative RT-PCR of total testis RNA showing decreasing Eomes expression over time in lu/lu testes. (E) Immunostaining for EOMES and undifferentiated spermatogonial markers in WT whole-mount testes. EOMES marks some (arrows), but not all (asterisks), GFRA1+ PLZF+ As cells. Weak EOMES staining can occasionally be detected in chains of GFRA1+ Aal cells (arrowhead). EOMES+ As cells do not express LIN28A (bottom row, arrows). (F) Examples of EOMES+ subset of GFRA1+ cells. F1 shows an example of two adjacent cells where one is EOMES+ (arrow) and one is EOMES- (asterisk). F2 and F2 illustrate two examples of two juxtaposed cells that are both EOMES+. F4 illustrates an example of a chain of 6 Aal cells with two EOMES+ (arrow) and four EOMES– (asterisks) cells. (G) Graph showing the percent of EOMES+ cell in the GFRA1+ population clone types in WT adult mice (631 GFRA1+ cells from three mice). n = number of clone types counted (e.g. Apr = 114 pairs of cells = 228 GFRA1+ total cells). Of the total GFRA1+ Apr population, in 9% of cases both cells were positive for EOMES, while 5% had only one cell positive for EOMES. Within the Aal fraction, 4% of the clones express EOMES in a heterogeneous pattern (two Aal chains where 3 of 3 were EOMES+; two Aal chains of 4 where all were EOMES+; one Aal chain of 4 where only one was EOMES+; one Aal chain of 6 where only 2 of 6 cells were EOMES+). (H) EOMES is expressed in tightly packed GFRA1+ PLZF+ clusters (arrows) found in Tg(Gdnf) whole-mount tubules. EOMES is not expressed in the LIN28A+ cells in the cortical region of the clusters (bottom row, asterisks). (I) Detection of EOMES+ GFRA1+ cells (arrows) in Plzf lu/u mutants. Asterisks mark an EOMES- GFRA1+ cell.
-
Figure 2—source data 1
Source file for Figure 2G.
- https://doi.org/10.7554/eLife.43352.007
We next validated candidate genes at different developmental time points by RT-PCR. Using total testis RNA from Tg(Gdnf) and Tg(Gdnf);lu/lu mice, Eomes was reduced in lu/lu testes as early as 3 days after birth, and became barely detectable at 4 and 6 months of age (Figure 2D). As mutations in Plzf lead to age-dependent germ cell loss, EOMES is a compelling candidate for a marker of a functional pool of SSCs that is uniquely depleted in luxoid mutants.
EOMES is detected in a subpopulation of GFRA1+ cells in the testis
Given the differential expression of Eomes in Tg(Gdnf) and Tg(Gdnf);Plzf lu/lu mutants, we assessed whether EOMES was expressed within the spermatogonial population of the testis. We immuno-stained whole mount WT seminiferous tubules for EOMES together with GFRA1, which marks As, Apr and small chains of Aal spermatogonia (Figure 2E,F, arrows). EOMES was expressed in 12% of the total GFRA1+ As population of cells (Figure 2G). Fourteen percent of GFRA1+ Apr clones were also EOMES+ in either one (5%) or both (9%) of the cells (Figures 2F1, F and F3, arrows, and G). The clones counted as Apr could be two lineage-independent, but adjacent, As cells, Apr cells about to complete cytokinesis to form two new As cells, or bona fide Apr cells that will go on to form a chain of Aal cells. In rare cases (4%) EOMES was detected in some or all of the individual cells of GFRA1+ chains of Aal cells (Figure 2F4, G and figure legend). In all instances, EOMES was co-expressed with PLZF (Figure 2E, arrows), which marks all undifferentiated spermatogonia. EOMES was not detected in LIN28A-expressing cells (Figure 2E), which we detect in a subset of As cells and in most Apr and Aal cells (Chakraborty et al., 2014).
Because the EOMES+ population also expressed GFRA1, we hypothesized that these cells might be under GDNF influence (Meng et al., 2000). We therefore asked whether Sertoli-specific overexpression of GDNF affected this cell population. In whole-mount Tg(Gdnf) tubules we detected EOMES+ cells in clusters of PLZF+ and GFRA1+ cells (Figure 2H, arrows). LIN28A stained only the peripheries of these cell clusters, and was specifically excluded from the EOMES+ cores (Figure 2H, bottom row, asterisks). These data indicate that EOMES primarily marks a subpopulation of cells that are GFRA1+, PLZF+ and LIN28A-.
To determine if EOMES-expressing cells are present in lu/lu testes, we immuno-stained lu/lu tubules for EOMES and GFRA1. Despite the significant decrease in Eomes RNA in whole testes, EOMES+ cells were detected in lu/lu mutants, (Figure 2I and I’, arrows), suggesting that PLZF regulates the pool of EOMES+ cells, but does not directly regulate EOMES expression.
EOMES+ cells contribute to steady-state spermatogenesis
One of the features of stem cells is their ability to maintain their population throughout adult life while giving rise to differentiating progeny. To study the stem cell properties of EOMES expressing cells, we generated an inducible iCreERt2/2A/tdTomato knock-in allele (Eomes iCreERt2) at the Eomes locus to label and trace their progeny after tamoxifen treatment (Figure 3A). Characterizing the mouse line for tdTOMATO expression, we observed single GFRA1+ tdTOMATO+ cells in whole mount seminiferous tubules from 4 week old males (Figure 3B top row arrows). EOMES immunofluorescence marked the same cells as tdTOMATO (Figure 3B’, top row), and as with EOMES itself, tdTOMATO was detected in a subpopulation of GFRA1+ cells (Figure 3B’ bottom row, arrow). In testis sections, GFRA1+ tdTOMATO+ cells were detected within the seminiferous tubules (Figure 3C - top) and along the basement membrane juxtaposed to peritubular myoid cells (Figure 3C – bottom, arrowheads).
Figure 3 with 1 supplement see all

EOMES+ cells are long-term SSCs.
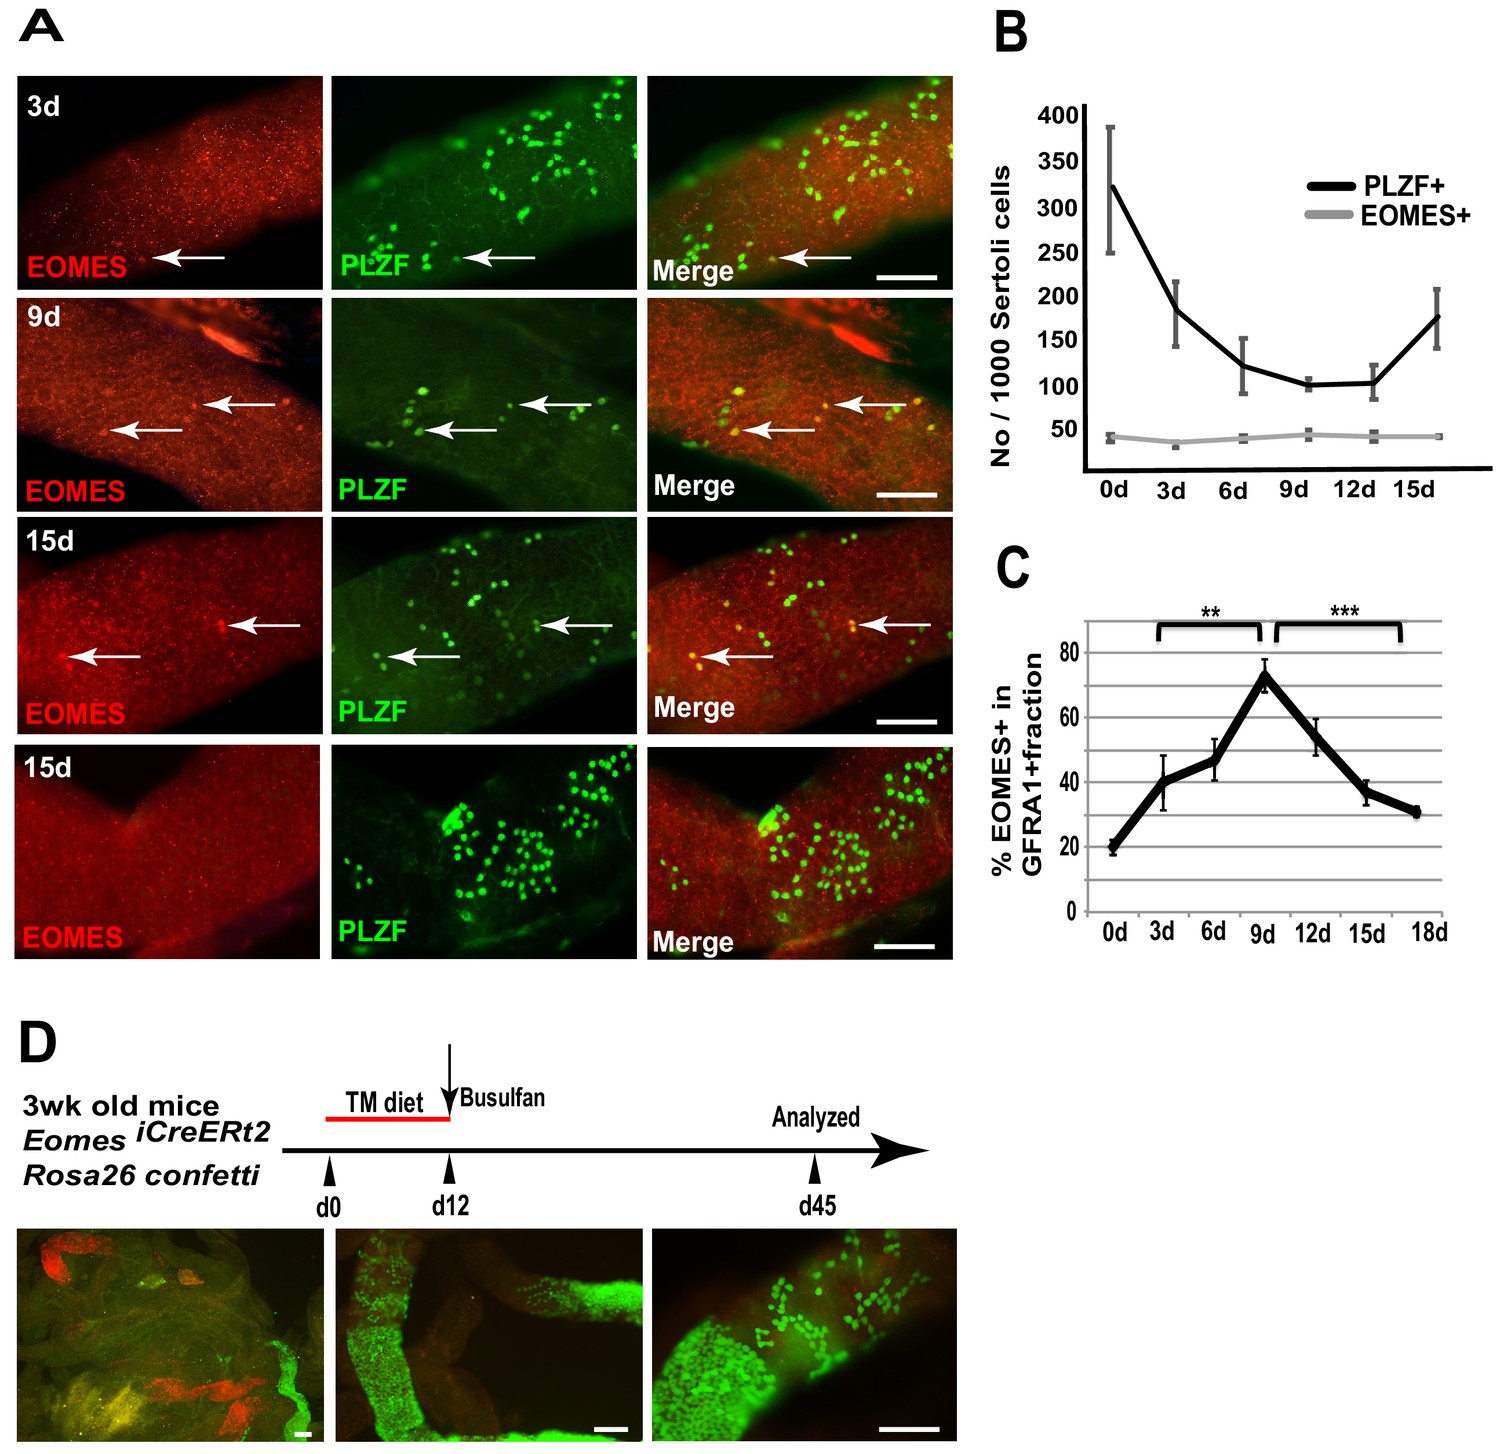
(A) Schematic diagram of the Eomes locus on chromosome nine and insertion cassette used to generate an Eomes/2AiCreERT2/2A/tdTomato knock-in allele. (B) GFRA1+ tdTomato+ As cell in testis of 4wk old mouse (arrow). GFRA1+ tdTOMATO As cell (asterick). (B’) tdTOMATO is co-expressed with EOMES (top row, arrow). tdTOMATO is expressed in GFRA1+ As cells but not in chains of GFRA1+ Aal cells (bottom row). (C) tdTOMATO cells (Red), positive for GFRA1 (Green), are present within the seminiferous tubules. Top - An optical section of confocal image showing the localization of EOMES+ cell along the basement membrane. Bottom – Magnified view of GFRA1+ EOMES tdTOMATO+ cells shown above. Arrowheads mark myoid cell (M) nucleus, which are negative for EOMES tdTOMATO. * Background fluorescence in the interstitial space associated with GFRA1 staining. (D) Experimental flow chart showing the induction times and clonal analysis of Eomes iCreERt2 targeted cells labeled in mice crossed to Rosa26 Confetti reporter and fed a tamoxifen-enriched diet. Fluorescence images of whole-mount seminiferous tubules showing the different size of labeled clones. Representative clones at 2 (n = 5, animals), 3 (n = 4), and 4wks (n = 3), and 4 (n = 3) and 7 (n = 3) months after tamoxifen induction. (E) Images of labeled sperm from the epididymis of mice 7 months after tamoxifen induced recombination. (F) Fluorescence positive offspring born to WT female mated with ROSA26confetti: Eomes-iCreERt2 4 months after tamoxifen-induced recombination at Confetti locus by Eomes-iCreERt2.
Next, we traced the progeny of Eomes iCreERt2 cells during normal steady-state spermatogenesis after tamoxifen-induced recombination using the Gt(ROSA) 26 Sortm1(CAG-Brainbow2.1)Cle/J (also referred to as R26R-confetti) reporter mice (Madisen et al., 2010). Mice were fed a tamoxifen-enriched diet for 2 weeks and clone sizes were determined by the number of cells expressing a single fluorescent protein after recombination at the R26R-confetti locus and detected by fluorescence imaging of whole mount seminiferous tubules (Figure 3D). One color clones indicate derivation from a single-labeled cell, or the overlap of clones expressing the same fluorescent marker. We observed confetti-marked single cells and chains of 4, 8 and 16 by two weeks (Figure 3D, top row). The size of labeled clones increased with time (Figure 3D, second and third row) and large labeled clones of differentiated germ cells were observed at 4 and 7 months after iCre activation (Figure 3D). Importantly, we observed single-labeled cells at all time points analyzed (Figure 3D, arrows), suggesting the single-labeled cells were either maintained for the entire duration or had undergone self-renewal and migrated away from their sister cells during the time the clones were traced. The labeled clones gave rise to labeled sperm detected in the epididymis of these mice (Figure 3E), and fluorescence-positive pups were born to Eomes-iCreERt2: R26R-confetti mice treated with tamoxifen when mated with WT C57BL6/J females (Figure 3F). Labeled clones, or offspring, were not observed in the absence of TAM at any time points (Figure 3—figure supplement 1). Together, these results demonstrate that EOMES-expressing cells contribute to long-term maintenance of Asingle spermatogonia and to full-lineage differentiation to spermatozoa in mice.
EOMES+ cells are resistant to busulfan treatment
To determine if EOMES+ cells are capable of regeneration after chemical insult, we specifically killed proliferating spermatogonia with busulfan and observed how EOMES+ and EOMES− cells survived the insult. We chose a low dose (10 mg/kg body weight) that preferentially kills proliferating Apr and Aal spermatogonia (Keulen and Rooij, 1973). Seminiferous tubules from treated mice were immunostained for EOMES and PLZF every 3 days between 3 and 15 days after busulfan injection (Figure 4A). During the entire 15 day time period the EOMES+ population remained unchanged (Figure 4B). In contrast, by 9 days after treatment, the PLZF+ population had halved, presumably due to loss of Apr and Aal cells. The population began to recover after 12 days (Figure 4B). We also stained for EOMES and GFRA1. At day 0,~20% of the total GFRA1-expressing cell population was EOMES+ (Figure 4C). Comparison within the GFRA1+ population showed a selective increase of the EOMES+ fraction after busulfan treatment (Figure 4C), suggesting that the EOMES− fraction was specifically lost.
Figure 4
EOMES+ cells are resistant to busulfan and contribute in regeneration.
(A) Whole-mount tubule immunostaining for EOMES and PLZF after low-dosage busulfan treatment (10 mg/mL). (B) Cell counts from (A) show that EOMES+ cell numbers remain constant while PLZF+ cell numbers drop after busulfan treatment. (n = 3 per time point, 8 weeks old) (C) The EOMES+ fraction of GFRA1+ cells increased following busulfan treatment. **, p<0.005; ***, p<0.0001. (D) Schedule to assay the regeneration properties of EOMES+ cells. Three-week old R26R-confetti: Eomes iCreERt2 mice were put on a tamoxifen-enriched diet for 1 week, treated with busulfan, and analyzed on day 45. Images of whole mount seminiferous tubules (n = 5 mice) show labeled clones at different developmental stages during regeneration.
-
Figure 4—source data 1
Source file for Figure 4B and 4C.
- https://doi.org/10.7554/eLife.43352.011
To assess if EOMES+ cells contribute to regeneration after chemical injury, 3wk old Rosa26confetti: Eomes-iCreERt2 mice were placed on a TM diet for 12 days to activate CreERt2, treated with a low dose of busulfan (10 mg/kg body weight) on day 12, and then analyzed for labeled clones on day 45 (Figure 4D). Whole mount seminiferous tubules showed labeled clones at varying stages of differentiation, supporting the conclusion that EOMES+ GFRA1+ PLZF+ spermatogonia are resistant to busulfan insult compared to their EOMES− counterparts, and that the EOMES+ population reconstitutes the lineage after chemical injury.
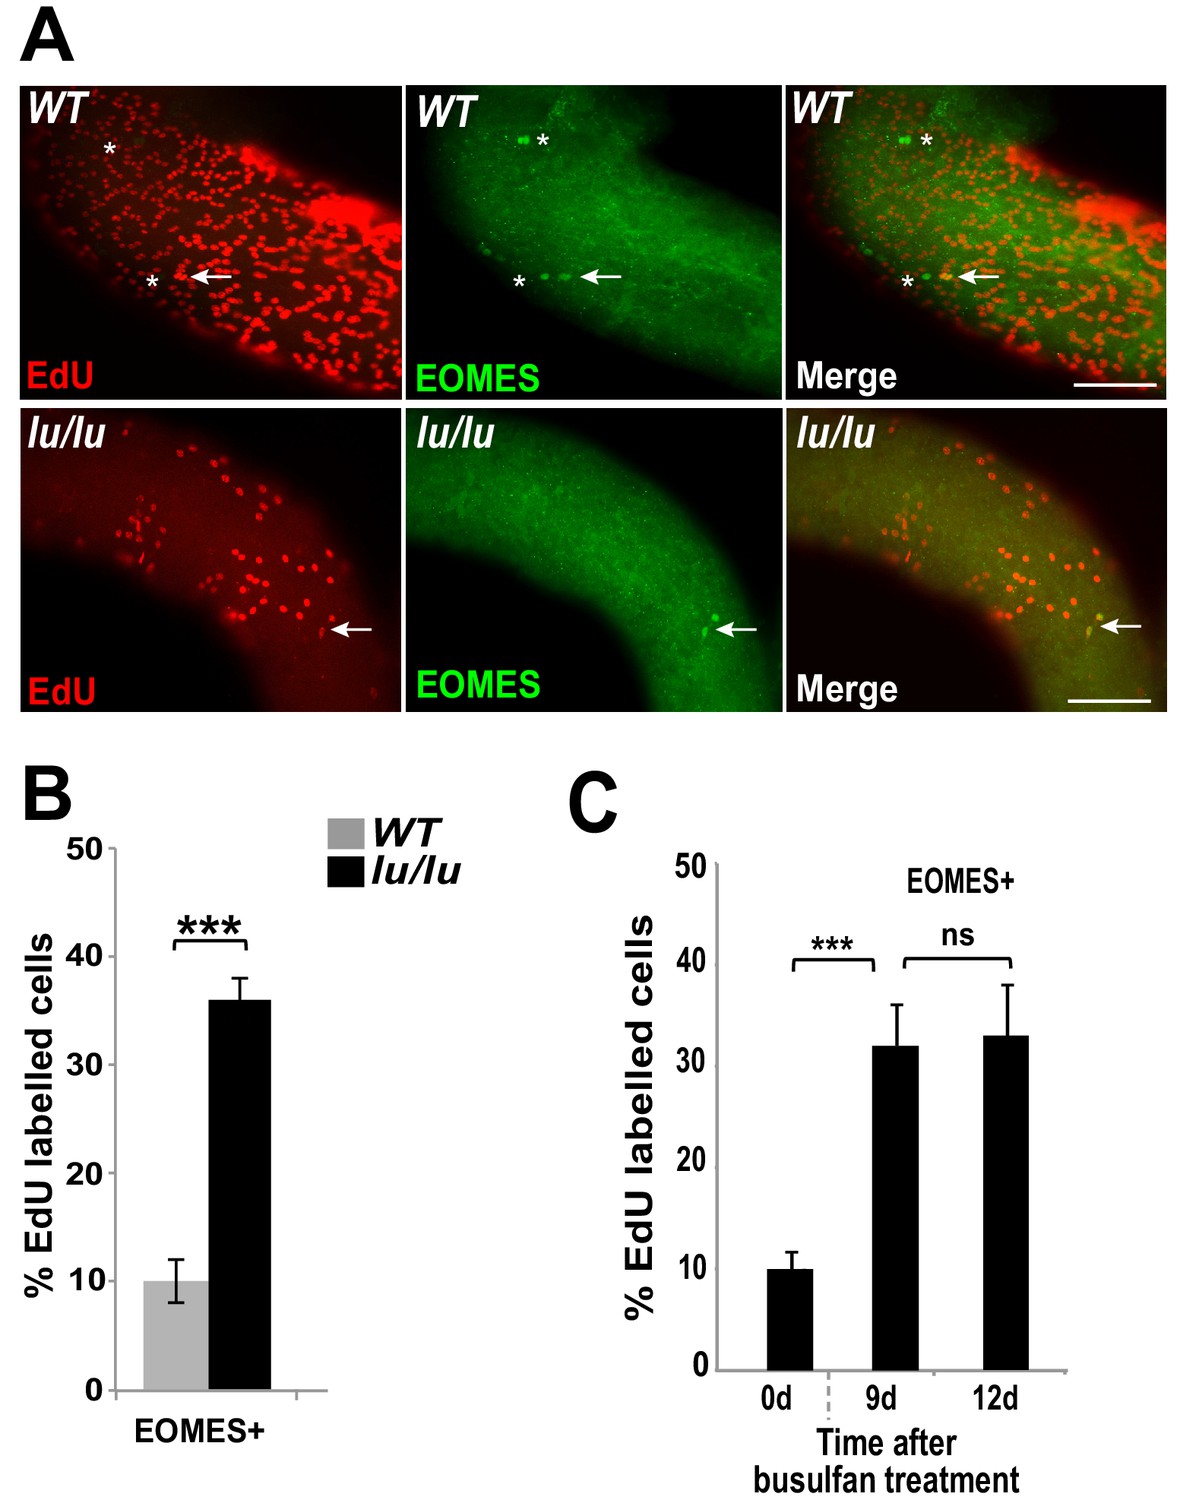
Loss of PLZF increases the proliferative rate of EOMES+ cells
We speculated that the progressive age-dependent loss of germ cells in the Plzf lu/lu mutants could be due to an alteration in SSC cycling rates resulting in SSC exhaustion. To test this hypothesis, we injected EdU into WT and luxoid mice, and quantified the incorporation rate of EdU in EOMES+ cells. Although fewer EOMES+ cells were present in lu/lu testes compared to WT, a greater fraction of the EOMES+ cells had incorporated EdU compared to WT (36% vs. 10%, Figure 5A and B). These results indicate that EOMES+ cells have a higher than normal proliferative index in the absence of PLZF, suggesting that PLZF directly, or indirectly, regulates the proliferation of EOMES+ cells.
Figure 5
Loss of PLZF increases the proliferative index of EOMES+ cells.
(A) Whole-mount seminiferous tubules from 8 week old WT and lu/lu mice injected with EdU and immunostained 24 hr after injection. EdU+ EOMES+ cells (arrows); EdU- EOMES+ cells (asterisks). (B) Quantification of the EdU labeling index in WT (n = 4 mice) and lu/lu (n = 5 mice) EOMES+ cells. EOMES+ cells have a higher labeling index in lu/lu than in WT (p=0.001). (C) Increase in proliferation rate of EOMES+ cells during the recovery phase after busulfan treatment. EdU incorporation was assayed 24 hr post EdU injection (n = 3 mice per timepoint; ***p=0.001).
-
Figure 5—source data 1
Source file for Figure 5B and 5C.
- https://doi.org/10.7554/eLife.43352.013
To determine if the fraction of cycling EOMES+ cells changes during regeneration, mice were injected with EdU at 9 or 12 days post busulfan injection and assayed by immunofluorescence in whole mount seminiferous tubules. At both time points the EdU labeling index was increased in EOMES+ cells (Figure 5C) suggesting that busulfan is either directly inducing proliferation, or the cells are proliferating in response to a decrease in SSC density or a shortage of differentiating cells (Rooij et al., 1985).
Single cell RNA sequencing of EOMES tdTOMATO+ cells
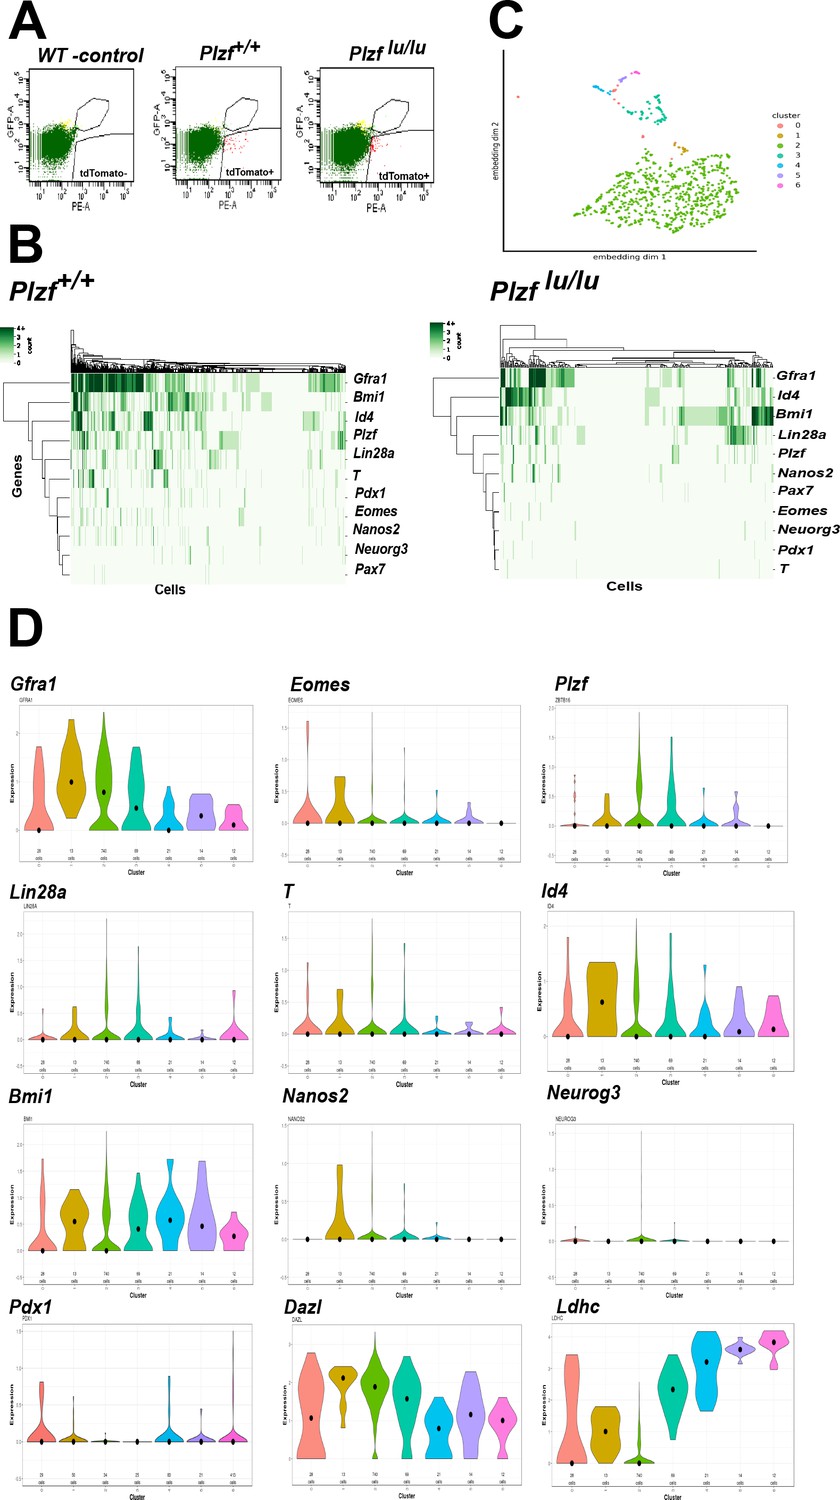
The expression or function of a growing collection of genes have been linked to either SSC self-renewal or progenitor cell expansion (Table 1). To address if these SSC identity genes are expressed in EOMES+ cells, we performed single cell RNA sequencing (scRNAseq) on 897 fluorescently activated cell sorted (FACS) EOMES tdTOMATO+ cells from 4wk old Eomes-iCreERt2-tdTomato; Plzf +/+ and 352 EOMES tdTOMATO+ cells from Eomes-iCreERt2-tdTomato; Plzf lu/lu mice (Figure 6A). The mean number of expressed genes per cell in Plzf +/+ and Plzf lu/lu was 3104 and 3230, while the mean number of transcripts with unique molecular identifiers was 7254 and 8134, respectively (Figure 6—figure supplement 1).
Figure 6 with 1 supplement see all
Single cell RNA sequencing of EOMES tdTOMATO cells.
(A) FACscan profile of EOMES tdTOMATO+ cells sorted from Plzf +/+ and Plzf lu/lu mutant testis. The boxed region in the upper right indicated cells with background autofluorescence that were excluded from the analysis. (B) Heat map and dendogram of SSC identity and progenitor genes expressed in EOMES tdTOMATO cells from Plzf +/+ and Plzf lu/lu mutant testis. (C) Clusters generated from WT cells. Cellular expression profiles of 110 genes were embedded into a 2dimensional latent space using UMAP (see supplemental information for details). Cells in cluster 0 could not be confidently placed in any of the other six clusters. (D) Violin plots showing the mean expression of each SSC identity gene per cluster in cells sorted from Plzf +/+ testes.
Table 1
Key identity genes expressed in SSCs or progenitor cells.
https://doi.org/10.7554/eLife.43352.016| Gene | Expression | Method | Functional Assay | References |
|---|---|---|---|---|
| Gfra1 | As, Apr, Aal(4-8) | Gfra1-CreERT2 | Lineage tracing Transplant | (Hara et al., 2014) |
| Bmi1 | As | Bmi1CreERT | Lineage tracing | (Komai et al., 2014) |
| Id4 | As | Id4-eGFP | Lineage tracing Transplant | (Oatley et al., 2011; Sun et al., 2015) |
| Plzf | As, Apr, Aal(4-16) | Antibody staining | Lineage tracing Transplant | (La et al., 2018; Buaas et al., 2004) |
| Lin28a | As, Apr, and Aal(4-16) | Antibody staining | Transplant | (Chakraborty et al., 2014) |
| T | As | T(nEGFP-CreERT2) | Lineage tracing | (Tokue et al., 2017) |
| Eomes | As, Apr | Eomes-iCre ERt2 tdTomato | Lineage tracing | This manuscript |
| Nanos2 | As, Apr | Antibody staining | Lineage tracing Knockout | (Sada et al., 2009) |
| Neurog3 | Aal(4-16) | Ngn3 CreERT | Lineage tracing Transplant | (Nakagawa et al., 2010) |
| Pax7 | As | Pax7-CreERT2 | Lineage tracing | (Aloisio et al., 2014) |
| Pdx1 | As, Apr | Antibody staining | Lineage tracing | (La et al., 2018) |
An expression heat-map of the identity genes indicates that the majority of the cells express Gfra1, Bmi1, Id4 and Plzf, while fewer cells express T, Eomes, Pdx1, Nanos2, Neuorg3 and Pax7 (Figure 6B). The most striking finding is the considerable degree of heterogeneity in expression across the entire scRNAseq data set. None of the cells expressed all of the genes, while 90% (807/897) of cells expressed at least one of the genes and 73% (655/897) expressed two or more of the genes. Gfra1 was detected in 566/897 cells (63%), while PAX7 was detected in only 10/897 cells (1.11%). Neurog3 (Yoshida et al., 2004), which is expressed in early progenitor cells, was detected at relatively low levels in 27/897 cells (3.01%), suggesting that Neurog3 is expressed in some SSCs, or that the sorted cells include early progenitor cells due to a longer half-life of tdTOMATO compared to EOMES itself. Eomes transcripts were detected in 85/897 (9.48%) EOMES tdTOMATO+ cells. The low number of cells could be due to the inherent low expression of Eomes relative to other expressed genes, early progenitor cells that are tdTOMATO positive but are no longer expressing Eomes transcript, or the cell cycle stage in which the cells were collected. Together, the heterogeneity in transcript detection in the scRNAseq data mirrors previously reported heterogeneity in protein expression as detected by immunofluorescence (Suzuki et al., 2009).
To determine the relationship between the cells expressing the identity genes, cluster analysis was performed on the 100 most differentially expressed genes, plus 10/11 identity genes, from Plzf +/+ sorted cells. Pax7 was excluded from the analysis because its normalized mean expression was too low to be meaningful. The bulk of the cells clustered together (cluster 2) as a group of 740 cells (Figure 6C). The remaining cells were defined by a separate group of 5 different smaller clusters. Cells assigned to cluster 0 could not be confidently assigned to any cluster. The expression of Dazl, a marker of germ cells (Cooke et al., 1996), at moderate to high levels in all clusters, confirms that each cluster represents germ cells (Figure 6C). The expression of Ldhc, which is highly restricted to germ cells and whose protein is first detected in early pachytene spermatocytes (Goldberg et al., 2010), is expressed at highest levels in clusters 3–5, which are represented by a few cells, suggesting that Ldhc mRNA is expressed at low levels in SSCs or early progenitor cells. Although Gfra1 was detected in all clusters, its highest mean expression was in cluster 1, as was Id4 and Bmi1 (Figure 6D). Although cluster 1 contained only 13 cells, Eomes, T, Pdx1, and Nanos2 were expressed in a higher proportion of cells (e.g. 23–38% in cluster 1 compared to 9–15% in cluster 2) than in any other cluster. Nonetheless, the presence of multiple clusters expressing different identity genes suggests that EOMES tdTOMATO+ sorted cells represent a collection of cells with different transcriptional profiles and supports the conclusion that SSCs are transcriptionally heterogeneous.
To determine the impact of loss of Plzf on the expression of the identity genes, we computed the change in expression of each gene across all cells in Plzf +/+ and Plzf lu/lu mice. In Plzf lu/lu mice, the log2-fold change in expression of the identity genes Bmi1, Id4, Pax7, Nanos2 and Neurog3 were unchanged compared to Plzf +/+ mice, while the expression of Gfra1, Eomes, T, and Pdx1 were significantly decreased (Figure 6B and Table 2). In Plzf lu/lu mutants, the fraction of cells expressing Gfra1 was reduced from 63.10% in Plzf +/+ cells to 38.07% in Plzf lu/lu mutants. Eomes and T were only expressed in (1.14%) of Plzf lu/lu mutant cells, compared to 9.48% and 14.94%, in Plzf +/+ cells, respectively, suggesting that mutation of Plzf differentially affects a subpopulation of SSCs expressing Gfra1, T, Pdx1, and Eomes.
Table 2
Differential expression of SSC identity transcripts in Plzf +/+ and Plzf lu/lu mutant cells.
https://doi.org/10.7554/eLife.43352.017| Gene | Log2 FC | P value |
|---|---|---|
| Gfra1 | -0.779 | 1.31E-12 |
| Eomes | -0.766 | 1.41E-09 |
| Plzf | -1.27 | 4.09E-21 |
| Id4 | -0.046 | 0.73 |
| Bmi1 | -0.021 | 0.8 |
| Pax7 | 0.09 | 0.278 |
| T | -1.45 | 2.11E-19 |
| Lin28a | 0.046 | 0.71 |
| Nanos2 | 0.039 | 0.67 |
| Neurog3 | -0.177 | 0.08 |
| Pdx1 | -0.738 | 6.11E-09 |
Given that ID4-EGFP has previously been reported to be restricted to a subpopulation of As cells (Helsel et al., 2017), that it has been proposed to mark the ultimate pool of SSCs (Helsel et al., 2017), and that we did not detect significant changes in Id4 transcript in EOMES tdTOMATO+ sorted cells in Plzf lu/lu mutants, we investigated the expression of ID4 by immunofluorescence. Using a rabbit polyclonal antibody, which detects a protein of the correct molecular weight by western blotting in extracts prepared from WT testes but not in extracts from Id4-/- testes (Figure 7A), we detected ID4 in PLZF+ As, Apr, and Aal cells (Figure 7C). Because this staining pattern differed from that previously reported for an Id4-EGFP transgene, we performed double-staining for ID4 and LIN28A. We again found that we could detect ID4 in chains of Aal cells that were also positive for LIN28A (Figure 7D). ID4 immunostaining was not detected in seminiferous tubules of Id4 -/- mutants (Figure 7E) (Yun et al., 2004). We assayed for co-expression of tdTOMATO and ID4 and found that 40% of the tdTOMATO+ As cells were also positive for ID4 (Figure 7F, upper row). We again detected ID4 in chains of Aal cells (Figure 7F, bottom row), none of which were positive for tdTOMATO. In aggregate, we determined that only 20% of ID4+ cells were positive for tdTOMATO. To determine if Id4 was required for expression of EOMES, we performed immunofluorescence on testis from Id4-/- mutants. EOMES was detected in GFRA1+ cells (Figure 7G), consistent with the detection of Eomes RNA by rtPCR in Id4-/- mutants (Figure 7B). We conclude that ID4 is expressed in a subpopulation of EOMES+ cells, but the majority (80%) of the ID4+ population is EOMES-.
Figure 7
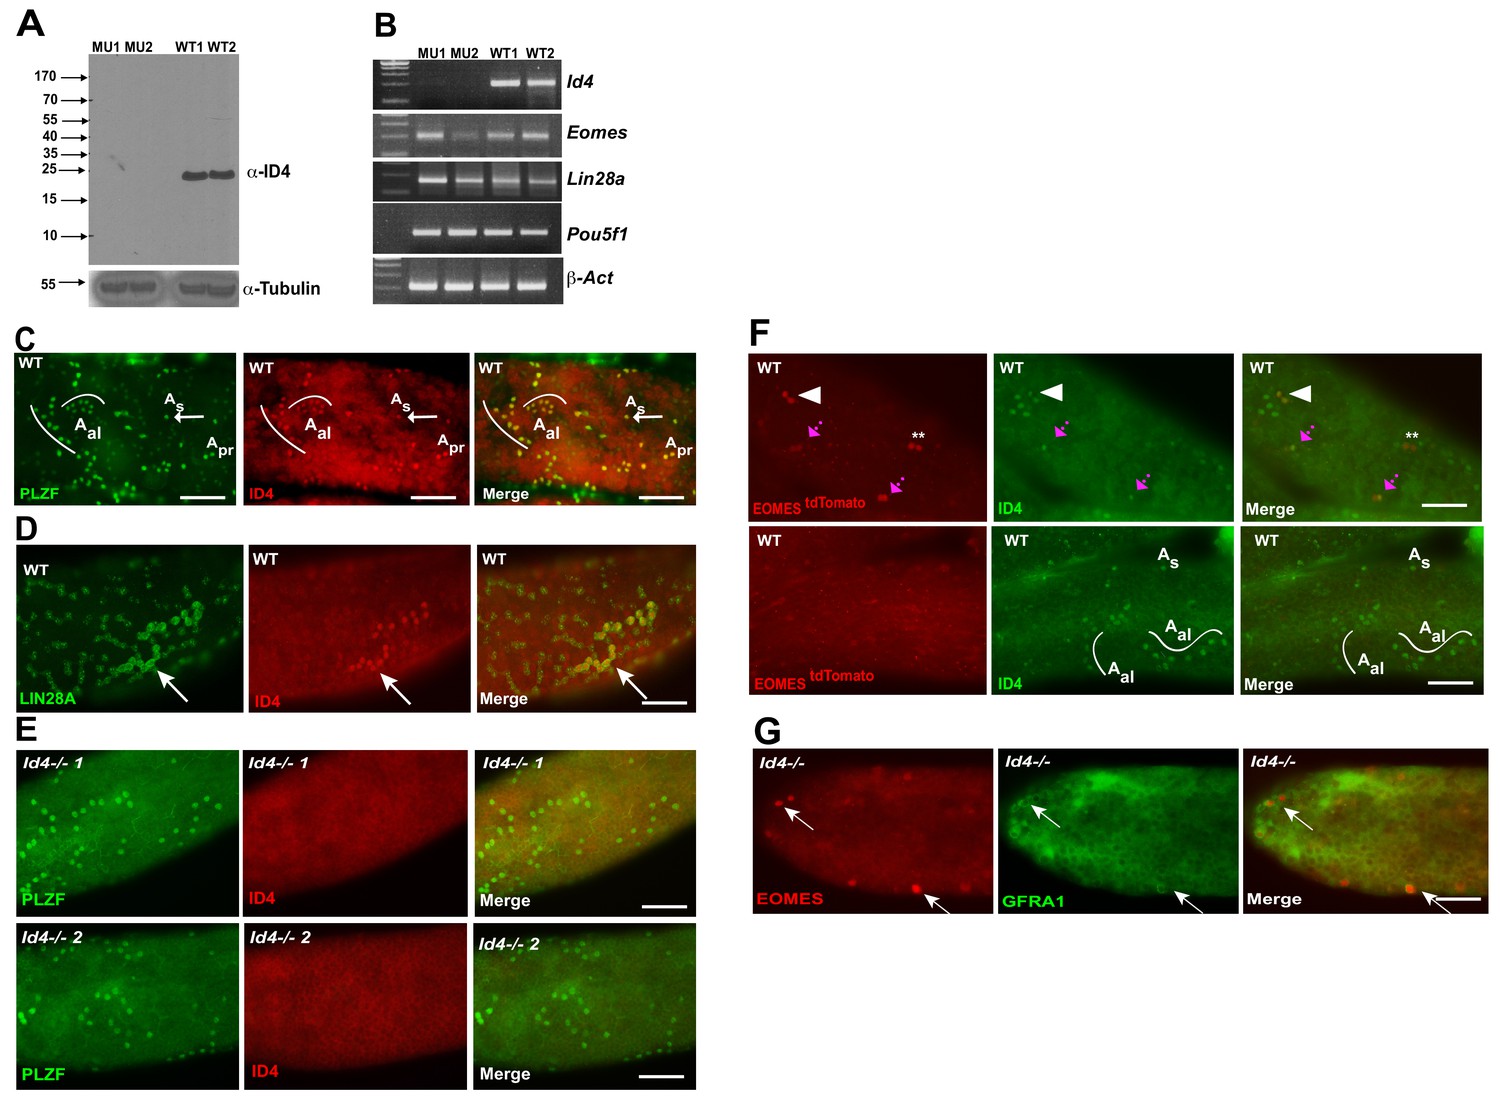
ID4 is expressed in As, Apr and Aal spermatogonia.
(A) Western blot of total testis protein lysate from 2 WT and 2 Id4-/- mutant mice probed with ID4 antibody. For loading control, western blot was probed with α-tubulin antibody. (B) RT-PCR using total RNA from two Id4-/- mutant and 2 WT mice for Eomes, Lin28a, Pou5f1 and β-actin. (C) Detection of PLZF and ID4 by immunofluorescence in whole mount seminiferous tubules. Both ID4 in PLZF+ were detected in As (arrow), Apr, and Aal spermatogonia in WT adult mouse testis. (D) ID4 protein was co-localized in chains of LIN28A+ Aal spermatogonia (arrow). (E) ID4+ cells are not detected in whole mount tubules from prepared from Id4-/- mutant mice. (F) Top row, examples of tdTOMATO/ID4 double-positive cells (arrowhead), tdTOMATO+ ID4- (**), and two adjacent cells where one is tdTOMATO+ and the other is tdTOMATO/ID4 double-positive (magenta arrow). Bottom row, examples of tdTOMATO- ID4+ As and Aal chains of 4 and 8 cells. (G) EOMES+ GFRA1+ cells are present in Id4-/- mutants (arrow).
Discussion
Exploiting a transgenic overexpression model for GDNF in Plzf +/+ and Plzf lu/lu mice, we discovered a rare population of As EOMES-expressing spermatogonia. Lineage tracing studies during steady state spermatogenesis and during regeneration demonstrated that EOMES+ cells are SSCs. The significant loss of Eomes-expressing cells between Plzf +/+ and Plzf lu/lu suggest that EOMES marks a subpopulation of GFRA1+ cells that are uniquely depleted in Plzf lu/lu mice. EOMES+ cells cycle more frequently in Plzf lu/lu mice, suggesting that PLZF regulates their proliferative activity.
In addition to expression in As cells, EOMES was occasionally detected in one of two adjacent GFRA1+ cells. The clones, which we counted as Apr, could have also been two lineage-independent, but adjacent, As cells. Alternatively, the two cells could be daughter cells, suggesting that EOMES expression can be asymmetrically inherited. Interestingly, in rare cases EOMES was expressed heterogeneously in a chain of GFRA1+ Aal cells, again suggesting that the fate of cells with clones of Aal is not uniform and supporting the possibility that cells within chains are subject to reversion to SSCs following fragmentation (Nakagawa et al., 2010).
Single cell sequencing of EOMEStdTOMATO+ cells revealed extensive heterogeneity of expression of a collection of SSC identity genes (Figure 6). Immunostaining of several of the markers confirmed that SSCs are heterogeneous yet hierarchical, with markers such as EOMES preferentially expressed in more primitive As cells and LIN28A expressed in differentiating As, Apr and Aal cells (Figure 2H). Similar conclusions from both protein and RNA expression studies have been reported by others (Suzuki et al., 2009; La et al., 2018).
Overexpression of GDNF led to clusters of tightly packed nests of undifferentiated spermatogonia. Cells in the center of the nests tended to be EOMES+ LIN28 A- while cells at the periphery were EOMES- LIN28A+. We speculate that the significance of the geometry of the nests could be a consequence of increased paracrine signaling, perhaps driven by intercellular coupling of GDNF with its co-receptor GFRA1/RET, or the physiological state in the center of the nests, that favors SSC self-renewal.
Relation of EOMES cells to other SSC markers
Single-cell RNA sequencing of EOMES tdTOMATO+ cells from Plzf lu/lu mutants suggests that EOMES-expressing cells constitute a unique population of As cells. In recent studies, other GFRA1+ As subpopulations have also been identified. A recent report supports our data that a subset of As spermatogonia are marked by EOMES, T, PDX1 and LHX1, and transplantation studies have shown that PDX1-expressing cells are SSCs (La et al., 2018). A Bmi1 CreERT allele has also been shown to mark SSCs (Komai et al., 2014). We detected Bmi1 transcript in EOMES tdTOMATO+ cells, and long-term labeling of SSCs has been observed in Bmi1 lineage tracing experiments, however, the mean expression of Bmi1 was similar between Plzf +/+ and Plzf lu/lu cells, suggesting that Bmi1 expression is not restricted to EOMES+ cells. Pax7 lineage-marked cells are capable of repopulating germ cell-free testes in transplants and are resistant to busulfan insult. (Aloisio et al., 2014). However, Pax7 transcript was detected in only 10/897 EOMES tdTOMATO+ cells, and its mean expression too low to be included in our cluster analysis.
An Id4-gfp allele also marks a subset of As spermatogonia (Chan et al., 2014; Oatley et al., 2011; Sablitzky et al., 1998; Sun et al., 2015) and recent studies have shown that transplantable SSC activity resides in the ID4-GFP-bright population (Helsel et al., 2017). Because ~40% of EOMES+ cells are ID4+, and Id4 transcripts were co-expressed in 49 of the 85 Eomes+ cells, it is likely that there is substantial overlap in the population of cells marked by EOMES, ID4-GFP-bright, and T (47% of cells that expressed Eomes also expressed T) (Tokue et al., 2017). In fact, previous studies have shown that there is a 4.15 log2 fold (p=0.00005) enrichment of Eomes transcript in the ID4-GFP-bright population (source file Database S1 in Helsel et al., 2017), suggesting a strong overlap in EOMES-expressing cells and the ID4 bright population. However, our data suggest that the Id4-gfp transgene may not reflect the full expression pattern of the ID4 protein itself. Although we detected ID4 in ~40% of the EOMES+ cells, the majority of the ID4+ cells (80%) were EOMES- and included Apr and Aal cells. Differences in half-lives of the ID4 and EGFP proteins, or differences in translational control elements in their respective mRNAs, may be responsible for the discordance in their expression. Others have also recently reported that expression of Id4IRES-Gfp is not restricted to As cells and that approximately 45% of ID4-IRES-GFP+ cells are EOMES- and PDX1- spermatogonia, confirming that ID4 expression is not restricted to As cells (La et al., 2018).
At face value our results are inconsistent with the fragmentation model for SSC self-renewal (Nakagawa et al., 2010; Hara et al., 2014). However, it is possible that the Ngn3 and GFRa1 lineage tracing studies preferentially labeled the equivalent of our EOMES- GFRA1+ SSCs, and that EOMES- As, Apr and Aal cells can de-differentiate to EOMES+ As SSCs following fragmentation and transplantation. Interestingly, PDX1-expressing cells are lost upon busulfan ablation but then regained during regeneration (La et al., 2018).
Function of PLZF
To date, it is unclear how PLZF mechanistically regulates SSC self-renewal, as it is expressed in the entire undifferentiated spermatogonia population. Our data demonstrate that PLZF regulates the cycling status of EOMES+ cells, and suggests that the failure of luxoid mutant germ cells to successfully colonize after transplantation is a consequence of their severely depleted population of EOMES+ As cells and the altered proliferative index of the entire population of GFRA1+ cells. This paradigm could extend to the regulation of germline stem cells in humans, as PLZF is expressed in human SSCs (Hermann et al., 2010). Several studies have provided in vitro evidence for a role of PLZF in cell cycle regulation. PLZF associates with CDC2 kinase activity in vitro (Ball et al., 1999) and when overexpressed in myeloid progenitors, PLZF decreases proliferation by reducing entry into S-phase (Doulatov et al., 2009). Furthermore, PLZF suppresses growth of 32Dcl3 cells in vitro by repressing transcription of the cyclin A2 gene and other cyclin-dependent complexes involved in the G1/S transition (Shaknovich et al., 1998; Yeyati et al., 1999). Our studies show that PLZF is critical for maintaining SSCs in a low proliferative state and suggest that it regulates the cycling status of SSCs. Analogous to the hematopoietic system, which contains both slow-cycling long-term (LT)-HSCs, and rapid-cycling short-term HSCs, (Cheshier et al., 1999; Morrison and Weissman, 1994; Spangrude et al., 1988), and where over-cycling of LT-HSCs can lead to stem cell exhaustion and consequent loss of differentiated cell types (Arai and Suda, 2007), we propose that loss of PLZF results in proliferative exhaustion of SSCs.
Materials and methods
Key resources table
| Reagent type (species) or resource | Designation | Source or reference | Identifiers | Additional information |
|---|---|---|---|---|
| Strain, strain background (Mus musculus) | B6/N | The Jackson Laboratory | JR # 05304 | |
| Strain, strain background (Mus musculus) | B6.129P2-Gt(ROSA) 26 Sortm1(CAG-Brainbow2.1)Cle/J | The Jackson Laboratory | JR# 017492 | |
| Strain, strain background (Mus musculus) | Zbtb16lu/J (Plzf lu) | The Jackson Laboratory | JR#000100 | |
| Strain, strain background (Mus musculus) | B6(Cg)-Tyr c-2J/J | The Jackson Laboratory | JR# 000058 | |
| Strain, strain background (Mus musculus) | B6.Cg-Gt(ROSA)26Sor tm6(CAG-ZsGreen)Hze/J | The Jackson Laboratory | JR# 007906 | |
| Strain, strain background (Mus musculus) | Tg(Ctsl-Gdnf) B6.C3H.F1 | Sharma & Braun 2018 | PMCID: 29440301 | |
| Strain, strain background (Mus musculus) | Id4 -/- | Received from Mathew Havrda and Mark Israel; Dartmouth Medical School | PMCID: 15469968 | |
| Cell line (M. musculus) | B6N-JM8 ES | The Jackson Laboratory | RRID:CVCL_J957 | |
| Antibody | Mouse mono-clonal anti-PLZF | Santa Cruz Biotech Inc, Santa Cruz, CA | Cat# sc-28319 | Dilution – 1:250 |
| Antibody | Goat poly-clonal anti-GFRA1 | R and D systems, Minneapolis, MN | Cat# AF560 | Dilution – 1:500 |
| Antibody | Rat poly-clonal anti-LIN28A | Gift from Dr. Eric G. Moss, Rowan University, School of Osteopathic Medicine, One Medical Center Drive, Stratford, NJ 08084 | Dilution – 1:500 | |
| Antibody | Rabbit poly-clonal anti-EOMES | Abcam, Cambridge, MA | Cat# ab23345 | Dilution – 1:500 |
| Antibody | Rabbit polyclonal anti-SOHLH1 | Abcam, Cambridge MA | Cat# ab49272 | Dilution – 1:400 |
| Antibody | Rabbit mono-clonal anti-ID4 | BioCheck Inc, Foster City, CA | Cat # BCH-9/ # 82–12 | Dilution – 1:500 |
| Chemical compound, drug | Tamoxifen diet | https://www.envigo.com/products-services/teklad/laboratory-animal-diets/ | TD. 130859 | |
| Chemical compound, drug | EdU | Invitrogen, https://www.thermofisher.com/us/en/home/brands/invitrogen.html | Cat# A10044 | |
| Chemical compound, drug | Busulfan | Sigma-Aldrich, St. Louis, MO | Cat# B2635 | |
| Commercial assay or kit | Click-IT EdU assay kit | Invitrogenhttps://www.thermofisher.com/us/en/home/brands/invitrogen.html | Cat # A20185 | |
| Commercial assay or kit | RNA isolation PureLink RNA Mini kit | Ambion https://www.thermofisher.com/us/en/home/brands/invitrogen/ambion.html | Cat# 12183018A | |
| Commercial assay or kit | Arcturus PicoPure RNA kit | Applied Biosystems https://www.thermofisher.com/us/en/home/brands/applied-biosystems.html | Cat # 12204–01 | |
| Commercial assay or kit | TruSeq RNA Sample Prep Kit v2 | Illuminahttps://www.illumina.com/ | ||
| Commercial assay or kit | Nextera Xt DNA sample kit | Illumina https://www.illumina.com/ | ||
| Sequence-based reagent | Forward primers for RT-PCR of Eomes | 5’- ctggttctgttctttgcacaggcgcatg-3’ | ||
| Sequence-based reagent | Reverse primers for RT-PCR of Eomes | 5’- atcagccacaccagacacagagatc-3’ | ||
| Sequence-based reagent | Forward primers for RT-PCR B-actin | 5’- ccagttcgccatggatgacgatat-3' | ||
| Sequence-based reagent | Reverse primers for RT-PCR B-actin | 5’- gtcaggatacctctctgctctga-3' | ||
| Software, algorithm | TopHat v 2.0.7 | Kim et al., 2013 | PMCID:PMC4053844 | |
| Software, algorithm | EdgeR v2.6.10 | Robinson et al., 2010 | PMCID:PMC2796818 | |
| Software, algorithm | BamTools v 1.0.2 | Barnett et al., 2011 | PMCID:PMC3106182 | |
| Software, algorithm | Cell View | Bolisetty et al., 2017 | http://doi.org/10.1101/123810 |
Animals
All animals were housed in a barrier facility at The Jackson Laboratory. All experimental procedures were approved by the Jackson Laboratory Institution Animal Care and Use Committee (ACUC) and were in accordance with accepted institutional and government policies.
Generation of tamoxifen inducible iCre ERt2-tdTomato knock-in into the Eomes locus
Request a detailed protocolThe BAC clone RP23-235G22 was used to clone the 2A:CreERt2-FRT-PGK-Neor-FRT cassette into exon 2 of mouse Eomes gene. Linearized vector was electroporated into B6N-JM8 ES cells from B6N mouse strain. Chimera were generated using B6(Cg)-Tyr c-2J/J the albino mice. The chimeras were crossed to B6N parental strain to generated F1 progeny. The reporter mice used to assay for Cre recombination were B6.129P2-Gt(ROSA) 26 Sortm1(CAG-Brainbow2.1)Cle/J. For activation of iCre the mice were fed TD.130859 (TAM diet). The food was formulated for 400 mg tamoxifen citrate per kg diet that would provide ~40 mg tamoxifen per kg body weight per day.
Testes weight and histology
Request a detailed protocolMice were genotyped with specific primer sets and assessed for body weight and testes weight at each time point analyzed. For histological analysis, testes were fixed overnight in Bouin’s and paraffin-embedded sections were stained with PAS after dewaxing.
Whole mount immunostaining
View detailed protocolSeminiferous tubules were dispersed in PBS by removing the tunica from the testes. They were rinsed with PBS and fixed in 4% paraformaldehyde (Electron Microscopy Sciences, Fort Washington, PA) for 4–6 hr at 4°C. For PLZF, LIN28A, and SOHLH1 antibodies, the tubules were permeabilized with 0.25% NP-40 in PBS-T (0.05% Tween in PBS) for 25 min at RT before blocking in 5% normal goat serum. The tubules were then incubated with primary antibodies and incubated overnight (GFRA1 and EOMES) at RT or 4°C for PLZF, LIN28, and SOHLH1. The next day the tubules were washed three times with PBS-Tween20 for 5 min, and incubated with secondary antibodies conjugated to Alexa Fluors (Molecular Probes) for 1 hr at room temperature. After washing in PBS-Tween20, the tubules were mounted in VectaShield with DAPI (Vector Laboratories, Burlingame, CA) and imaged using a Nikon Eclipse E600 epifluorescence microscope equipped with an EXi Aqua Camera from Q-Imaging (Surrey, BC, Canada).
Proliferation assay
Request a detailed protocolTo assay the proliferative index of spermatogonial stem cells, mice were injected intra-peritoneally with 50 mg/kg body weight of EdU. EdU staining was performed using the Click-iT EdU imaging Kit (Invitrogen, Carlsbad, CA) according to manufacturer’s protocol. Briefly, seminiferous tubules were dissected 24 hr after EdU injection and first probed with an EOMES antibody before staining for EdU. Tubules were incubated with Click-iT reaction cocktail containing buffer, CuSO4, Alex Fluor 594 Azide, and reaction additive buffer for 30 min at room temperature. Tubules were then washed in PBS-Tween20 buffer for more than 2 hr and then mounted in Vectashield mounting media (Vector Laboratories Inc, Burlingame, CA) with DAPI and imaged on a Nikon Eclipse E600 epifluorescence microscope equipped with an EXi Aqua Camera from Q-Imaging (Surrey, BC, Canada).
Quantitative Real Time (qRT)-PCR
Request a detailed protocolTotal RNA was prepared from testes using the PureLink Kit (Ambion). qRT-PCR was performed using SYBR Green Master Mix with gene-specific primer sets in a One-step RT-PCR reaction (Applied Biosystems) on an equal amount of total RNA from testes of each genotype and analyzed using ABI 7500 system sequence detection software (Applied Biosystems, Carlsbad, California). Arcturus PicoPure RNA kit from Applied Biosystems (Waltham, MA) was used to isolated RNA from the FACsorted cells.
mRNA sequencing and analysis
Request a detailed protocolAn equal amount (4 µg) of total RNA from testes of 4 month-old mice was used for sequencing using the TruSeq RNA Sample Prep Kit v2. The libraries were amplified by 15 PCR cycles and quantitated using a Kapa Biosystems Quantification Kit (https://www.kapabiosystems.com/). The quality of each library was assessed on a Bioanalyzer Agilent DNA 1000 Chip. The libraries were then normalized to 2 nM and then pooled into one sample. The pooled samples were loaded onto 3 lanes of a V3 Flow Cell and then sequenced on the Illumina HiSeq 2000 (100 bp paired-end run). RNAseq data for all samples were subjected to quality-control check by NGSQCtoolkit v 2 (Patel and Jain, 2012), and samples with base qualities ≥ 30 over 70 nucleotides (100 bp reads) were used in the analysis. Orphaned reads after the quality-control step were used as single-ended reads in the downstream analysis. Read mapping was carried out using TopHat v 2.0.7 (56) with supplied annotations at parameters (--read-mismatches 2, --read-gap-length three and --read-edit-dist 3) against the mouse genome (build-mm9). Bamtools v 1.0.2 (57) was used to calculate the mapping statistics. HTSeq-count script was used at default parameters (http://www-huber.embl.de/users/anders/HTSeq/doc/count.html) to count the reads mapped to known genes for both orphaned and paired-end reads, and final counts were merged prior to differential expression analysis. Expression differences between Tg(Gdnf) and Tg(Gdnf);lu/lu mice were determined by using edgeR v 2.6.10 (Robinson et al., 2010) (exactTest function was used to determine the differences in expression). Genes with FDR ≤ 0.05 and Absolute log2 fold change ≥ 1 were considered differentially expressed.
Regeneration of SSCs after busulfan treatment
Request a detailed protocolA single dose of 10 mg/kg body weight of busulfan was injected intraperitoneally in WT C57BL/6J adult mice. Three mice were analyzed at each time point. Their testes were processed for whole-mount immunofluorescence. For a percentage of GFRA1 population, 300–500 cells were counts for each mouse. The EOMES+ and PLZF+ cells were counted over equal length of seminferous tubules, for each mouse. The data are presented as the number of cells ± SE per 1,000 Sertoli cells.
Flow cytometry and single cell sequencing
Request a detailed protocolSingle cell suspensions from Plzf +/+ and Plzf lu/lu testes carrying the Eomes-tdTomato knockin allele were prepared using a two-step collagenase and trypsin enzymatic digestion procedure. Cells were filtered first with an 40 um nylon membrane followed by a 25 um filter. DNase I was added to the cell suspension to prevent clumping. Cells were washed once in PBS and finally suspended at a concentration of 1−2 × 10⁶ cells/ml, analyzed and sorted on Becton Dickinson FACSVantage cell sorter. Cells from littermate mice that were negative for Eomes-tdTomato were used to gate the positive staining cell population and DAPI was used to gate out the dead cells. Single cells were flow sorted into individual wells of a Bio-Rad hard shell 384 well plate. The plate was immediately transferred and stored in a −80C freezer. Custom designed Drop-Seq barcodes (see below) from Integrated DNA Technologies (IDT) were delivered into each well of each 384 well plate. All primers in one well shared the same unique cell barcode and billions of different unique molecular identifiers (UMIs). An Echo 525 liquid handler was used to dispense 1 ul of primers and reaction reagents into each well in the plate for the cell lysis and cDNA synthesis. Following cDNA synthesis, the contents of each well were collected and pooled into one tube using a Caliper SciClone Liquid Handler. After treatment with exonuclease I to remove unextended primers, the cDNA was PCR amplified for 13 cycles. The cDNA was fragmented and amplified for sequencing with the Nextera XT DNA sample prep kit (Illumina) using custom primers (see below) that enabled the specific amplification of only the 3′ ends. The libraries were purified, quantified, and sequenced on an Illumina NextSeq 500.
Barcode oligo primer: 5’-AAGCAGTGGTATCAACGCAGAGTACJJJJJJJJJJJJNNNNNNNNTTTTTTTTTTTTTTTTTTTTTTTTTTTTTTVN-3’
Custom primer sequence: 5’-AATGATACGGCGACCACCGAGATCTACACGCCTGTCCGCGGAAGCAGTGGTATCAACGCAGAGT*A*C-3’
Custom read 1 sequence: 5’-CGGAAGCAGTGGTATCAACGCAGAGTAC-3’
Single cell sequencing analysis
Request a detailed protocolCells derived from the mutant and control samples were clustered separately. Genes with fewer than two counts in fewer than 2 cells were removed from the digital expression matrix and the expression was normalized by relative library size (computed as total counts per cell divided by median counts per cell) and log transformed. 100 genes with the largest variance/mean ratio and 11 genes used for cell type verification (Gfra1, Eomes, Id4, T, Lin28a, Plzf, Bmi1, Pax7, Pdx1, Nanos2 and Nanos3) were used to subset the expression matrix for dimensionality reduction and clustering. Cellular expression profiles at these 110 genes were embedded into a 2-dimensional latent space using UMAP (McInnes L and Healy J. Uniform manifold approximation and projection for dimension reduction. ArXiv e-prints 2018, version 0.2.1), and clusters of cells were identified using hierarchical density-based spatial clustering (HDBSCAN, Campello Ricardo JGB et al., Hierarchical density estimates for data clustering, visualization, and outlier detection. ACM transactions on Knowledge Discovery from Data (TKDD) 2015; McInnes L, Healy J, and Astels S. Hierarchical density based clustering. Journal of open Sourse Software (JOSS) 2017, version 0.8.12). Cells assigned to cluster 0 are those which could not be confidently assigned to any cluster. Differentially expressed genes (DEGs) were identified using edgeR. Mutant and wildtype cells were treated as biological replicates for their respective condition. We find that edgeR offers a balance between type I and type II error rates when applied to single cell RNA-seq data relative to available scRNA-seq DEG analysis tools (Dal Molin et al., 2017).
Data availability
Single cell RNA sequencing data have been deposited in GEO under accession code GSE116001. Total testis RNA sequencing data have been deposited in SRA under accession code PRJNA475219. All data generated or analyzed during this study are included in the manuscript and supporting files. Source data files have been provided for Figures 1, 2, 4, 5 and Figure 1-figure supplement 1.
-
NCBI Gene Expression OmnibusID GSE116001. Identification of EOMES-expressing spermatogonial stem cells and their regulation by PLZF.
-
Sequence Read ArchiveID PRJNA475219. Identification of EOMES-expressing spermatogonial stem cells and their regulation by PLZF.
References
-
PAX7 expression defines germline stem cells in the adult testisJournal of Clinical Investigation 124:3929–3944.https://doi.org/10.1172/JCI75943
-
Maintenance of quiescent hematopoietic stem cells in the osteoblastic nicheAnnals of the New York Academy of Sciences 1106:41–53.https://doi.org/10.1196/annals.1392.005
-
Mouse differentiating spermatogonia can generate germinal stem cells in vivoNature Cell Biology 11:190–196.https://doi.org/10.1038/ncb1826
-
Plzf is required in adult male germ cells for stem cell self-renewalNature Genetics 36:647–652.https://doi.org/10.1038/ng1366
-
GDNF family receptor alpha1 phenotype of spermatogonial stem cells in immature mouse testesBiology of Reproduction 73:1011–1016.https://doi.org/10.1095/biolreprod.105.043810
-
High-resolution light microscopic characterization of mouse spermatogoniaBiology of Reproduction 65:1170–1178.https://doi.org/10.1095/biolreprod65.4.1170
-
A murine homologue of the human DAZ gene is autosomal and expressed only in male and female gonadsHuman Molecular Genetics 5:513–516.https://doi.org/10.1093/hmg/5.4.513
-
Essential role of plzf in maintenance of spermatogonial stem cellsNature Genetics 36:653–659.https://doi.org/10.1038/ng1367
-
PLZF is a regulator of homeostatic and cytokine-induced myeloid developmentGenes & Development 23:2076–2087.https://doi.org/10.1101/gad.1788109
-
LDHC: the ultimate testis-specific geneJournal of Andrology 31:86–94.https://doi.org/10.2164/jandrol.109.008367
-
Oct4 is required for primordial germ cell survivalEMBO Reports 5:1078–1083.https://doi.org/10.1038/sj.embor.7400279
-
Bmi1 expression in long-term germ stem cellsScientific Reports 4:6175.https://doi.org/10.1038/srep06175
-
A new concept of spermatogonial stem-cell renewal in the mouse and its relationship to genetic effectsMutation Research/Fundamental and Molecular Mechanisms of Mutagenesis 11:1–7.https://doi.org/10.1016/0027-5107(71)90027-3
-
Spermatogonial stem-cell renewal in the mouseThe Anatomical Record 169:515–531.https://doi.org/10.1002/ar.1091690305
-
Stage- and subcellular-specific expression of id proteins in male germ and sertoli cells implicates distinctive regulatory roles for id proteins during meiosis, spermatogenesis, and sertoli cell functionCell Growth & Differentiation : The Molecular Biology Journal of the American Association for Cancer Research 9:1015–1024.
-
The promyelocytic leukemia zinc finger protein affects myeloid cell growth, differentiation, and apoptosisMolecular and Cellular Biology 18:5533–5545.https://doi.org/10.1128/MCB.18.9.5533
-
Id4 marks spermatogonial stem cells in the mouse testisScientific Reports 5:17594.https://doi.org/10.1038/srep17594
-
Brachyury expression in extra-axial skeletal and soft tissue chordomas: a marker that distinguishes chordoma from mixed tumor/myoepithelioma/parachordoma in soft tissueThe American Journal of Surgical Pathology 32:572–580.https://doi.org/10.1097/PAS.0b013e31815b693a
-
Neurogenin3 delineates the earliest stages of spermatogenesis in the mouse testisDevelopmental Biology 269:447–458.https://doi.org/10.1016/j.ydbio.2004.01.036
Article and author information
Author details
Funding
Eunice Kennedy Shriver National Institute of Child Health and Human Development (HD042454)
- Robert E Braun
National Cancer Institute (CA34196)
- Robert E Braun
The funders had no role in study design, data collection and interpretation, or the decision to submit the work for publication.
Acknowledgements
We are extremely grateful to M Havrda and M Israel for providing us with Id4-/- mice, to D Krawchuk for her help in manuscript preparation and to The Single Cell Biology Lab at The Jackson Lab for Genomic Medicine.
Ethics
Animal experimentation: All experimental procedures were approved by the Jackson Laboratory Institution Animal Care and Use Committee (ACUC) (protocol 07007) and were in accordance with accepted institutional and government policies.
Copyright
© 2019, Sharma et al.
This article is distributed under the terms of the Creative Commons Attribution License, which permits unrestricted use and redistribution provided that the original author and source are credited.
Metrics
-
- 2,353
- views
-
- 417
- downloads
-
- 60
- citations
Views, downloads and citations are aggregated across all versions of this paper published by eLife.
Citations by DOI
-
- 60
- citations for umbrella DOI https://doi.org/10.7554/eLife.43352
Download links
A two-part list of links to download the article, or parts of the article, in various formats.
Downloads (link to download the article as PDF)
Open citations (links to open the citations from this article in various online reference manager services)
Cite this article (links to download the citations from this article in formats compatible with various reference manager tools)
Identification of EOMES-expressing spermatogonial stem cells and their regulation by PLZF
eLife 8:e43352.
https://doi.org/10.7554/eLife.43352


