PARIS, an optogenetic method for functionally mapping gap junctions
- Peking University School of Life Sciences, China
- PKU-IDG/McGovern Institute for Brain Research, China
- Peking-Tsinghua Center for Life Sciences, China
- Chinese Institute for Brain Research, China
Figures
Figure 1 with 4 supplements
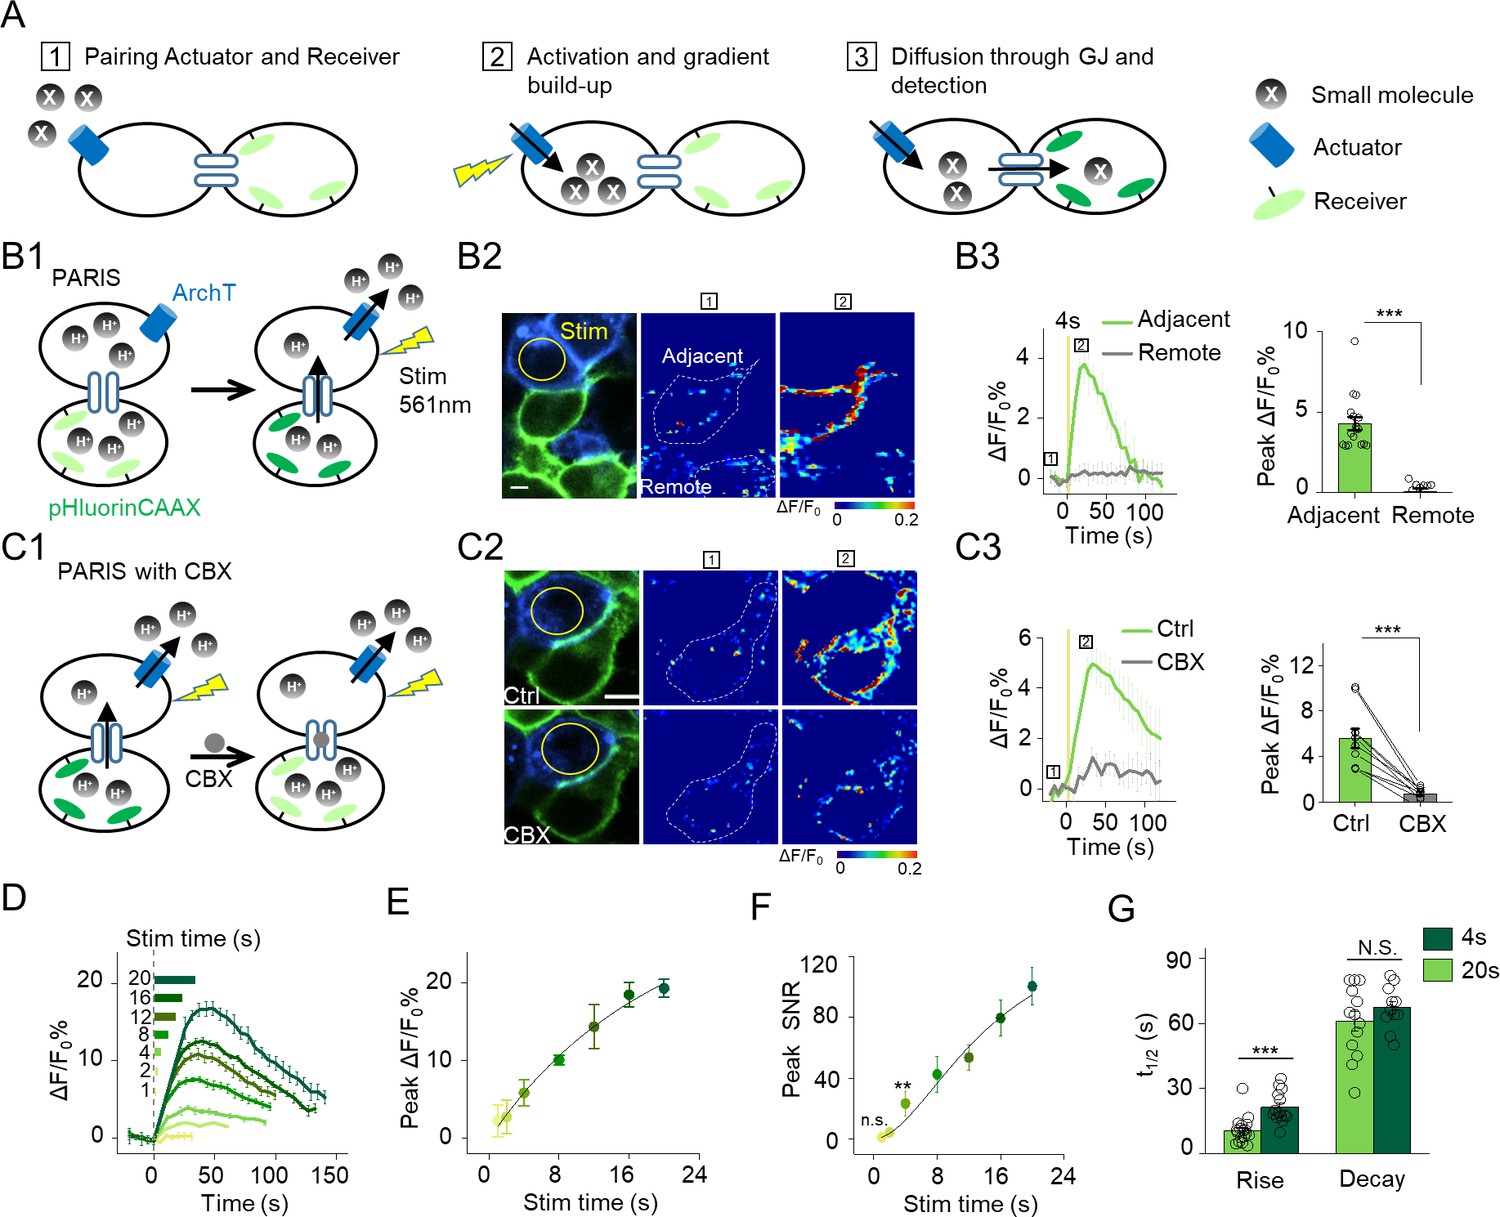
The principle behind PARIS and proof-of-concept in cultured cells by PARIS based on ArchT and pHluorin.
(A) Schematic diagram depicting the principle and process of PARIS. (B1–B3) Demonstration of PARIS using in HEK293T cells. (B1) Schematic depicting the principle of ArchT/pHluorin pair based PARIS. (B2) Representative images showing expression of the actuator ArchT-BFP (blue) and the receiver pHluorinCAAX (green) in transfected HEK293T cells neighboring to each other. The pseudocolor images showing the basal fluorescence and 4 s ArchT activation induced pHluorin response in the adjacent cell/remote cell. The boxed ‘1’ and ‘2’ above the images (or traces in B3) identify stages before photostimulation and in the peak response. (B3) Representative traces and group analysis of ΔF/F0 in the cells adjacent and remote to the actuator cells (n = 10–17 cells). The stimulus (561 nm light, 0.5 mW) is indicated by the yellow circle in the image and the yellow vertical line in the traces. (C1–C3) Similar to (B), except PARIS signals were recorded before and after CBX treatment (100 μM, 10 min, n = 10 cells). (D) Representative traces of ΔF/F0 using increasing stimulation time (laser power, 0.5 mW). (E–F) Grouped peak ΔF/F0 and peak signal-to-noise ratio (SNR) of PARIS signals recorded with increasing stimulation time (n = 5–12 cells for each data point); the data were fit to a single Hill function (solid lines). (G) Summary of the half-rise and half-decay times of the PARIS signals measured with 4 s or 20 s stimulation (n = 14–18 cells). The scale bars represent 10 μm. *p<0.05, **p<0.01, ***p<0.001, N.S., not significant (p>0.05). In this and subsequent figures, error bars in the representative traces indicate the s.e.m. from three repeat experiments.
Figure 1—figure supplement 1
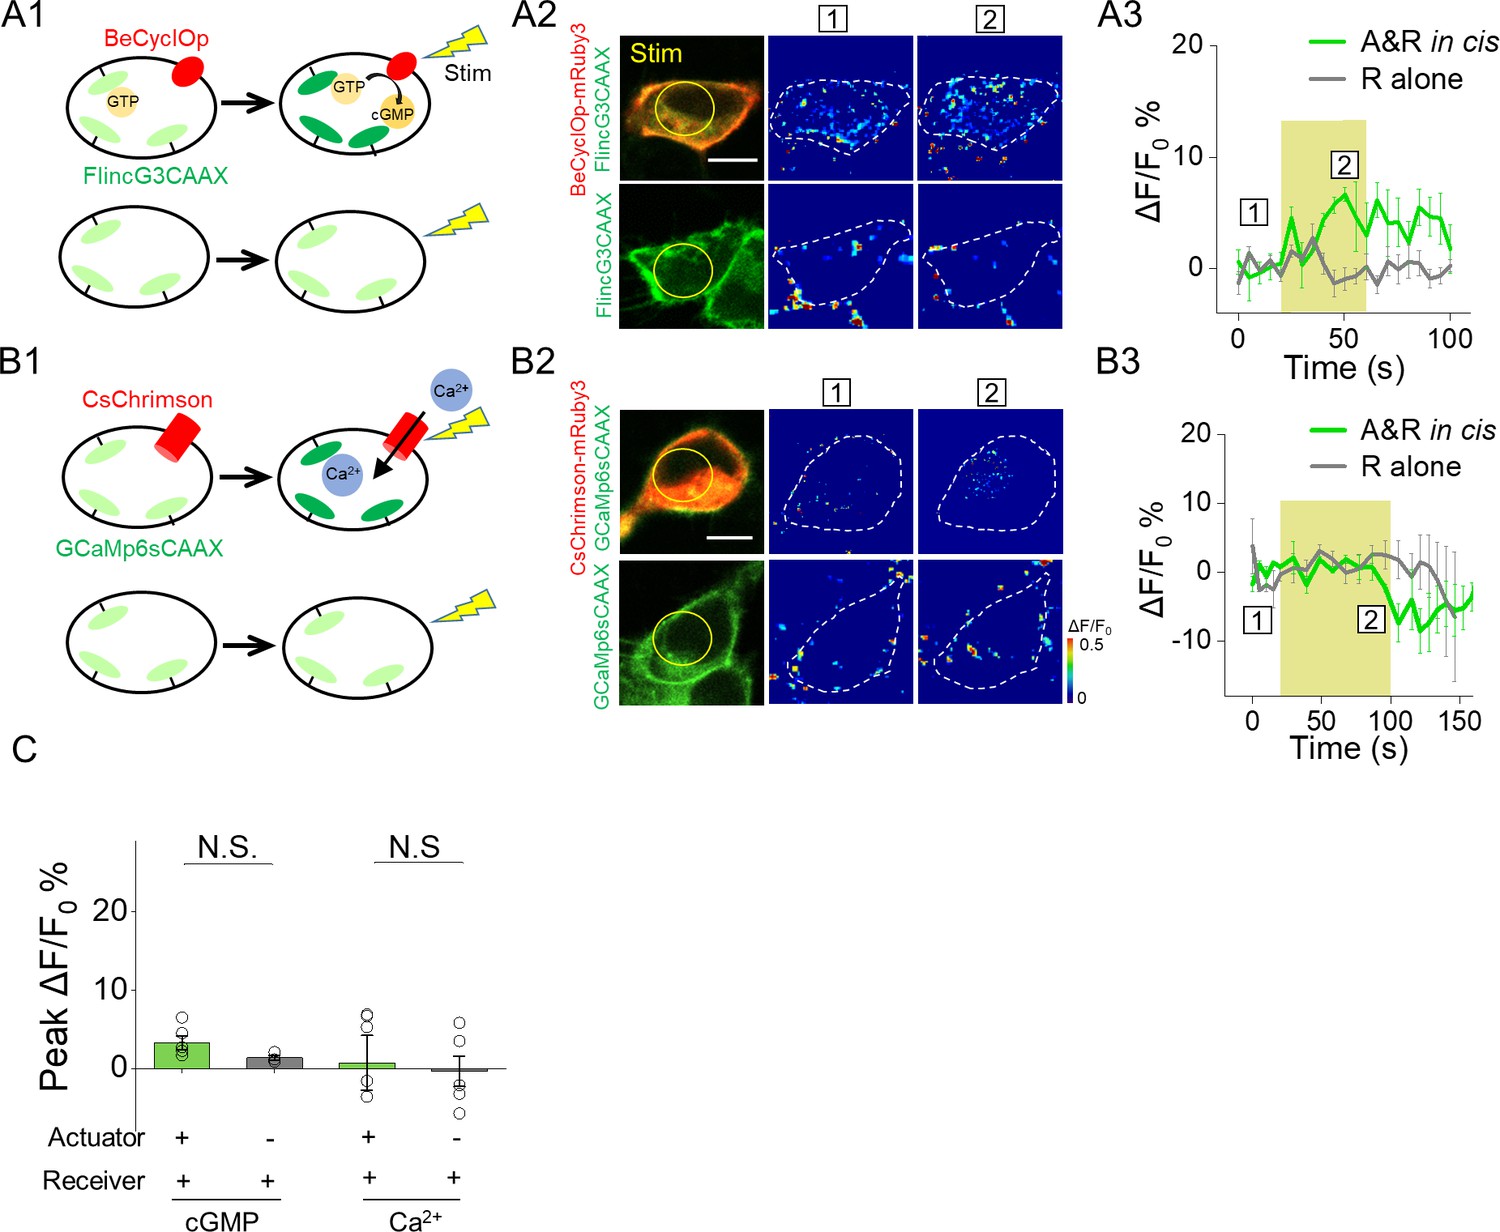
Poor performance of actuators and receivers based on detecting cGMP and Ca2+.
(A1–A3) Activation of a GMP photocyclase BeCyclOp induced no detectable fluorescence change in a cGMP sensor FlincG3 in 293 T cells co-expressing cGMP based actuator and receiver (561 nm, 0.5 mW, 40 s). (B1–B3) Similar to (A) but used an actuator and a receiver based on Ca2+ (561 nm, 0.5 mW, 80 s). (C) Group analysis of peak ΔF/F0 % from actuator/receiver pairs based on cGMP, Ca2+ respectively (n = 3–11 cells per group). The scale bars represent 10 μm. NS., not significant (p>0.05).
Figure 1—figure supplement 2
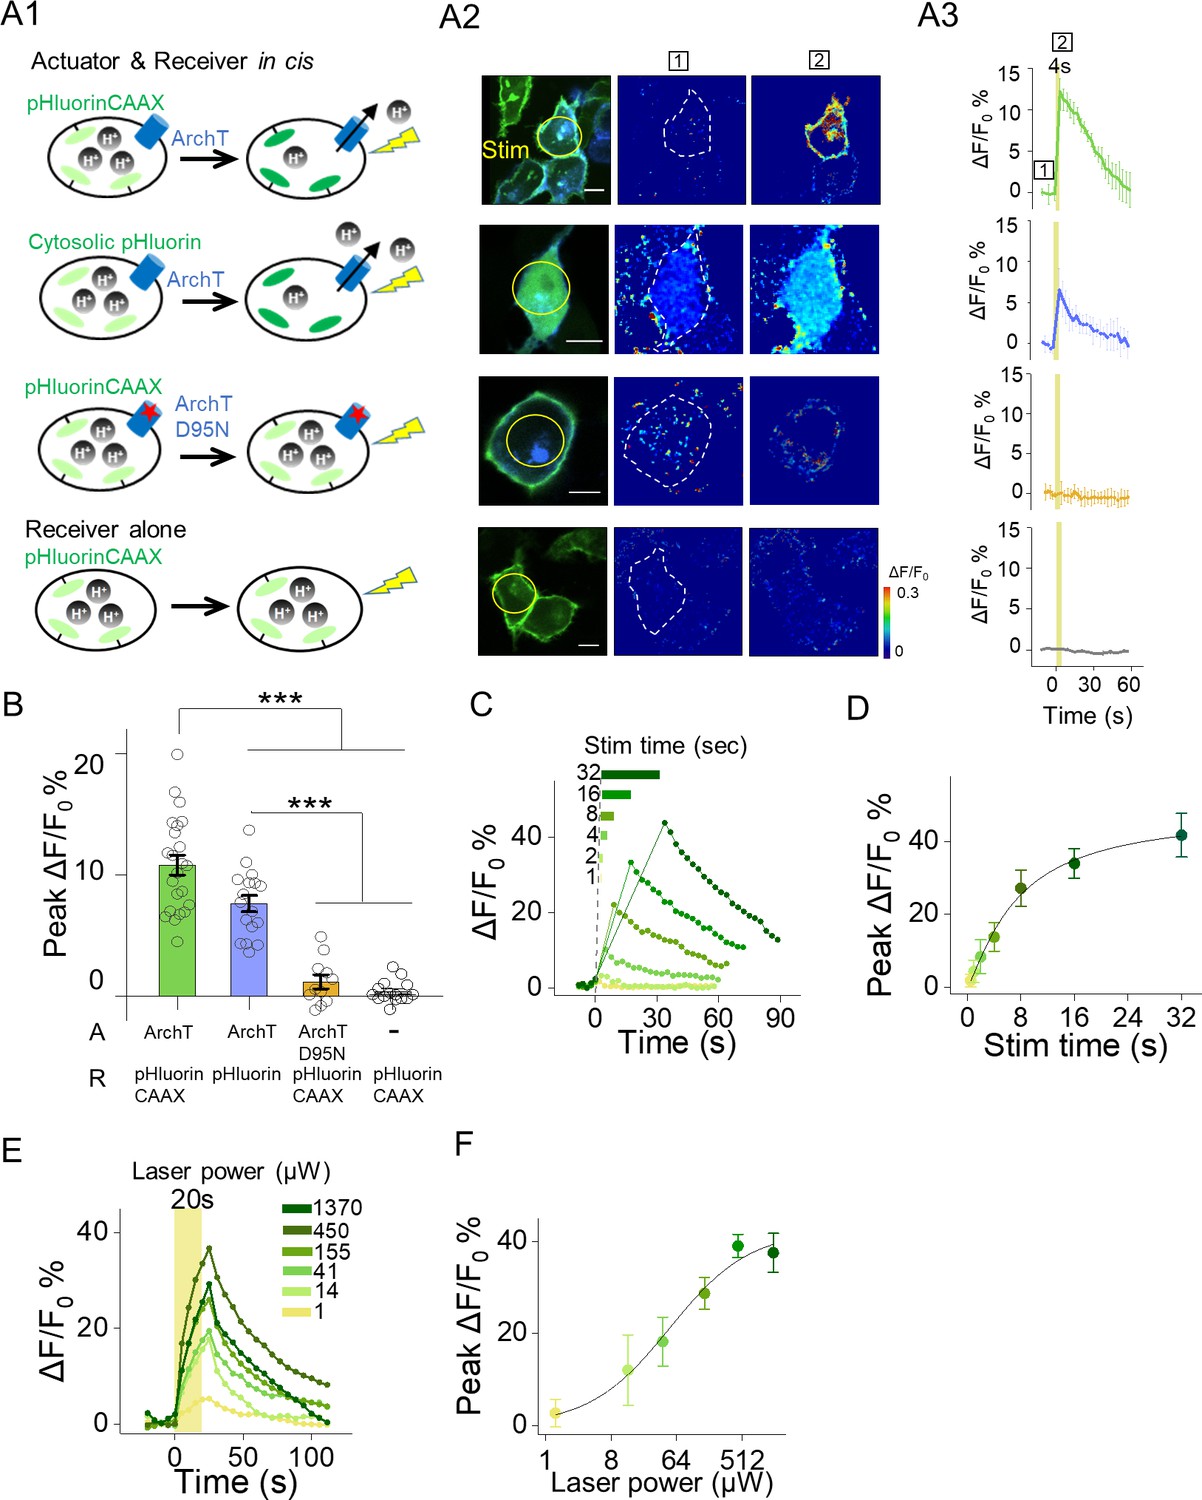
Functional characterization of actuator and receiver based on ArchT and pHluorin.
(A1–A3) Photostimulation induced increases of pHluorin fluorescence in HEK293T cells co-expressing ArchT and pHluorinCAAX (top row) or pHluorin (second row), but not in HEK293T cells co-expressing ArchTD95N and pHluorinCAAX (third row) or expressing only pHluorinCAAX (bottom row). The stimulus (561 nm light, 0.5 mW) is indicated by the yellow circle in the image (A2) and shaded area in the traces (A3). Error bars indicate ±SEM from three repeats (B) Group data for the experiments shown in (A and B) (n = 11–23 cells per group). (C–F) Representative autonomous traces and group peak ΔF/F0 % under increased stimulating time (0.5 mW laser power, (C–D) or increased laser power (20 s stimulation time, (E–F). The lines are single Hill fits to the data (n = 3–10 cells for each point). The scale bars represent 10 μm. ***p<0.001.
Figure 1—figure supplement 3
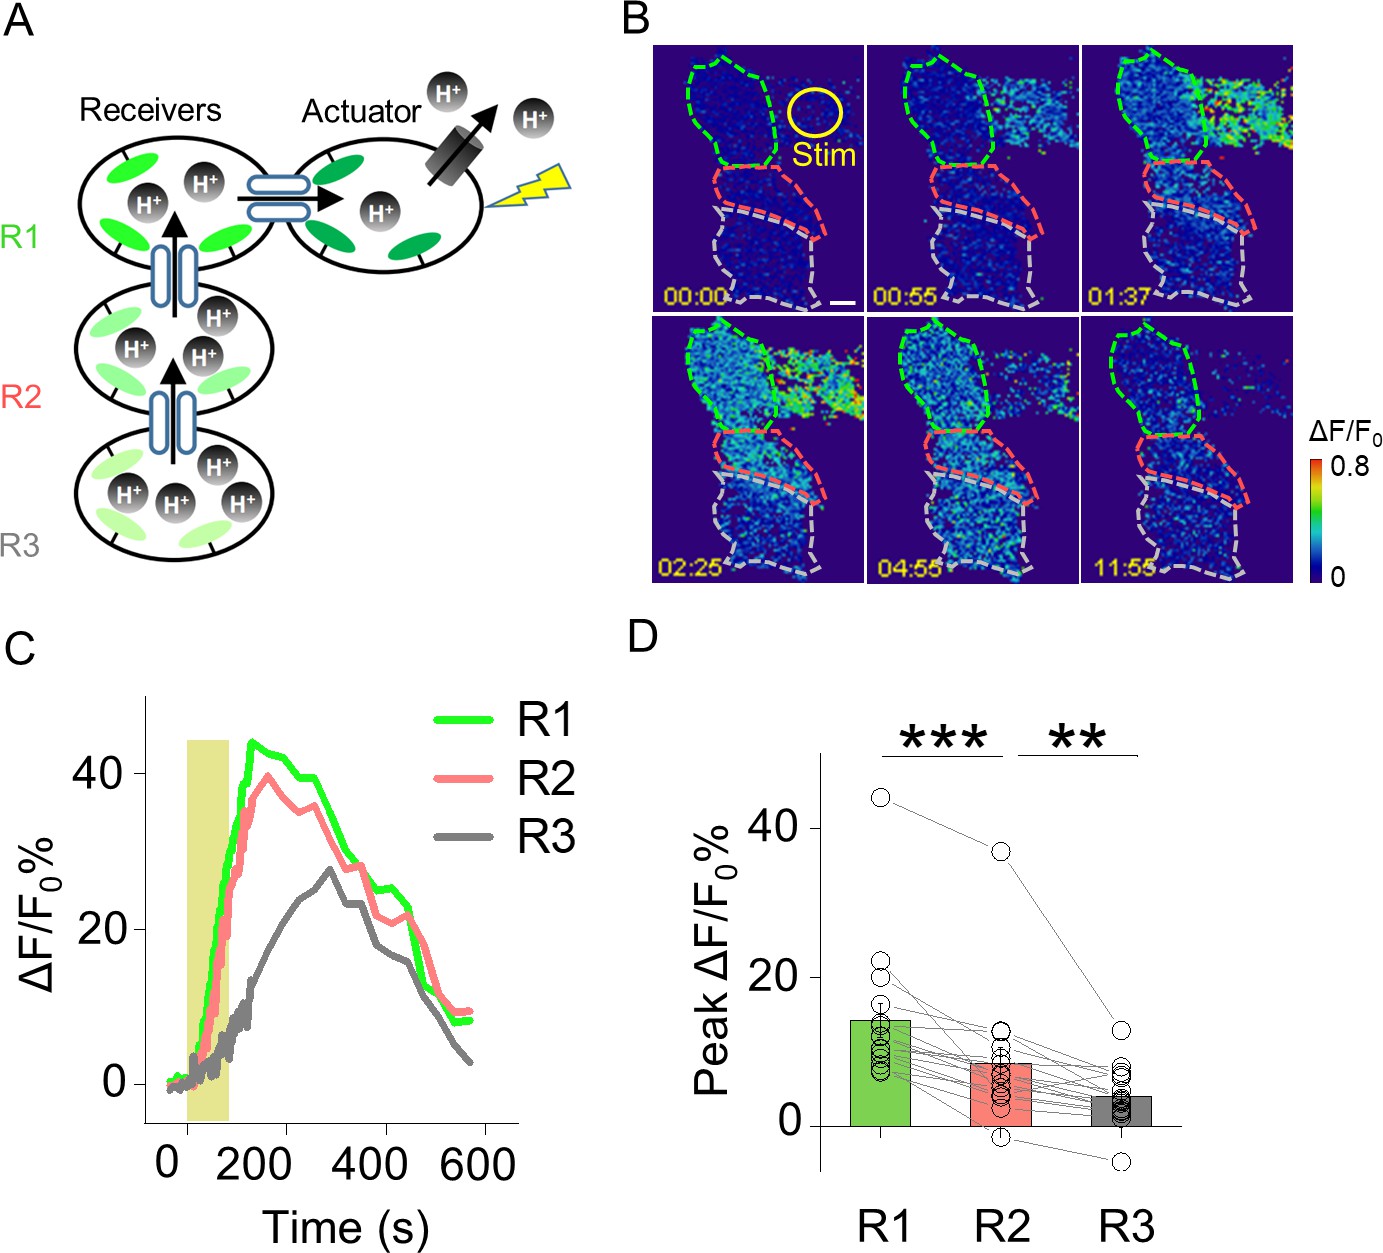
Probing GJC propagation within connected HEK293T cells by PARIS.
(A) Schematic diagram depicting a cluster of four HEK293T cells connected by gap junctions. One cell expresses the actuator, and the three receiver cells (R1, R2, and R3) are connected in series to the actuator. (B,C) Time-lapse pseudocolor images and ΔF/F0 traces of the PARIS signals measured in the receiver cells following light-induced activation of the actuator cell. (D) Group data of the peak change in pHluorinCAAX fluorescence in cells R1, R2, and R3 measured as shown in (B); n = 16 cells per group. The scale bar in (B) represents 10 μm. **p<0.005 and ***p<0.001.
Figure 1—figure supplement 4
Quantification of ArchT activation-induced pH change in actuator cells.
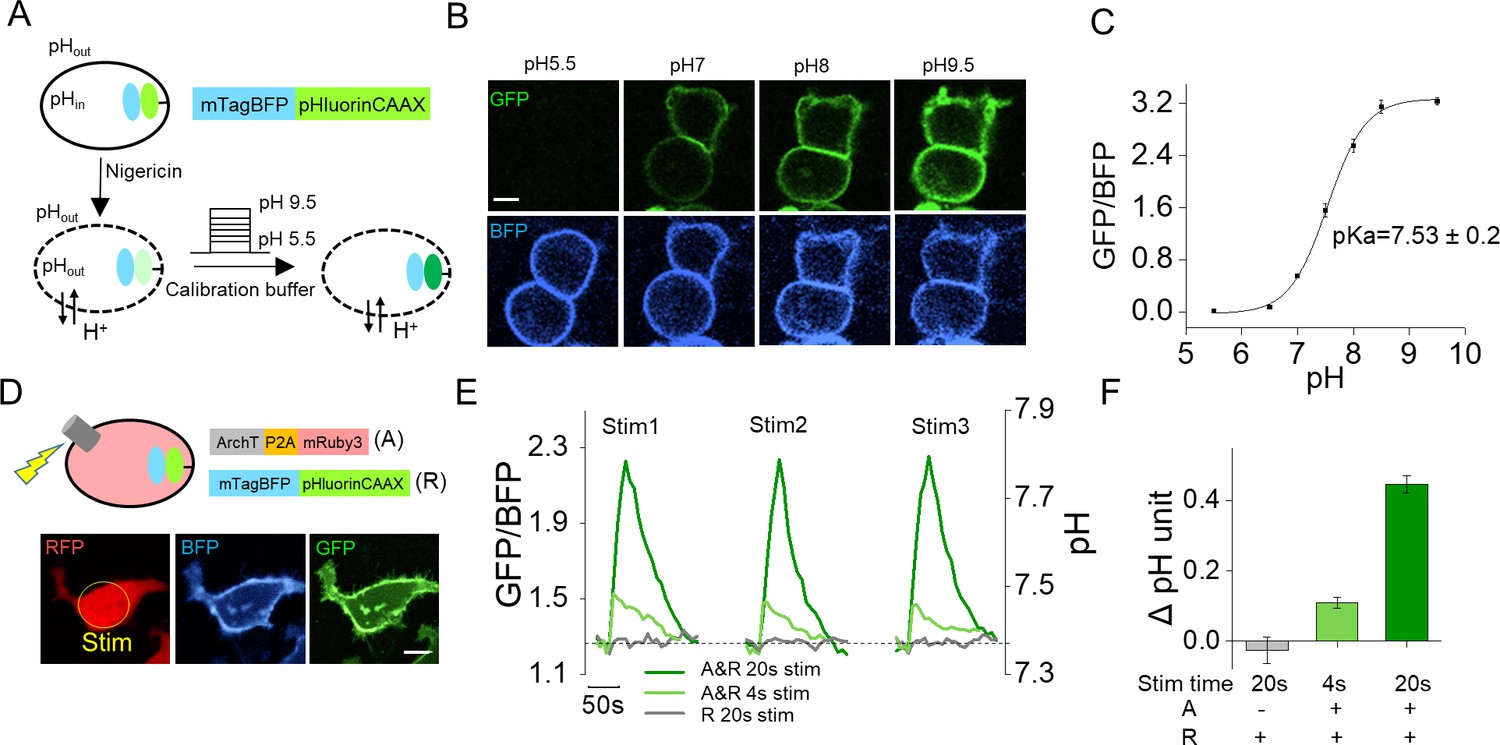
(A) Schematic diagram showing the process for calibrating pH. (B) Confocal images showing pHluorin (top) and BFP fluorescence (bottom) of cells perfused with buffers with the indicated pH levels. (C) pH calibration curve for mTagBFP-pHluorinCAAX. The GFP/BFP ratio was fitted with a Hill function (n = 10 cells for each point). (D) Schematic diagram and confocal images showing co-expression of mTagBFP-pHluorinCAAX and ArchT-P2A-mRuby3. The yellow circle indicates the stimulation region. (E) Representative traces of the GFP/BFP ratio and pH change upon a 20 s or 4 s stimulation at 561 nm (three stimuli delivered at 3-min intervals) in cells co-expressing mTagBFP-pHluorinCAAX and ArchT-P2A-mRuby3 (green lines) and in cells expressing only mTagBFP-pHluorinCAAX (gray line). Error bars indicate the s.e.m. from triplicate experiments. (F) Summary of the estimated peak change in pH in the experiments shown in (E) based on the calibration curve shown in (C) (n = 10 cells per group). The scale bars represents10 μm. A, actuator cells; R, receiver cells.
Figure 2

PARIS’s validation by electrophysiological recording and its comparison with FRAP in HEK293T cells.
(A1–A2) PARIS detection of gap junctional coupling under increasing light power and the application of CBX (0.01 mW to 1.5 Mw, 20 s). (B1–B2) Electrophysiological recording of the gap junctional currents during actuator activation. (B1), Schematic diagram depicting dual patch-clamp recording of a pair of HEK293T cells connected by gap junctions; one cell of the pair expresses ArchT-BFP. (B2), Light steps applied to the actuator cell (top, from 0.1 mW to 0.5 mW), recorded currents in the receiver cell (middle); elimination of the currents by the application of CBX (100 μM, 10 min treatment, bottom). (C1–C2) Similar experiment using the same cells shown in (B), except that voltage steps (from −60 mV to −40 mV) were applied to the actuator cell, while the receiver cell was clamped at −50 mV. (D1–D3) Input-output curve for peak ΔF/F0 % or currents measured in the receiver cell versus illumination intensity or voltage in the absence or presence of CBX. (E) Summary data showing the relative CBX-mediated inhibition of signals measured with PARIS or current recording (n = 3–15 cells per group). (F) Schematic depicting the process of FRAP method to detect gap junctional communication using Calcein-AM dye. (G,H) Comparison of basal fluorescence between PARIS and FRAP during sequential five photostimulation and photobleaching. (G) Exemplary images showing the fluorescence of Calcein or pHluorin at the beginning of 1st, 3rd and 5th FRAP or PARIS measurement. (H) Traces of fluorescence intensity from five consecutive FRAP and PARIS measurements. The half-rise time for the first traces are indicated with dotted lines reflecting the curve-fit analysis. Yellow or purple lines represent the stimulation (561 nm) or bleaching (405 nm) period. (I) Quantified comparison of basal fluorescence, SNR and the half-rise time between FRAP and PARIS method as experiments shown in (F,G) (n = 5 cells). The scale bar represents 10 μm in (G). ***p<0.001, N.S., not significant.
Figure 3 with 1 supplement
Use of PARIS to measure GJC in cultured cell lines and primary cardiomyocytes.
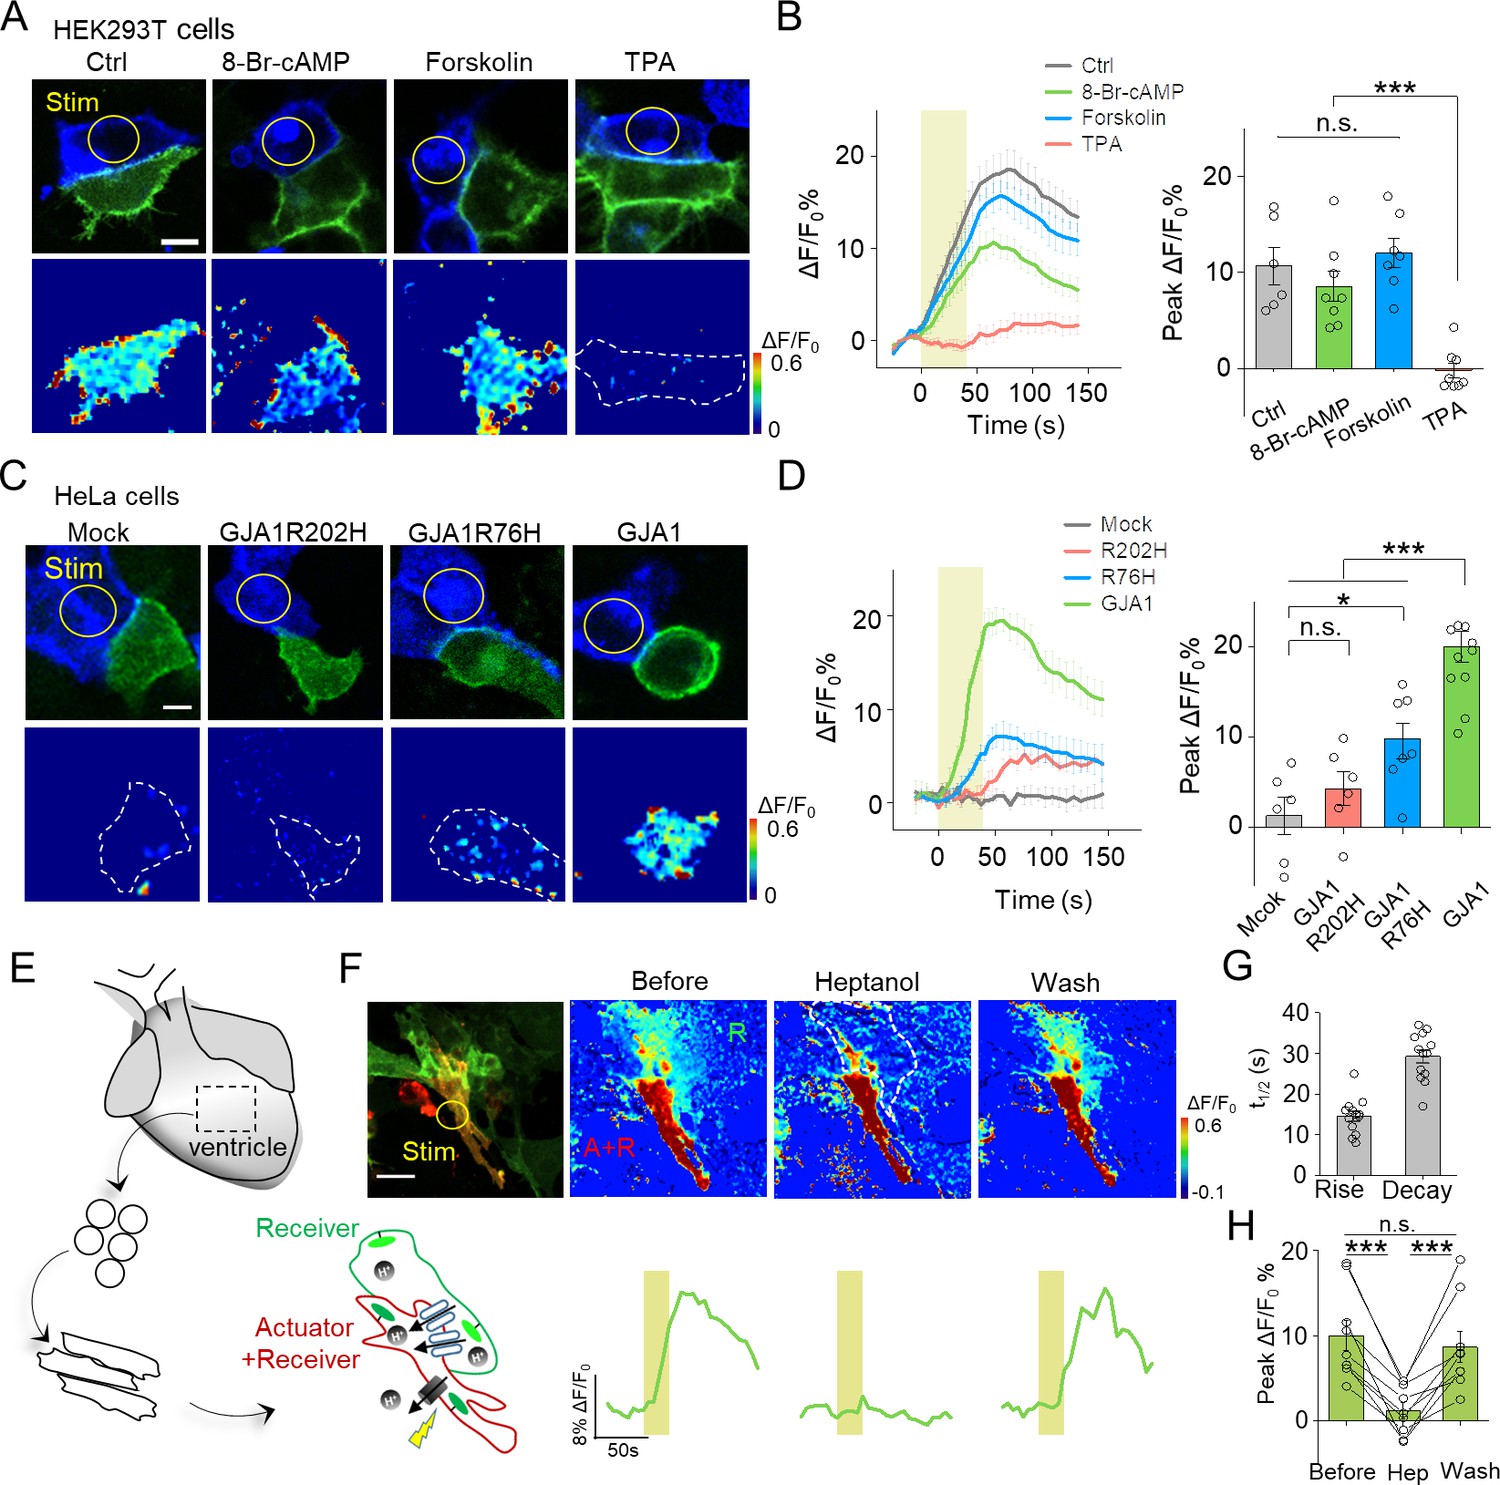
(A) Top, representative images showing adjacent HEK293T cells expressing ArchT/pHluorin. Bottom, pseudocolor images of 40 s laser illumination‒induced peak PARIS signals in receiver cells. Where indicated, the cells were treated with DMSO (Ctrl), 8-Br-cAMP (500 μM), Forskolin (10 μM), or TPA (340 nM) for 6 hr before PARIS measurements. (B) Representative traces and group analysis of PARIS signals in (A) (n = 6–8 cells per group). (C) Top, representative images showing expression of ArchT/pHluorin in HeLa cells with or without transfection of various gap junction proteins. Bottom, pseudocolor images of 40 s laser illumination‒induced peak PARIS signals measured in receiver cells. (D) Representative traces and group analysis of PARIS signals in (C) (n = 6–10 cells per group). (E) Schematic diagram depicting the application of PARIS in cultured rat cardiomyocytes (CMs). Shown below is a corresponding confocal image of the actuator CM and receiver CM, which express ArchT and pHluorinCAAX, respectively. Note that the actuator CM expresses both ArchT and pHluorinCAAX. (F) Top, PARIS responses in the actuator and receiver CMs before adding heptanol, 5 min after treatment of heptanol (2 mM), and 3 min after perfusion by Tyrode solution. Shown at the left is a confocal image of the actuator and receiver CMs. Bottom, corresponding traces of the experiments shown above. Note that the light stimulus elicited a response in both CMs, but only the receiver CM was sensitive to heptanol. (G–H) Summary of the half-rise and half-decay times of the PARIS signals and peak ΔF/F0 for pHluorinCAAX fluorescence in receiver CMs (n = 10 cells). The scale bars represent 10 μm (A,C) or 50 μm (F). *p<0.05, **p<0.01, ***p<0.001, N.S., not significant (p>0.05).
Figure 3—figure supplement 1
Spontaneous Ca2+ transients and beating rate in rat cardiomyocytes expressing ArchT.
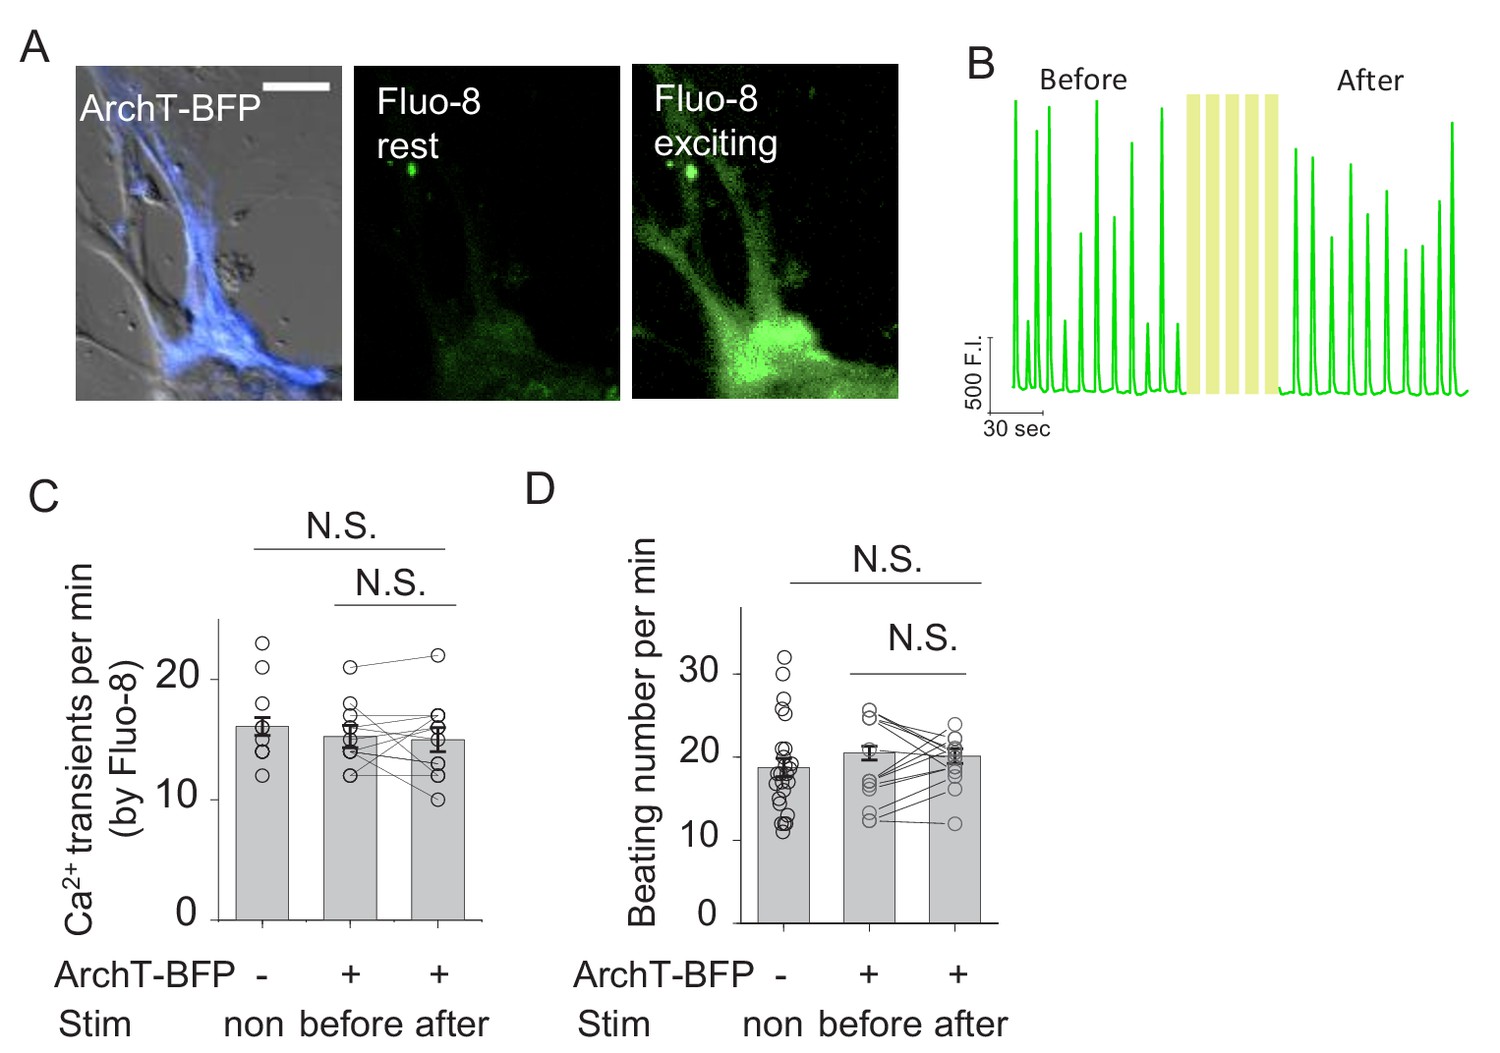
(A) Example images of a cardiomyocyte (CM) expressing ArchT (left), showing Fluo-8 fluorescence at the rest state (middle) and the exciting state (right). (B) Ca2+ transients measured using Fluo-8 fluorescence in the same CM shown in (A) before and after light stimulation. (C–D) Summary of the rate of Ca2+ transients measured with Fluo-8 (C) and the beating rates (D) from untransfected CMs and ArchT-expressing CM before and after light stimulation (n = 11–26 cells per group); cells were stimulated with 20 s pulses at 0.1 mW with 2 min intervals for five repeats. The scale bar represents 50 μm. NS., not significant (p>0.05).
Figure 4 with 3 supplements
Detection of GJC between specific neurons in transgenic Drosophila by PARIS.
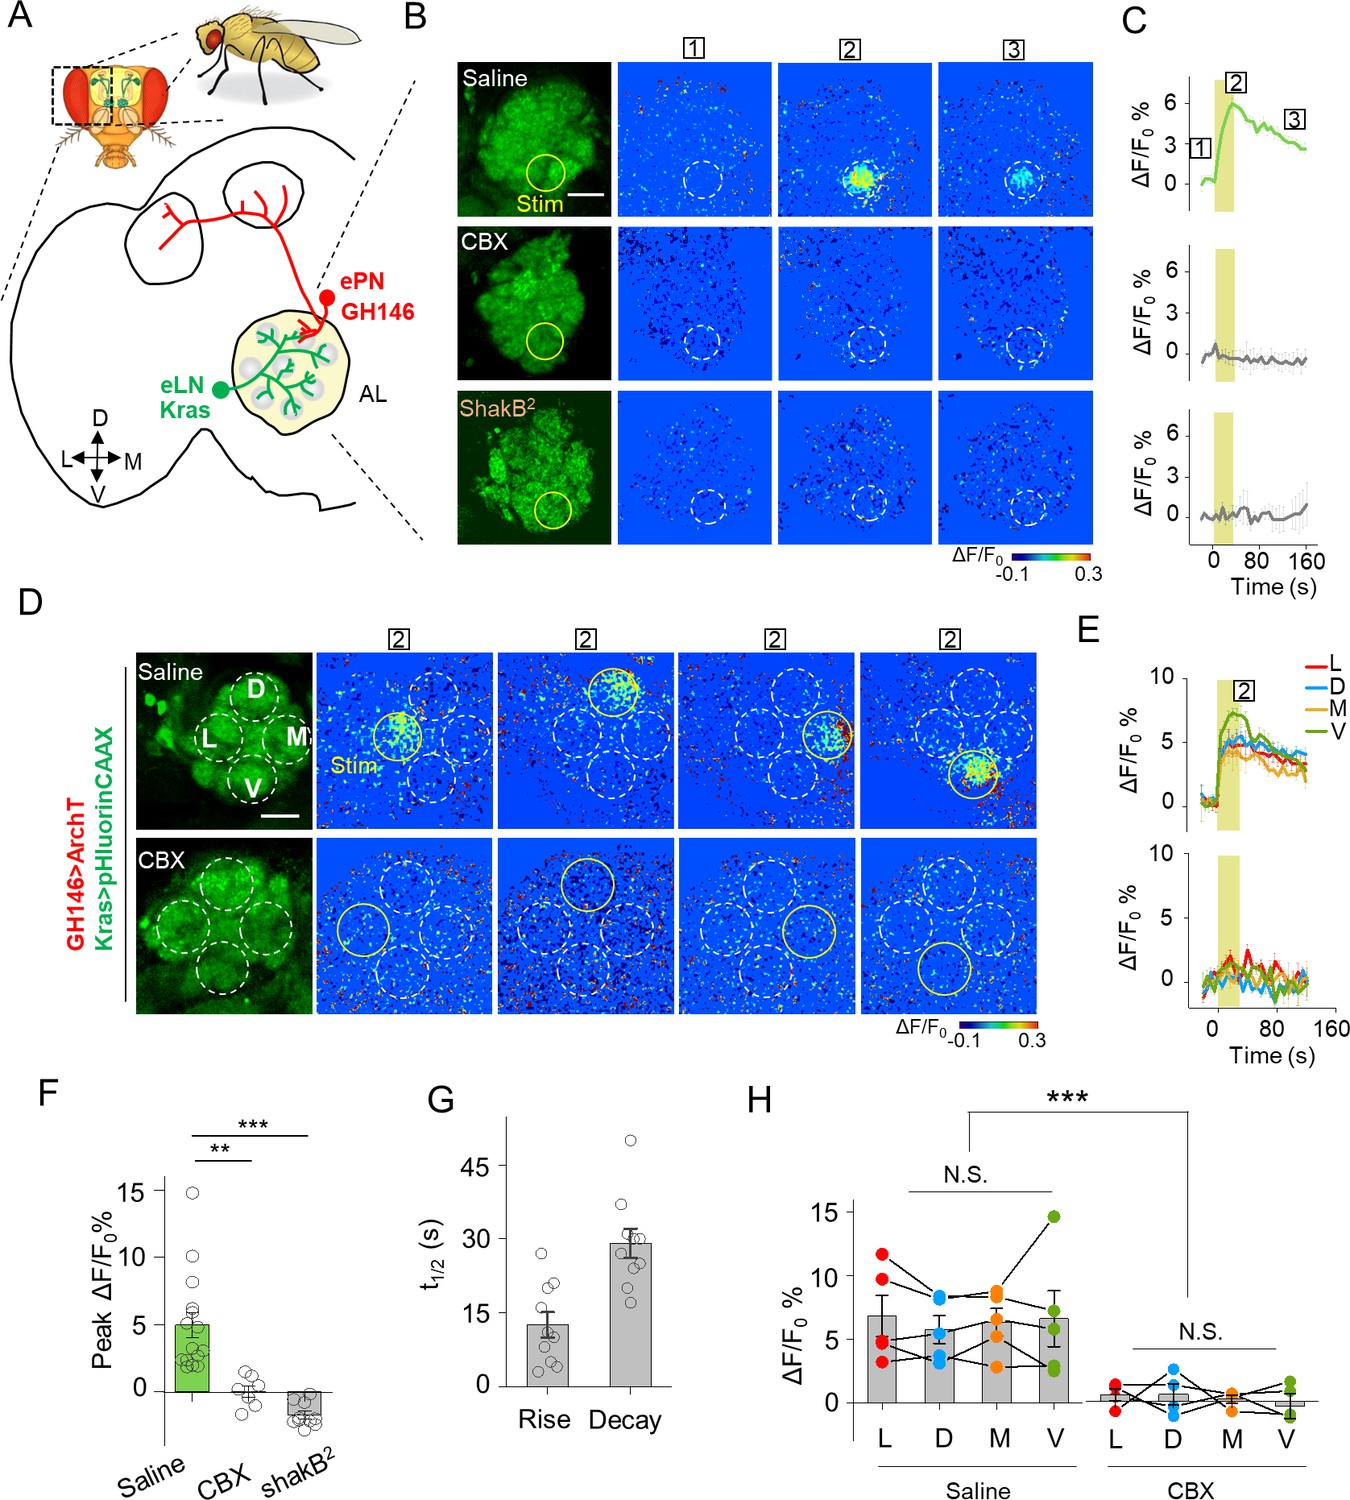
(A) Schematic diagram depicting the anatomy of the antennal lobe (AL) in a transgenic Drosophila line in which the ePNs express ArchT and the eLNs express pHluorinCAAX (indicated in red and green, respectively). D, V, L, and M refer to dorsal, ventral, medial, and lateral, respectively. (B, C) Pseudocolor images (B) and time course (C) of PARIS signals in the AL of the transgenic flies shown in (A). Note that a 30 s pulse of 561 nm light (0.5 mW) elicited a significant PARIS signal between ePNs and eLNs (top row); in contrast, no signal was elicited when the brain was treated with 100 μM CBX (middle row, 15 min), in flies with the ShakB2 mutation (bottom row). The boxed ‘1–3’ above the images/traces identify stages before photostimulation, in the peak response and in the end of imaging process. (D, E) Pseudocolor images (D) and time course (E) showing PARIS responses of four ROIs from the lateral (L), dorsal (D), middle and ventral (V) part of the AL in the same transgenic Drosophila line in (A). Where indicated, the flies were treated with saline or carbenoxolone (CBX); n = 5 flies per group. (F, G) Summary of the peak PARIS signal (F) and the half-rise and half-decay times (G) elicited by 30 s photostimulation (n = 7–15 flies per group). (H) Group data for the peak PARIS response between eLNs-ePN measured in the four stimulating ROIs indicated in (D) (n = 5 flies per group). The scale bars 20 μm. **p<0.005, ***p<0.001, N.S., not significant (p>0.05).
Figure 4—figure supplement 1
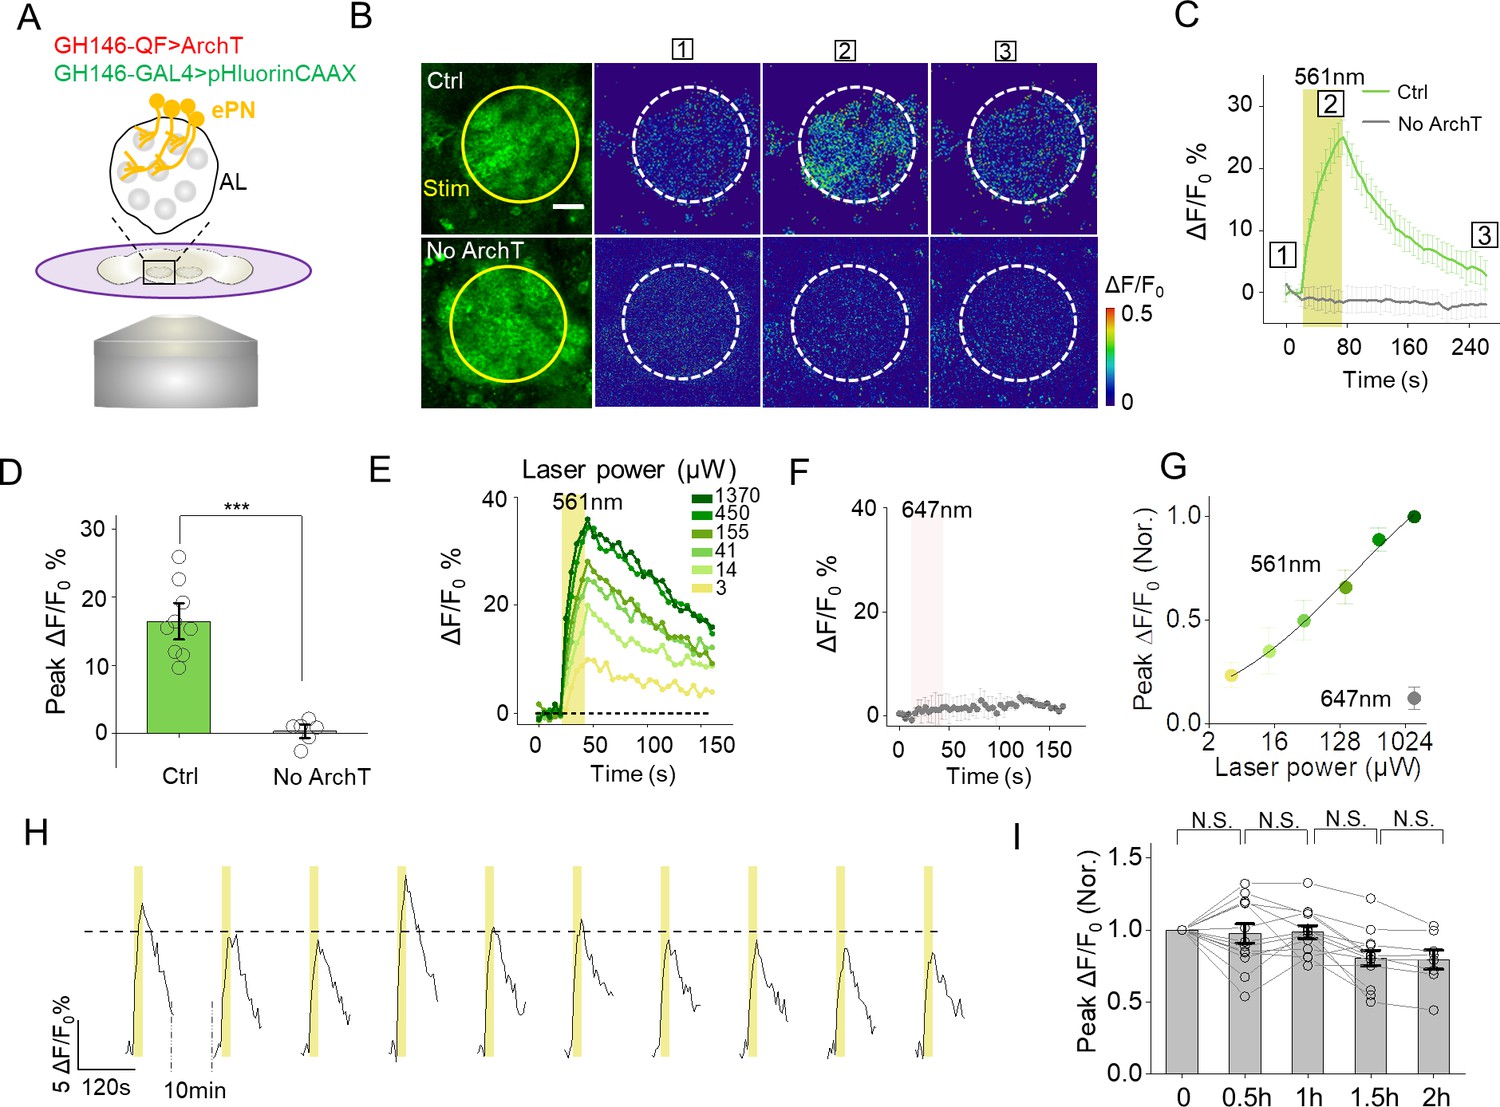
Cell-autonomous PARIS signal measured in the ePNs of transgenic Drosophila.
(A) Schematic diagram depicting the imaging setup and the antennal lobe (AL) in a transgenic fly co-expressing ArchT and pHluorinCAAX in ePNs. (B–D) Pseudocolor images (B), representative traces (C), and summary data (D) showing ePN-autonomous pHluorinCAAX responses measured in the AL (n = 6–9 flies per group). Note that the light stimulus had no effect in flies in which ArchT was not expressed. (E) Time course of the change in pHluorin fluorescence in responses to 561 nm light delivered at the indicated power. (F) Laser illumination with 647 nm light at 1 mW does not induce a detectable PARIS signal. (G) Peak ΔF/F0 plotted against laser power. The solid line is a Hill fit to the data (n = 9 for each data point). (H) Repetitive light stimuli elicit a reproducible cell-autonomous signal in transgenic flies. Shown are ten consecutive recordings of ePN signals collected over a 2 hr period; where indicated, 561 nm light was applied at 0.5 mW. The dashed horizontal line indicates the average peak response from the ten stimuli. (I), Summary of the peak change in pHluorinCAAX fluorescence normalized to the first response measured at the indicated times (n = 8–13 flies for each group). The scale bar represents 20 μm. ***p<0.001, N.S., not significant (p>0.05).
Figure 4—figure supplement 2
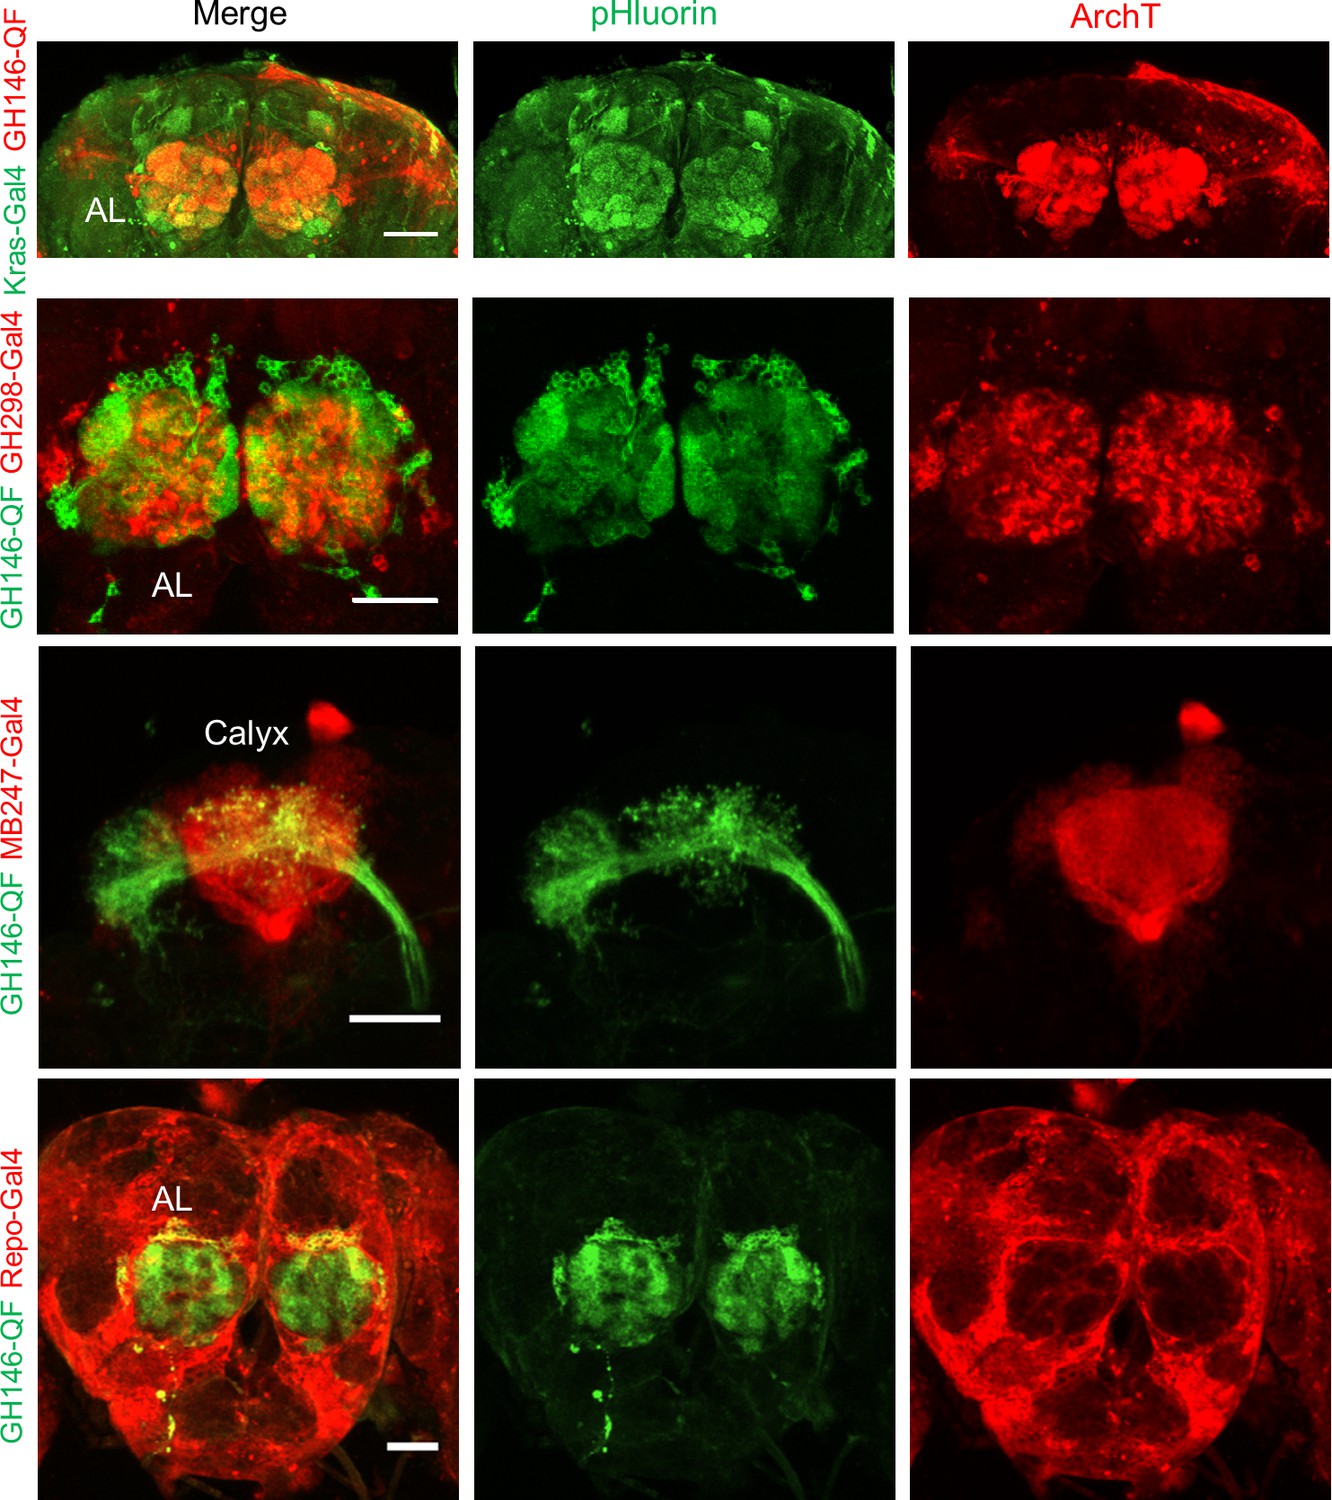
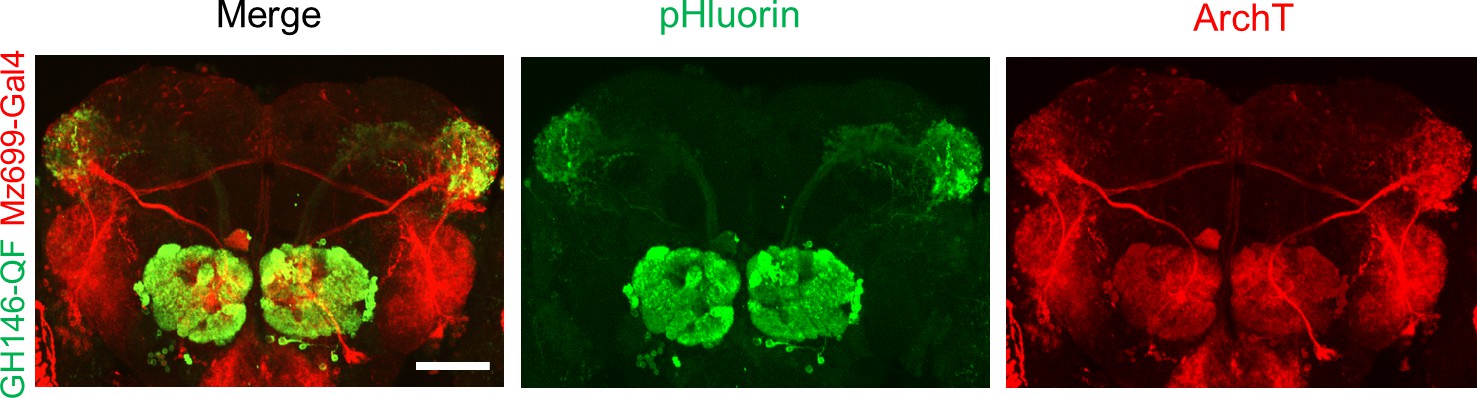
Composite confocal images of dissected fly brain expressing actuators and receivers in genetically labeled cells.
Red channel, the expression of RFP (mRuby3) linked ArchT; green channel, the expression of pHluorinCAAX. The correspondent diver lines used were listed on the left side. The scale bars represent 50 μm.
Figure 4—figure supplement 3
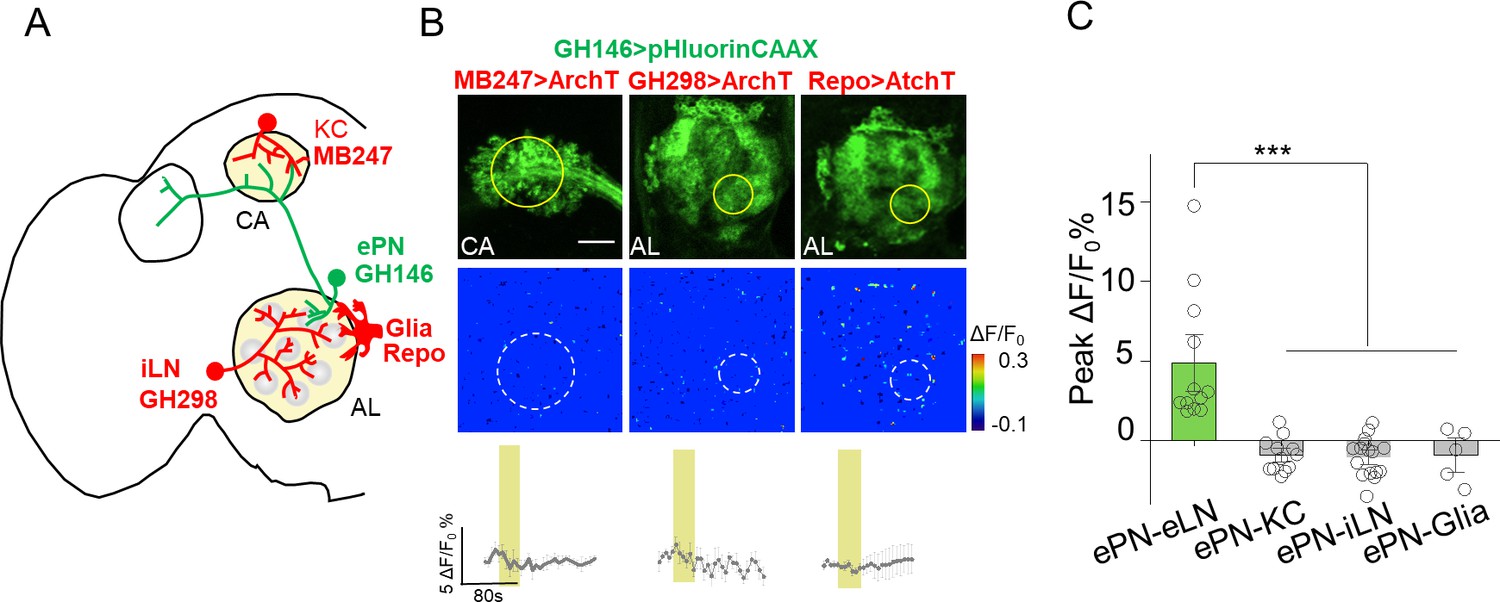
No obvious PARIS signal was detected from ePN-KC, ePN-iLN and eLN-Glia pairs.
(A–C) Similar to Figure 4, except the PARIS signal was measured between ePNs and Keyon cells (ePN-KC), inhibitory local neurons (ePN-iLN), and glial cells (ePN-Glia); n = 7–17 flies per group. PARIS signals between ePNs and eLNs (ePN-eLN) from Figure 4 were represented as a control. The scale bar represents 20 μm. ***p<0.001.
Figure 5 with 1 supplement
Mapping GJC at specific subcellular structures in transgenic Drosophila by PARIS.
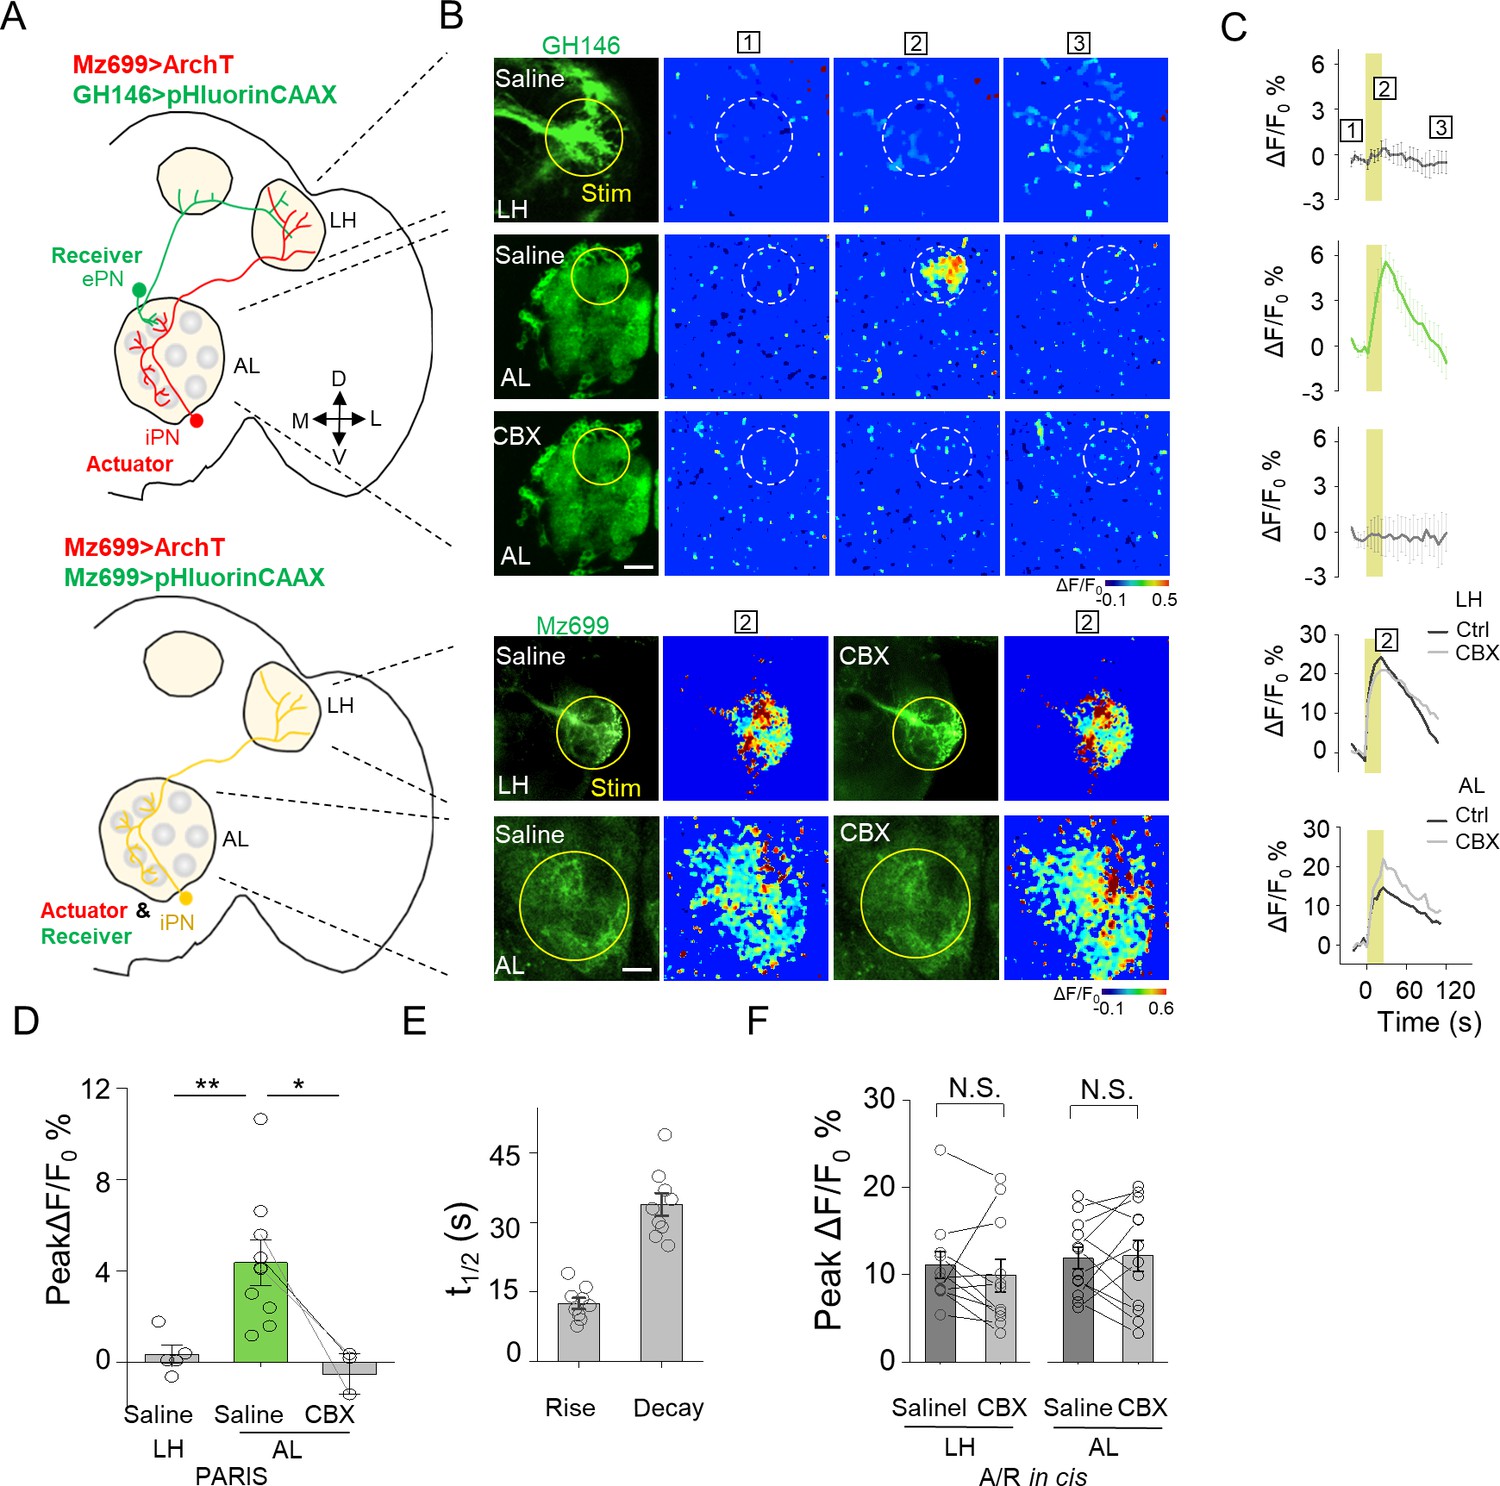
(A) Schematic diagrams depicting two transgenic Drosophila lines in which the ePNs express pHluorinCAAX and iPNs express ArchT (top, shown in green and red), or only the iLNs co-expressing ArchT and pHluorinCAAX (bottom, shown in yellow) in the olfactory pathway are indicated. (B, C) Pseudocolor images (B) and time course (C) of PARIS signals in the AL and LH regions of the transgenic flies shown in (A). Note that in flies in which the ePNs and iPNs express the receiver and actuator, respectively, a 20 s pulse of yellow light elicited a significant PARIS signal in the AL, but not in the LH. Moreover, the signal induced in the AL was inhibited by 100 μM CBX. CBX had no effect in flies in which the actuator and receiver were co-expressed in the same iPNs (i.e., in the cis configuration). (D–F) Group data for the peak PARIS signals (D), the half-rise and half-decay times measured in the indicated conditions (E) and the iPN autonomous responses (n = 3–11 flies per group). The scale bars in (B) represent 20 μm. *p<0.05, N.S., not significant (p>0.05).
Figure 5—figure supplement 1
Composite confocal images of dissected fly brain expressing actuators and receivers in iPNs and ePNs.
Red channel, the expression of RFP (mRuby3) linked ArchT; green channel, the expression of pHluorinCAAX. The correspondent diver lines used were listed on the left side. The scale bar represents 50 μm.
Figure 6 with 1 supplement

Further optimization of PARIS by screening of more potent proton actuators.
(A) Screening for high-efficiency proton actuators. Actuators were fused with BFP at the C-terminus and co-expressed with pHluorinCAAX in HEK293T cells. Top left, membrane trafficking performance of two candidates besides ArchT; top right, phylogenic tree of screened rodopsins. The tree was built using PhyML (Guindon and Gascuel, 2003); bottom, cell-autonomous pHluorin signals of all the potential proton pumps under 20 s photostimulation (n = 5–13 cells per group). (B,C) Exemplary responses and grouped cell-autonomous peak ΔF/F0 % of ArchT, Lari and CarO under increased laser power (20 s stimulation time). The data were fit to a single Hill function (solid lines, n = 10 cells for each data point). The scale bar in (A) represents 10 μm. .
Figure 6—figure supplement 1
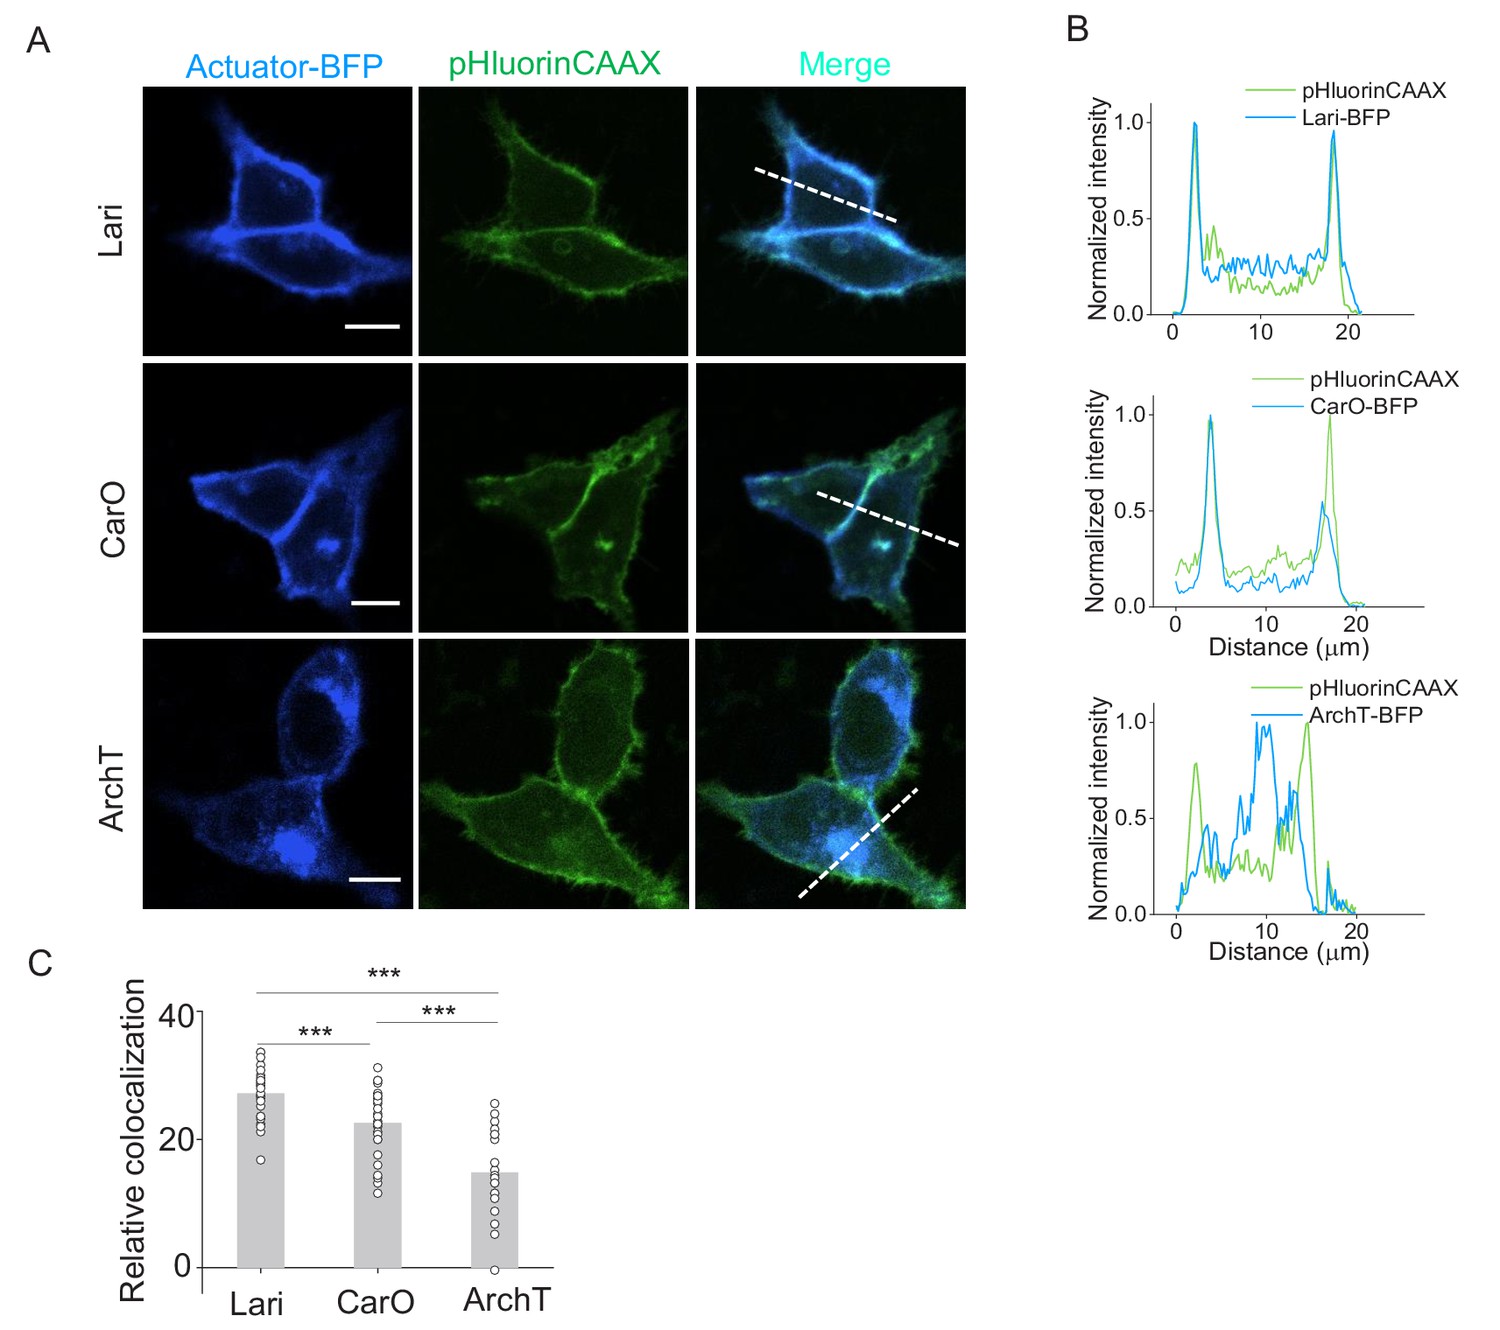
Membrane traffic performance of two proton-pumps compared with ArchT.
(A) Confocal images showing the expression of two new proton pumps besides ArchT in HEK293T cells. Proton pumps were fused with BFP at the C-terminus and co-expressed with pHluorinCAAX. (B) The normalized line-scanning plots of the fluorescence signals in both blue and green channels. (C) Relative colocalization were measured by Pearson’s colocalization ratios of the Autuator-BFP according to pHluorinCAAX (n = 28 for each protein). The scale bars represent 10 μm. ***p<0.001.
Author response image 1
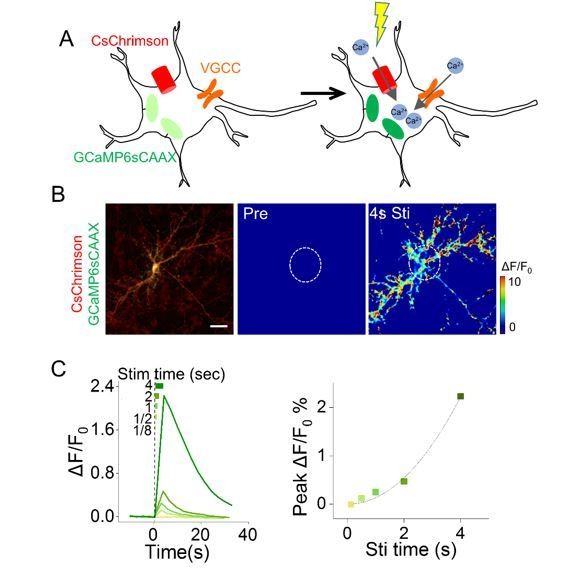
Cell-autonomous responses in cultured hippocampal neurons co-expressing CsChrimson and GCaMP6s.
Scale bar, 30μm.
Tables
Key resources table
| Reagent type (species) or resource | Designation | Source or reference | Identifiers | Additional information |
|---|---|---|---|---|
| Genetic reagent (Drosophila melanogaster) | GH146-Gal4 | Liqun Luo lab | RRID:BDSC_30026 | |
| Genetic reagent (D. melanogaster) | GH146-QF | Liqun Luo lab | RRID:BDSC_30015 | |
| Genetic reagent (D. melanogaster) | GH298-Gal4 | Liqun Luo lab | RRID:BDSC_37294 | |
| Genetic reagent (D. melanogaster) | Krasavietz-Gal4 | Donggen Luo lab | flybaseID#_ FBti0027494 | |
| Genetic reagent (D. melanogaster) | ShakB2 | Donggen Luo lab | flybaseID#_ FBal0015575 | |
| Genetic reagent (D. melanogaster) | Mz699-Gal4 | Liqun Luo lab | flybaseID#_ FBti0007260 | |
| Genetic reagent (D. melanogaster) | Repo-Gal4 | Yi Rao lab | RRID:BDSC_7415 | |
| Genetic reagent (D. melanogaster) | MB247-Gal4 | Yi Rao lab | RRID:BDSC_64306 | |
| Genetic reagent (D. melanogaster) | UAS-pHluorinCAAX | This study | ||
| Genetic reagent (D. melanogaster) | QUAS-pHluorinCAAX | This study | ||
| Genetic reagent (D. melanogaster) | UAS-ArchT-P2A- mRuby3CAAX | This study | ||
| Genetic reagent (D. melanogaster) | QUAS-ArchT-P2A-mRuby3CAAX | This study | ||
| Cell line (Human) | HEK293T | ATCC | Cat#CRL-3216; RRID:CVCL_0063 | |
| Cell line (Human) | HeLa | ATCC | Cat#CCL-2; RRID:CVCL_0030 | |
| Chemical compound,drug | CBX | Sigma-Aldrich | Cat#C4790 | |
| Chemical compound,drug | Heptanol | J and K Scientific | Cat#415422 | |
| Chemical compound,drug | Forskolin | TargetMol | Cat#T2939 | |
| Chemical compound,drug | 8-Br-cAMP | Sigma-Aldrich | Cat#B7880 | |
| Chemical compound,drug | TPA | Sigma-Aldrich | Cat#P1585 | |
| Chemical compound,drug | Calcein-AM | AAT Bioquest | Cat#22002 | |
| Chemical compound,drug | Fluo-8-AM | AAT Bioquest | Cat#21082 | |
| Recombinant DNA reagent | pcDNA3.1 vector | Michael Lin lab | Addgene: 52519 | |
| Recombinant DNA reagent | pcDNA3.1-Lari-BFP2 | This study | ||
| Recombinant DNA reagent | pJFRC28 | (Pfeiffer et al., 2012) | Addgene: 36431 | |
| Recombinant DNA reagent | pJFRC28-10xUAS-pHluorinCAAX-p10 | This study | ||
| Recombinant DNA reagent | pJFRC28-5xQUAS pHluorinCAAX-p10 | This study | ||
| Recombinant DNA reagent | pJFRC28-10xUAS--ArchT-P2A-mRuby 3CAAX-p10 | This study | ||
| Recombinant DNA reagent | pJFRC28-5xQUAS -ArchT-P2A-mRuby 3CAAX-p10 | This study | ||
| Sequence- based reagent | human ORFeome 8.1 | Center for Cancer Systems Biology | http://horfdb.dfci.harvard.edu/ | Full-length human cDNAs |
| Software, algorithm | ImageJ | NIH | https://imagej.nih.gov/ij/; RRID:SCR_003070 | |
| Software, algorithm | Origin 9.1 | OriginLab | https://www.originlab.com/ | |
| Software, algorithm | MATLAB | MathWorks | https://www.mathworks.com/products/matlab.html; RRID:SCR_001622 | |
| Other | Inverted confocal microscope | Nikon | Ti-E A1 |
Additional files
-
Source code 1
pseudocolor.
- https://doi.org/10.7554/eLife.43366.019
-
Transparent reporting form
- https://doi.org/10.7554/eLife.43366.020
Download links
A two-part list of links to download the article, or parts of the article, in various formats.
Downloads (link to download the article as PDF)
Open citations (links to open the citations from this article in various online reference manager services)
Cite this article (links to download the citations from this article in formats compatible with various reference manager tools)
PARIS, an optogenetic method for functionally mapping gap junctions
eLife 8:e43366.
https://doi.org/10.7554/eLife.43366


