Stiffness and tension gradients of the hair cell’s tip-link complex in the mammalian cochlea
- Institut Curie, PSL Research University, CNRS UMR168, France
- Sorbonne Université, France
- Institut Pasteur, France
- UMRS 1120, Institut National de la Santé et de la Recherche Médicale (INSERM), France
Figures
Figure 1
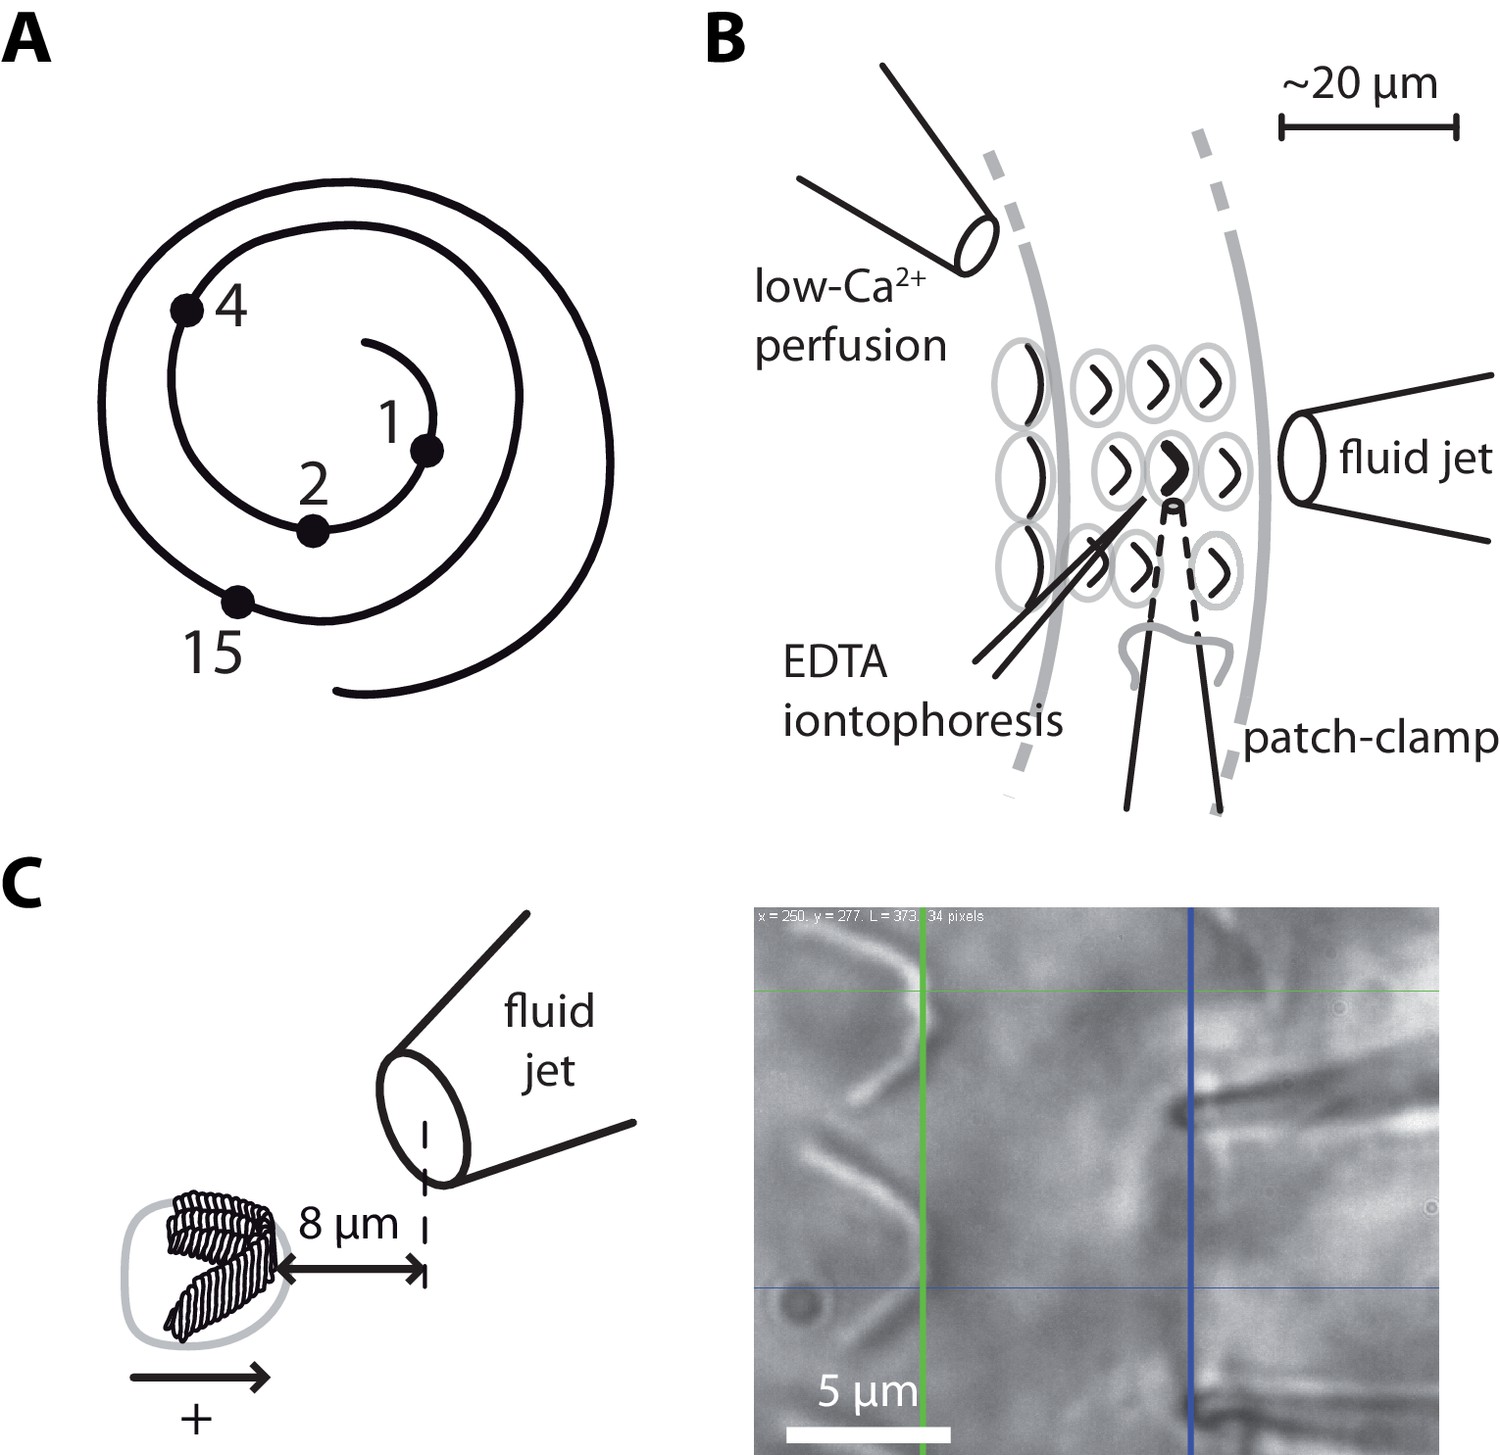
Hair-bundle stimulation along the tonotopic axis of the rat cochlea.
(A) Schematic representation of the tonotopic axis of the rat cochlea. Recordings were made at locations marked by black disks, corresponding to characteristic frequencies (in kHz) increasing from the apex to the base of the cochlea as indicated on the figure and to fractional distances from the apex of 5%, 10%, 20%, and 50%. We report measurements from both inner and outer hair cells at the 1‒4 kHz locations, but only from inner hair cells at the 15-kHz location. The rat cochlea was typically 10 mm long. Adapted from Viberg and Canlon (2004). (B) Schematic layout of the experimental pipettes around a given outer hair cell. We combined fluid-jet stimulation of single hair bundles, iontophoresis of a Ca2+ chelator (EDTA), patch-clamp recordings of transduction currents, and perfusion of low-Ca2+ saline. (C) Schematic representation of the fluid-jet pipette and of a hair bundle (left) and micrograph of a fluid-jet pipette ready to stimulate an outer hair cell of the rat cochlea (right). A positive (negative) deflection of the hair bundle, as defined on the drawing, was elicited by fluid suction (ejection) into (from) the pipette, promoting opening (closure) of the transduction channels. The horizontal projected distance between the mouth of the pipette (blue vertical line) and the hair bundle (green vertical line) was set at ~8 µm.
Figure 2 with 5 supplements
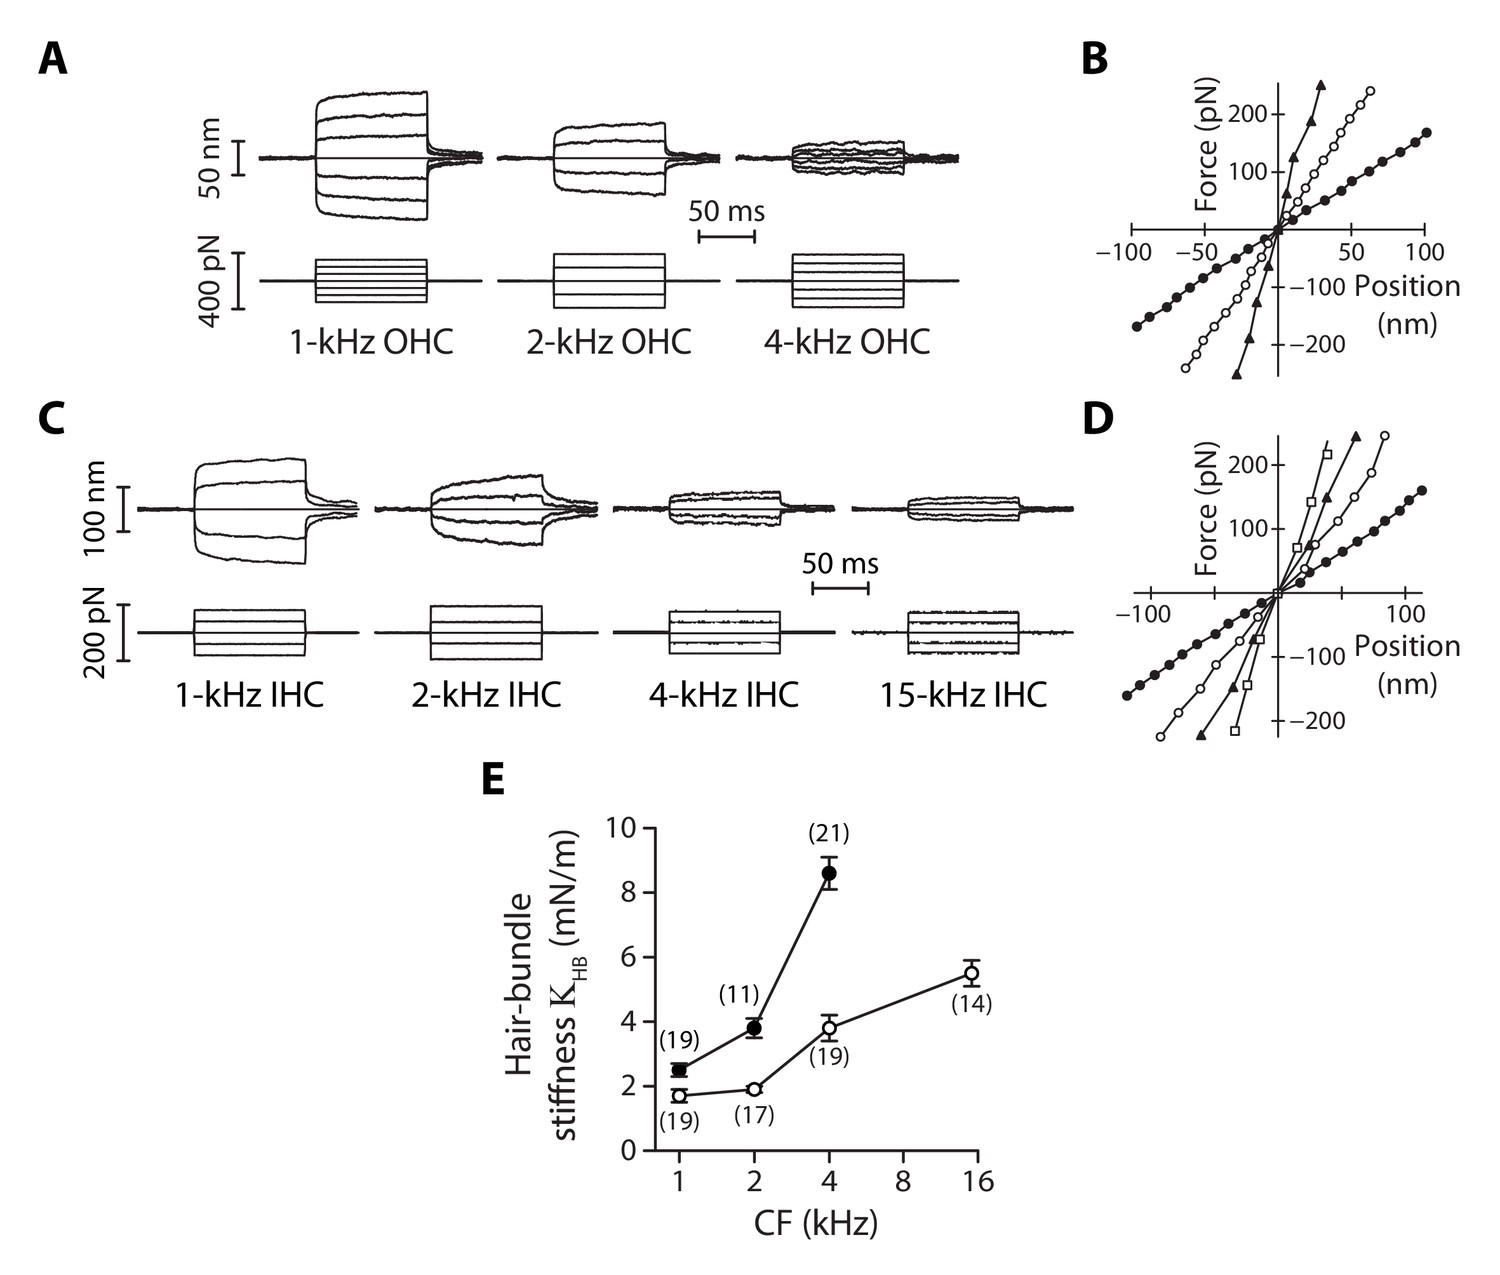
Stiffness gradients of the hair bundle.
(A) Hair-bundle movements (top) in response to a series of force steps (bottom) for outer hair cells (OHC) with characteristic frequencies of 1, 2, and 4 kHz (from left to right). (B) Force-displacement relations for the data shown in (A), with black disks, white disks and black triangles corresponding to characteristic frequencies of 1, 2, and 4 kHz, respectively. (C) Hair-bundle movements (top) in response to a series of force steps (bottom) for inner hair cells (IHC) with characteristic frequencies of 1, 2, 4, and 15 kHz. (D) Force-displacement relations for the data shown in (C), with black disks, white disks, black triangles, and white squares corresponding to characteristic frequencies of 1, 2, 4, and 15 kHz, respectively. (E) Stiffness () of a hair bundle under control conditions as a function of the characteristic frequency (CF) for inner (white disks) and outer (black disks) hair cells. Each data point in (E) is the mean ± standard error of the mean (SEM) with the number of cells indicated between brackets.
-
Figure 2—source data 1
Statistical significance.
The table lists p-values resulting, respectively, from a one-way ANOVA to assay statistical significance of the measured mean-value variation of the hair-bundle stiffness between different cochlear locations for inner (IHC) and outer (OHC) hair cells, from two-tailed unpaired Student's t-tests with Welch’s correction to compare mean values of between two groups of a given hair-cell type (IHC or OHC) with different characteristic frequencies (CF) or between the two cell types (OHC/IHC) when they are associated to the same characteristic frequency. The last entry (Gradient OHC vs. gradient IHC) provides the p-value to assay the statistical significance between the slopes of a weighted linear regression of the relation between and the characteristic frequency of the hair cell. A bold font was used to help find statistically significant differences.
- https://doi.org/10.7554/eLife.43473.009
-
Figure 2—source data 2
Hair-bundle stiffness of inner and outer hair cells as a function of the characteristic frequency.
- https://doi.org/10.7554/eLife.43473.010
Figure 2—figure supplement 1
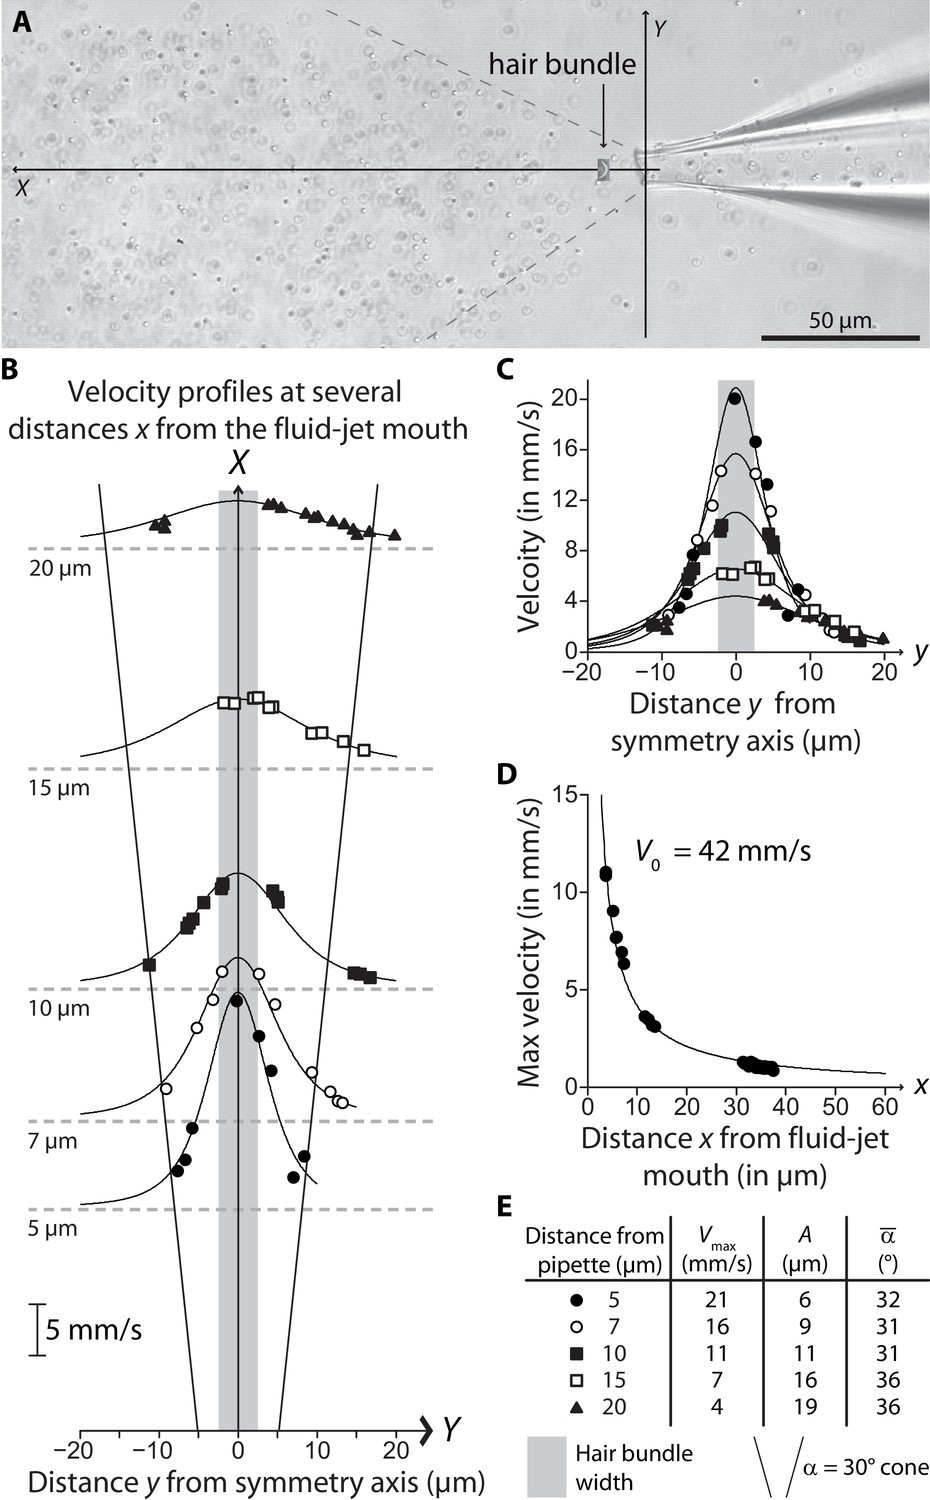
Velocity field of a fluid jet.
(A) Micrograph showing 200-nm beads entrained by a fluid jet; the beads were used as tracers for velocimetry. The dotted lines delimit the fluid cone coming out of the pipette; its half-aperture 30° was in agreement with that measured with Coomassie blue (Figure 2—figure supplement 2), considering that the diameter of the fluid-jet pipette was here 10 μm. A scaled picture of an outer hair-cell bundle was inserted in the micrograph to illustrate how a hair bundle was positioned within the fluid jet. A movie was recorded with a high-speed camera (Photron Fastcam Mini UX50) at 5000 images/s. The position of the beads was automatically tracked in the plane using the TrackMate plugin (Tinevez et al., 2017) of the image-processing software Image J (National Institute of Health, Bethesda, USA). (B) Longitudinal-velocity profile along the transverse axis, at several values of the distance from the pipette mouth along the axis. The data were well described by the function (solid lines). The shaded area indicates the width of a hair bundle. We noticed that the half-aperture of the fluid jet that we measured with Coomassie blue (Figure 2—figure supplement 2) or with the beads (A) was well approximated by , where is the diameter of the pipette; the oblique lines shown in the figure delimit the fluid jet and match the cone shown in (A). As a result, when a calibration fiber was placed perpendicular to the fluid jet (Figure 2—figure supplement 2B), the fiber experienced viscous drag over a typical length . (C) The same velocity profiles as those shown in (B) are here overlapped; different symbols correspond to beads at different distances from the mouth of the fluid-jet pipette, according to the legend shown in (B). (D) Fluid velocity at as a function of the distance . The data was well described by , with 42 mm/s (solid line). (E) Fit parameters and for the fits shown in (B and C) as solid lines, as well as the approximation for the fluid-jet half aperture .
Figure 2—figure supplement 2

Geometrical characteristics of a fluid jet.
(A) Visualization of a fluid jet using a solution containing a dye (Coomassie Brilliant Blue). To enhance contrast, a background image was recorded in the absence of the fluid-jet pipette and subtracted to the image of the fluid jet, resulting in the image shown here. The angle between the horizontal axis and the edge of the cone defines the half-aperture of the cone, noted . Command voltage of −60 V. (B) Schematic representation of a calibration fiber intersecting a fluid jet over a length , in which is the diameter of the pipette, is the distance from the pipette to the fibre and is the half-aperture of the fluid jet, as defined in (A). This length and the diameter of the cylindrical fiber is used to calculate the effective hydrodynamic radius of the fiber (see Materials and methods in the main text). (C) Half-aperture as a function of the command voltage to the fluid-jet device, for pipette diameters ranging between 3–5 µm (light gray circles; n = 3), 5–7 µm (gray triangles; n = 5) and 7–9 µm (black squares; n = 3). Error bars correspond to mean values ± SEM. In practice, the maximal command voltage that we used to probe hair-bundle stiffness was 4 ± 0.3 V (mean ± SEM; n = 139). Over this range, the half-aperture of the fluid jet was nearly constant. We took a value of 22° for pipettes with a diameter of 3–5 µm and of 27° for pipettes with a diameter of 5–9µm.
Figure 2—figure supplement 3
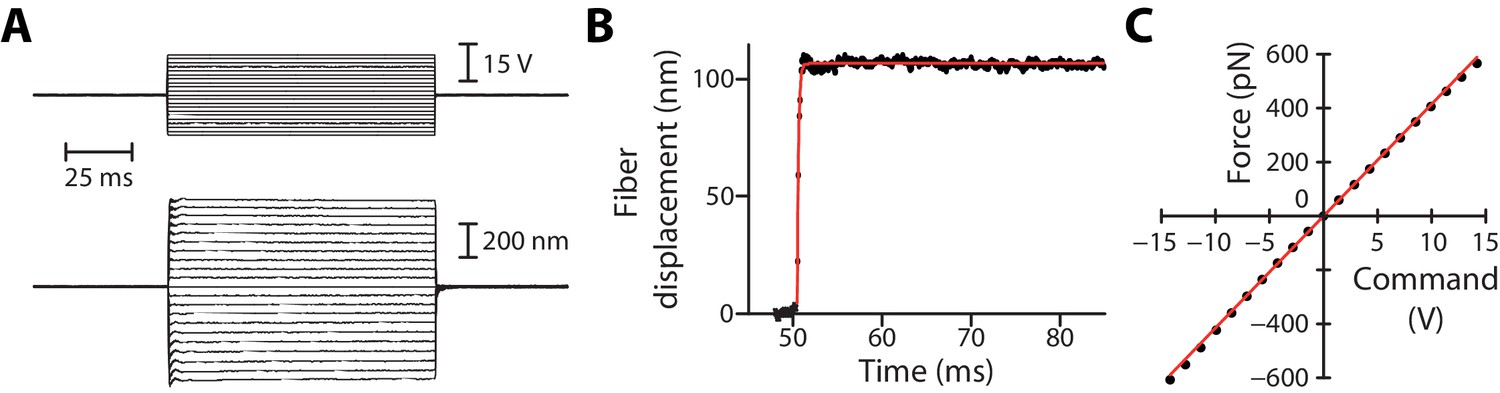
Rise time and linearity of the fluid-jet stimulus.
(A) Deflection of a flexible fiber (bottom) in response to a series of command-voltage steps (top) applied to the fluid-jet device. (B) The time course of fiber deflection was well described by a single exponential (red line) with a time constant of 155 µs, corresponding to a rise time (5–95%) of 465 µs. This time constant was set by the relaxation time 160 µs of the fiber, in which kF = 1.1 mN/m and λF = 173 nN·s/m were the stiffness and friction coefficient of the fiber, respectively. (C) Force on the fiber as a function of the command voltage to the fluid jet. The slope of the linear relation (linear fit in red) provided the calibration constant , here 42 pN/V. Same data as in (A and B).
Figure 2—figure supplement 4
Test of fluid-jet calibration in the frog’s sacculus.
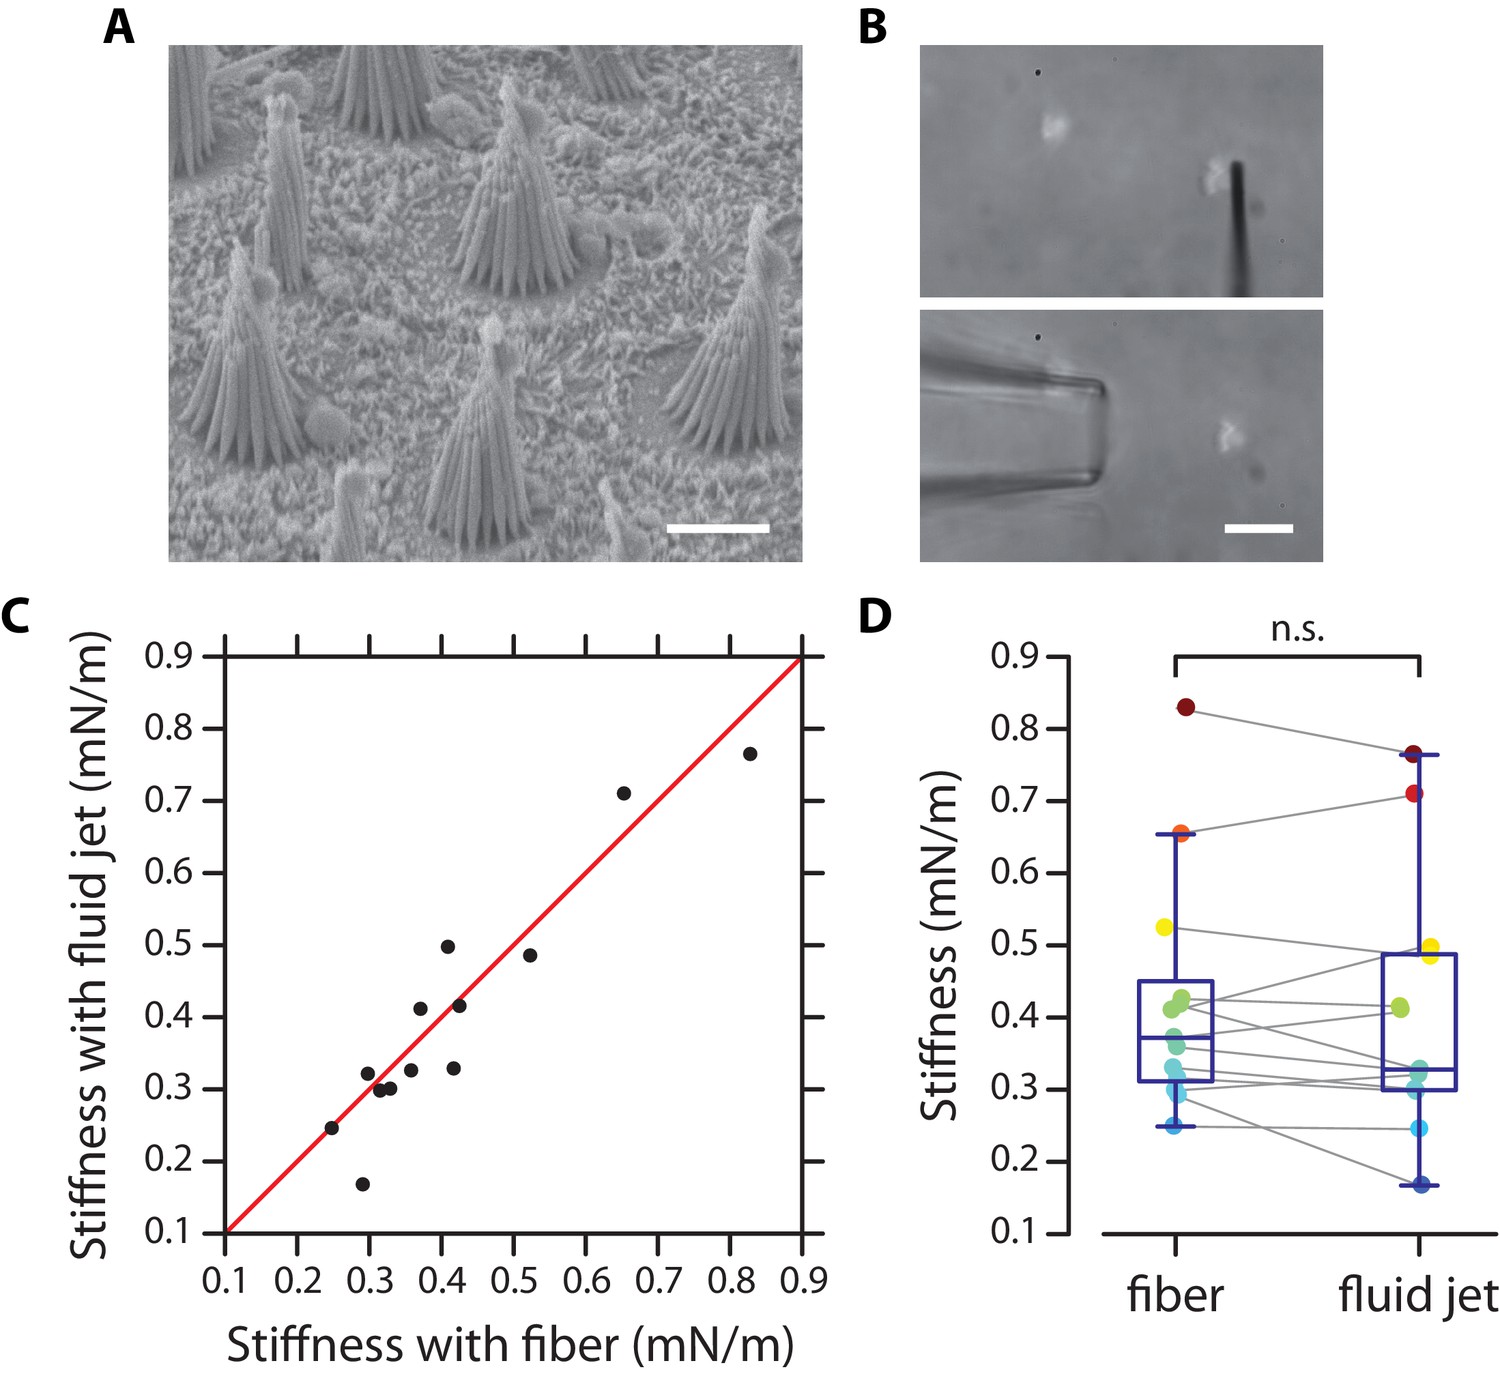
(A) Electron micrograph of hair bundles from a sacculus of the frog (strain ‘Rivan92’ of Rana ridibunda). (B) Micrograph of a hair bundle ready to be stimulated by a flexible fiber (top) or by a fluid jet (bottom). (C) The stiffness estimated from fluid-jet stimulation is here plotted as a function of that estimated from fiber stimulation for a sample of 13 hair bundles. The red line has a slope unity. (D) The same data as that shown in (C) is represented here as box plots on top of the data points for each method of mechanical stimulation. Grey lines connect stiffness estimates for the same hair bundles. The mean values of both distributions, 0.40 ± 0.17 mN/m (mean ± SD; median: 0.33 mN/m) and 0.42 ± 0.16 mN/m (mean ± SD; median: 0.37 mN/m) for fluid-jet stimulation and fiber stimulation, respectively, are not statistically different (paired-sample t-test). Scale bars in (A–B) 5 µm.
Figure 2—figure supplement 5
Mechanical creep during a force step.
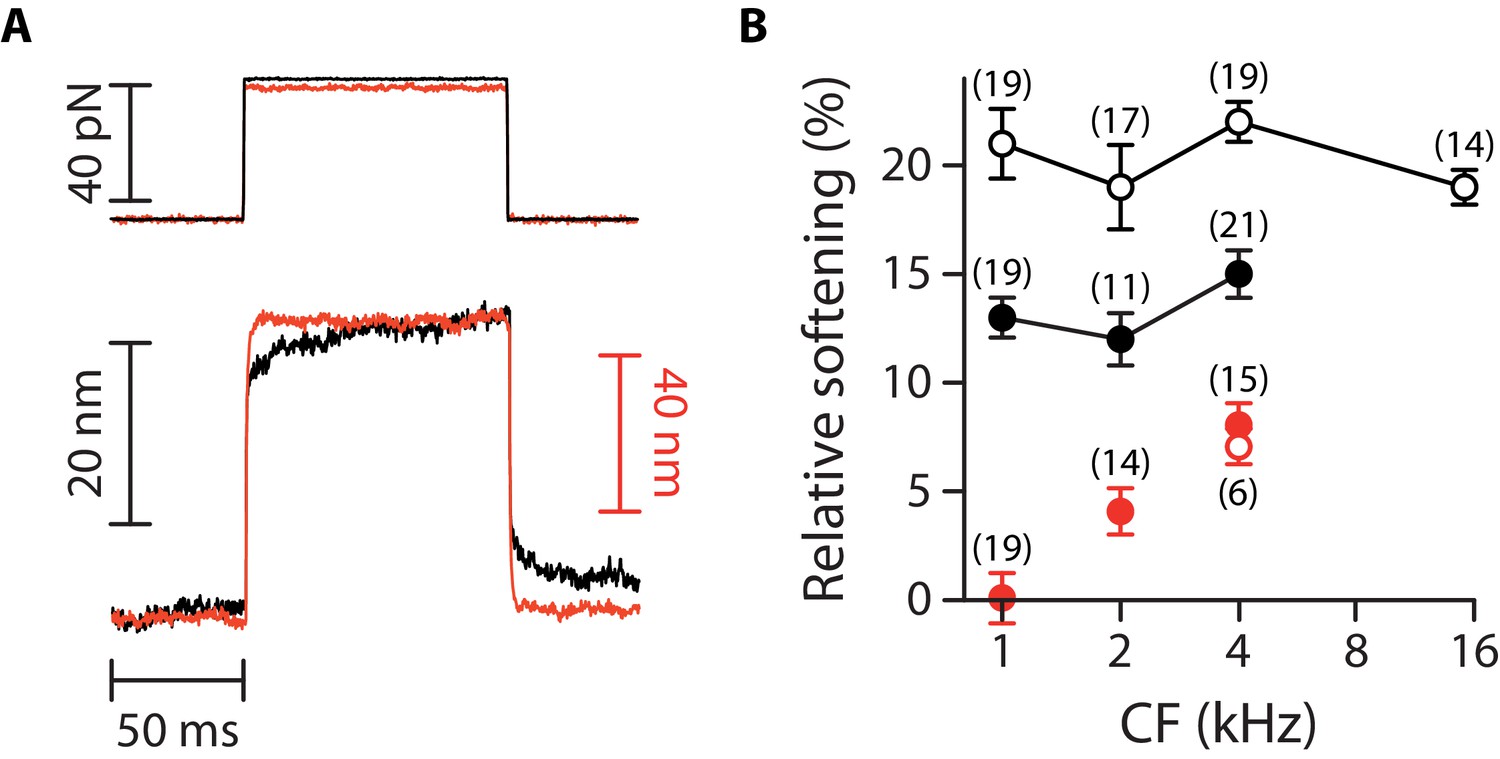
(A) Hair-bundle displacement (bottom) in response to a force step (top) before (black) and after (red) tip-link disruption, here for two different outer hair cells at the same cochlear location. With intact tip links (black), the hair bundles showed a mechanical creep corresponding to a motion in the direction of the applied force over the duration of the stimulus. Remarkably, the mechanical creep was abolished by tip-link disruption (red), suggesting that the creep was associated with mechanical adaptation (Hudspeth and Gillespie, 1994). (B) Relative softening associated with the mechanical creep for inner (circles) and outer (disks) hair cells before (black) and after (red) tip-link disruption. Here, and correspond to the hair-bundle stiffness measured 5–10 ms and 70–90 ms after the onset of the force step, respectively. To disrupt the tip links, the hair cells were here immersed for 15 min in a standard saline supplemented with 5-mM EDTA. The mechanical responses were then measured in standard saline. Error bars correspond to mean values ± SEM, with the number of cells indicated on the figure.
Figure 3 with 3 supplements
Stiffness gradients of the gating springs and of the stereociliary pivots.
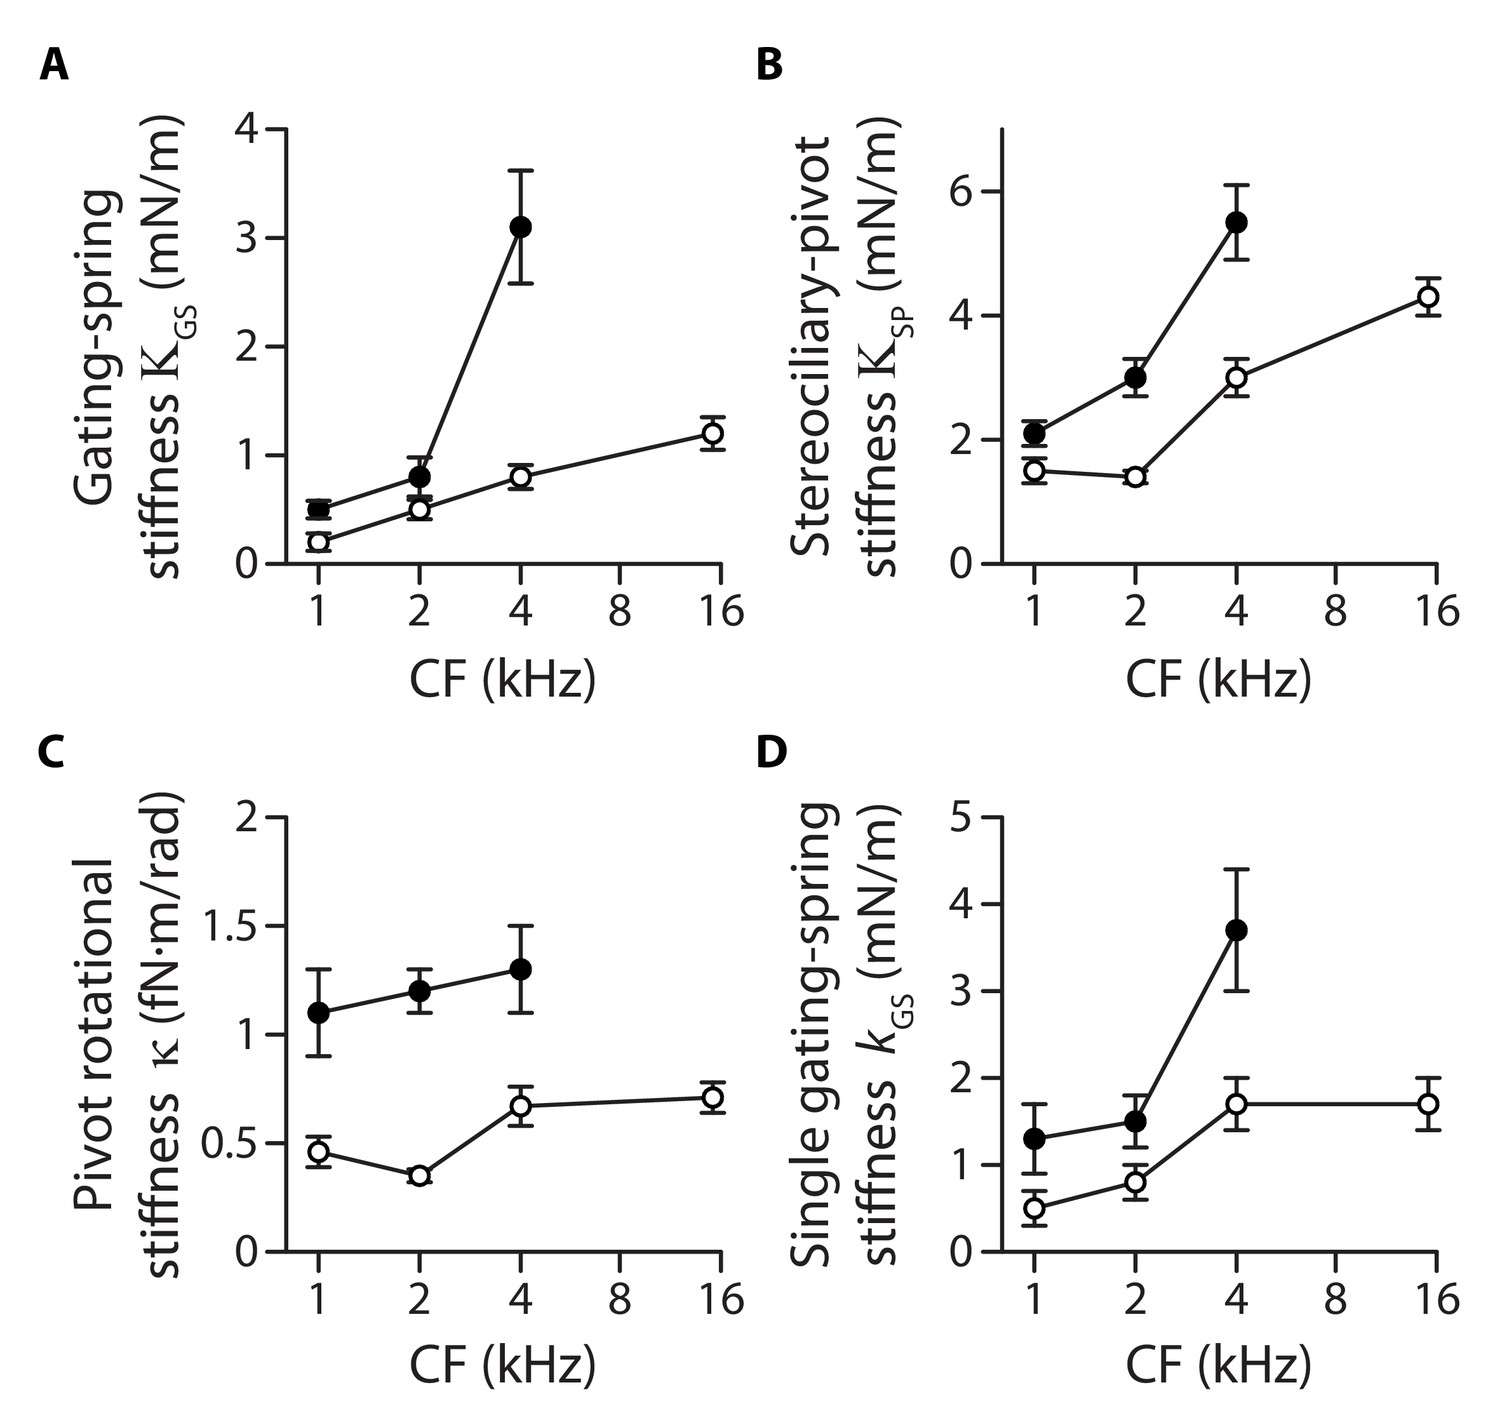
Stiffness (A) of the contribution of the gating springs (), (B) of a hair bundle after tip-link disruption, corresponding to the contribution of the stereociliary pivots (), (C) of a single stereociliary pivot (), and (D) of a single gating spring () as a function of the characteristic frequency (CF) for inner (white disks) and outer (black disks) hair cells. These stiffnesses were calculated from measured values of the hair-bundle stiffness (Figure 2), the amplitude ratio of hair-bundle movements before and after tip-link disruption (Figure 3—figure supplement 1), the hair-bundle height and the number of stereocilia (Figure 3—figure supplement 2), and the average number of intact tip links (Figure 3—figure supplement 3). Each data point is the mean ± SEM; SEMs were calculated as described in the Materials and methods.
-
Figure 3—source data 1
Morphological parameters of inner and outer hair-cell bundles.
Data correspond to mean values ± SEM, with the number of cells indicated in parentheses. The width and height of the hair bundle are used to calculate an effective hydrodynamic radius (see Equation (1) in Materials and methods) and plotted as a function of the hair cell’s characteristic frequency in Figure 3—figure supplement 2.
- https://doi.org/10.7554/eLife.43473.015
-
Figure 3—source data 2
Statistical significance.
The table lists p-values resulting, respectively, from a one-way ANOVA to assay statistical significance of the measured mean-value variation of a given variable between different cochlear locations for inner (IHC) and outer (OHC) hair cells, from two-tailed unpaired Student's t-tests with Welch’s correction to compare mean values of the variable between two groups of a given hair-cell type (IHC or OHC) with different characteristic frequencies (CF) or between the two cell types (OHC/IHC) when they are associated to the same characteristic frequency. The last entry provides the p-value to assay the statistical significance between the slopes of a weighted linear regression of the relation between the variable and the characteristic frequency of the hair cell. A bold font was used to help find statistically significant differences. The variables in the table correspond to the relative contribution and the absolute contribution of the gating springs to the hair-bundle stiffness, the contribution of the stereociliary pivots to the hair-bundle stiffness, the rotational stiffness of a single stereocilium, and the stiffness of a single gating spring.
- https://doi.org/10.7554/eLife.43473.016
-
Figure 3—source data 3
Gating-spring contribution to the hair-bundle stiffness.
- https://doi.org/10.7554/eLife.43473.017
-
Figure 3—source data 4
Hair-bundle morphology along the tonotopic axis.
- https://doi.org/10.7554/eLife.43473.018
-
Figure 3—source data 5
Transduction currents and number of intact tip links along the tonotopic axis.
- https://doi.org/10.7554/eLife.43473.019
Figure 3—figure supplement 1

Gating-spring contribution to the hair-bundle stiffness.
We measured the amplitude of the hair-bundle movement evoked by a sinusoidal fluid-jet stimulus before (amplitude ) and after (amplitude ) application of EDTA iontophoresis (see an example in Figure 4A of the main text). The ratio is here plotted as a function of characteristic frequency (CF) for inner (white disks) and outer (black disks) hair cells. Because EDTA disrupted the tip links, the ratio quantifies the contribution of the gating springs to the stiffness of an intact bundle; the complementary ratio, , represents the relative contribution of the stereociliary pivots, of stiffness . Error bars correspond to mean values ± SEM, with the number of cells indicated on the figure. These experiments were performed in low-Ca2+ saline.
Figure 3—figure supplement 2
Hair-bundle morphology along the tonotopic axis.
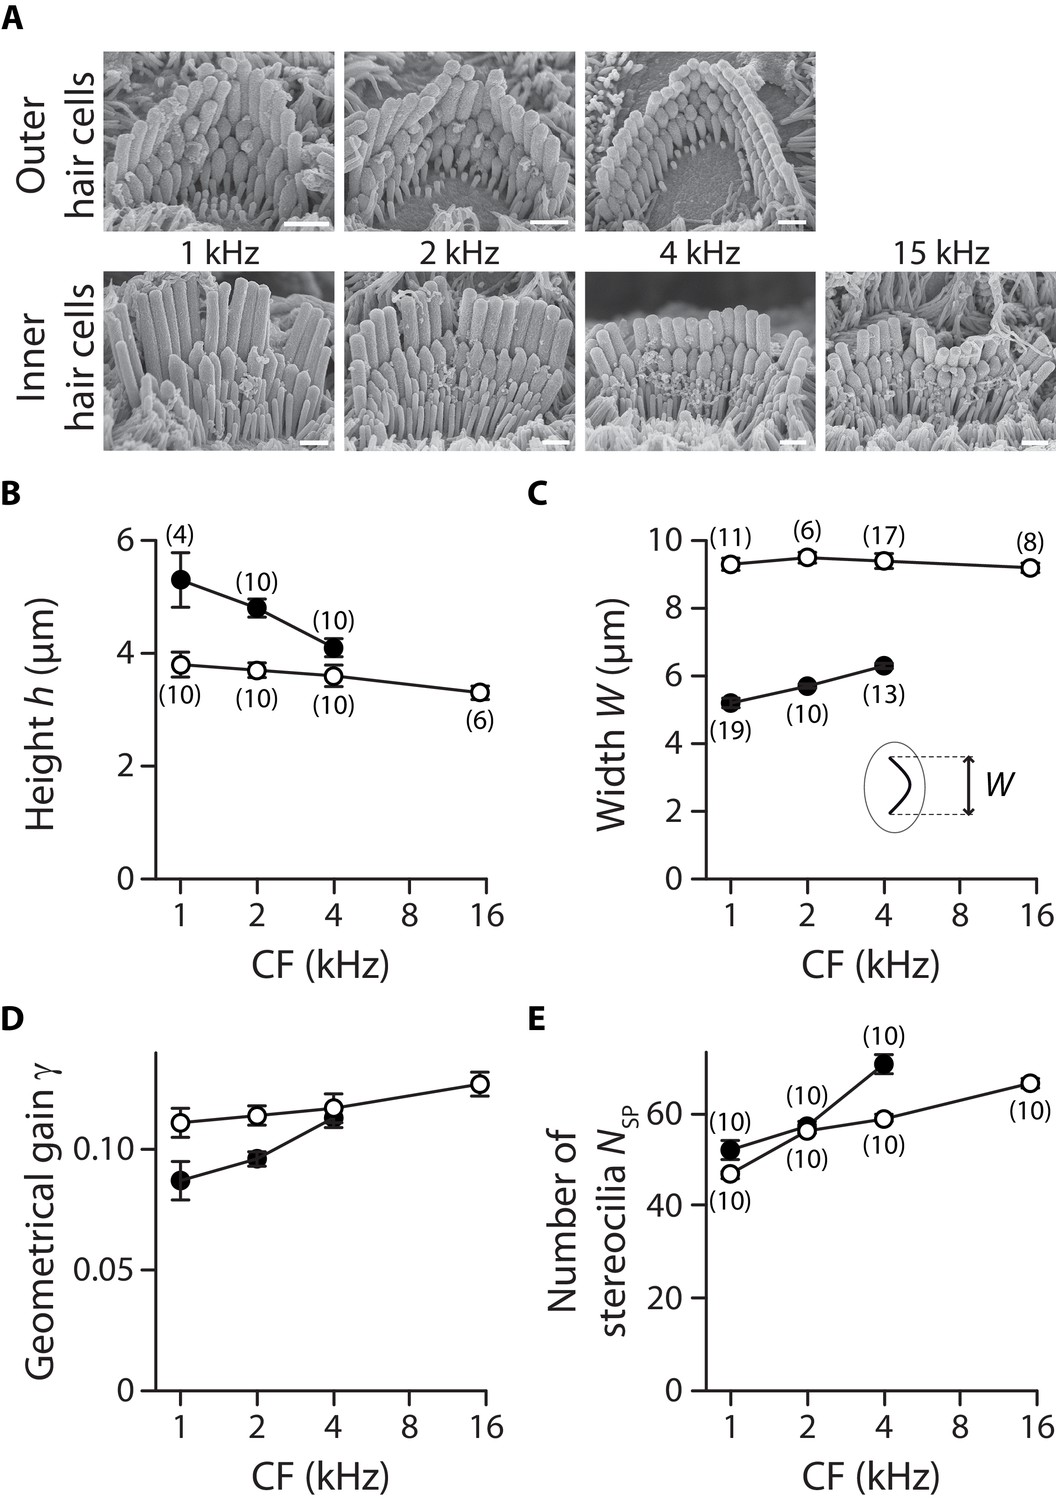
We used electron microscopy to count the number of stereocilia in a hair bundle. To avoid dehydration artefacts, we used instead optical microscopy to measure the width and height of the hair bundle. To measure width, the hair bundle was visualized from above (Figure 1). To measure height, the hair bundle was visualized from the side after it had been pushed against the apical surface of the hair cell with a glass rod. (A) Electron micrographs of typical outer (top row) and inner (bottom row) hair cells at cochlear locations corresponding to characteristic frequencies indicated on the figure. Tension in the tip links results in stereociliary tips with a prolate shape, which is also indicative of tip-link orientation. Scale bars: 1 µm. The height (B), width (C), geometrical gain (D), and number of stereocilia (E) of a hair bundle are plotted as a function of the characteristic frequency (CF) for inner (white disks) and outer (black disks) hair cells. In panel (C), the inset shows a schematic top view of a hair bundle and indicates how the bundle’s width was measured. The geometrical gain was calculated as the ratio of the interstereociliary spacing and the hair-bundle height, assuming an interstereociliary spacing of 462 nm for all outer hair cells and 420 nm for all inner hair cells. The error bars in (B), (C) and (E) represent standard errors of the means with numbers of cells indicated between brackets; in (D), error bars are calculated as described in the Materials and methods.
Figure 3—figure supplement 3
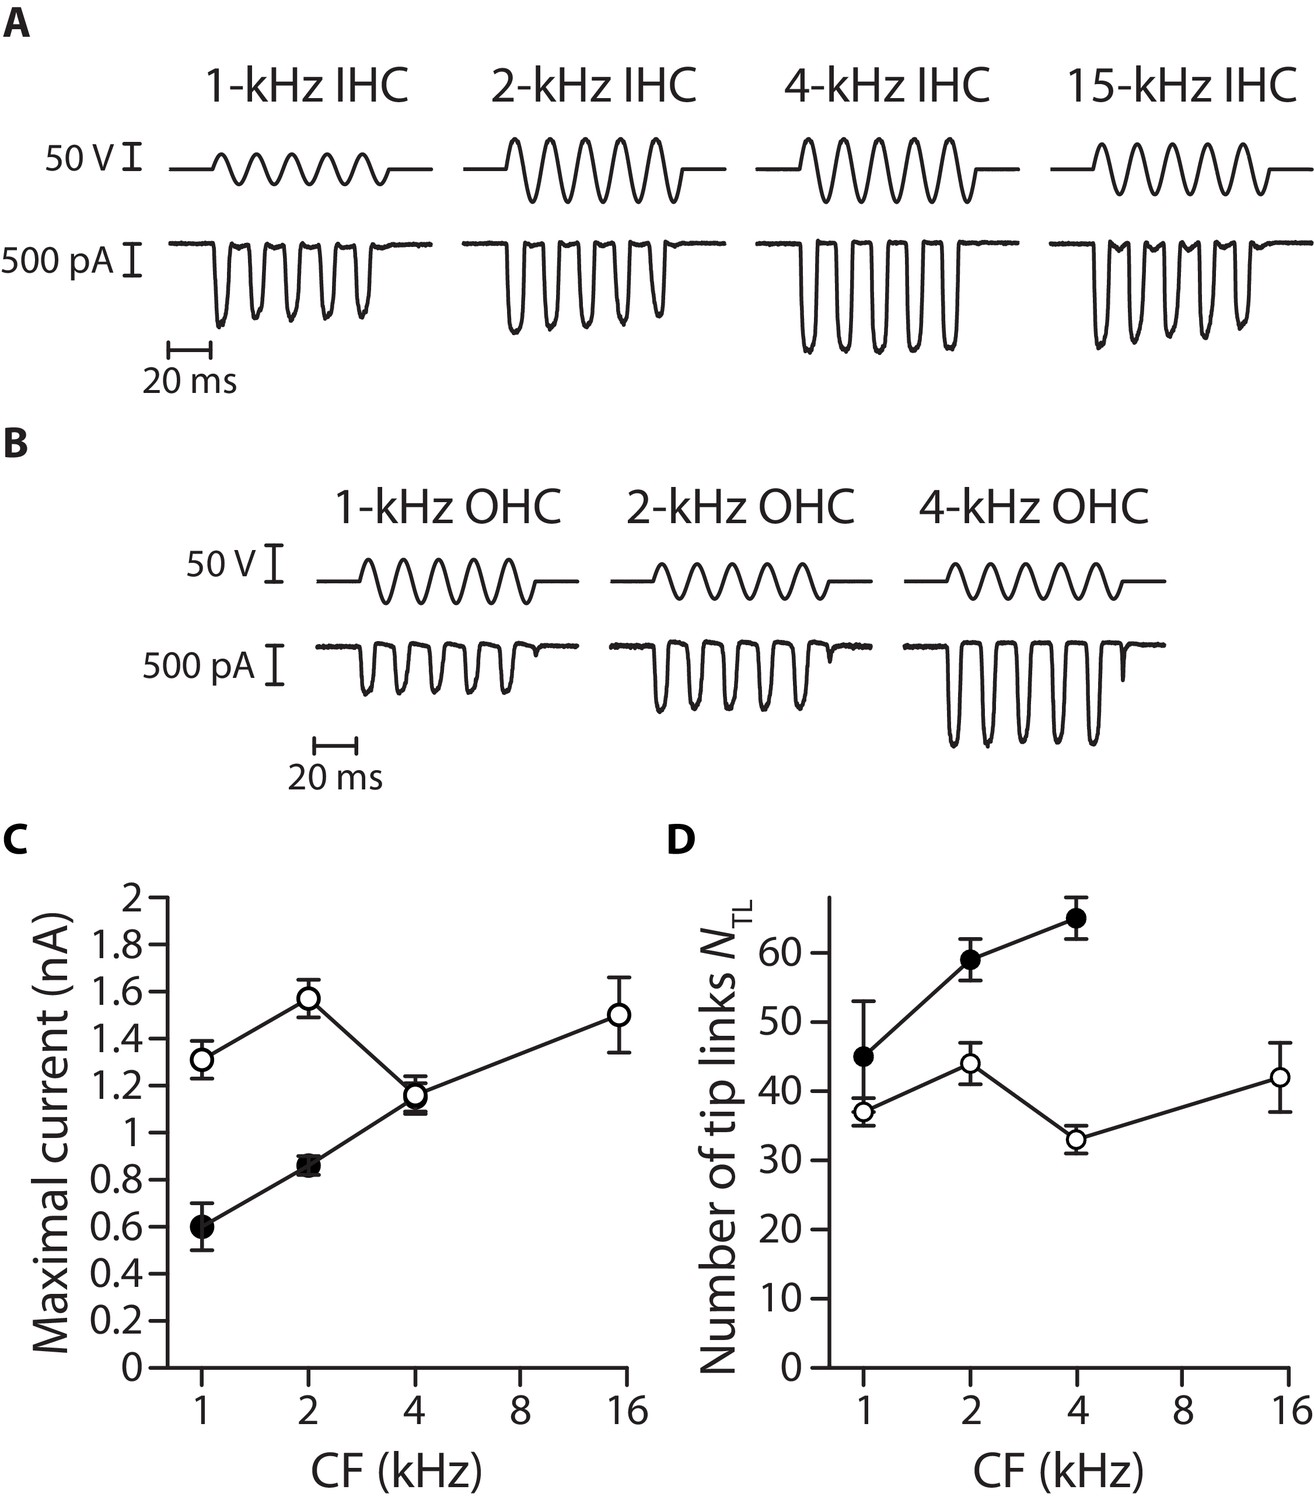
Transduction currents and number of intact tip links along the tonotopic axis.
A large mechanical stimulus (top; fluid-jet voltage command) was applied to the hair bundle to estimate the magnitude of the transduction current (bottom) at saturation in inner hair cells (A) and outer hair cells (B) along the tonotopic axis of the cochlea. Maximal current (C) and estimated number of tip links ((D); see Materials and methods) are plotted as a function of the characteristic frequency (CF) for inner (white disks) and outer (black disks) hair cells. Error bars correspond to mean values ± SEM, with n = 10 cells for all data points. In panels (A and B), the hair cell’s characteristic frequency is indicated above each recording; the frequency of stimulation was 60 Hz. In these experiments, the hair cells were immersed in standard saline at a Ca2+ concentration of 1.5 mM.
Figure 4
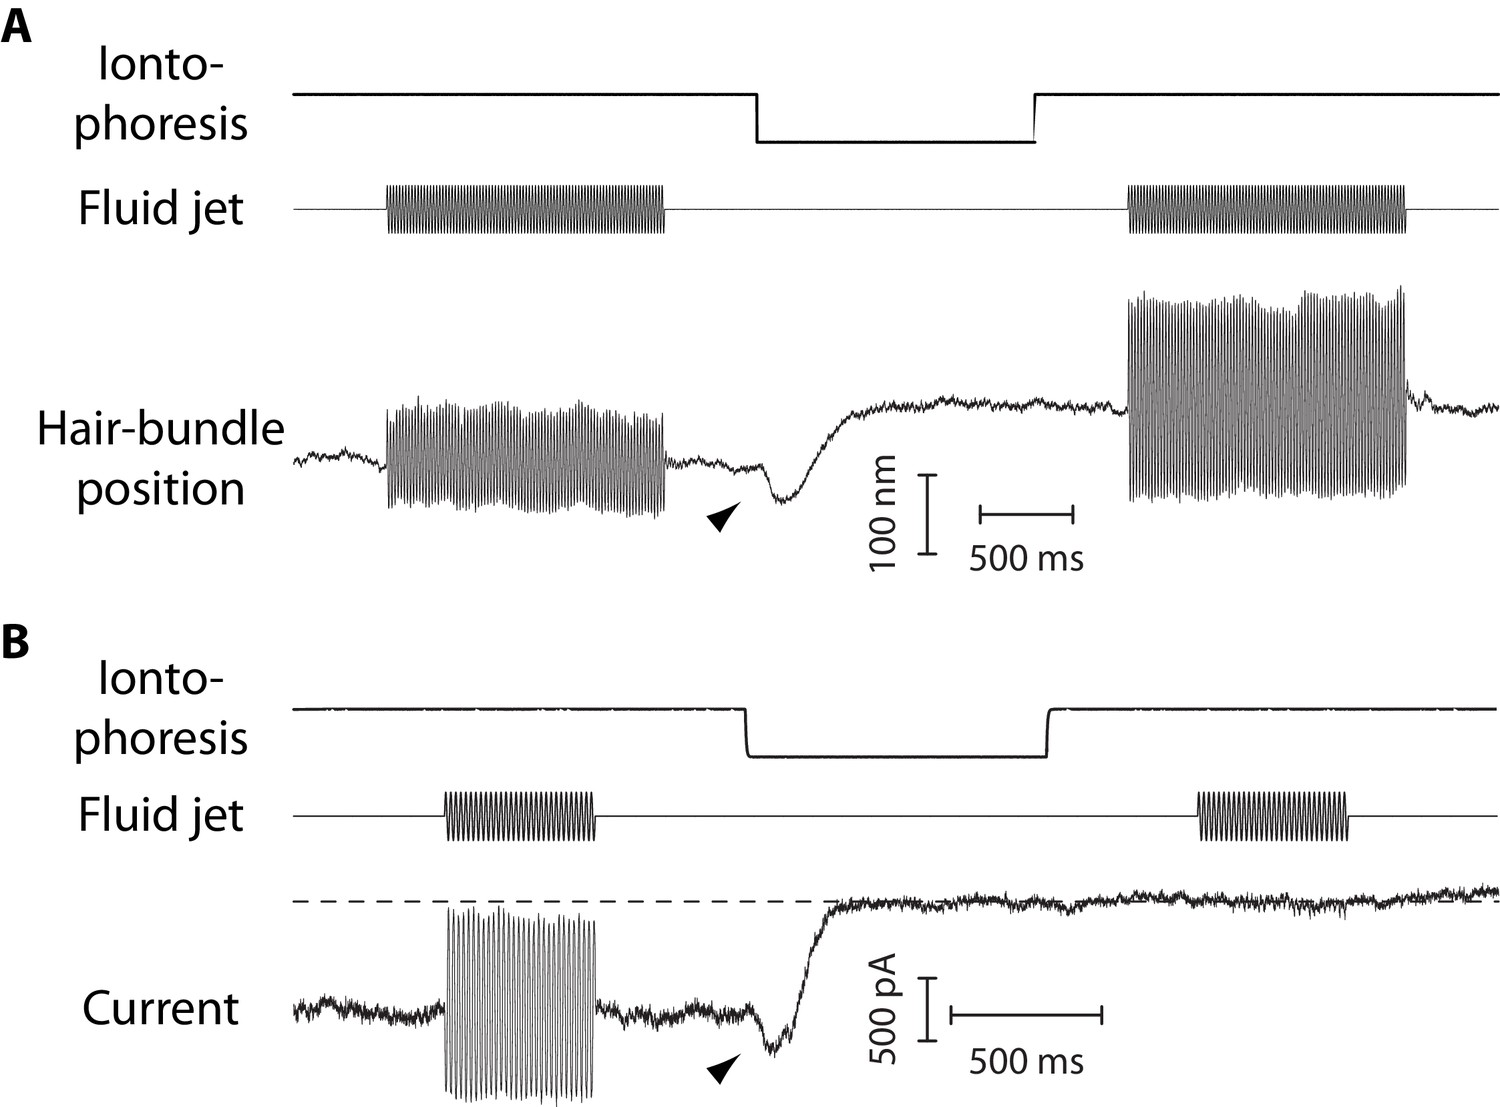
Mechanical and electrical response of a hair bundle to fluid-jet stimulation and fast calcium chelation.
(A) An iontophoretic step of a calcium chelator (EDTA; top) elicited a biphasic movement of the hair bundle from an inner hair cell (bottom): the hair bundle first moved in the negative direction (arrowhead) and then in the positive direction. After iontophoresis, the position baseline was offset by +78 nm with respect to the resting position at the start of the experiment. A sinusoidal command to a fluid jet (middle) evoked hair-bundle movements (bottom) that increased in magnitude, here by 50%, after application of the iontophoretic step. Repeating the iontophoretic step elicited no further movement and the response to fluid-jet stimulation remained of the same magnitude. A similar behavior was observed with 101 inner and 44 outer hair cells. (B) An iontophoretic step of EDTA (top) also elicited biphasic variations of the transduction current: the inward current first increased (arrowhead) and then decreased. Before application of the calcium chelator, fluid-jet stimulation evoked a transduction current of 1.5-nA peak-to-peak magnitude; the open probability of the transduction channels was near ½. The transduction current was abolished by the iontophoretic step. Outer hair cell at the 4-kHz location; the same behaviour was observed with 17 outer hair cells. In (A–B), the command signal to the fluid-jet device was a 60-Hz sinusoid and we applied a −100-nA iontophoretic step on top of a +10-nA holding current. The hair bundles were exposed to 20-µM Ca2+. In (B), the dashed line indicates the current for which the transduction channels are all closed.
Figure 5
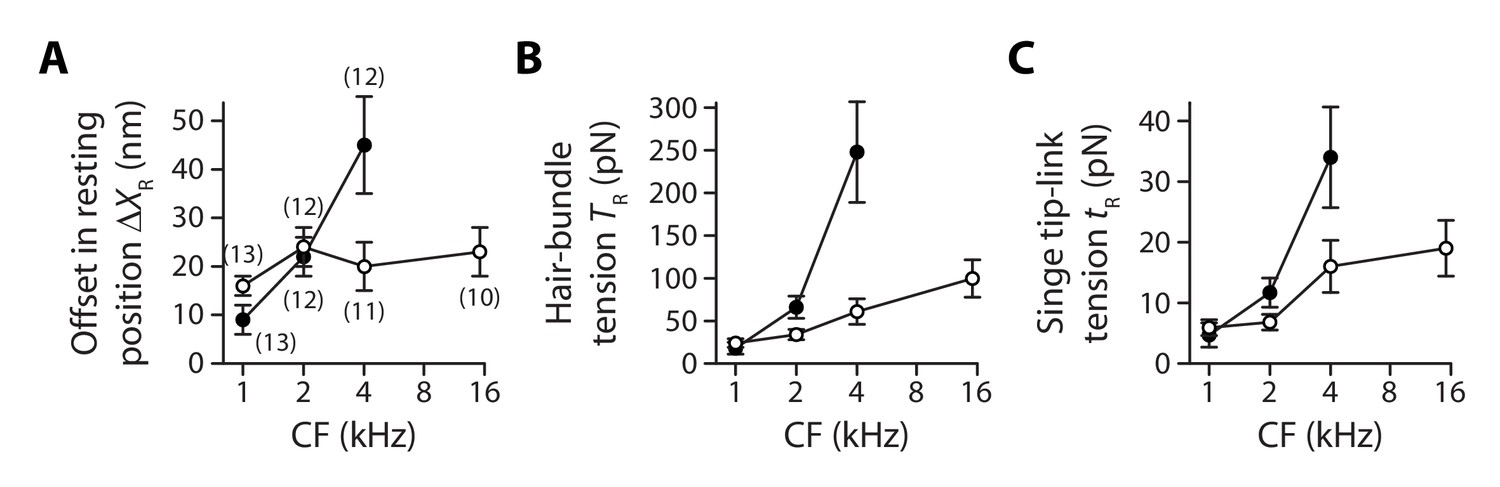
Gradients in tip-link tension at rest.
Offset in the resting position of a hair bundle resulting from tension release in the tip links (A), tip-link tension in the hair bundle (B) and tension along the oblique axis of a single tip link (C) as a function of the characteristic frequency (CF) for inner (white disks) and outer (black disks) hair cells. The hair-bundle tension (B) was calculated as the product of the stereociliary-pivot stiffness shown in Figure 3 and the data shown in (A); this tension is estimated along the bundle’s horizontal axis of mirror symmetry. The single tip-link tension was then deduced from the projection factor and the average number of intact tip links in a hair bundle (Figure 3—figure supplement 3). Each data point in (A) is the mean ± SEM with the number of cells indicated between brackets; in (B–C), mean values and SEMs were calculated as described in the Materials and methods.
-
Figure 5—source data 1
Statistical significance.
The table lists p-values resulting, respectively, from a one-way ANOVA to assay statistical significance of the measured mean-value variation of a given variable between different cochlear locations for inner (IHC) and outer (OHC) hair cells, from two-tailed unpaired Student's t-tests with Welch’s correction to compare mean values of the variable between two groups of a given hair-cell type (IHC or OHC) with different characteristic frequencies (CF) or between the two cell types (OHC/IHC) when they are associated to the same characteristic frequency. The last entry provides the p-value to assay the statistical significance between the slopes of a weighted linear regression of the relation between the variable and the characteristic frequency of the hair cell. A bold font was used to help find statistically significant differences. The variables in the table correspond to the net positive movement of the hair bundle evoked at steady state by tip-link disruption, the mechanical tension in the hair bundle, and the mechanical tension in a single gating spring.
- https://doi.org/10.7554/eLife.43473.022
-
Figure 5—source data 2
Offset in the resting position of a hair bundle upon tip-link disruption.
- https://doi.org/10.7554/eLife.43473.023
Figure 6

Tensioning of the tip links at decreased Ca2+ concentrations.
The amplitude of the negative hair-bundle movement (A), of the maximal increase in hair-bundle tension (B), and of the maximal tension in a single tip link (C) are plotted as a function of the hair cell’s characteristic frequency (CF). The tension increase in (B) was calculated from the stiffness of the stereociliary pivots (Figure 3B) and the data shown in (A). The single tip-link tension was then deduced from the tension at rest in a single tip link (Figure 5c), the projection factor (Figure 3—figure supplement 2) and the average number of intact tip links (Figure 3—figure supplement 3). (D) Current-step commands (top) applied to an iontophoretic pipette containing the Ca2+ chelator EDTA evoked reversible negative movements of the hair bundle (bottom). (E) When the stimulus (top) was long enough, the hair bundle position could reach a steady state (bottom), corresponding to higher resting tension in the tip links. In (A–C), the hair bundles were immersed in low-Ca2+ saline, for which EDTA iontophoresis led to tip-link disruption. Positions and tensions were estimated at the point of polarity reversal of the hair-bundle movement (see Figure 4A), thus at the initiation of tip-link disruption, where the hair bundle reached its largest deflection in the negative direction and tension was thus maximal. Black and white disks correspond to outer and inner hair cells, respectively. Each data point in (A) is the mean ± SEM with numbers of cells indicated between brackets; in (B–C), mean values and SEMs were calculated as described in the Materials and methods. In (D–E), the hair bundles were immersed in a saline containing 500-µM Ca2+; this higher Ca2+ concentration preserved the integrity of the tip links upon EDTA iontophoresis.
-
Figure 6—source data 1
Statistical significance.
The table lists p-values resulting, respectively, from a one-way ANOVA to assay statistical significance of the measured mean-value variation of a given variable between different cochlear locations for inner (IHC) and outer (OHC) hair cells, from two-tailed unpaired Student's t-tests with Welch’s correction to compare mean values of the variable between two groups of a given hair-cell type (IHC or OHC) with different characteristic frequencies (CF) or between the two cell types (OHC/IHC) when they are associated to the same characteristic frequency. The last entry provides the p-value to assay the statistical significance between the slopes of a weighted linear regression of the relation between the variable and the characteristic frequency of the hair cell. A bold font was used to help find statistically significant differences. The variables in the table correspond to the negative hair-bundle movement , the corresponding increase in hair-bundle tension , and the maximal tension in a single gating spring evoked by EDTA iontophoresis just before tip-link disruption.
- https://doi.org/10.7554/eLife.43473.025
-
Figure 6—source data 2
Negative movement ΔXCa of the hair-bundle before tip-link disruption.
- https://doi.org/10.7554/eLife.43473.026
Additional files
-
Transparent reporting form
- https://doi.org/10.7554/eLife.43473.027
Download links
A two-part list of links to download the article, or parts of the article, in various formats.
Downloads (link to download the article as PDF)
Open citations (links to open the citations from this article in various online reference manager services)
Cite this article (links to download the citations from this article in formats compatible with various reference manager tools)
Stiffness and tension gradients of the hair cell’s tip-link complex in the mammalian cochlea
eLife 8:e43473.
https://doi.org/10.7554/eLife.43473


