Single-cell expression profiling reveals dynamic flux of cardiac stromal, vascular and immune cells in health and injury
- Victor Chang Cardiac Research Institute, Australia
- University of Melbourne, Australia
- Garvan Institute of Medical Research, Australia
- UNSW Sydney, Australia
- University of Sydney, Westmead Hospital, Australia
Figures
Figure 1 with 8 supplements
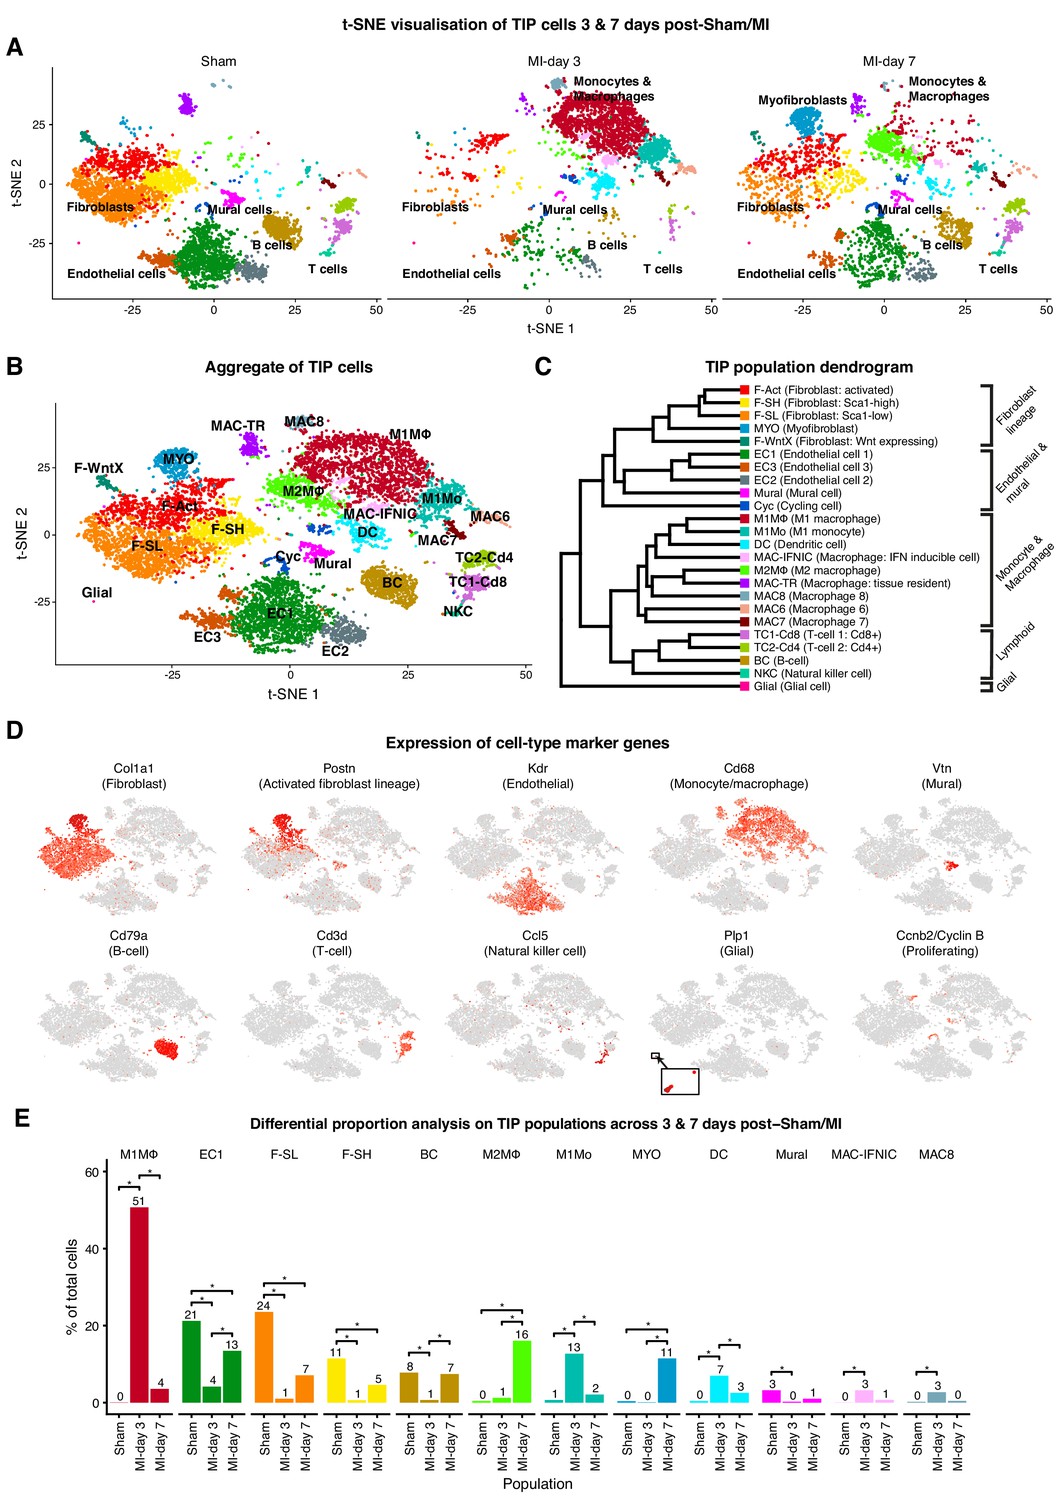
TIP scRNA-seq.
(A) t-SNE plots showing detected lineages and sub-populations in TIP across conditions. (B) t-SNE plot of aggregate TIP cells with identified sub-populations. (C) Dendrogram of sub-populations according to average RNA expression. (D) Expression of select marker genes across TIP cells as visualized on t-SNE plots. (E) Cell population percentages across conditions determined to be significantly modulated according to Differential Proporation Analysis (DPA) (p<0.01).
-
Figure 1—source data 1
Source data for FACS quantifications summarized in Figure 1—figure supplement 6D,E and Figure 1—figure supplement 7B,C.
- https://doi.org/10.7554/eLife.43882.012
Figure 1—figure supplement 1

Experimental procedures, population proportions and gene expression characterstics of sub-populations within TIP scRNA-seq.
(A) Diagram of experimental procedures. (B) Percentage of total cells in each cell-population according to experimental condition. (C) Percentage of total cells in clusters as grouped together according to high-level cell type and as according to experimental condition. (D) Dot plot showing expression of top upregulated genes across TIP populations. (E, F) Box plot showing number of UMIs (E) and genes (F) detected across TIP sub-populations after quality control filtering.
Figure 1—figure supplement 2
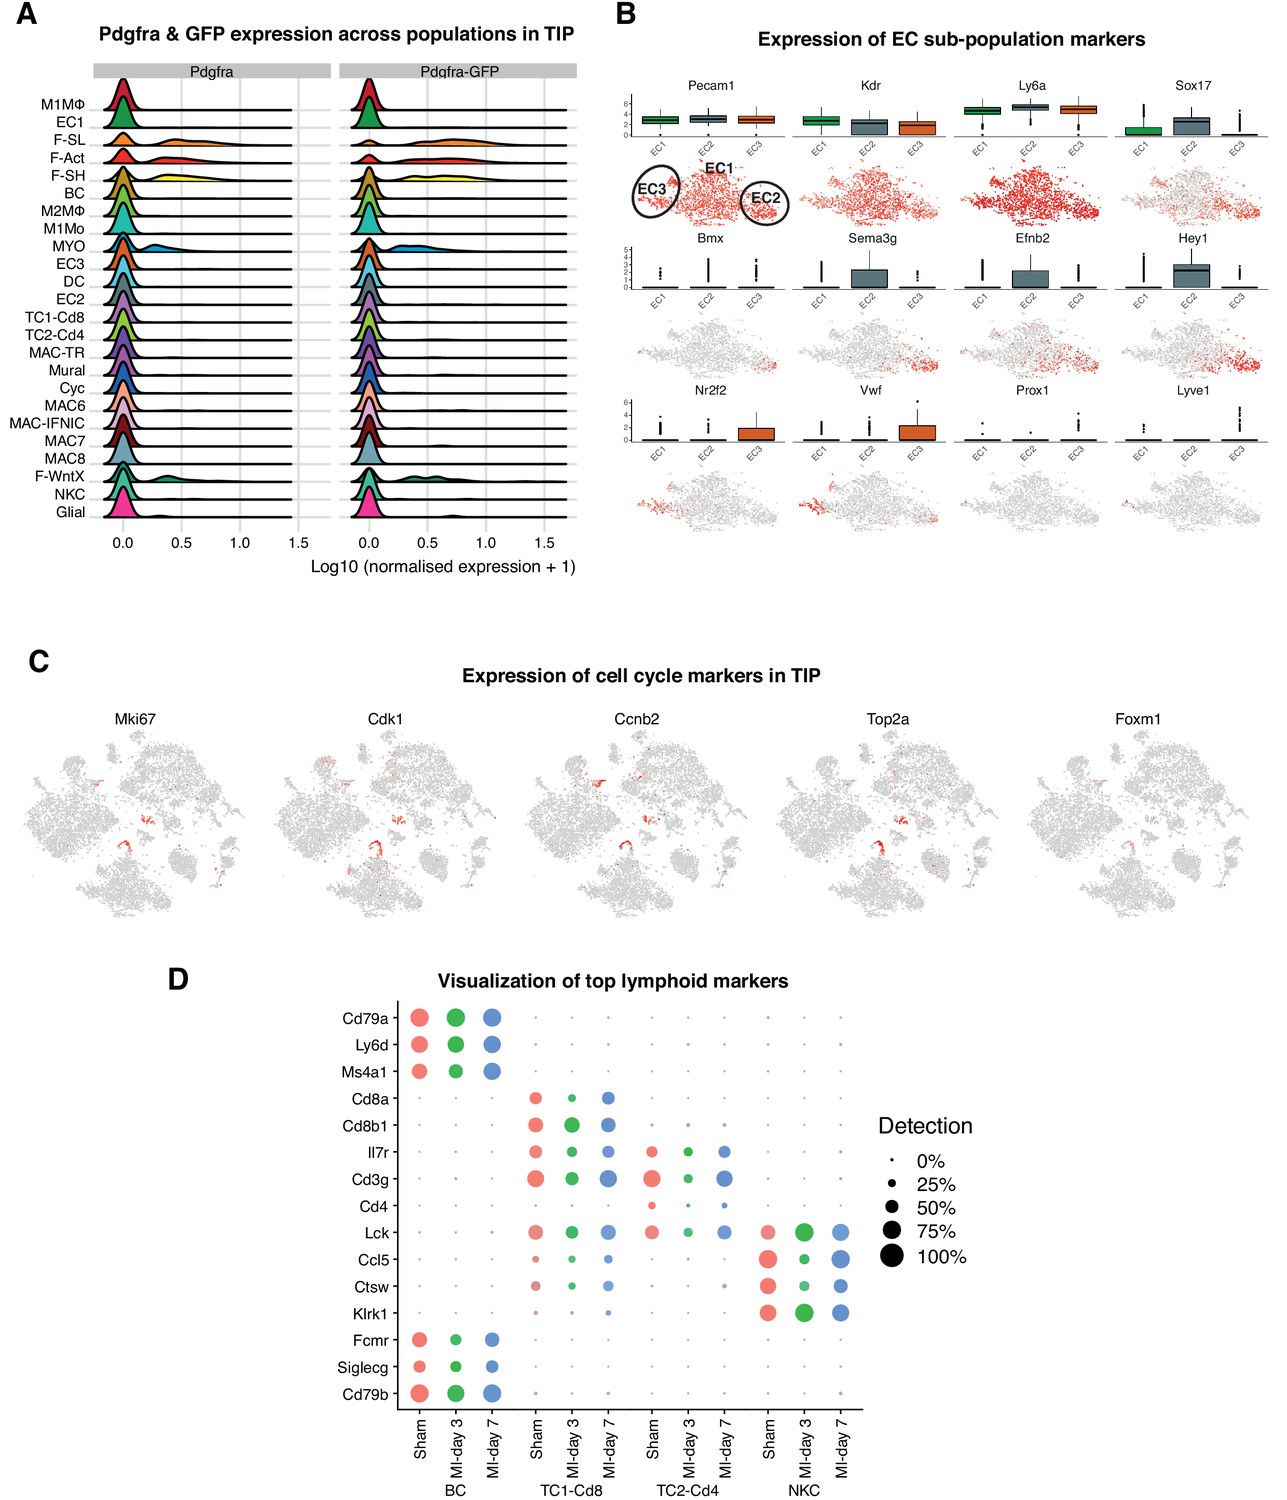
Gene expression data for TIP sub-populations.
(A) Distribution of Pdgfra and Pdgfra-GFP expression across cell populations in TIP. (B) Expression of selected endothelial markers as visualized in box and t-SNE plots. (C) Expression of selected cell cycle marker genes on t-SNE plots. (D) Dot plot visualization according to condition of top marker genes for lymphoid lineage populations.
Figure 1—figure supplement 3
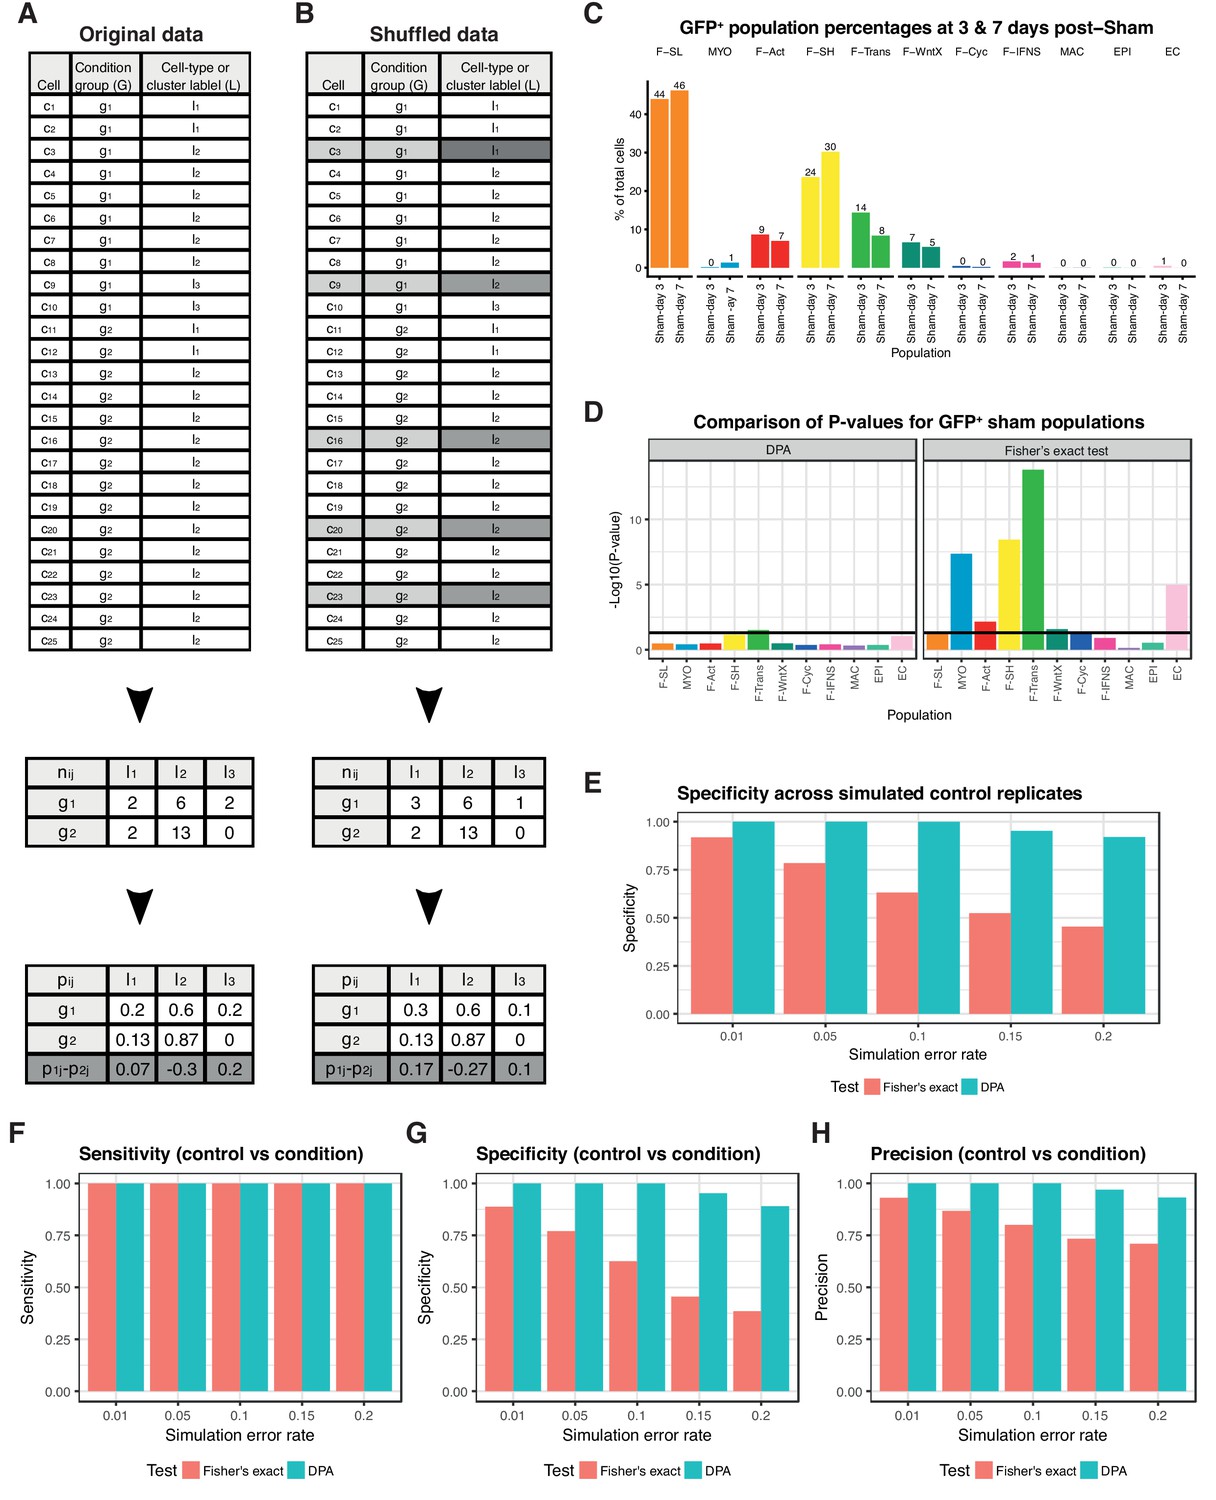
Differential proportion analysis (DPA) procedure and evaluation.
(A,B) Procedure for performing DPA. (C) Percentage of cell populations between sham conditions from GFP+ cohort. (D) Comparisons of p-values from Fisher’s exact test and DPA for evaluating proportion changes between sham experiments. (E) Comparisons of specificity for Fisher’s exact test and DPA on control replicate simulation experiment. (F–H) Sensitivity, specificity and precision for simulated control vs condition experiments with comparisons between Fisher’s exact test and DPA.
Figure 1—figure supplement 4
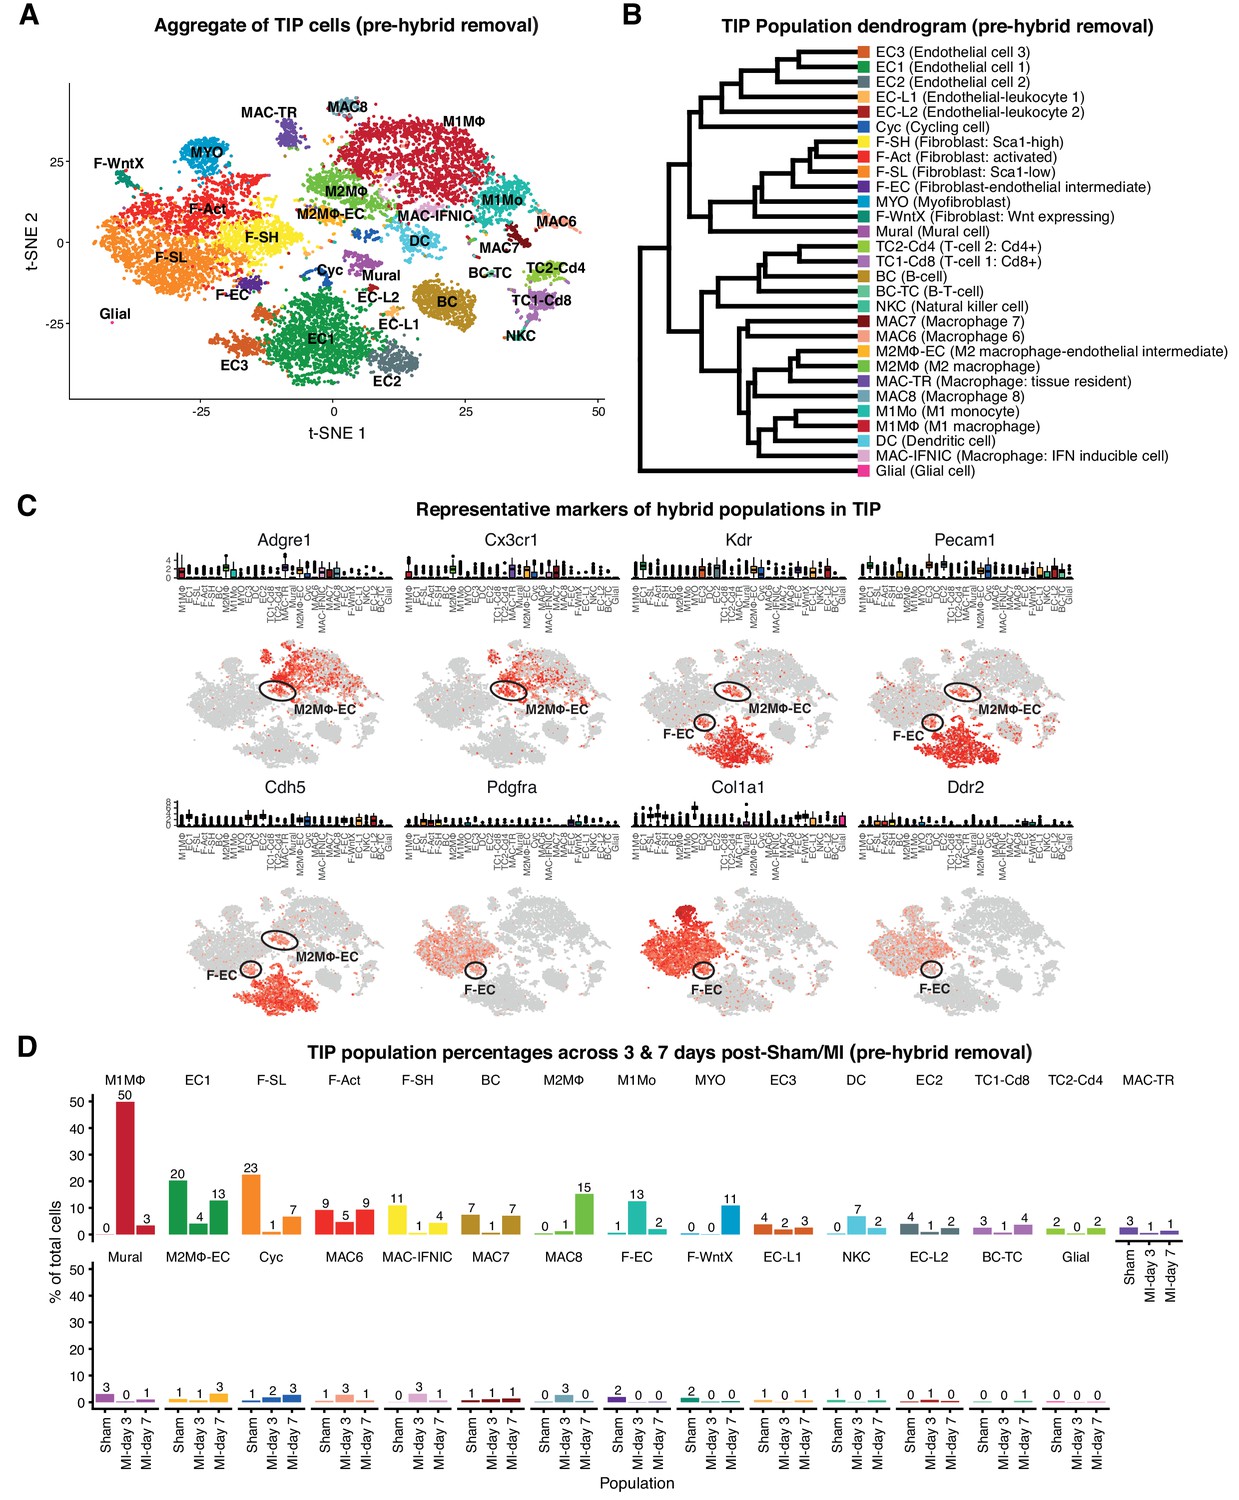
Clustering of TIP scRNA-seq prior to removal of minor hybrid populations.
(A) t-SNE plot of aggregate TIP cells with all identified 29 sub-populations prior to filtering of minor hybrid populations. (B) Dendrogram of all 29 sub-populations according to average RNA expression. (C) Expression of example marker genes that illustrate hybrid populations (F-EC, M2MΦ-EC, EC-L1, EC-L2 and BC-TC) as visualized in box and t-SNE plots. (E) Percentage of total cells in each sub-population according to experimental condition.
Figure 1—figure supplement 5
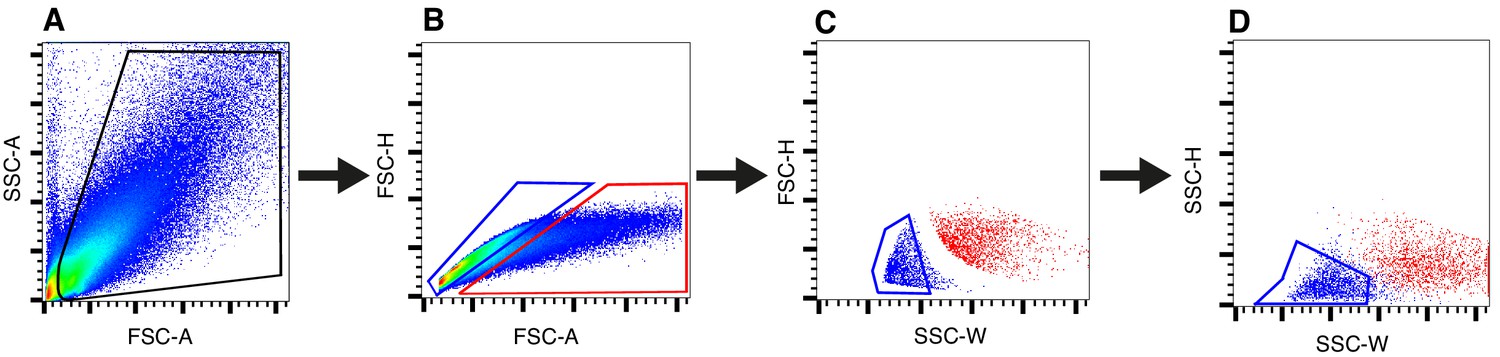
A typical workflow of sequential gating strategy for doublet exclusion is shown.
(A) Scatter gate, FSC-A vs SSC-A, was plotted to exclude cell debris; the three subsequent ‘doublet discrimination’ gating strategies to exclude doublets are: (B) FSC-H vs FSC-A plot, (C) FSC-H vs FSC-W and (D) SSC-H vs SSC-W. Blue and red gates depict ‘single cell’ and ‘doublet’ events, respectively. Only the cells in the blue gates were sorted and/or analyzed. The scatter profiles of putative doublets (red dots) are also illustrated in panel (C) and (D).
Figure 1—figure supplement 6
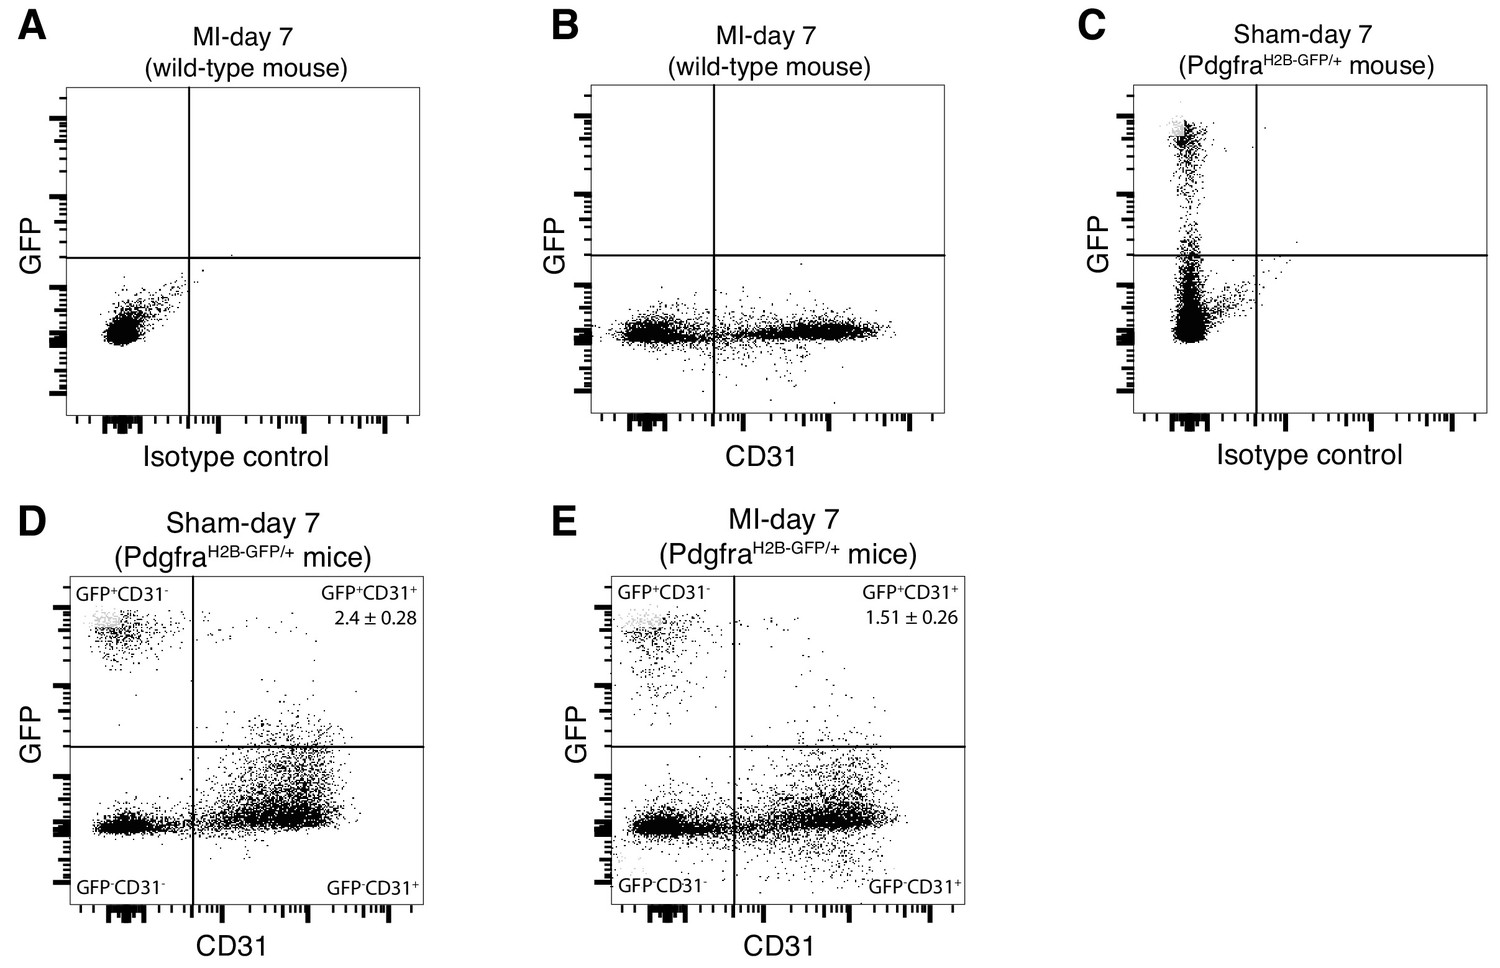
FACS data supporting F-EC population.
FACS plots showing expression of GFP or CD31 (axis label) in the (A) wild type sample stained with isotype control antibody; (B) wild type sample stained with anti-CD31 antibody; (C) PdfgraGFP/+ sample stained with isotype control antibody; (D, E) PdfgraGFP/+ sample stained with anti-CD31 antibody 7 days after Sham (D) or MI (E) surgery. Numbers indicate percentage of GFP+CD31+ double positive cells in live single cells in respective plot (mean numbers indicated).
Figure 1—figure supplement 7
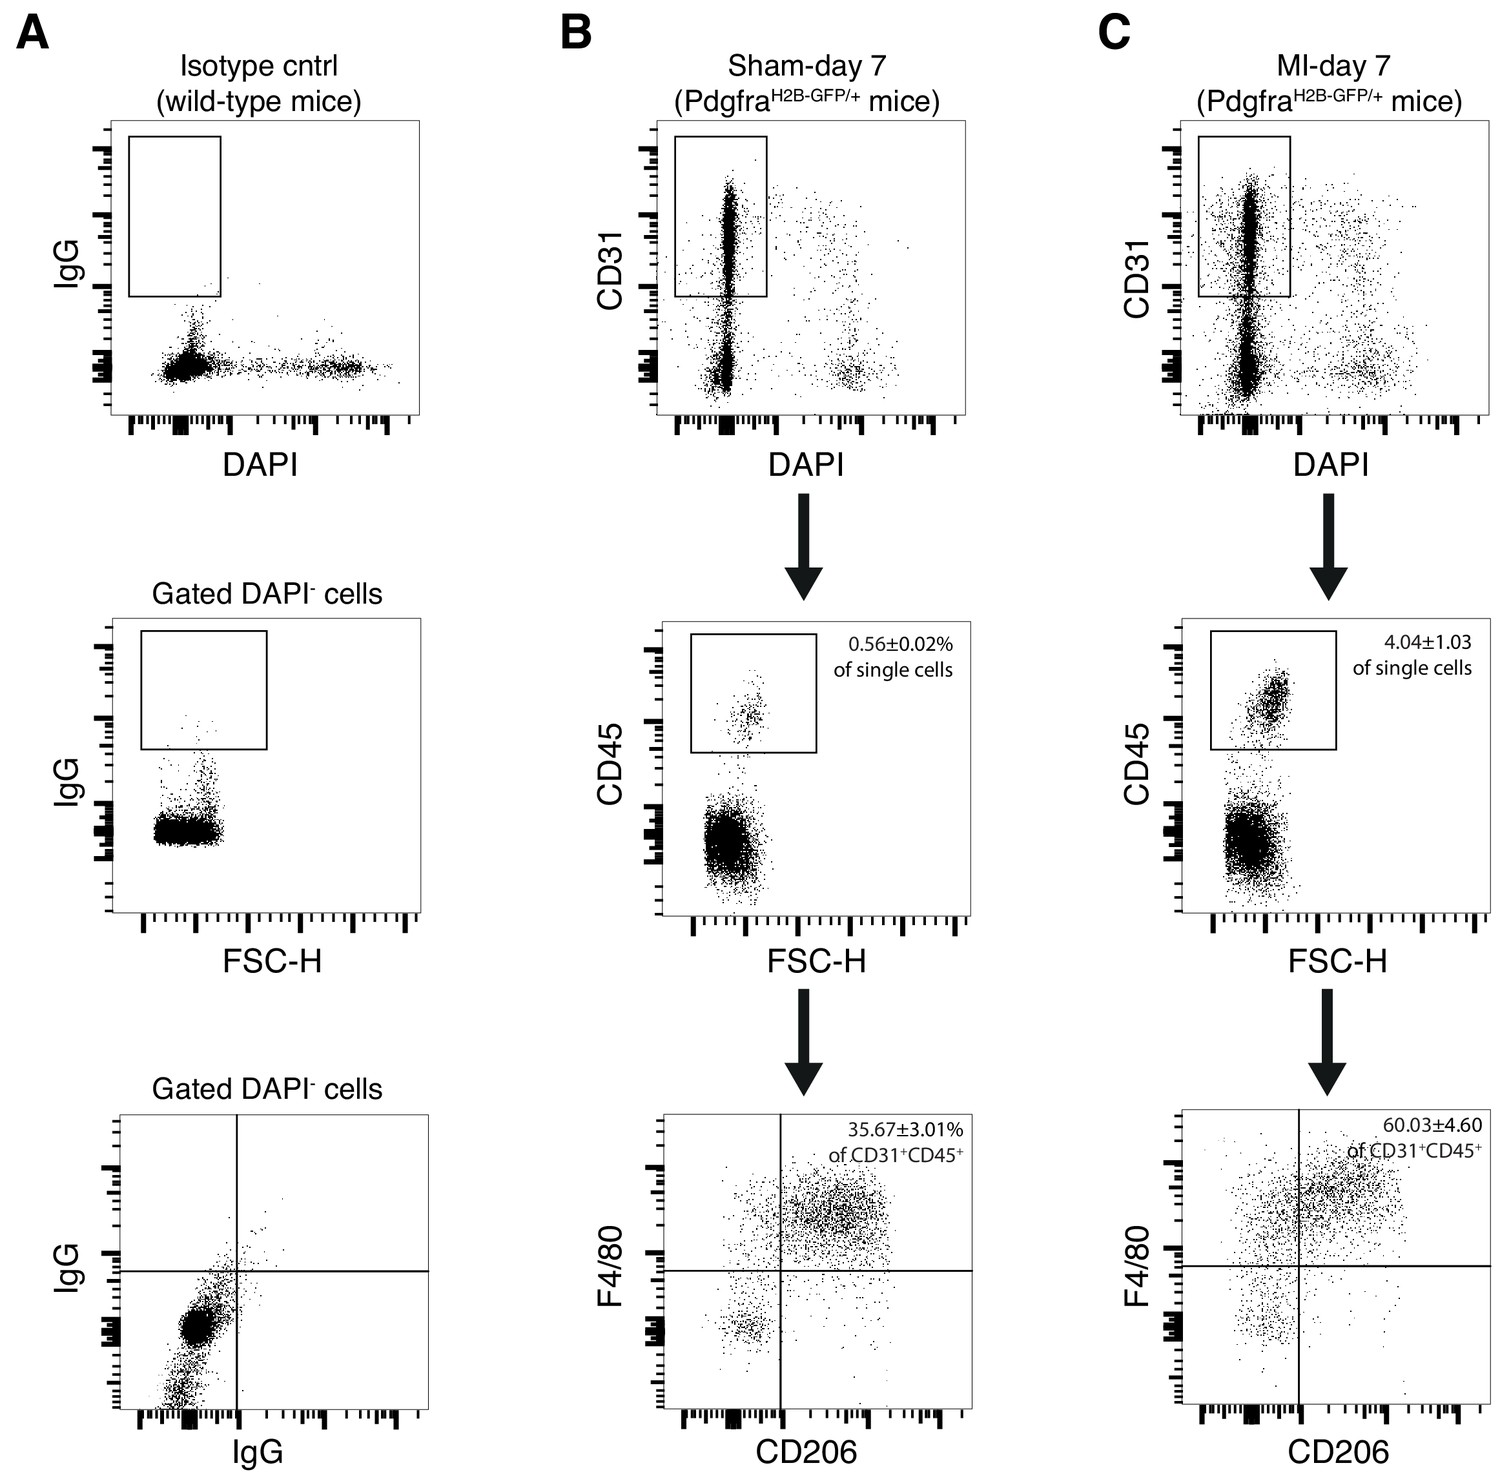
FACS data supporting the M2 MΦ -EC population.
FACS plots showing expression of indicated antigen (axis label) in the (A) wild type sample stained with isotype control antibodies and PdfgraGFP/+ sample stained with indicated antibodies 7 days after Sham (B) or MI (C) surgery.
Numbers indicate percentage of gated cells in live single cells in respective analyses (mean numbers indicated).
Figure 1—figure supplement 8
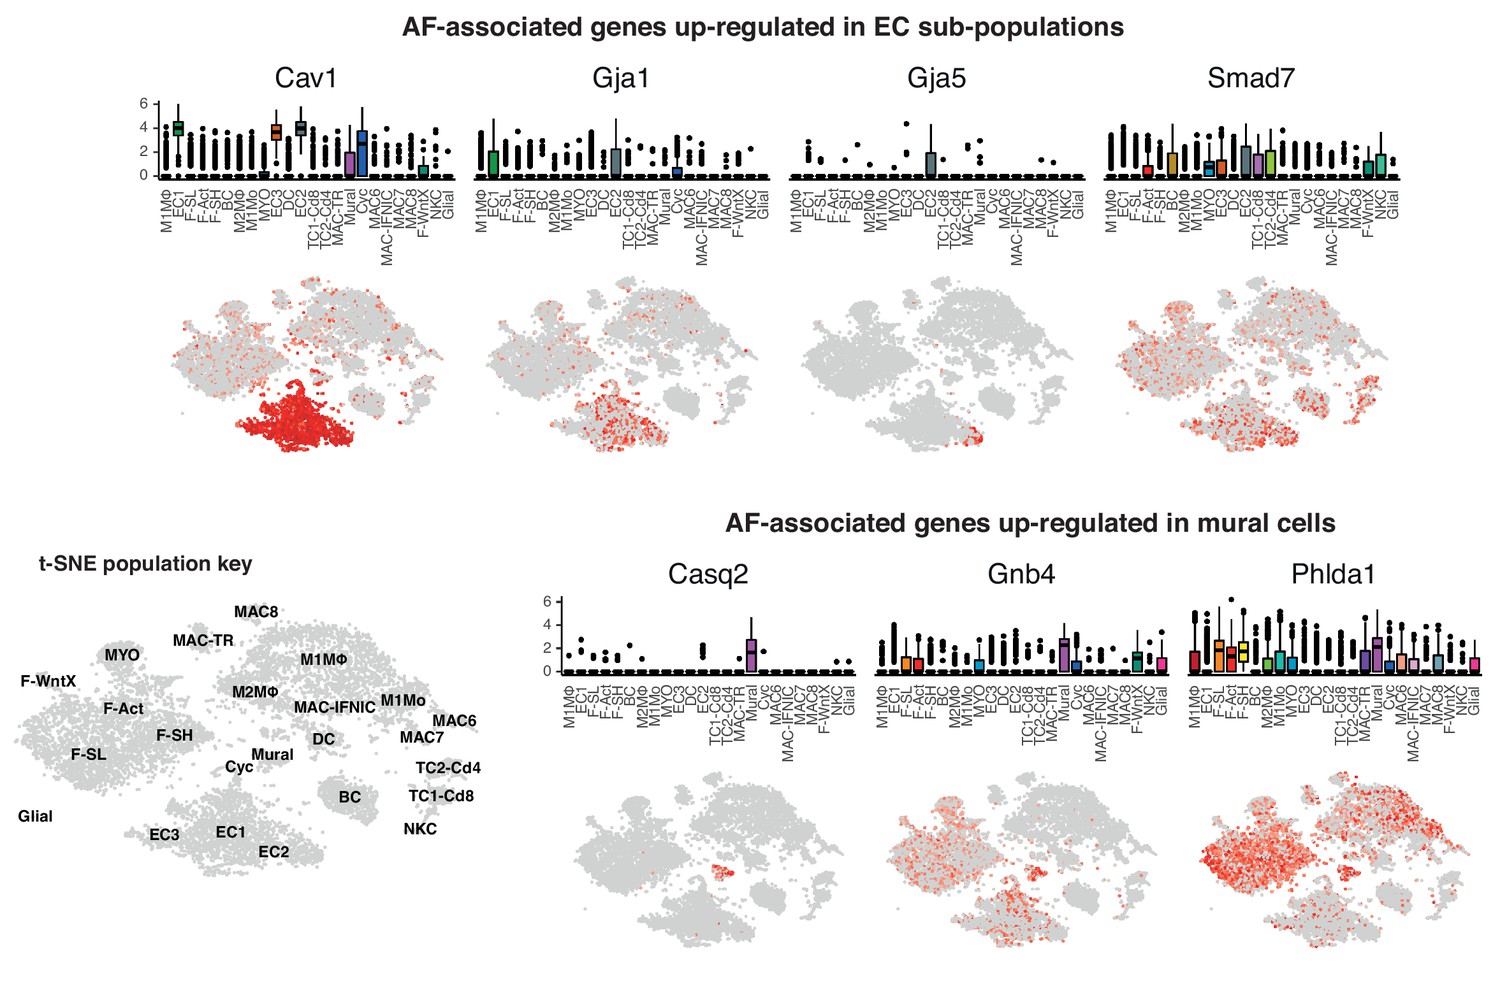
Atrial Fibrilation (AF) associated genes in TIP.
Overlap of genes associated with AF from Roselli et al. (2018) and genes upregulated in TIP sub-populations with log2 fold-change >1. Displayed are genes upregulated in EC (top) or mural (bottom) cell sub-populations with expression visualized in box and t-SNE plots. Key indicates the location of sub-populations on the t-SNE plot.
Figure 2 with 1 supplement

Cardiac Mo/MΦ populations.
(A) t-SNE plot showing extracted Mo/MΦ populations. (B) Expression of select immune cell markers as visualized in box-plots and t-SNE plots. Arrows indicate Ccr2low sub-population of M2MΦ. (C) Dot-plot of top upregulated genes for each Mo/MΦ population where color indicates experimental conditions. (D) Heatmap of differentially expressed genes between Mo/MΦ populations with representative significant GO Biological Process terms.
Figure 2—figure supplement 1
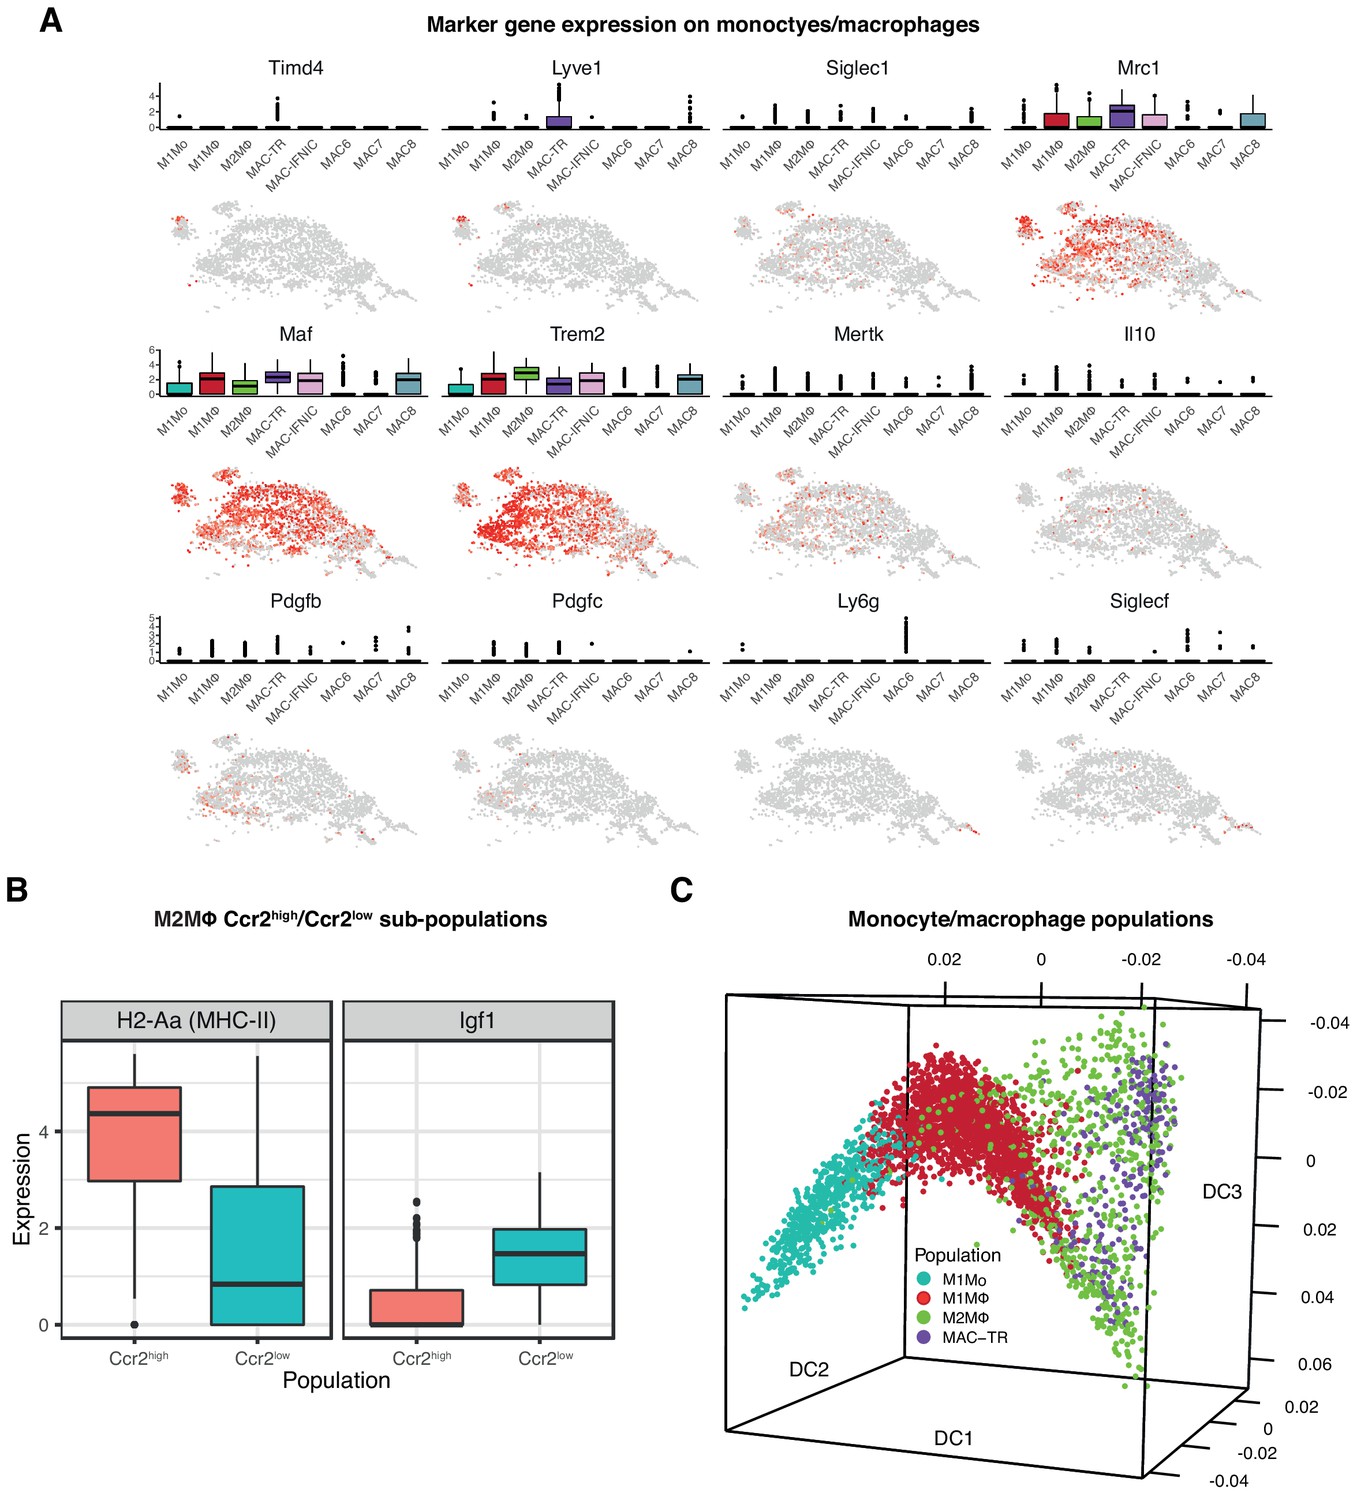
Mo and MΦ marker genes and Diffusion Map analysis.
(A) Expression of selected genes marking Mo and MΦ sub-populations visualized using box and t-SNE plots. (B) Expression of H2-Aa (MHC-II) and Igf1 between sub-populations of M2MΦ defined according to Ccr2 expression (Ccr2high and Ccr2low) as visualized in box-plots. (C) Major Mo/MΦ populations visualized on diffusion components 1–3.
Figure 3 with 1 supplement
Cell-cell ligand-receptor network analysis.
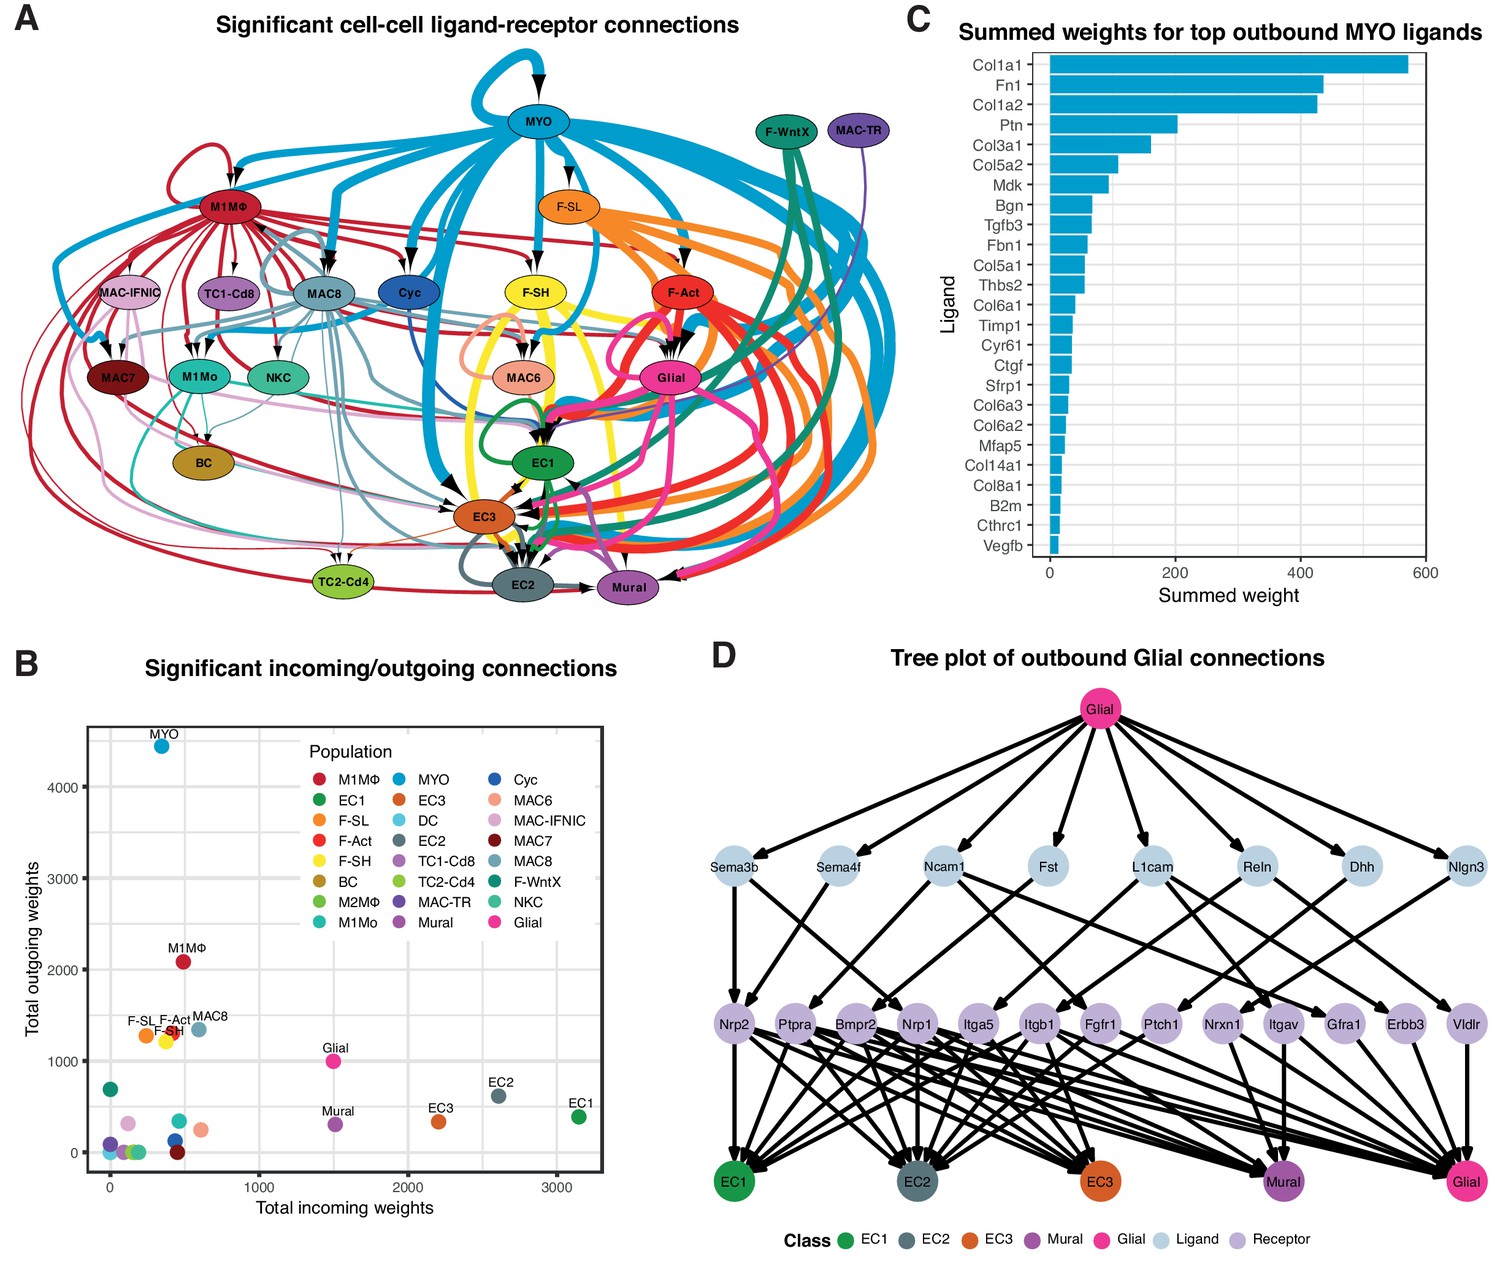
(A) Hierarchical network diagram of significant cell-cell interaction pathways. Arrows and edge color indicates direction (ligand:receptor) and edge thickness indicates the sum of weighted paths between populations. (B) Comparison of total incoming path weights vs total outgoing path weights across populations. (C) Summed ligand weights across souce ligand and receptor target paths for top ligands in MYO. (D) Tree plot showing outgoing connections from the Glial cells. Top node refers to source population, second layer to ligands, third layer to receptors and leaf nodes represent target populations.
Figure 3—figure supplement 1
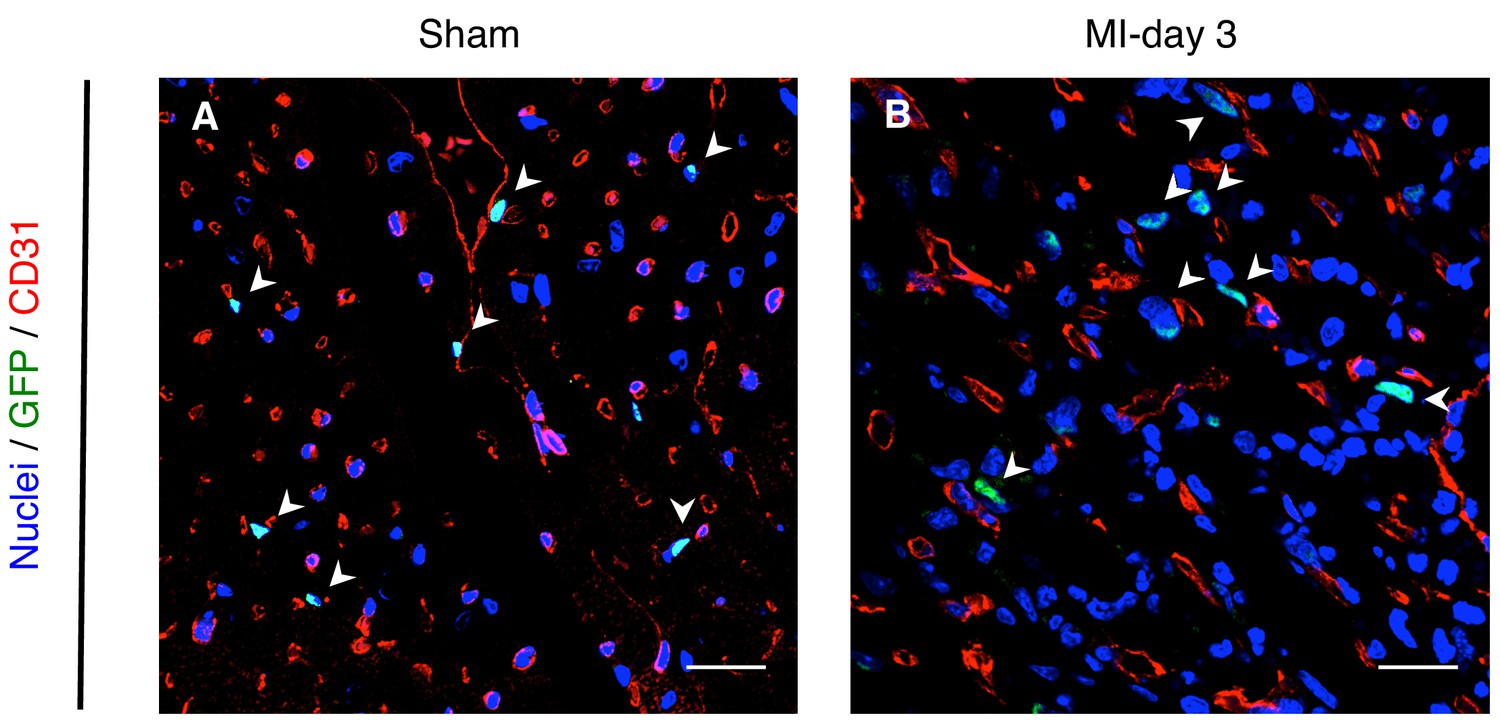
Pdgfra-GFP+ cells localization in healthy and diseased hearts.
(A–B) Representative image of GFP (green) and CD31 (red) co-immunostainings in sham (A) and MI-day 3 (B) hearts. Arrowheads show GFP+ cells in close proximity/contact with CD31+ cells. Scale bar - 20 μm.
Figure 4 with 5 supplements
Pdgfa-GFP+ scRNA-seq.
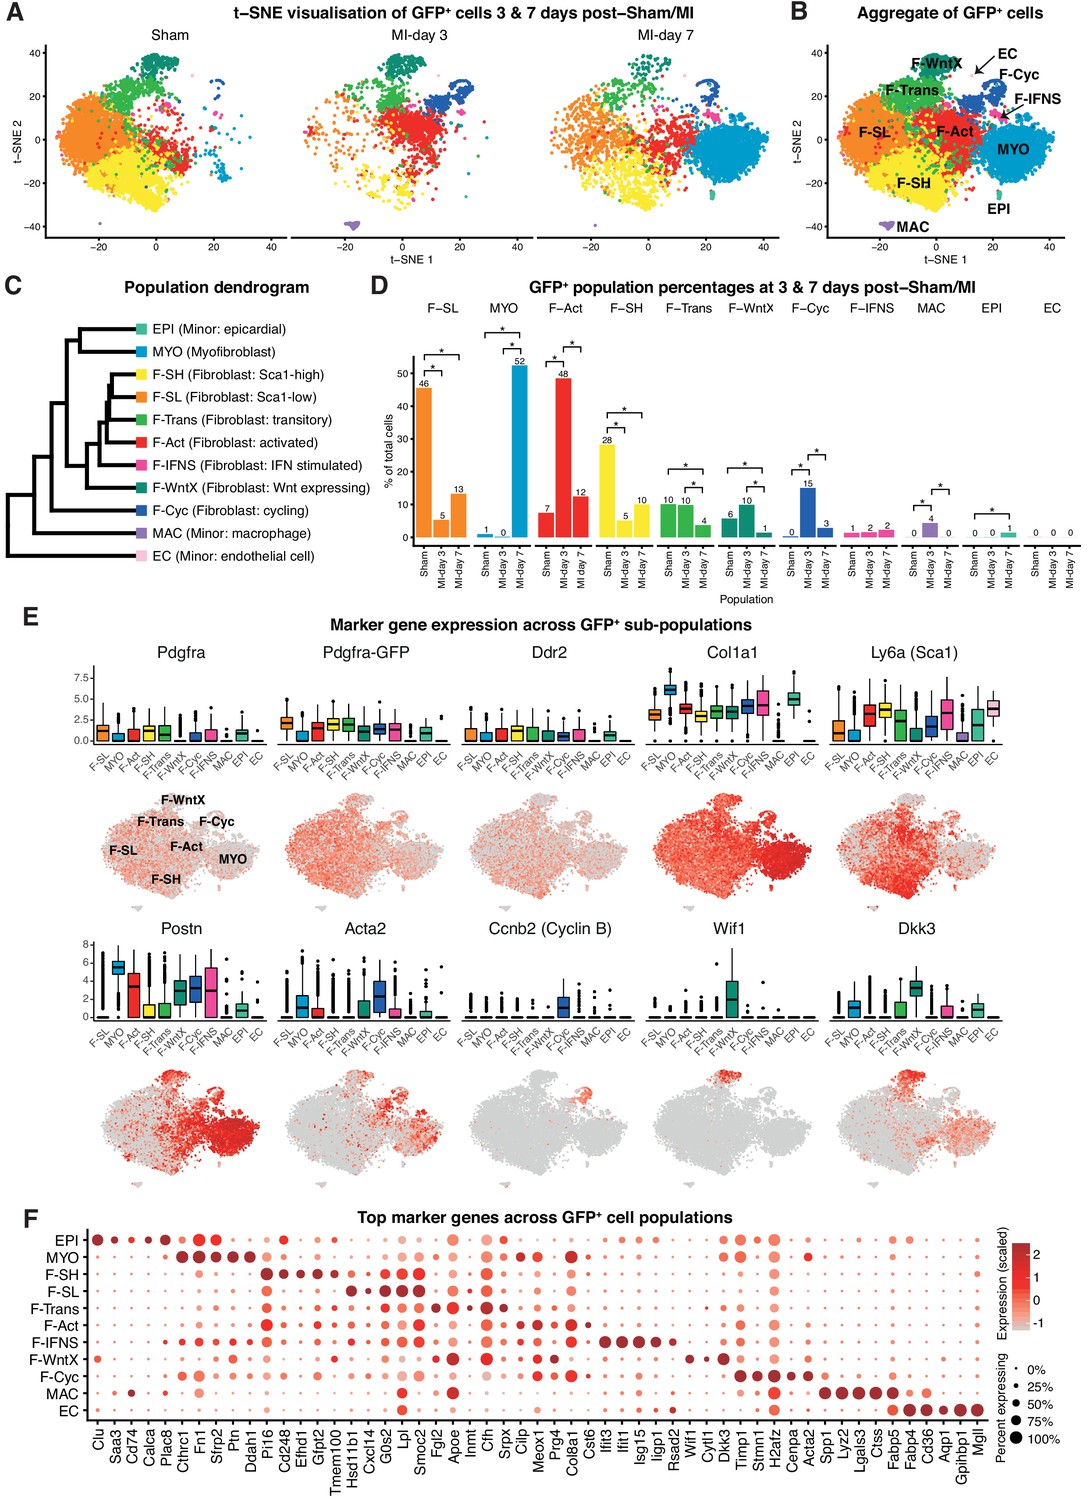
(A) t-SNE plot of GFP+ cells separated according to experimental condition (sham, MI-day 3, MI-day 7). (B) t-SNE plot showing aggregate of GFP+ cells across conditions. (C) Dendrogram of populations determined by average RNA expression in populations. (D) Percentages of cells in each population according to experimental condition. Stars indicate significant change across conditions according to DPA (p<0.01). (E) Expression of select genes in different populations as visualized in box and t-SNE plots. (F) Dot-plot of top five upregulated genes for each population where color indicates strength of expression and size of dot represents percentage of cells expressing the gene.
-
Figure 4—source data 1
Source data for quantification of colony counts summarized in Figure 4—figure supplement 2E.
- https://doi.org/10.7554/eLife.43882.023
Figure 4—figure supplement 1
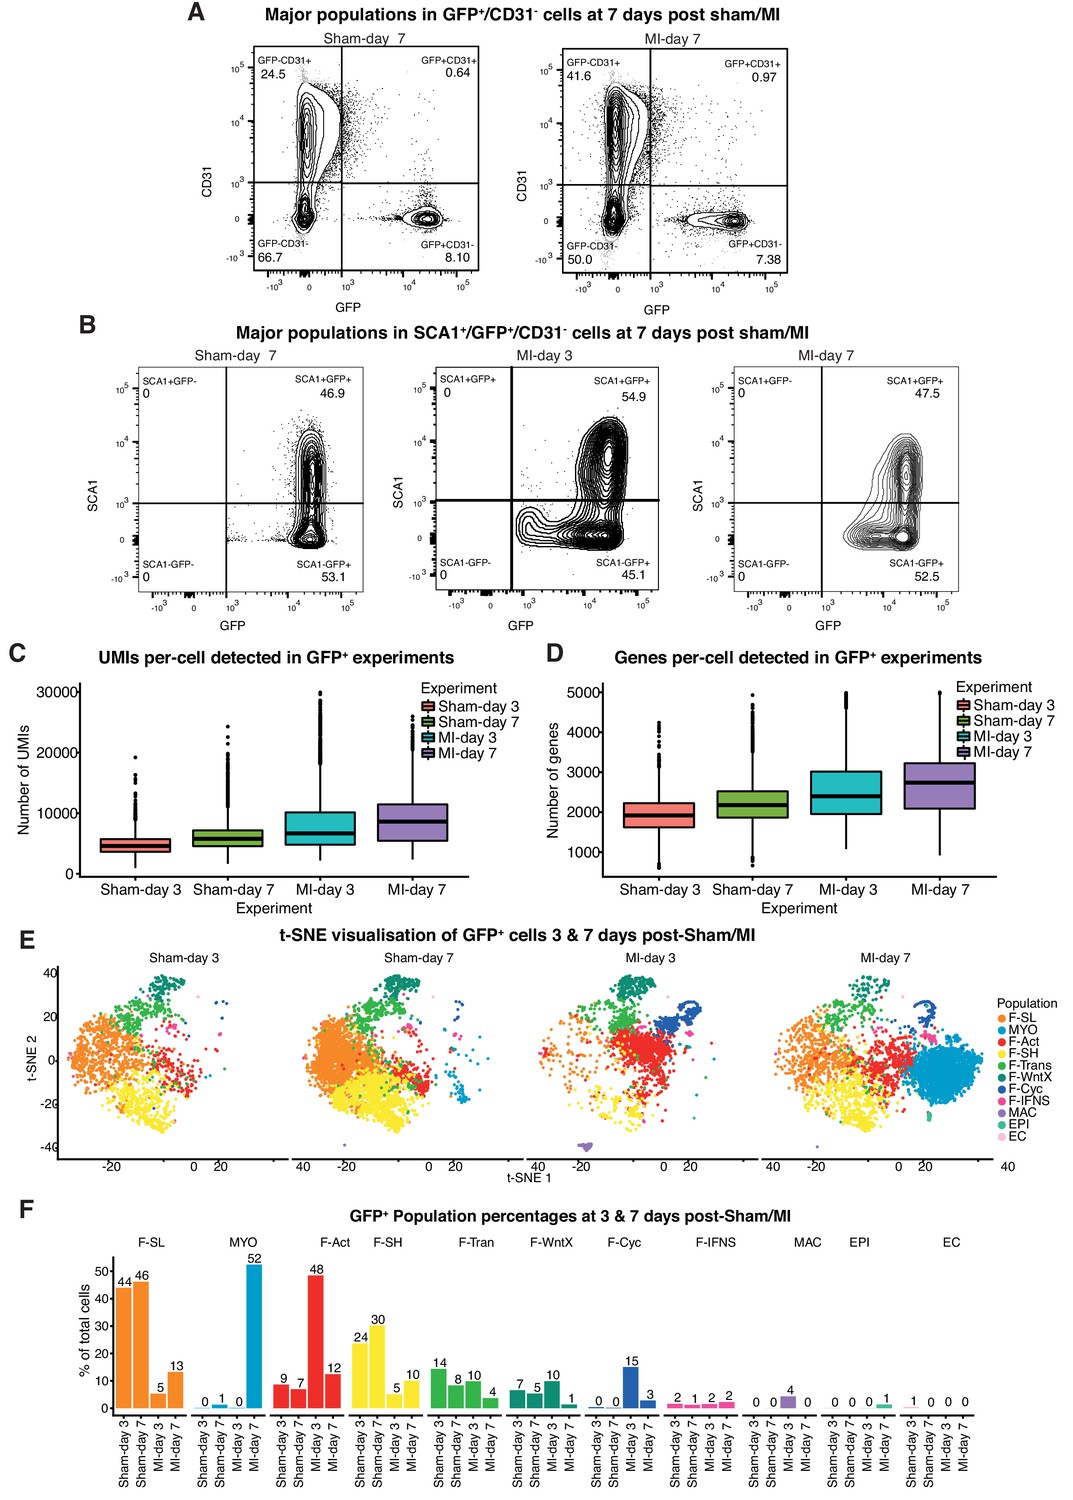
FACS profiles and scRNA-seq analysis for GFP+/CD31- cells.
(A) FACS plots and gating strategies for sorting GFP+/CD31- population at 7 days post-sham or MI surgery. (B) FACS plots showing SCA1 expression profiles in GFP+/CD31- cells at 7 days post-sham or MI surgery. (C) Boxplot showing number of UMIs detected per-cell across experimental conditions in GFP+/CD31- fraction after quality control filtering. (D) Boxplot showing number of genes detected per-cell across experimental conditions in GFP+/CD31- fraction after quality control filtering. (E) t-SNE visualization of scRNA-seq clusters for all sham and MI time-points in GFP+/CD31- cells. (F) Cell population proportions across all experimental conditions.
Figure 4—figure supplement 2
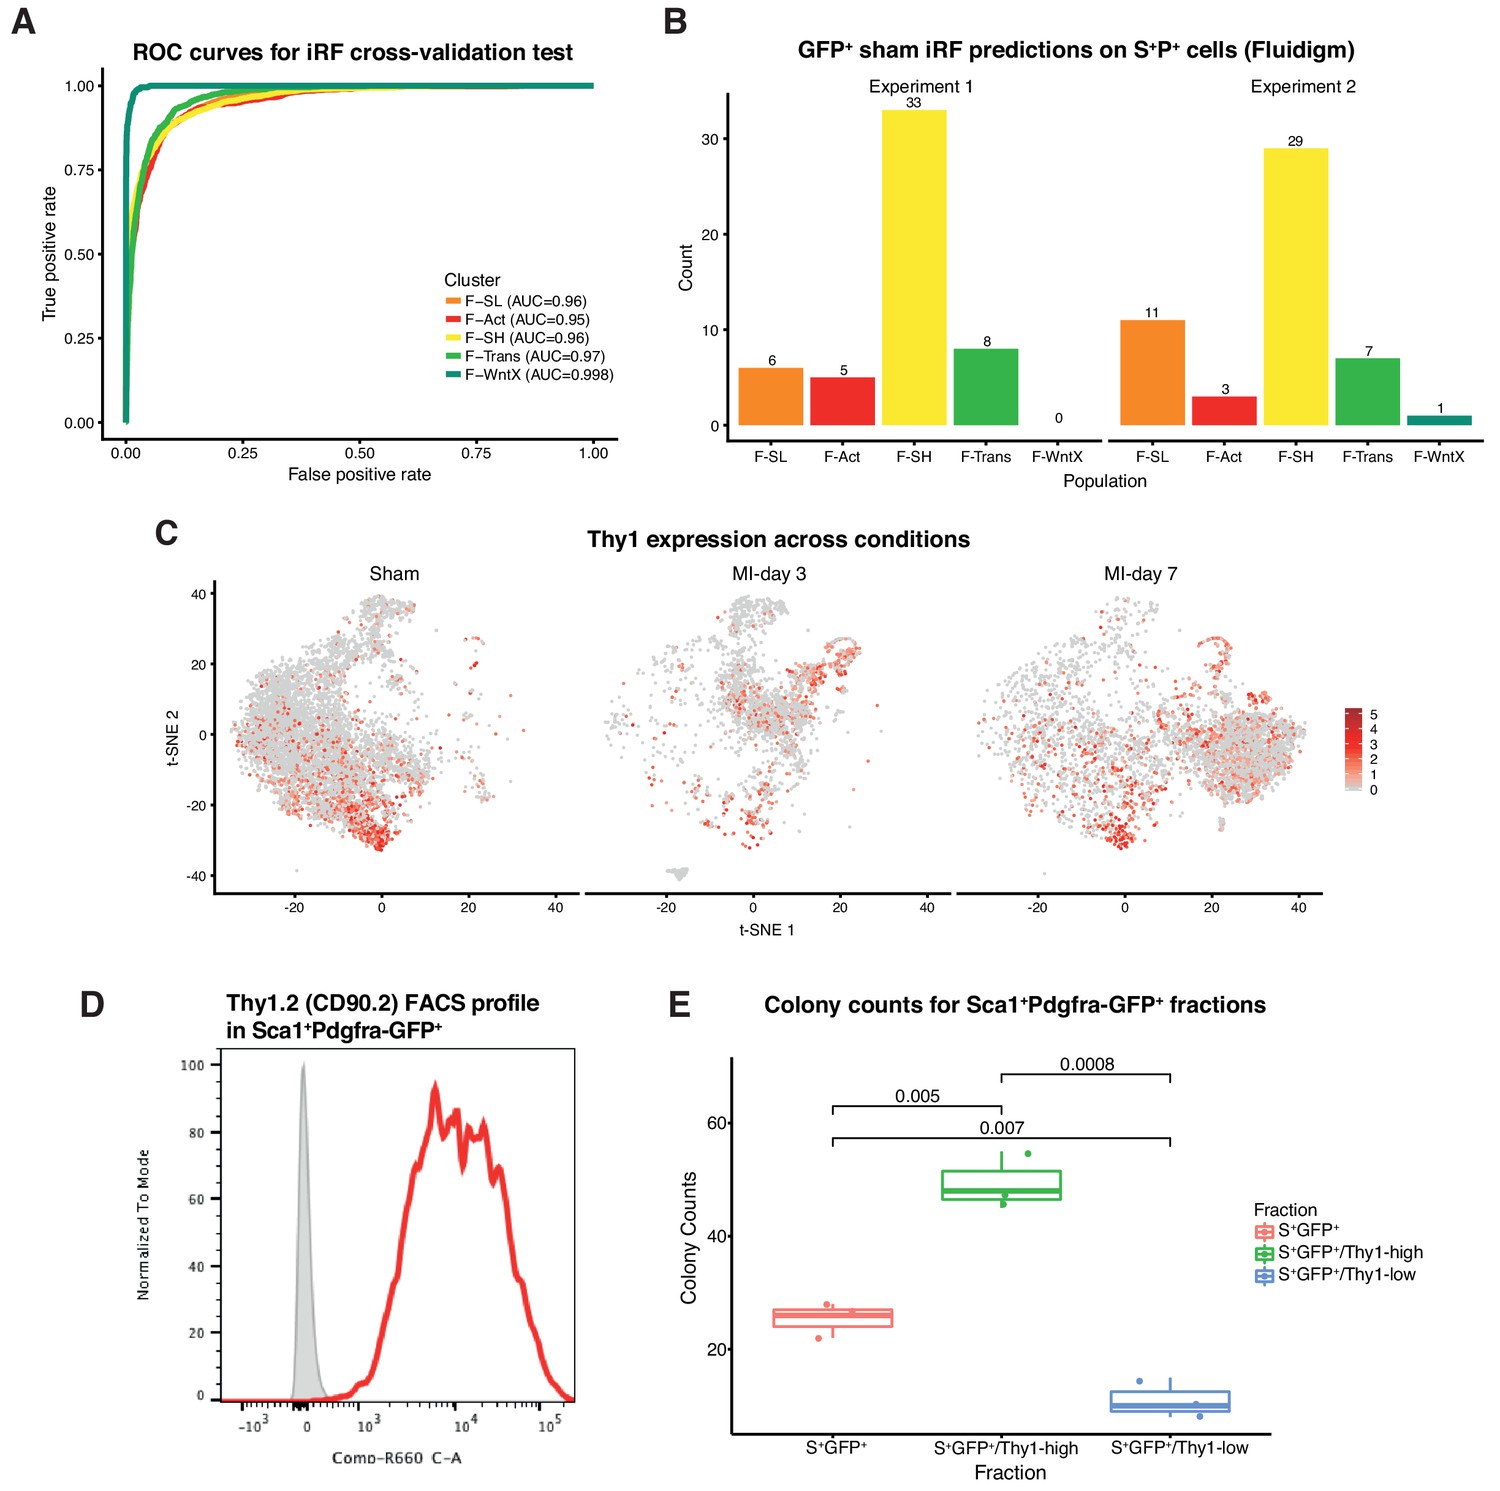
Comparison of GFP+ populations with FACS-sorted S+P+ cells.
(A) ROC curves showing prediction accuracy of iRF classifier for predicting populations in sham cells. ROC calculated across a 10-fold cross-validation test. (B) Counts of iRF predicted cell identities across two scRNA-seq (Fluidigm) experiments on S+P+ cells. (C) Thy1 expression across conditions. (D) Distribution of Thy1.2 (CD90.2) protein expression by FACS in S+Pdgfra-GFP+cells. (E) Colony counts comparing S+Pdgfra-GFP+ with Thy1.2 fractions (low vs high) isolated by FACS (n = 3). Indicated p-values are derived from Student’s t-test.
Figure 4—figure supplement 3
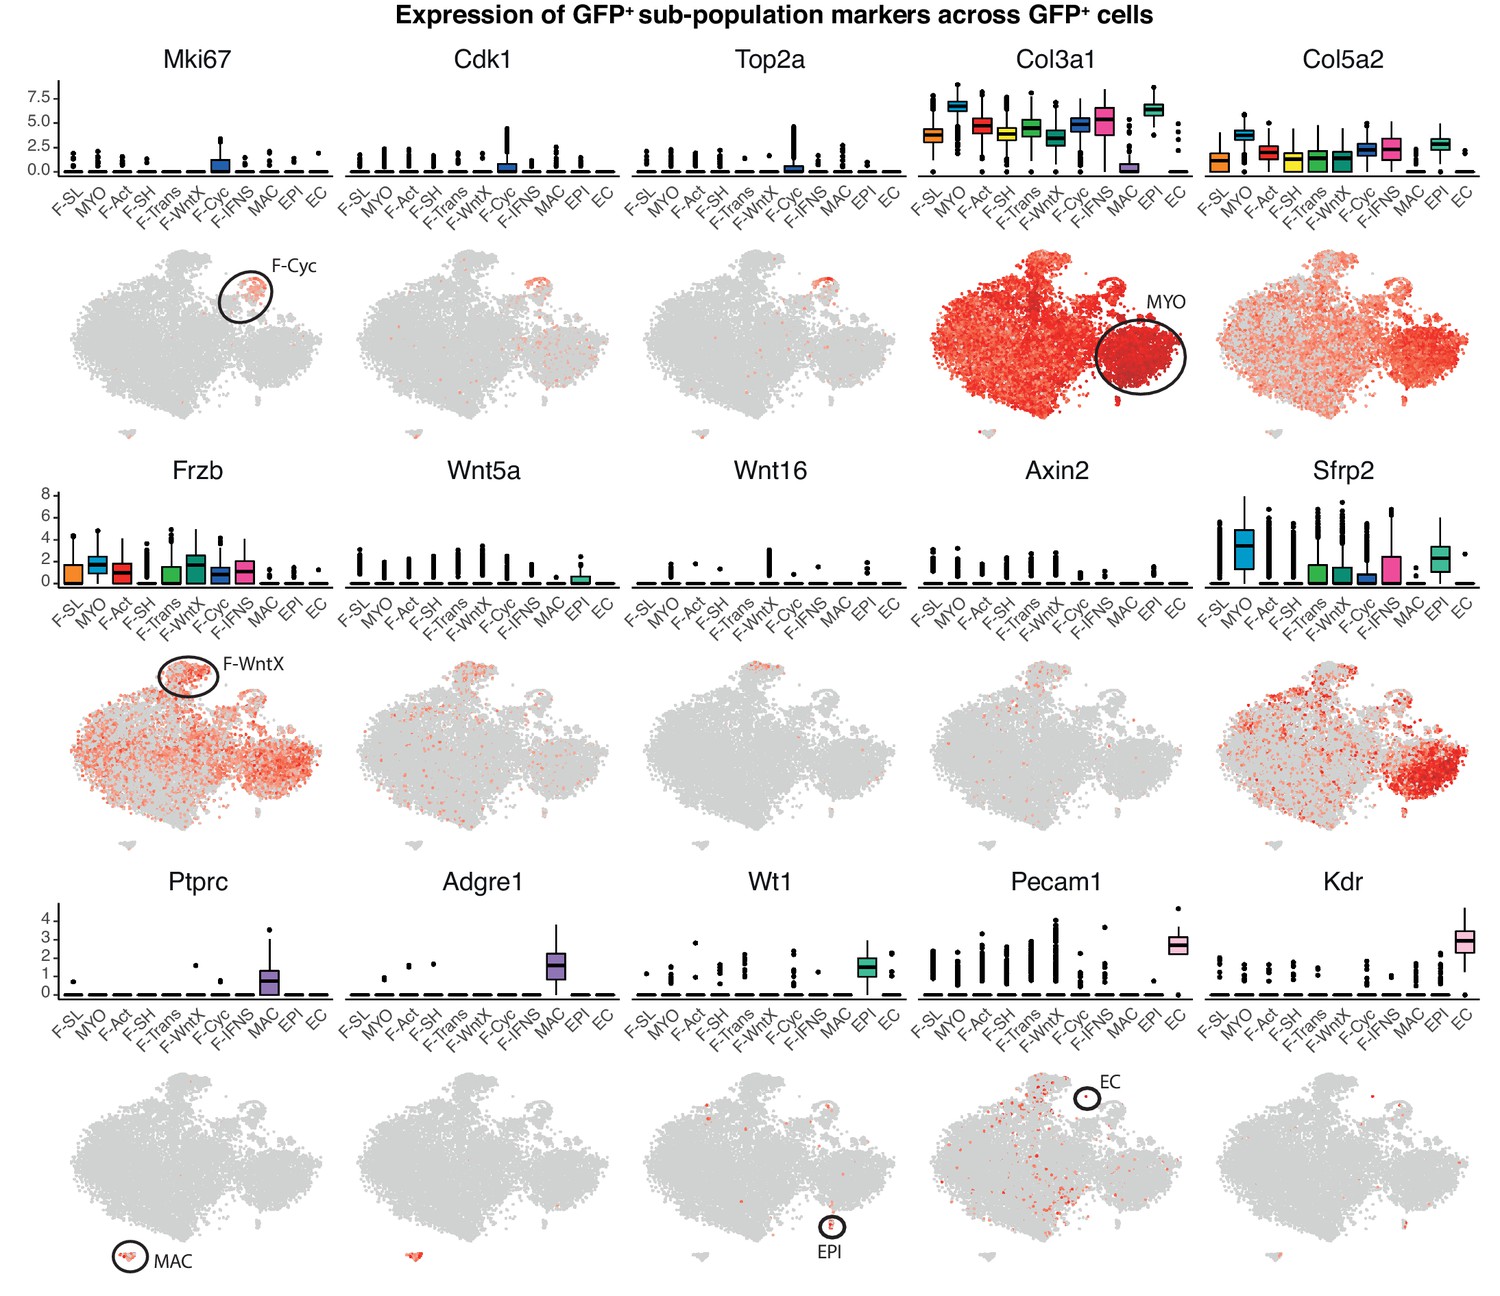
Expression of selected marker genes across GFP+ populations visualized in box and t-SNE plots.
Circles indicate relevant population for the displayed marker.
Figure 4—figure supplement 4

Population-specific expression of transcription factors marking fibroblast and myofibroblast sub-populations.
https://doi.org/10.7554/eLife.43882.021
Figure 4—figure supplement 5
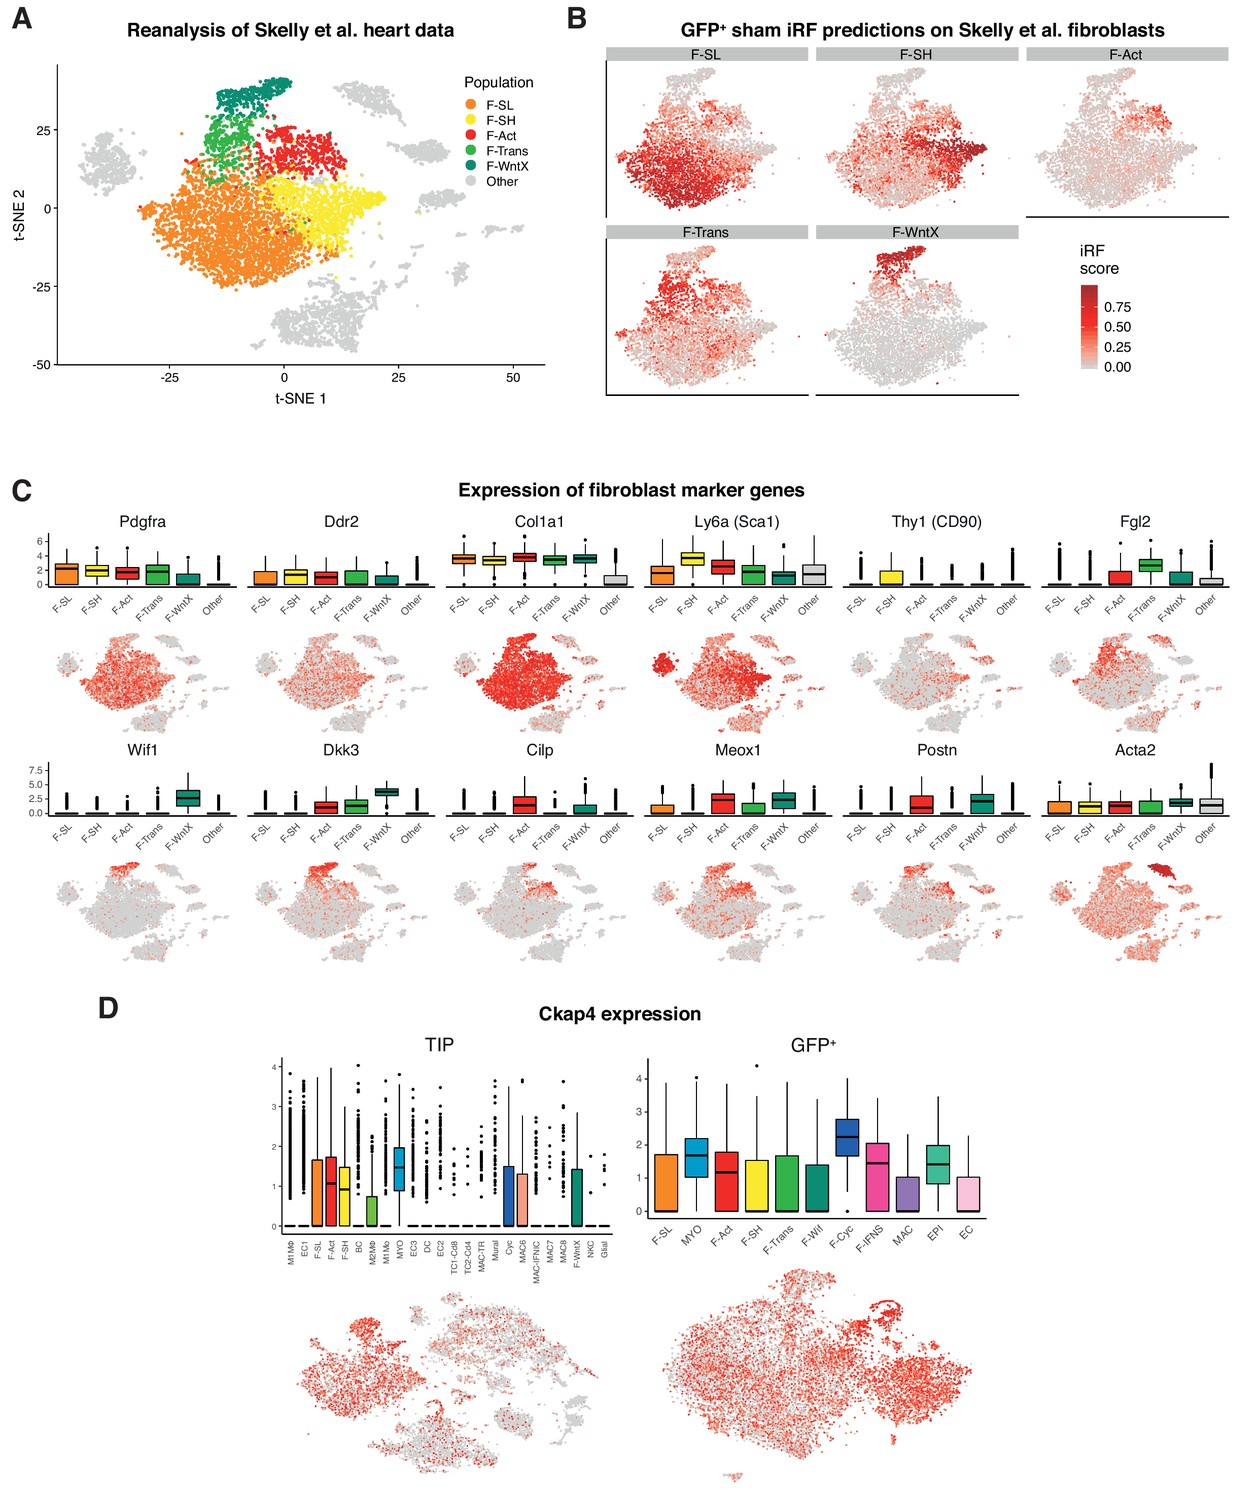
Comparisons with Skelly et al. (2018) and Gladka et al. (2018) scRNA-seq data-sets.
(A–C) Reanalysis of Skelly et al. scRNA-seq data. (A) t-SNE plot showing main fibroblast populations detected from clustering analysis and identities according to those described in GFP+. (B) iRF predictions of GFP+ sham populations on fibroblasts from Skelly et al. data-set. (C) Expression of representative marker genes according to box plots and as visualized on t-SNE plots. Shows fibroblast markers (Pdgfra, Ddr2, Col1a1) and sub-population-specific markers. (D) Expression of Ckap4 gene, which was identified by Gladka et al. as a novel marker of activated fibroblasts, as visualized in box and t-SNE plots across TIP and GFP+ sub populations.
Figure 5 with 1 supplement
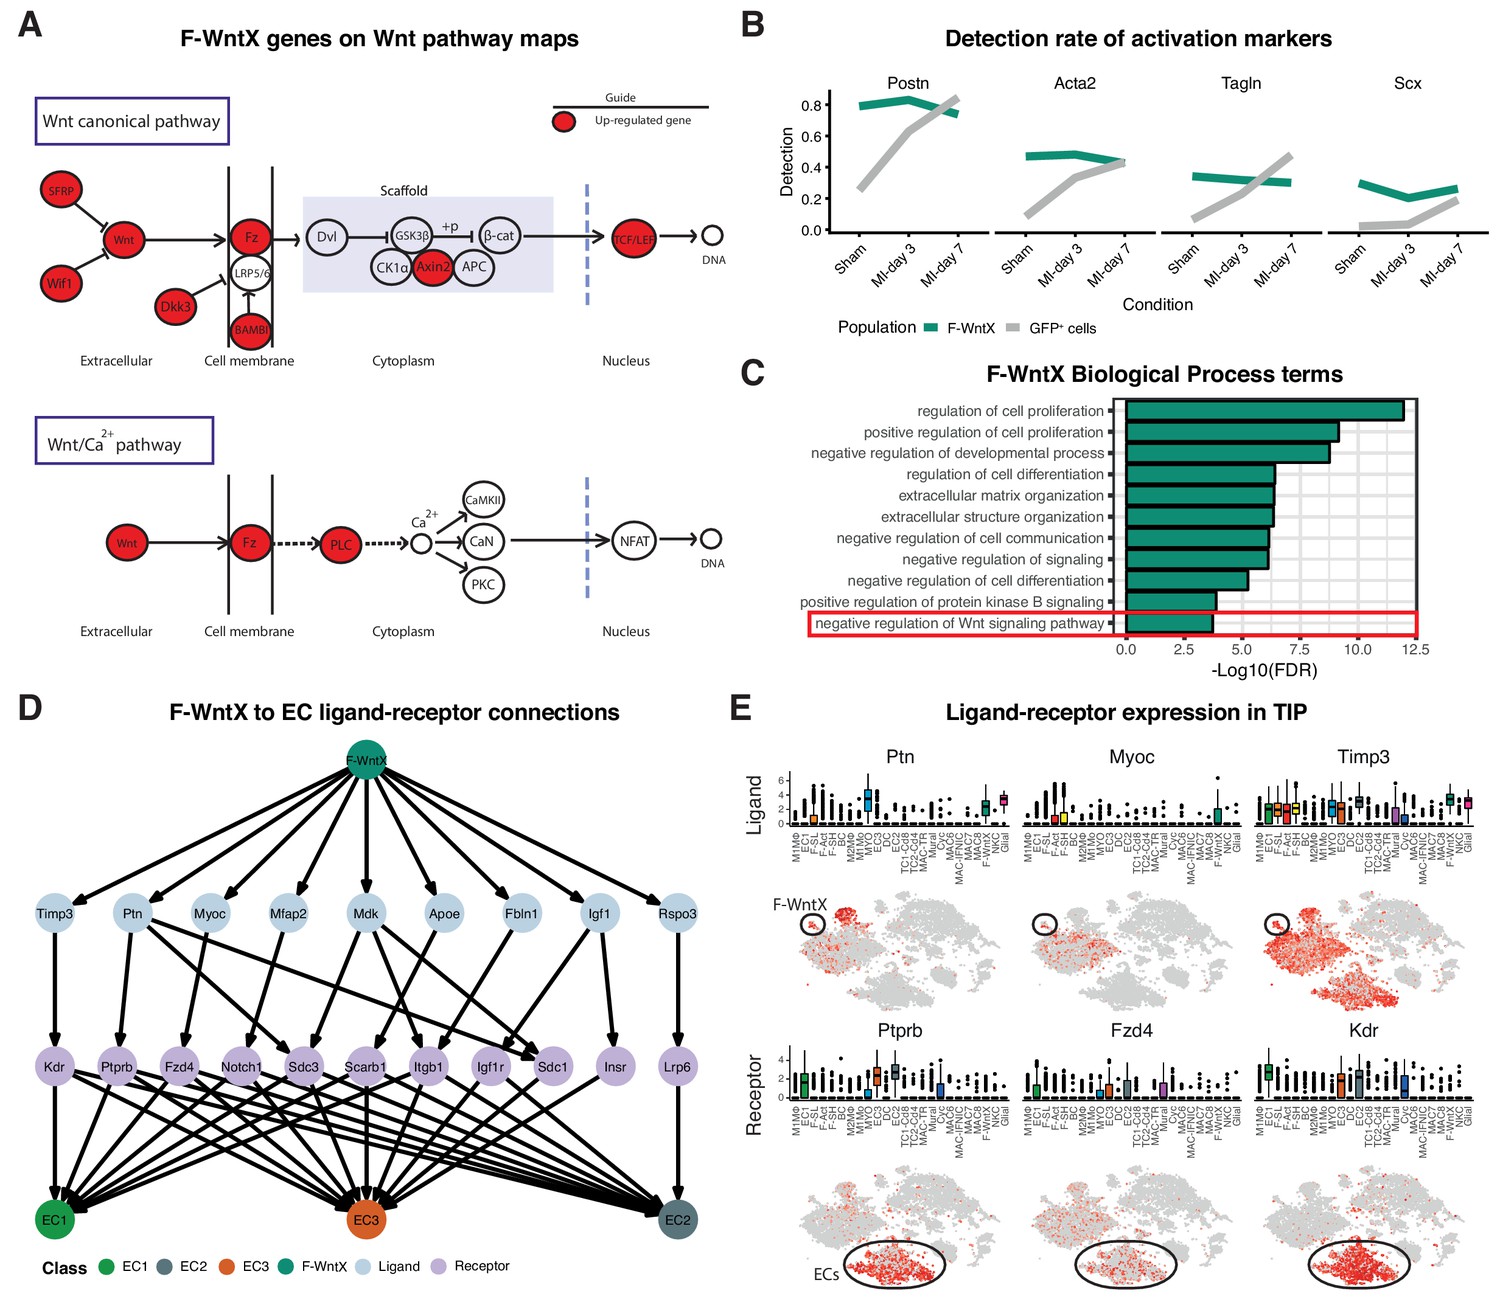
Features of the F-WntX population.
(A) Differentially expressed genes in F-WntX overlaid on Wnt pathway maps. Wnt node includes genes Wnt5a and Wnt16. (B) Detection rate, representing the percentage of cells expressing a gene, across all conditions for cells in F-WntX or all GFP+ cells combined. (C) Example GO BP terms over-represented (FDR < 0.05) in genes upregulated in F-WntX compared to F-SL/F-SH populations. (D) Tree plot showing ligand-receptor connections from F-WntX to EC sub-populations as calculated in TIP. Top node refers to source population, second layer to ligands, third layer to receptors and leaf nodes represent target populations. (E) Examples of F-WntX:EC ligand and corresponding receptor expression as visualised in box and t-SNE plots. For each ligand the corresponding receptor is immediately below.
Figure 5—figure supplement 1
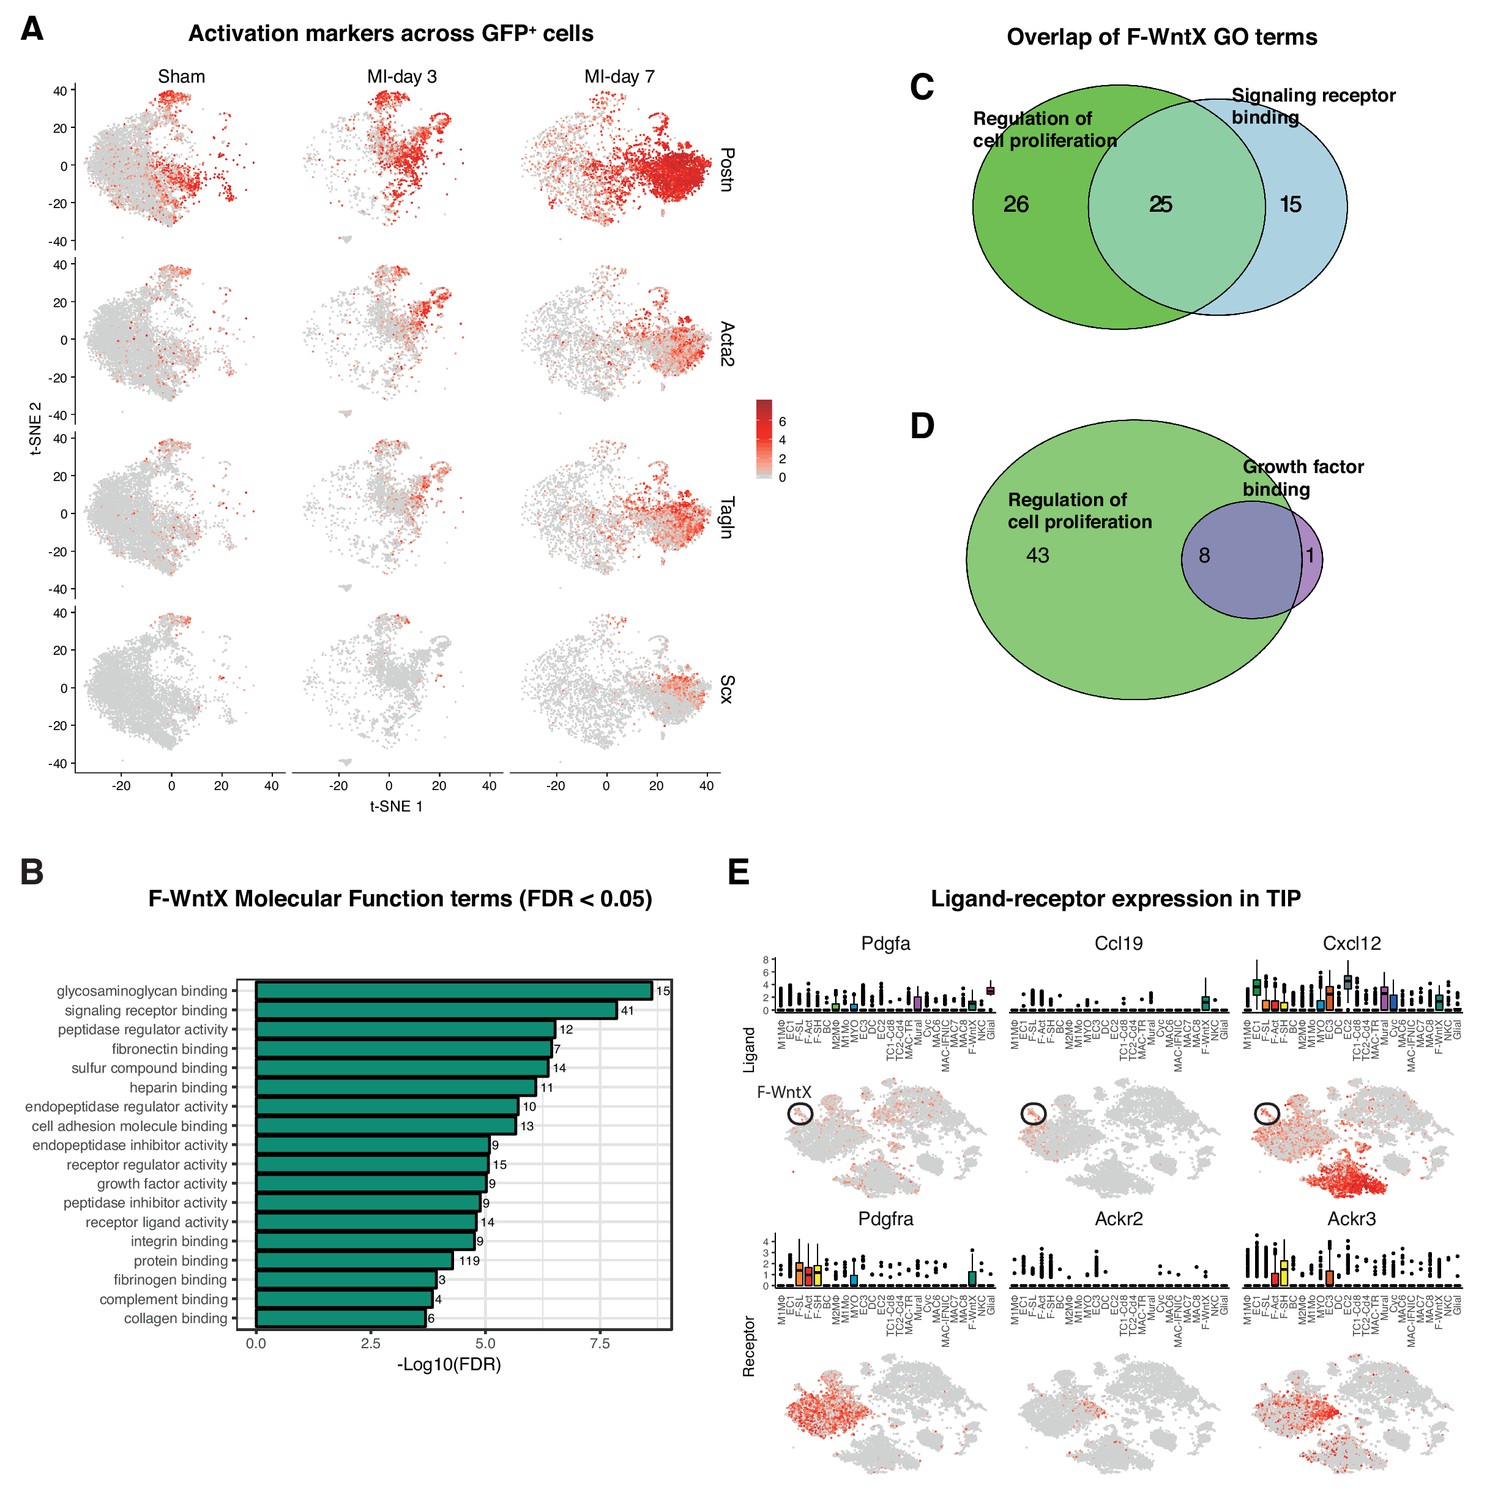
Activation and paracrine signature of F-WntX cells.
(A) Expression of markers of activation visualized on condition-specific t-SNE plots. (B) GO Molecular Function terms over-represented (FDR < 0.05) in genes upregulated in F-WntX compared to F-SL/F-SH. (C, D) Venn diagram of overlap between F-WntX marker genes in ‘Regulation of cell proliferation’ category and MF categories ‘Signaling receptor binding’ (C) and ‘Growth factor binding’ (D). (E) Examples of ligands upregulated in F-WntX and corresponding receptors as expressed in TIP and visualized in box and t-SNE plots. For each ligand the corresponding receptor is immediately below. Circle indicates the location of F-WntX on the t-SNE plot.
Figure 6 with 2 supplements

WIF1 localization and co-expression in injured and uninjured hearts of Pdgfra-GFP+ mice.
(A) Representative image of WIF1 (red), GFP (green) and Wheat Germ Agglutinin (WGA, grey) co-immunostaining showing the border zone at MI-day 3. Arrowheads show WIF1+ cells. Scale bar - 50 μm. (B–C) Representative images of WIF1 (red) and GFP (green) co-immunostainings showing left ventricle (sham, (B) or infarcted border zone at MI-day 3 (C). Arrowheads show WIF1+ cells, Asterix shows WIF1+GFP+ cells. Scale bars - 20 μm. (D–G) Representative images of co-immunostainings for WIF1 (red), GFP (green) and markers (gray) for golgi (GM130, D, Arrowheads show WIF1+GM130+ cells), proliferation (Ki67, E, Arrowheads show WIF1+Ki67+ cells), smooth muscle cells and myofibroblasts (α-SMA, F, (F’) showing an example of a WIF1+GFP+α-SMA+ cell from another section), and leukocytes (CD45, G, Arrowheads show WIF1+CD45+ cells, Asterix shows GFP+CD45+ cells). Scale bar - 20 μm. (H) Representative image of co-immunostaining for WIF1 (green), WGA (gray) and endothelial cell marker CD31 (green). Arrowheads show WIF1+ cells in close proximity/contact with CD31+ cells. Scale bar - 20 μm. (I) Quantification of marker-positive cells in the infarcted border zone of MI-day 3 hearts. n = 4.
-
Figure 6—source data 1
Source data for quantification of marker-positive cells summarized in Figure 6I.
- https://doi.org/10.7554/eLife.43882.029
Figure 6—figure supplement 1
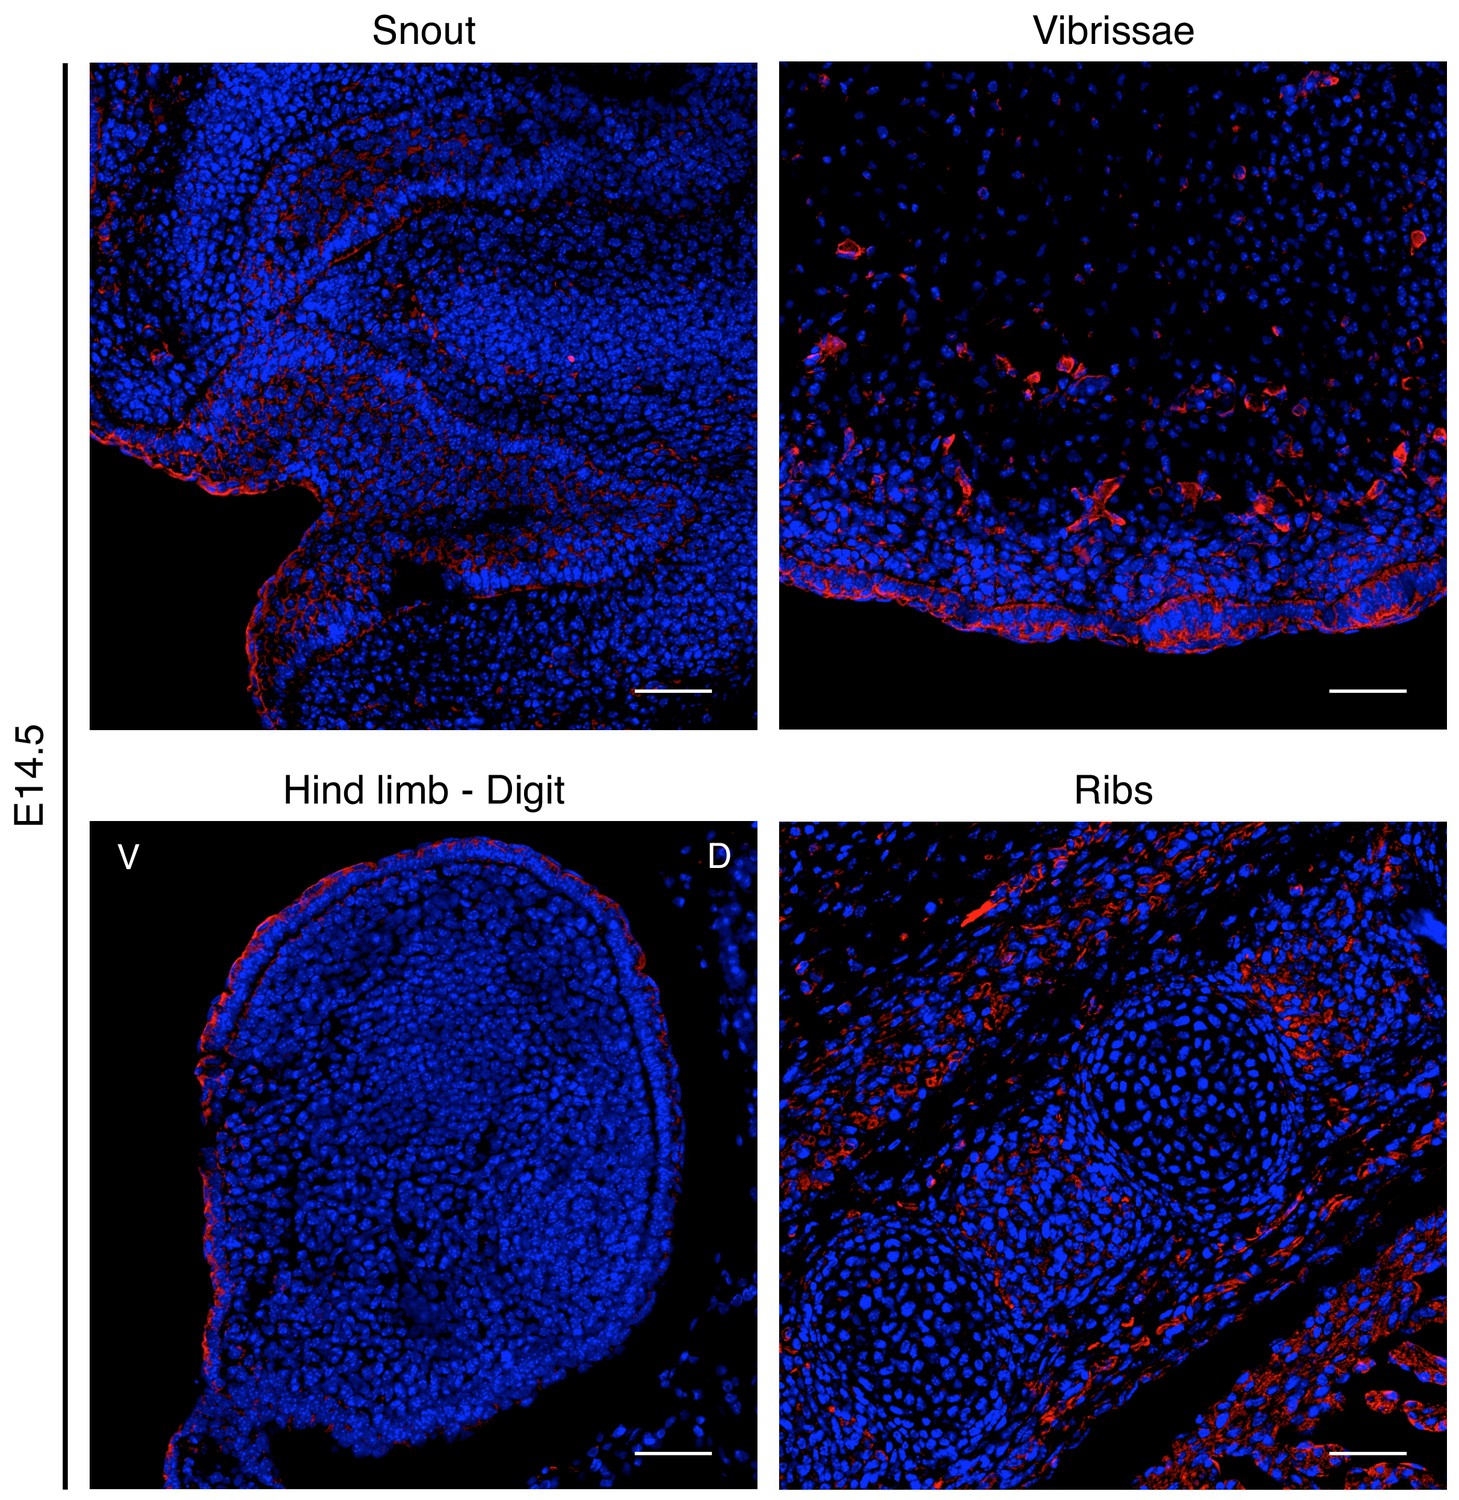
WIF1 expression pattern in E14.5 embryos.
Representatives images of sagittal sections of E14.5 embryos immunostained with WIF1 (red) antibody. Scale bar is 50 μm.
Figure 6—figure supplement 2
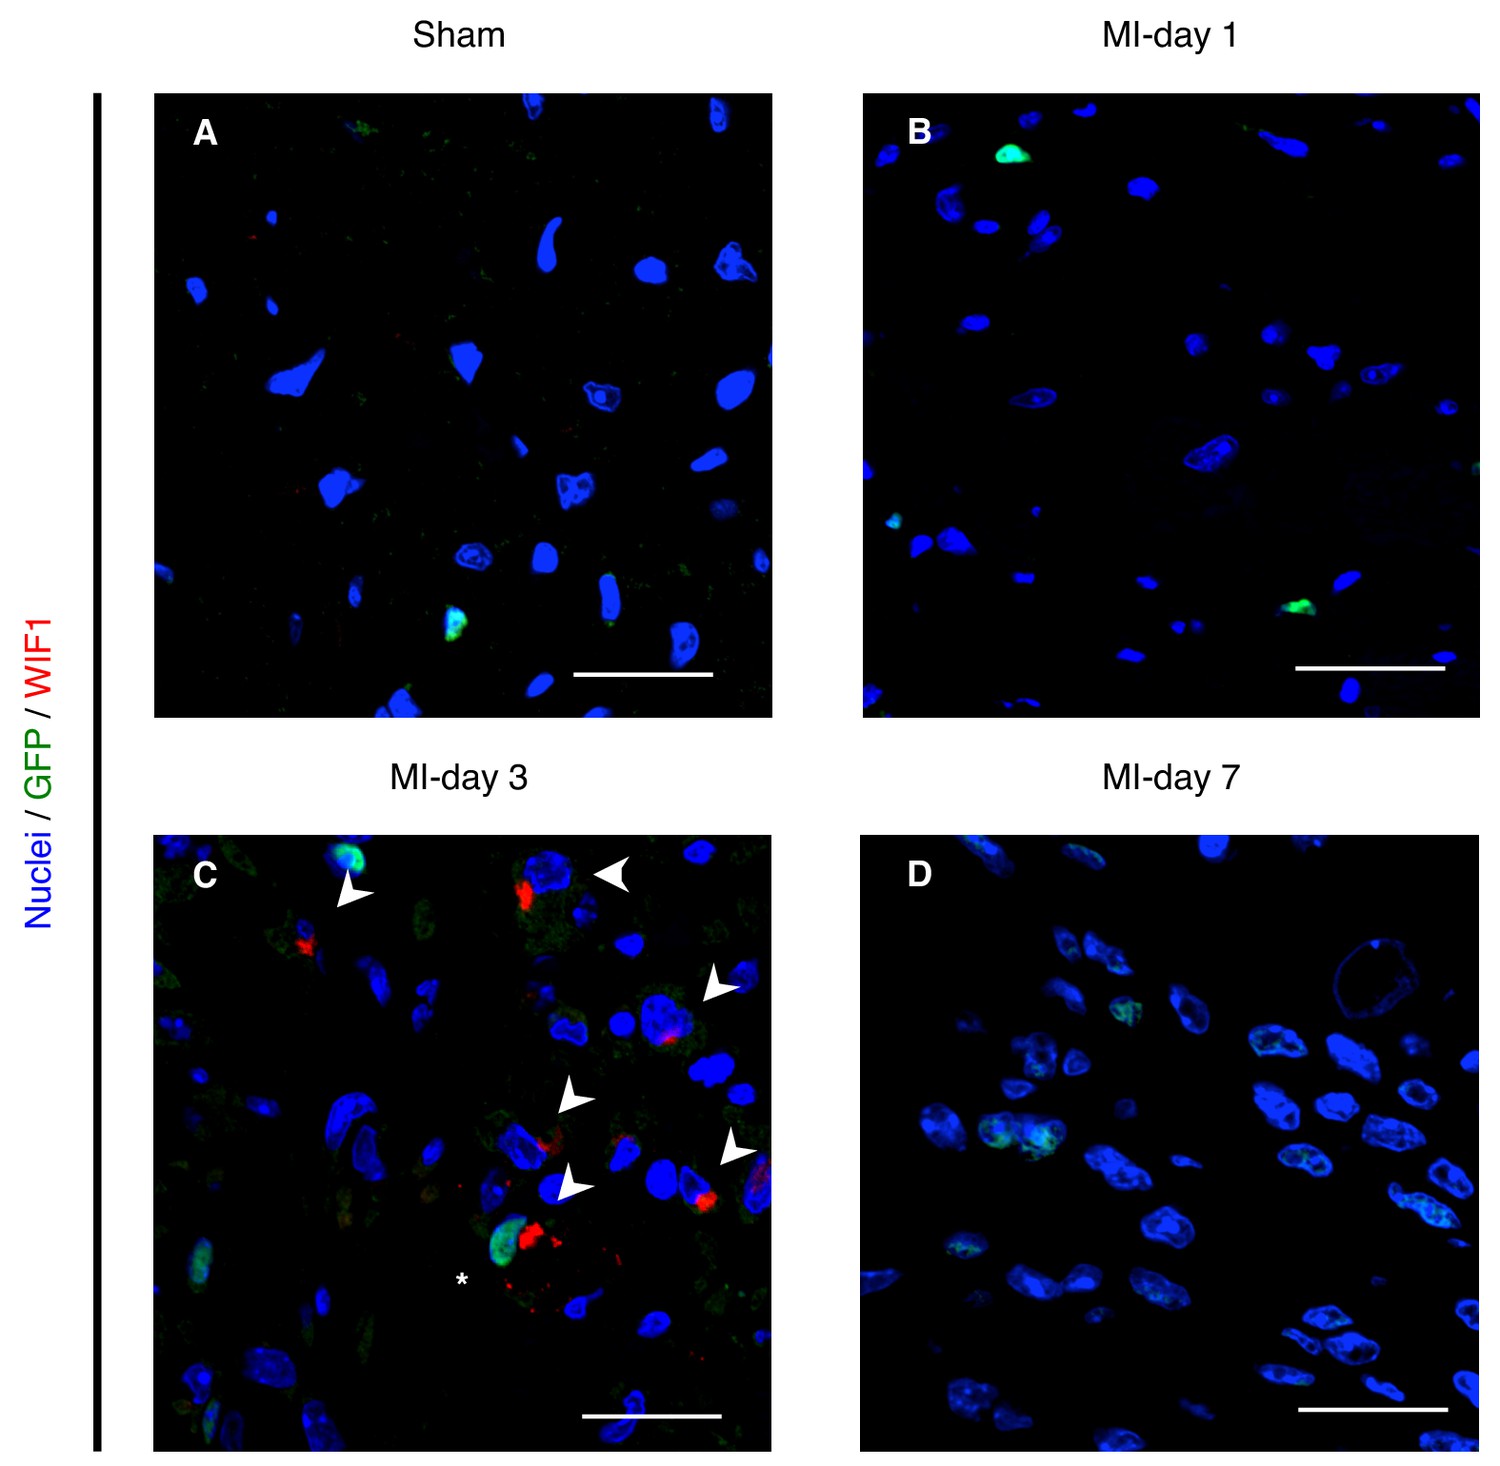
WIF1 protein expression after sham or MI.
(A–D) Representative images of WIF1 (red) and GFP (green) co-immunostainings in the left ventricle (sham, A) or in the infarcted border zone of hearts, 1 (B), 3 (C) or 7 (D) days after surgery. Arrowheads show WIF1+ cells, Asterix shows WIF1+GFP+ cell. Scale bar - 20 μm.
Figure 7
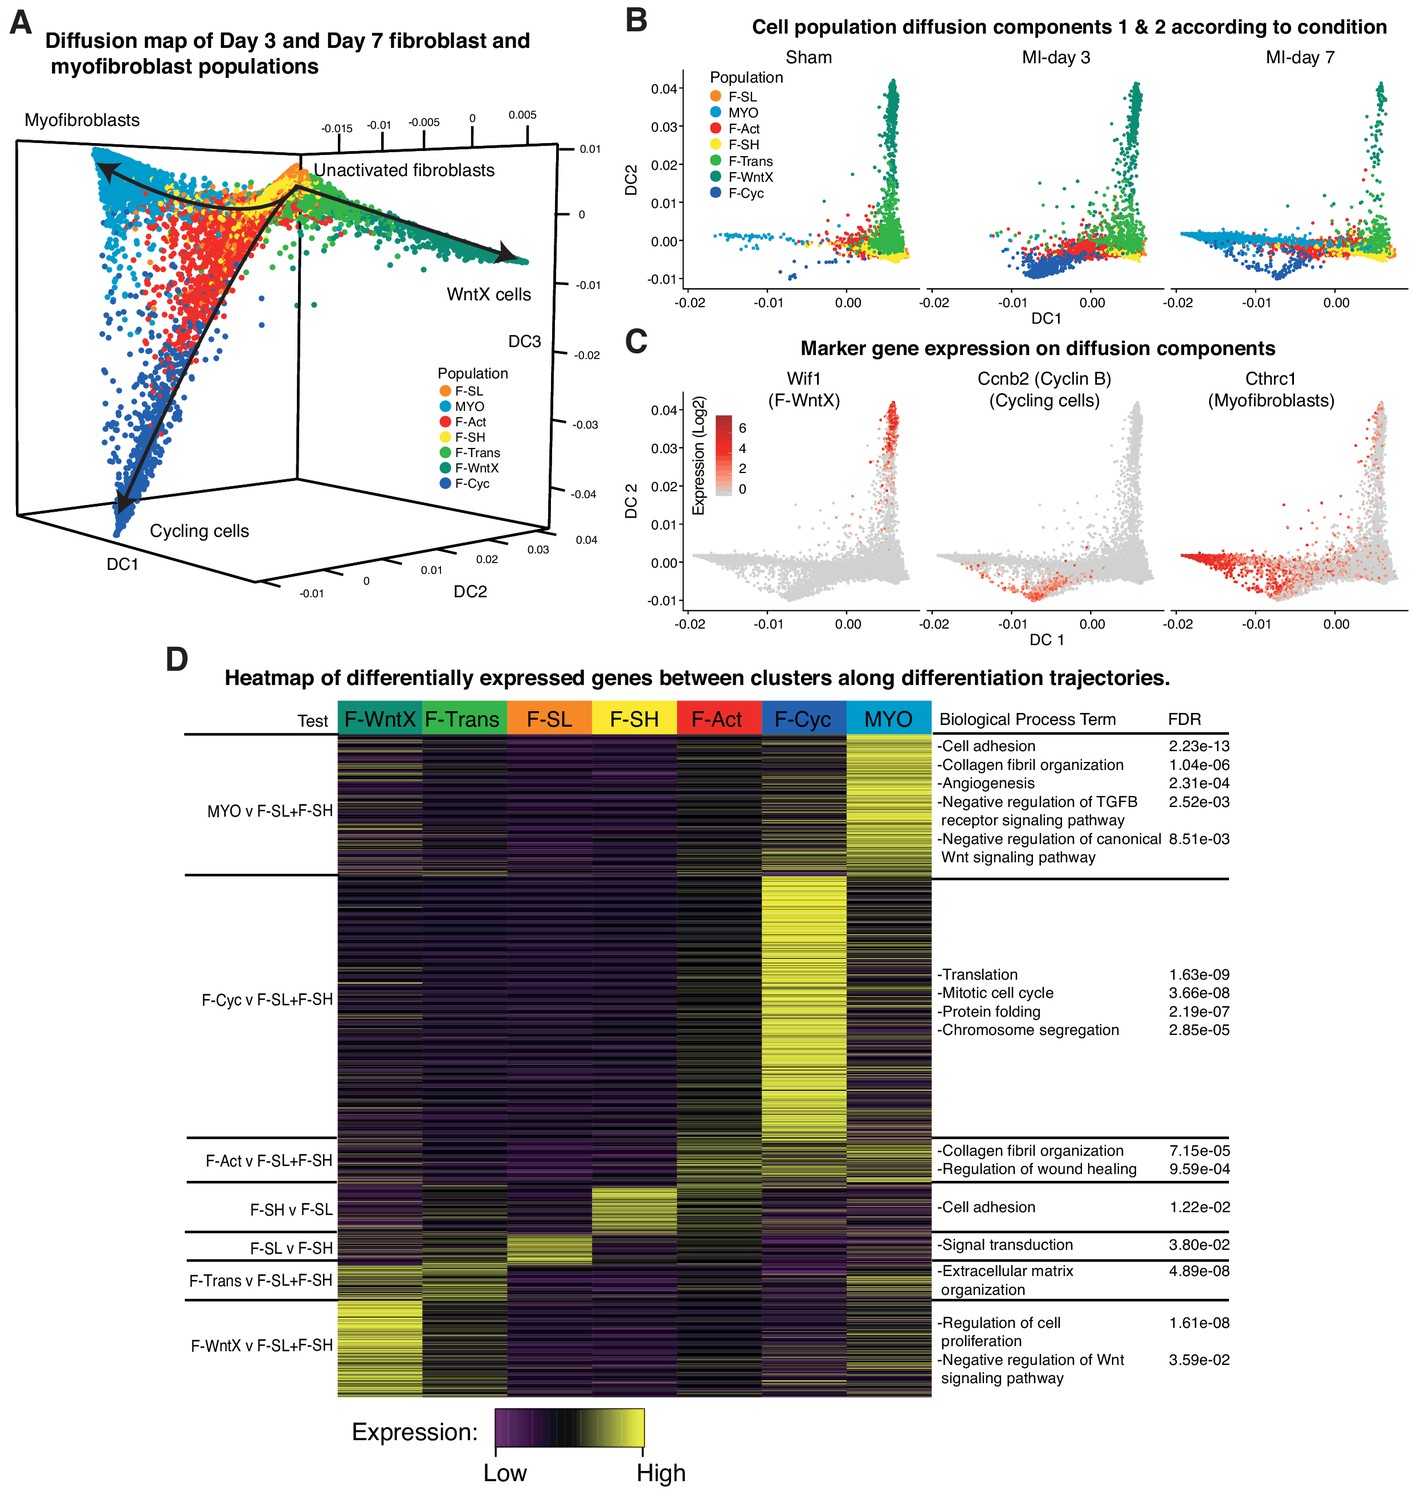
Diffusion Map analysis of GFP+ cells.
(A) 3D Diffusion Map of main fibroblast/myofibroblast populations with cells colored according to population. (B) 2D Diffusion Map facetted according to experimental condition. (C) Expression of marker genes on main trajectories of diffusion components across conditions. (D) Heatmap of differentially expressed genes with representative GO Biological Process terms.
Figure 8 with 1 supplement
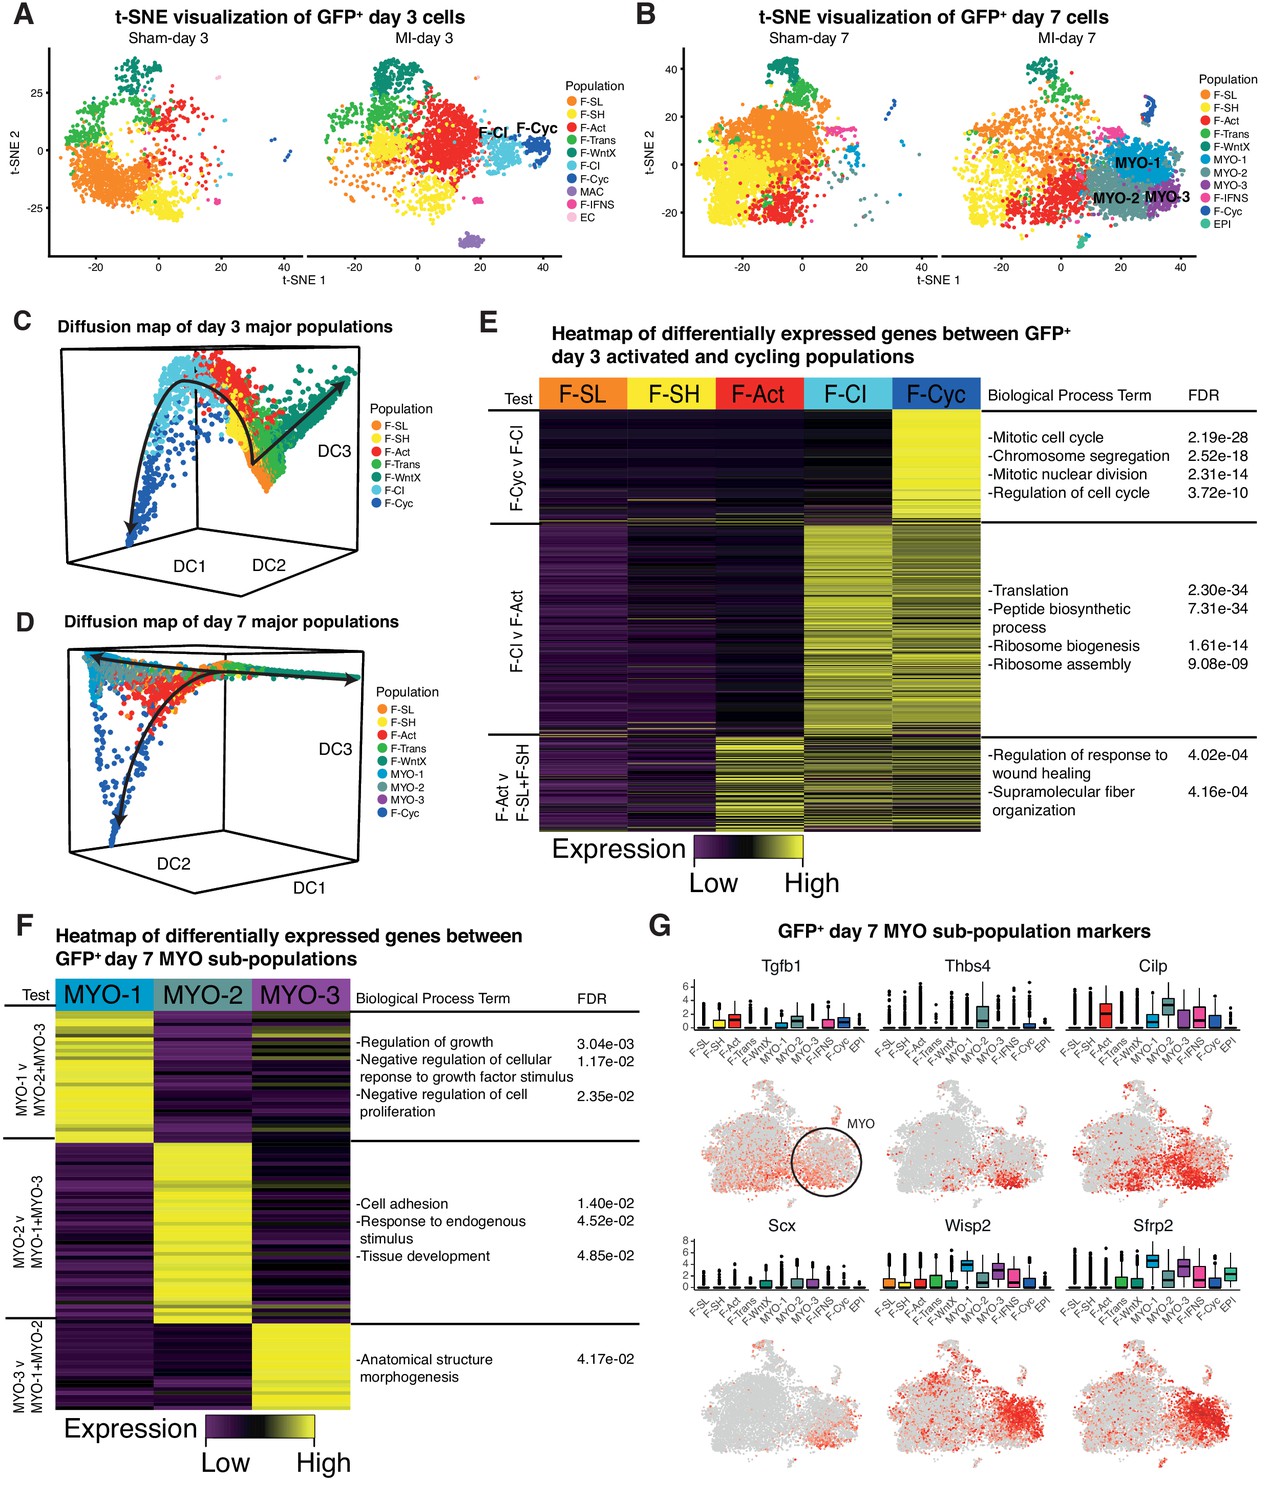
Time-point-specific analysis of GFP+ scRNA-seq.
(A,B) t-SNE visualization of GFP+ populations 3 days post sham/MI (A) and 7 days post sham/MI (B). (C,D) 3D Diffusion Map analysis of day 3 major populations (C) and day 7 major populations (D). (E) Heatmap of upregulated genes in day 3 injury-response populations. (F) Heatmap of differentially expressed genes between myofibroblast sub-populations. (G) Gene expression visualized in box and t-SNE plots for myofibroblast sub-population marker genes.
Figure 8—figure supplement 1
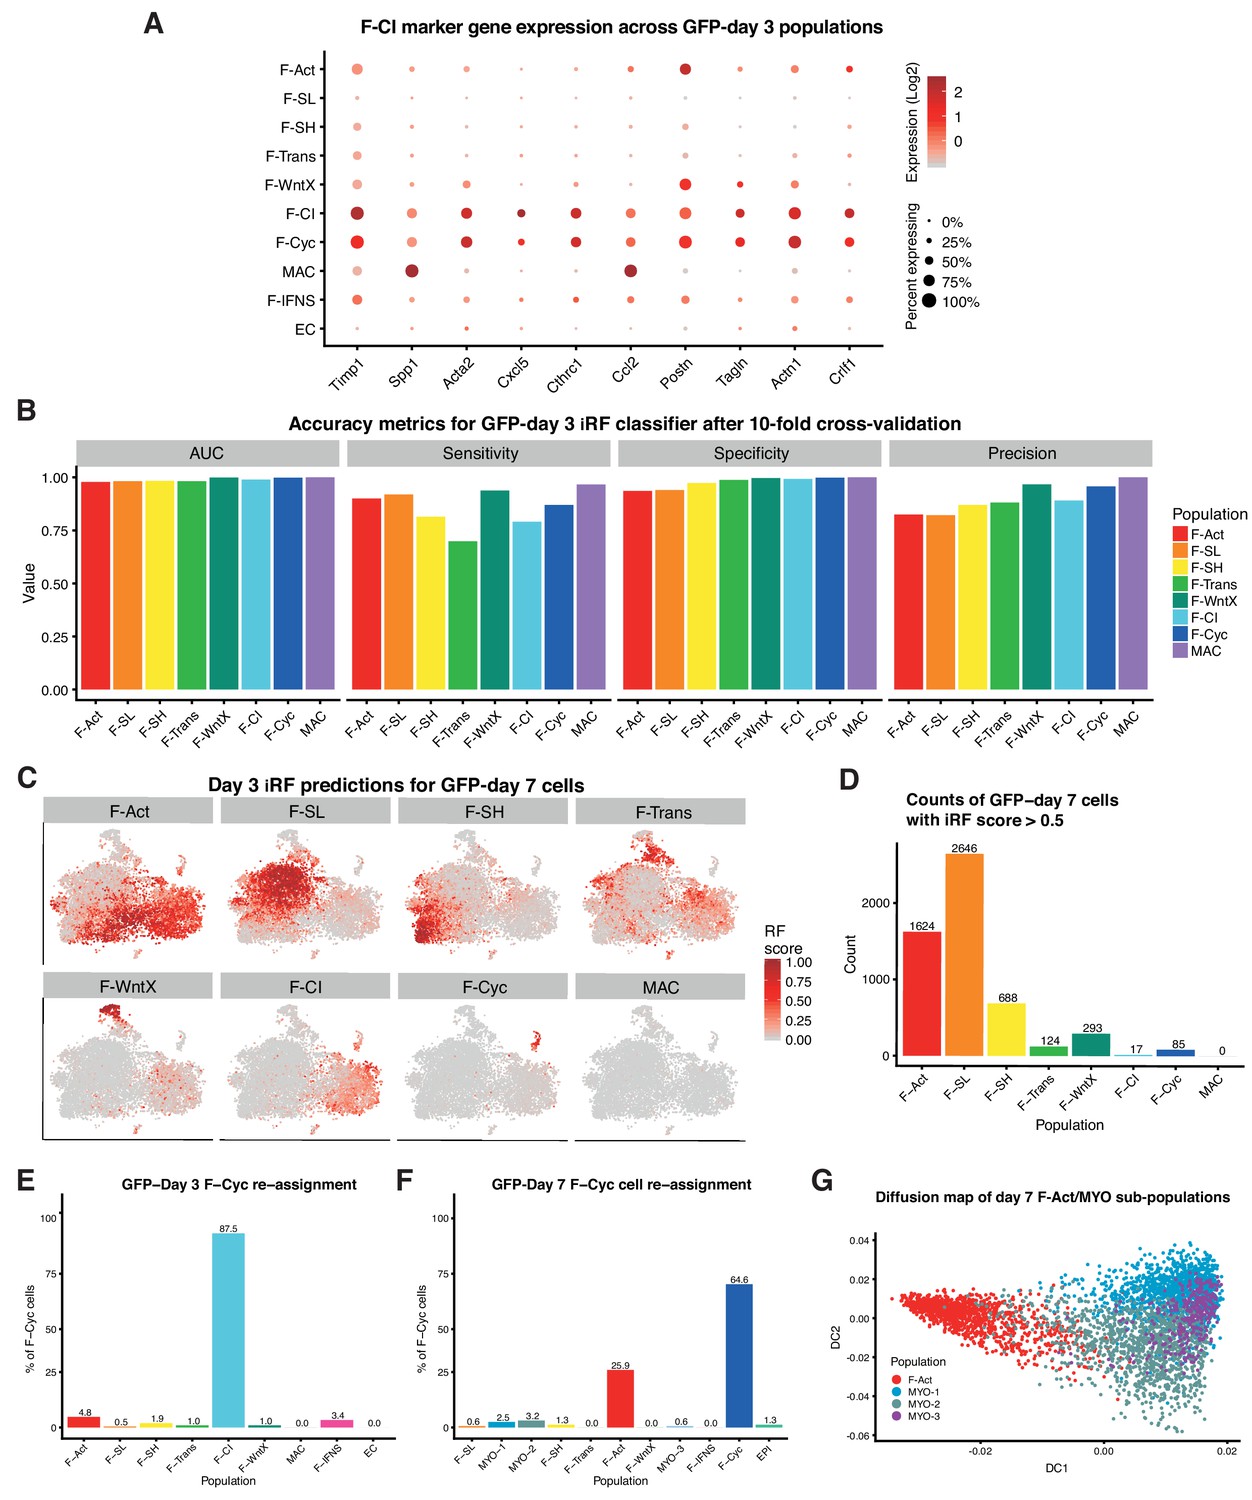
Reanalysis of GFP-day 3 and GFP-day 7 data-sets separately.
(A) Expression of F-CI marker genes on GFP-day 3 dot plot (B) AUC, sensitivity, specificity and precision for iRF classifier trained to predict GFP-day 3 cell populations after 10-fold cross-validation. (C) iRF prediction scores for GFP-day 7 cells as visualized on t-SNE plots. (D) Counts of GFP-day 7 cells predicted to correspond to GFP-day 3 populations as determined by iRF prediction (score >0.5). (E) Percentage of GFP-day 3 F-Cyc cells reassigned to alternative populations after removing cell cycle genes. (F) Percentage of GFP-day 7 F-Cyc cells reassigned to alternative populations after removing cell cycle genes. (G) 2D Diffusion Map plot of F-Act, MYO-1, MYO-2 and MYO-3 from the GFP-day 7 data-set.
Figure 9
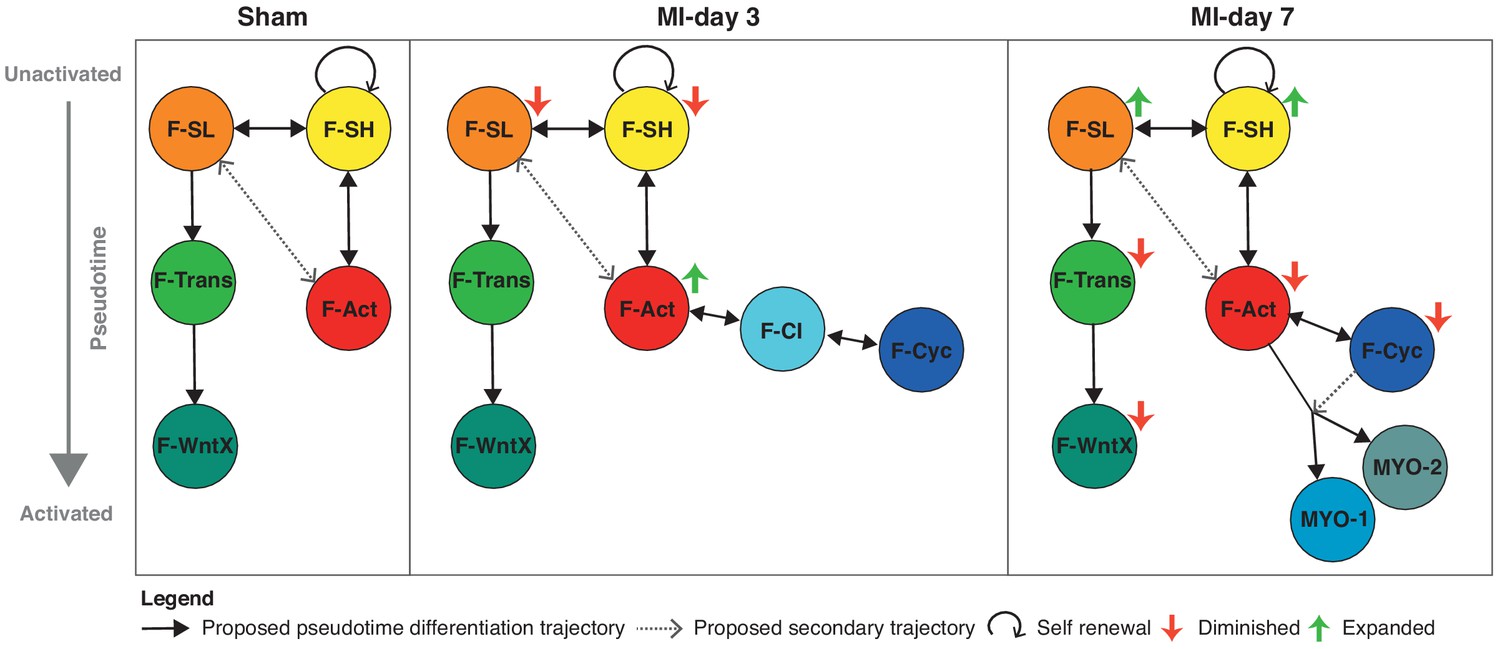
Schematic summary of the flux and pseudotime differentiation dynamics of GFP+ populations between sham, MI-day 3 and MI-day 7.
Populations are ordered in pseudotime from unactivated (top) to most activated/mature (bottom). Arrows connecting populations indicate direction of proposed differentiation/pseudotime trajectory. Colored arrows indicate whether the population appears to expand or diminish relative to the previous time-point.
Tables
Key resources table
| Reagent type (species) or resource | Designation | Source or reference | Identifiers | Additional information |
|---|---|---|---|---|
| Gene (Mus musculus) | Pdgfra | NCBI | NCBI Gene ID: 18595, MGI:97530 | |
| Strain, strain background (Musmusculus, C57BL/6J) | Wild type, WT | The Jackson Laboratory, Stock Number: 000664, | RRID:IMSR:JAX:000664 | |
| Strain, strain background (Musmusculus, C57BL/6J) | Pdgfratm11(EGFP)Sor; PDGFRaGFP/+ | The Jackson Laboratory, Stock Number: 007669, PMID: 12748302 | MGI:2663656 | |
| Antibody | APC-conjugated Rat monoclonal anti-mouse PDGFRa (CD140a) | eBioscience | 17-1401-81, Clone APA5 | (1:200) |
| Antibody | PE-Cy7-conjugated Rat monoclonal anti-mouse CD31 (PECAM-1) | eBioscience | 25-0311-82, Clone 390 | (1:400) |
| Antibody | PE-conjugated Rat monoclonal anti-mouse Sca1 (Ly6A/E) | BD Pharmingen | 553108, Clone D7 | (1:400) |
| Antibody | APC-Cy7-conjugated Rat monoclonal anti-mouse CD45 | BD Pharmingen | 557659, Clone 30-F11 | (1:400) |
| Antibody | PE-conjugated Rat monoclonal anti-mouse F4/80 | eBioscience | 12-4801-82, Clone BM8 | (1:400) |
| Antibody | APC-conjugated Rat monoclonal anti-mouse CD206 (MMR) Antibody | BioLegend | 141708, Clone C068C2 | (1:200) |
| Antibody | Chicken polyclonal anti-GFP | Abcam | ab13970 | (1:200) |
| Antibody | Rabbit polyclonal anti-Wif1 | Abcam | ab186845 | (1:1000) |
| Antibody | Rat monoclonal anti-CD31 | Dianova | DIA-310, Clone SZ31 | (1:100) |
| Antibody | Rat monoclonal anti-CD45 | BD Biosciences | 553076, Clone 30-F11 | (1:100) |
| Antibody | Mouse monoclonal anti-aSMA | Sigma | A2547, Clone 1A4 | (1:100) |
| Antibody | Rat monoclonal anti-Ki67 | Dako | M7249, Clone TEC-3 | (1:100) |
| Antibody | Mouse monoclonal anti-GM130 | BD Biosciences | 610822, Clone 35/GM130 | (1:400) |
| Antibody | Goat polyclonal anti-Chicken Alexa 488 | Life Technologies | A11039 | (1:500) |
| Antibody | Goat polyclonal anti-Rabbit Alexa 555 | Life Technologies | A21429 | (1:500) |
| Antibody | Goat polyclonal anti-Rabbit Alexa 680 | Life Technologies | A21109 | (1:500) |
| Antibody | Goat polyclonal anti-Rat Alexa 555 | Life Technologies | A21434 | (1:500) |
| Antibody | Donkey polyclonal anti-Mouse Alexa 594 | Life Technologies | A21203 | (1:500) |
| Antibody | APC-conjugated Rat monoclonal anti-mouse PDGFRa (CD140a) | eBioscience | 17-1401-81, Clone APA5 | (1:200) |
| Commercial assay or kit | Chromium Single Cell 30 Library and Gel Bead Kit v2 | 10x Genomics | 120237 | |
| Commercial assay or kit | Chromium Single Cell A Chip Kit | 10x Genomics | 120236 | |
| Commercial assay or kit | Chromium i7 Multiplex Kit | 10x Genomics | 120262 | |
| Commercial assay or kit | Nextera XT DNA Sample Preparation Kit (96 Samples) | Illumina | FC-131–1096 | |
| Commercial assay or kit | Nextera XT Index Kit v2 | Illumina | FC-131–2001 | |
| Commercial assay or kit | Fluidigm Single-Cell Auto Prep IFC chip (5–10 um) | Fluidigm | 100–5759 | |
| Commercial assay or kit | SMART-Seq v4 Ultra Low Input RNA Kit for the Fluidigm C1 System | Takara | 635026 | |
| Commercial assay or kit | NextSeq 500/550 High Output Kit v2 | Illumina | FC-404–2002 | |
| Other | LIVE/DEAD Viability/Cytoxicity Kit, for mammalian cells | Thermo Fisher Scientific | L-3224 | |
| Software, algorithm | CellRanger | 10x Genomics | https://support.10xgenomics.com/single-cell-gene-expression/software/downloads/latest | |
| Software, algorithm | STAR | PMID: 23104886 | https://github.com/alexdobin/STAR; RRID: SCR_015899 | |
| Software, algorithm | Bowtie 2 | PMID: 22388286 | http://bowtie-bio.sourceforge.net/bowtie2/index.shtml; RRID:SCR_005476 | |
| Software, algorithm | featureCounts | PMID: 24227677 | http://subread.sourceforge.net; RRID:SCR_012919 | |
| Software, algorithm | Seurat | PMID: 29608179 | https://satijalab.org/seurat/; RRID: SCR_007322 | |
| Software, algorithm | Destiny | PMID: 26668002 | https://bioconductor.org/packages/release/bioc/html/destiny.html | |
| Software, algorithm | PANTHER | PMID: 27899595 | http://www.pantherdb.org; RRID:SCR_004869 | |
| Software, algorithm | Iterative Random Forest | PMID: 29351989 | https://cran.r-project.org/web/packages/iRF/index.html | |
| Software, algorithm | Differential Proportion Analysis | This paper | Source code 1 | Materials and methods: Differential proportion analysis |
| Software, algorithm | Cell communication analysis | This paper | Source code 1 | Materials and methods: Ligand-receptor networks |
Additional files
-
Source code 1
R code for processing and clustering of scRNA-seq data-sets, differential proportion analysis and cell communication network analysis.
- https://doi.org/10.7554/eLife.43882.034
-
Supplementary file 1
Differentially expressed genes across TIP sub-populations.
- https://doi.org/10.7554/eLife.43882.035
-
Supplementary file 2
Differential proportion analysis p-value results for TIP and GFP+ sub-populations.
- https://doi.org/10.7554/eLife.43882.036
-
Supplementary file 3
Differentially expressed genes between Mo/MΦ sub-populations in TIP.
- https://doi.org/10.7554/eLife.43882.037
-
Supplementary file 4
Differentially expressed genes across GFP+ sub-populations.
- https://doi.org/10.7554/eLife.43882.038
-
Supplementary file 5
Differentially expressed genes across GFP+ Diffusion Map trajectories.
- https://doi.org/10.7554/eLife.43882.039
-
Supplementary file 6
GO Biological Process terms associated with GFP+ trajectory differentially expressed genes.
- https://doi.org/10.7554/eLife.43882.040
-
Supplementary file 7
Differentially expressed genes from GFP+ day 3 injury response populations.
- https://doi.org/10.7554/eLife.43882.041
-
Supplementary file 8
GO Biological Process terms associated with GFP+ day 3 injury response populations according to Diffusion Map trajectory: F-Act, F-CI and F-Cyc.
- https://doi.org/10.7554/eLife.43882.042
-
Supplementary file 9
Differentially expressed genes between myofibroblast sub-populations in GFP+ day 7 scRNA-seq.
- https://doi.org/10.7554/eLife.43882.043
-
Supplementary file 10
GO Biological Process terms associated with myofibroblast sub-populations in GFP+ day 7 scRNA-seq.
- https://doi.org/10.7554/eLife.43882.044
-
Supplementary file 11
Spearman correlation test comparisons between TGF-β -treated cardiac fibroblast RNA-seq and GFP+ day 7 sub-populations.
- https://doi.org/10.7554/eLife.43882.045
-
Transparent reporting form
- https://doi.org/10.7554/eLife.43882.046
Download links
A two-part list of links to download the article, or parts of the article, in various formats.
Downloads (link to download the article as PDF)
Open citations (links to open the citations from this article in various online reference manager services)
Cite this article (links to download the citations from this article in formats compatible with various reference manager tools)
Single-cell expression profiling reveals dynamic flux of cardiac stromal, vascular and immune cells in health and injury
eLife 8:e43882.
https://doi.org/10.7554/eLife.43882


