Dynamic enhancer partitioning instructs activation of a growth-related gene during exit from naïve pluripotency
- PSL Research University, INSERM, CNRS, France
- Université Paris Sud, Université Paris-Saclay, CEA, CNRS, France
Figures
Figure 1 with 3 supplements
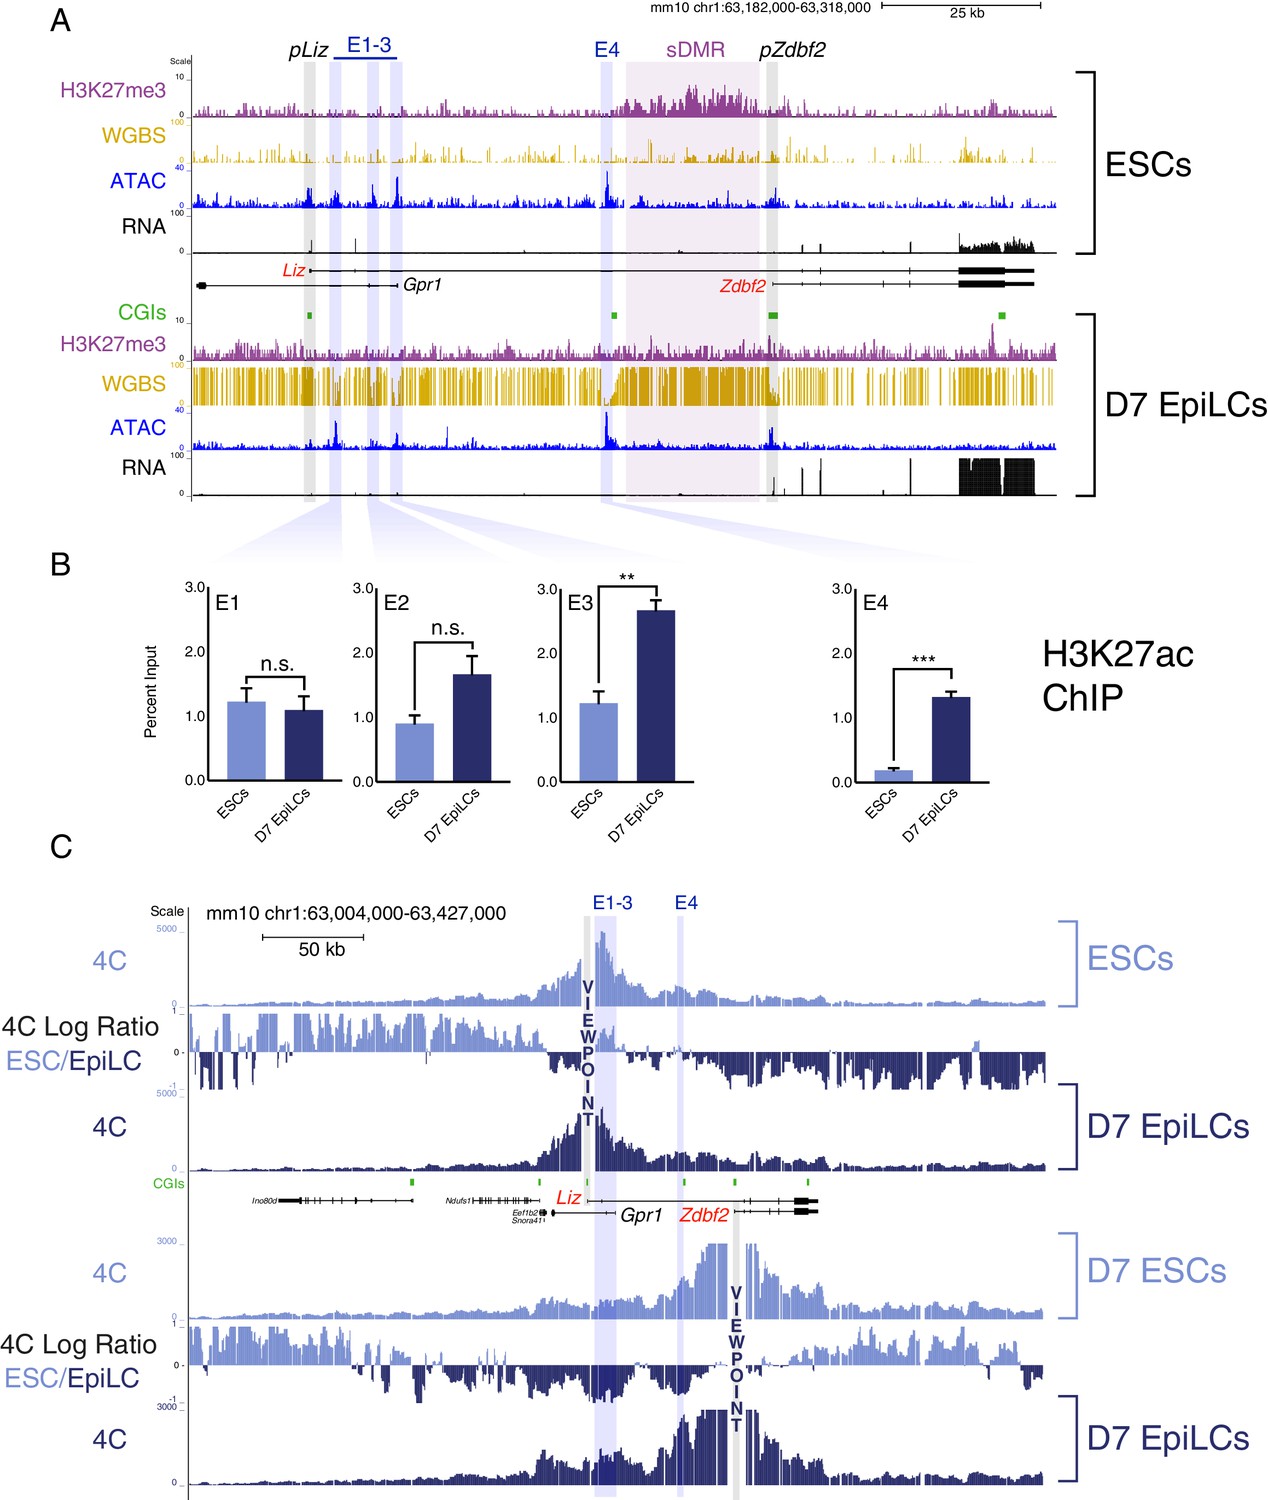
The Zdbf2 locus exhibits dynamic enhancer activity during differentiation.
(A) Chromatin and expression landscape at the Zdbf2 locus in ESCs (top) and D7 EpiLCs (bottom). In hypomethylated naïve ESCs, Zdbf2 initiates from the pLiz promoter while a ~ 25 kb block of H3K27me3 extends through pZdbf2. Upon EpiLC differentiation, the H3K27me3 signal depletes while DNA methylation is gained; the pLiz ATAC-seq peak decreases concomitantly with decreased expression, while pZdbf2 becomes the main promoter. Four prominent ATAC-seq peaks of accessible chromatin (E1 to E4) lie between pLiz and pZdbf2 promoters. WGBS: Whole genome bisulfite sequencing. H3K27me3 ChIP-seq data is from Greenberg et al. (2017). All other genomics data were generated for this study. One representative biological replicate is displayed for each RNA-seq track. (B) H3K27ac ChIP-qPCR shows enrichment for this mark at E1 to E3 in ESCs and D7 EpiLCs, while E4 only becomes enriched in EpiLCs. Data shown as ±s.e.m. from three biological replicates. (C) 4C-seq tracks from the pLiz (top) and pZdbf2 (bottom) viewpoints (VPs) in ESCs and D7 EpiLCs. ESC/EpiLC ratio between 4C-seq signals is indicated. pLiz interactions with E1-3 are more frequent in ESCS, but remain high in EpiLCs, likely due to proximity. pLiz seems less restricted in EpiLCs, with interactions spreading on the ‘right’ side of the locus. pZdbf2 exhibits increased interactions at E1 to E4 in EpiLCs over ESCs. Data from one representative biological replicate (two total). Statistical analyses were performed by two-tailed unpaired t-test: n.s = not significant, **p≤0.01, ***p≤0.001.
-
Figure 1—source data 1
Source data for Figure 1.
- https://doi.org/10.7554/eLife.44057.006
Figure 1—figure supplement 1
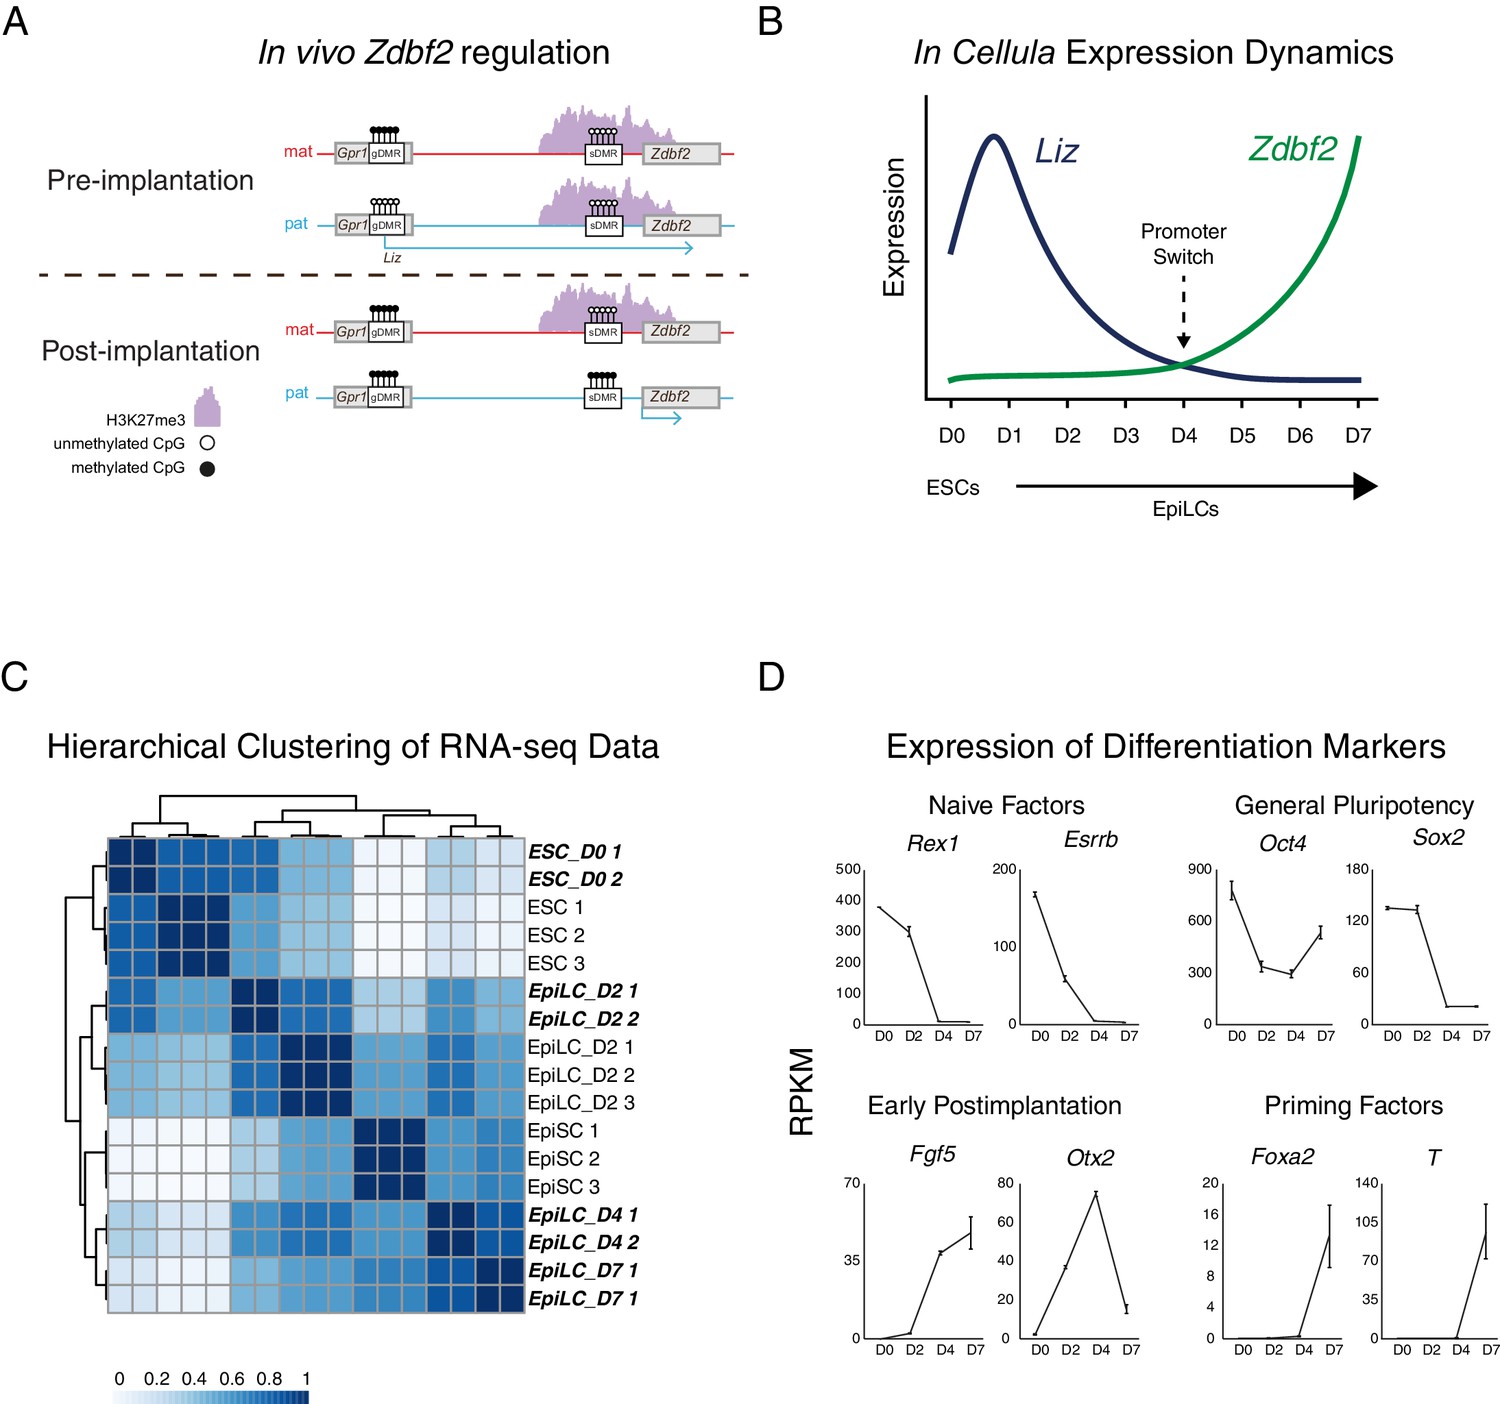
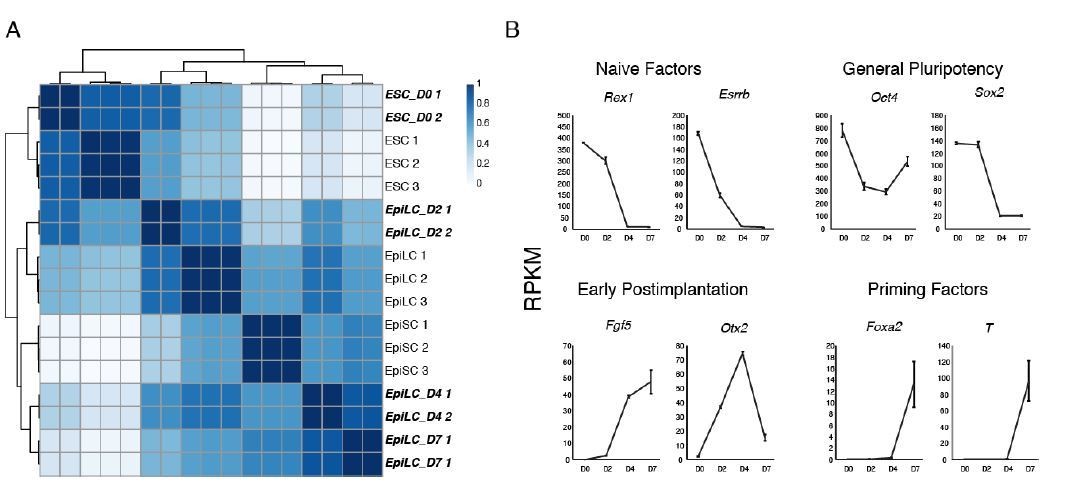
Zdbf2 expression dynamics during differentiation.
(A) Imprinted regulation of Liz and Zdbf2 in vivo. The Liz promoter is DNA methylated and silent on the maternal allele. Conversely, the paternal allele is expressed, leading to de novo DNA methylation at the paternal sDMR, and Zdbf2 activation. The epigenetic setting is programmed around the time of implantation in embryogenesis, but is then stably maintained throughout life. (B) Expression dynamics of promoter switch during protracted EpiLC differentiation. The pLiz-to-pZdbf2 promoter switch occurs at roughly D4. pLiz is shut down and pZdbf2 is active by D7. (C) Hierarchical clustering using correlation-based distance of WT RNA-seq data during EpiLC differentiation. Samples generated in this study are highlighted in bold and italic type. In comparison with publicly available data (Bao et al., 2018), D4 and D7 EpiLCs cluster more closely with EpiSCs, indicating a primed pluripotency state. (D) Plots of reads per kilobase million (RPKM) from RNA-seq of WT cells during EpiLC differentiation for selected markers. Upregulation of markers of primed pluripotency indicate that D7 EpiLCs have entered a primed pluripotency state.
Figure 1—figure supplement 2
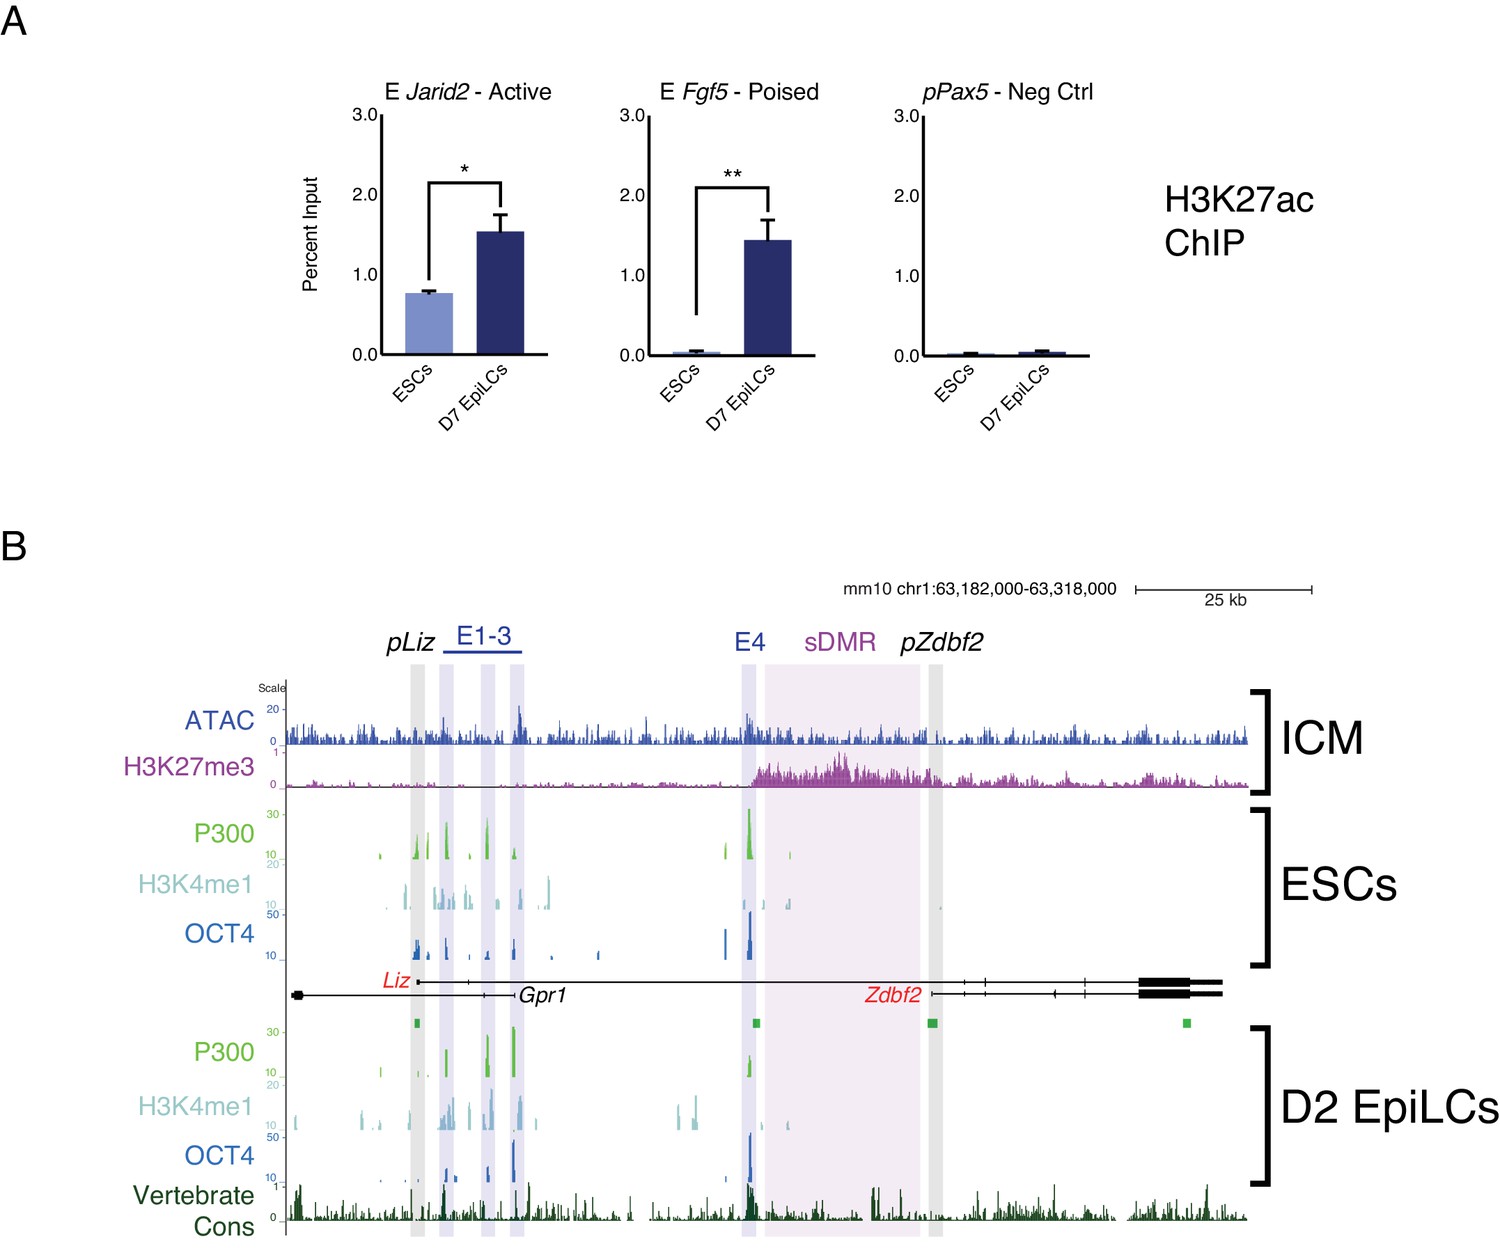
Chromatin landscape of the Zdbf2 locus in cellula and in vivo.
(A) H3K27ac ChIP-qPCR at control loci. The Jarid2 enhancer (E Jarid2) is active in ESCs and EpiLCs, whereas E Fgf5 is a poised enhancer (Buecker et al., 2014). pPax5 is a negative control. Data shown as ±s.e.m. from three biological replicates. (B) In vivo and in cellula chromatin landscape of the Zdbf2 locus. Top panel: in the in vivo ICM, the chromatin accessibility (Wu et al., 2016) and H3K27me3 (Liu et al., 2016) patterns resemble the in cellula system. Bottom panels: published data (Buecker et al., 2014) showing that active and poised enhancers are bound by P300 and OCT4. E1-3 are marked by H3K4me1, but not E4. E4 exhibits higher vertebrate conservation (PhastCons) than other local enhancer elements. Statistical analyses were performed by two-tailed unpaired t-test: *p≤0.05, **p≤0.01.
Figure 1—figure supplement 3
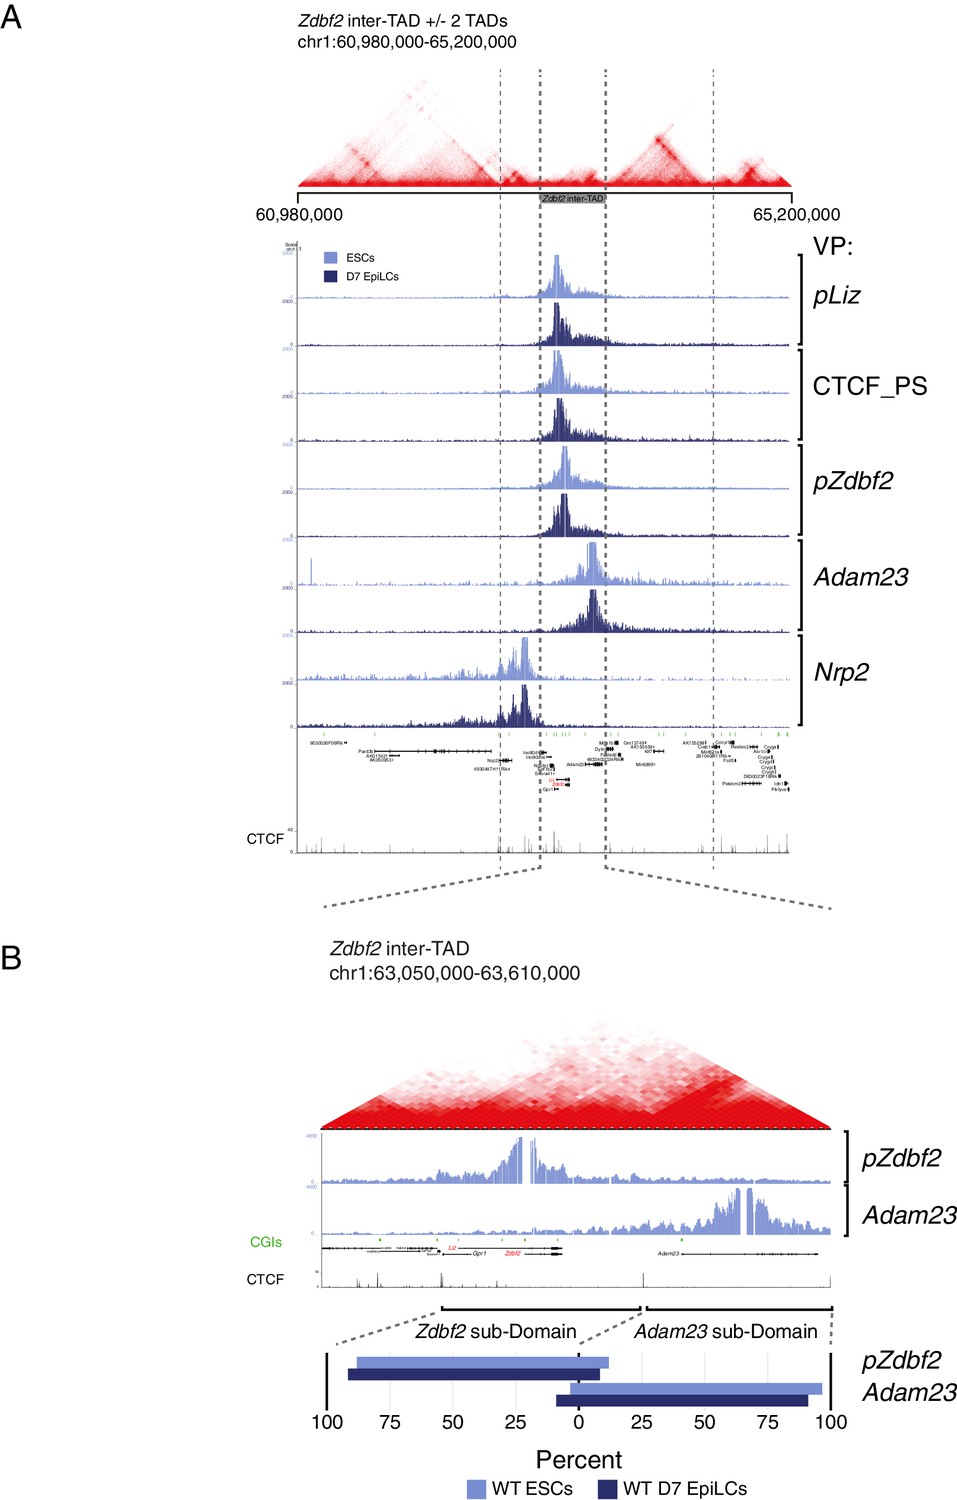
Zdbf2 locus interactions restricted within inter-TAD region.
(A) Hi-C data from mouse ESCs (Bonev et al., 2017) overlaid with 4C-seq data from ESCs and EpiLCs (this study). The Zdbf2 locus is located in an inter-TAD, and 4C-seq shows that local interactions are restricted to the inter-TAD. (B) Top: Zoom-in of inter-TAD indicates that the region can be further subdivided, with pZdbf2 primarily interacting in a compartment within the inter-TAD. Bottom: Summaries of the interaction frequencies (unnormalized reads) of pZdbf2 and Adam23 VPs in ESCs and EpiLCs. In both cell types, the interactions mainly occur in respective subdomains of the inter-TAD. The boundary was defined as a CTCF binding site.
Figure 2 with 1 supplement
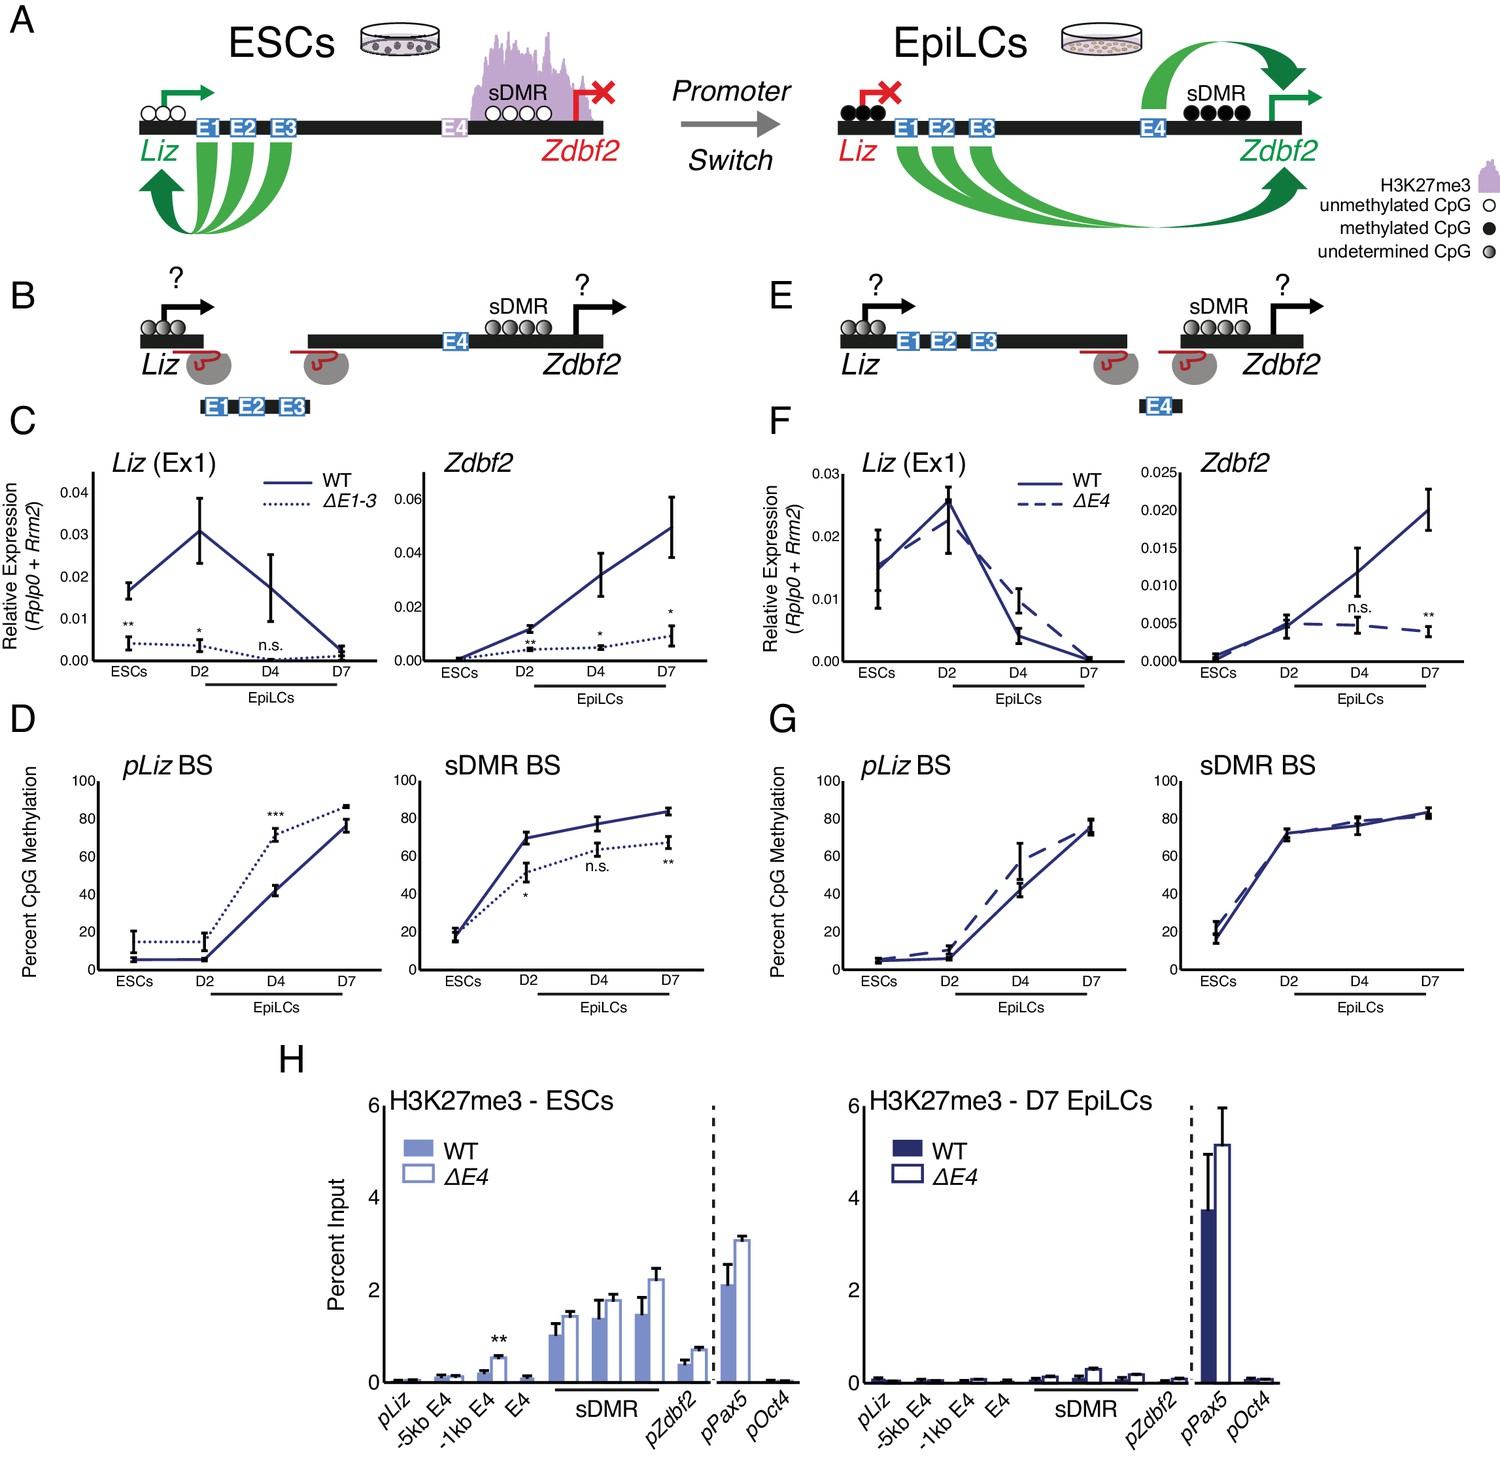
Genetic deletions of enhancer elements impact pLiz/pZdbf2 regulation.
(A) Model for enhancer regulation based on 4C-seq data. (B) Model for deletion of E1-3.. (C) RT-qPCR of Liz (left) and Zdbf2 (right) during EpiLC differentiation in WT and the ∆E1-3 mutant. The ∆E1-3 mutation significantly reduces both transcripts. Data are shown as ±s.e.m. from five and three biological replicates for WT and mutant, respectively. (D) DNA methylation of pLiz (left) and the sDMR (right) during EpiLC differentiation as measured by bisulfite conversion followed by pyrosequencing (BS-pyro) in WT and the ∆E1-3 mutant. When Liz fails to activate, DNA methylation is acquired faster at pLiz, and fails to properly accumulate at the sDMR. Data shown as ±s.e.m. from five and three biological replicates for WT and mutant, respectively. (E) Model for deletion of E4. (F) RT-qPCR of Liz (left) and Zdbf2 (right) during EpiLC differentiation in WT and the ∆E4 mutant. There is no effect on Liz expression dynamics, but Zdbf2 does not properly activate. Data shown as ±s.e.m. from four biological replicates for each genotype. (G) DNA methylation of pLiz (left) and the sDMR (right) during EpiLC differentiation as measured by BS-pyro in WT and the ∆E4 mutant. DNA methylation is unperturbed in the ∆E4 mutant. Data are shown as ±s.e.m. from four biological replicates for each genotype. (H) H3K27me3 ChIP-qPCR in ESCs (left) and EpiLCs (right). There is no significant effect on polycomb dynamics in ∆E4 mutation, except mild ectopic spreading upstream of the sDMR region. pPax5 and pOct4 are positive and negative controls, respectively. Data shown as ±s.e.m. from three biological replicates for each genotype. Statistical analyses were performed by two-tailed unpaired t-test: n.s = not significant, *p≤0.05, **p≤0.01, ***p≤0.001.
-
Figure 2—source data 1
Source data for Figure 2.
- https://doi.org/10.7554/eLife.44057.009
Figure 2—figure supplement 1
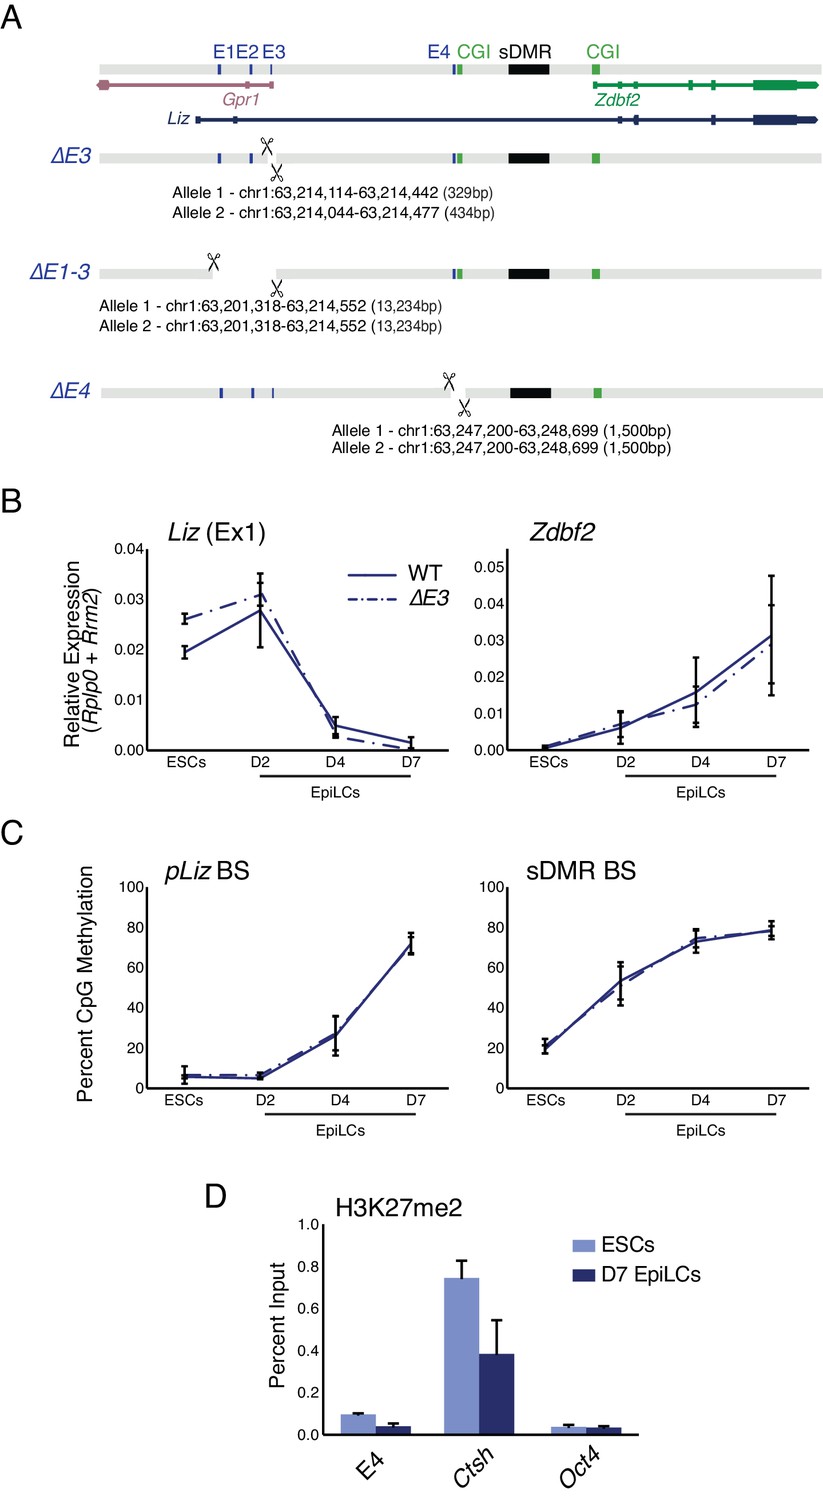
E3 deletion has minimal effect on locus regulation, E4 is devoid of PRC2 signature.
(A) Alleles generated by CRISPR/Cas9 mediated deletions of enhancer elements. (B) RT-qPCR of Liz (left) and Zdbf2 (right) during EpiLC differentiation in WT and the ∆E3 mutant. There is no effect on Liz or Zdbf2 expression. Data shown as ±s.e.m. from at least four biological replicates for each genotype. (C) DNA methylation of pLiz (left) and the sDMR (right) during EpiLC differentiation as measured by BS-pyro in WT and the ∆E3 mutant. DNA methylation is unperturbed. Data shown as ±s.e.m. from four biological replicates for each genotype. (D) H3K27me2 ChIP-qPCR at E4 in WT ESCs and EpiLCs. E4 is depleted for the mark in both cell types. Data shown as ±s.e.m. from three biological replicates. Ctsh and Oct4 are positive and negative controls, respectively.
Figure 3 with 1 supplement
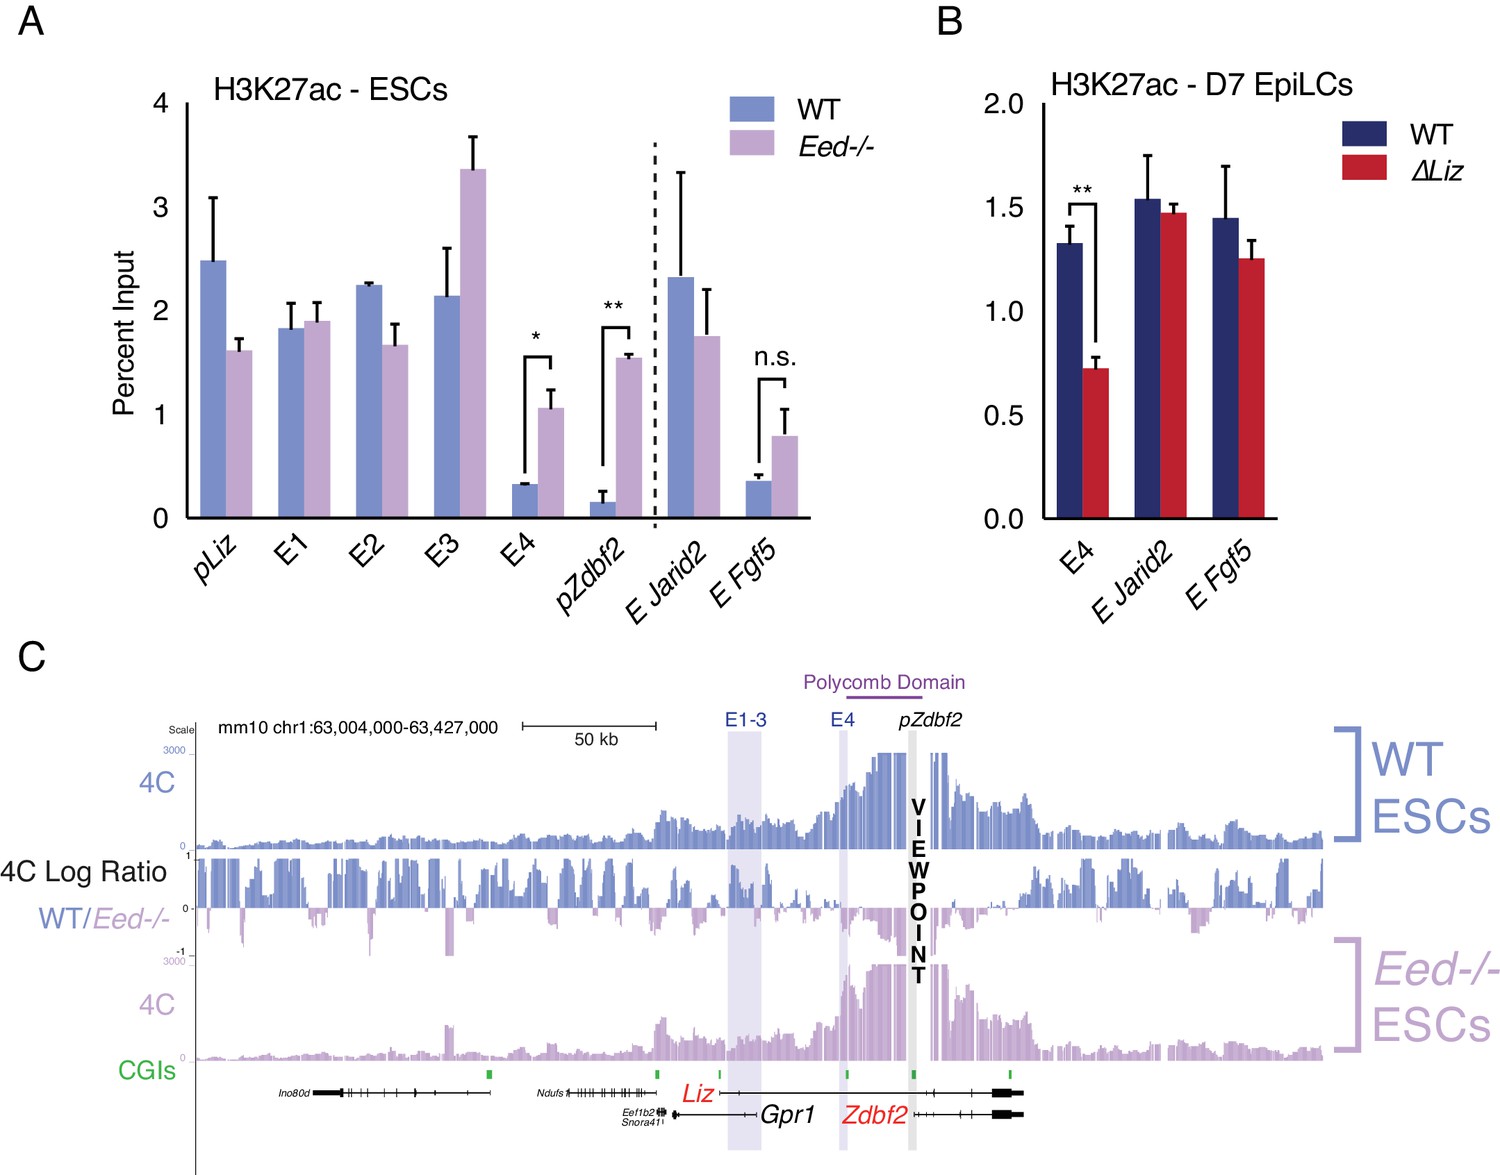
Polycomb regulates E4, but plays minor role in chromosome conformation.
(A) H3K27ac ChIP-qPCR in WT and Eed-/- ESCs. H3K27ac levels are unaffected at pLiz and E1-3, but E4 and pZdbf2 become aberrantly activated in Eed-/- ESCs. Data shown as ±s.e.m. from two biological replicates for both genotypes. (B) H3K27ac ChIP-qPCR in WT and ∆Liz EpiLCs. In ∆Liz mutants, when the sDMR remains enriched for H3K27me3, E4 remains diminished for H3K27ac. Data shown as ±s.e.m. from three biological replicates for both genotypes. (C) 4C-seq tracks from the pZdbf2 VP in WT and Eed-/- ESCs. Ratios between 4C-seq signals is indicated in between the samples. In Eed mutants, pZdbf2 exhibits increased interactions at E4, but not E1-3. Statistical analyses were performed by two-tailed unpaired t-test: n.s = not significant, *p≤0.05, **p≤0.01.
-
Figure 3—source data 1
Source data for Figure 3.
- https://doi.org/10.7554/eLife.44057.012
Figure 3—figure supplement 1
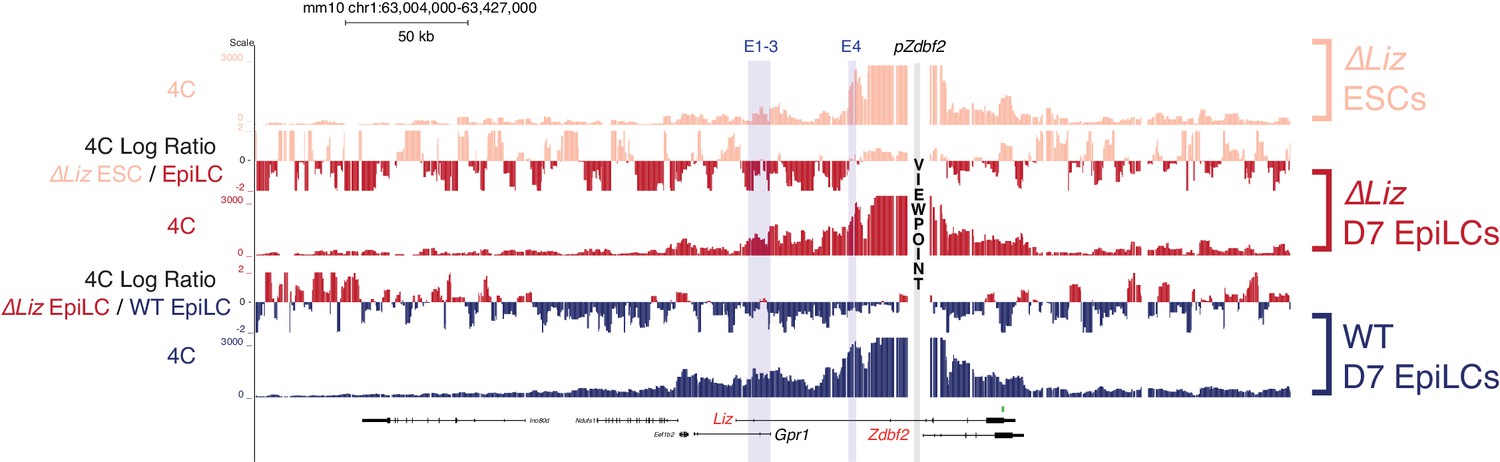
Liz exerts minimal effect on chromosome conformation at the Zdbf2 locus 4C-seq tracks from the pZdbf2 VP in ∆Liz ESCs and EpiLCs and WT EpiLCs.
Ratios between 4C-seq signals is indicated in between the samples. While pZdbf2 interacts with E1-4 at greater frequencies in ∆Liz EpiLCs compared to ∆ Liz ESCs, it is not to the same extent as WT EpiLCs. Data from one representative biological replicate (two total).
Figure 4 with 3 supplements
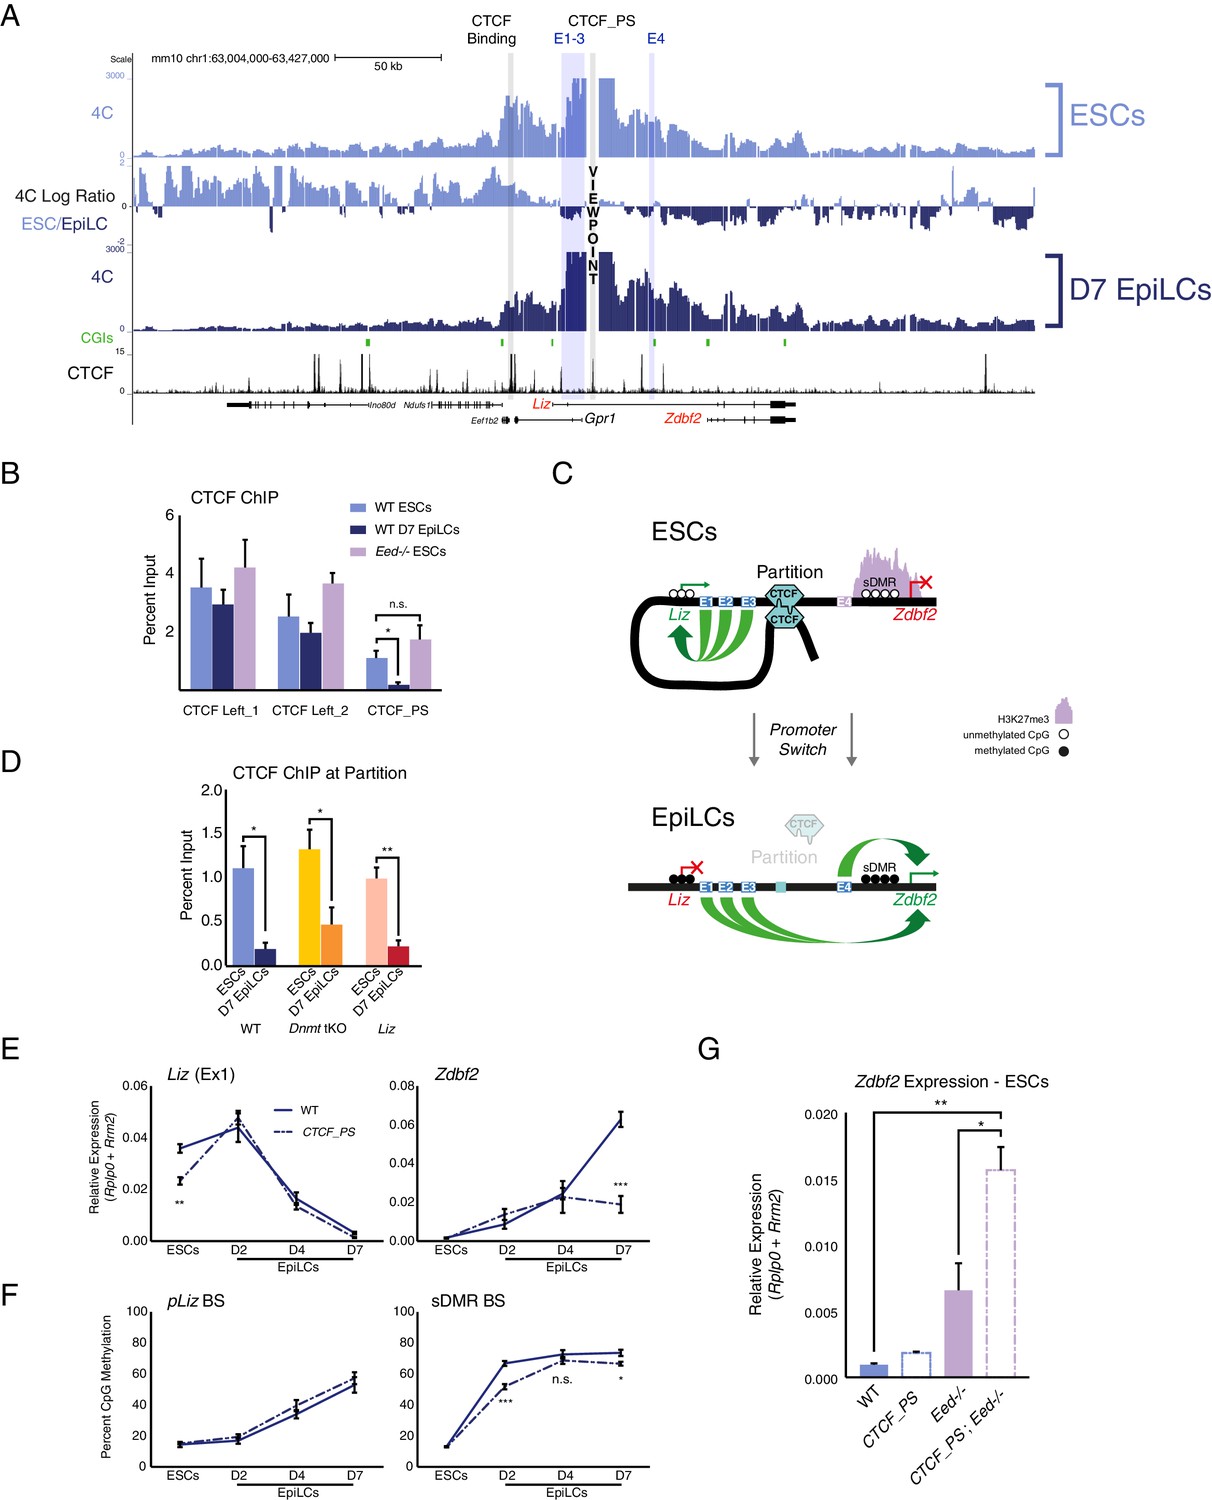
The Zdbf2 locus is partitioned by CTCF, which instructs expression dynamics.
(A) 4C-seq tracks from the CTCF_PS VP in WT ESCs and EpiLCs. Ratios between 4C-seq signals is indicated between the samples, and gene and CTCF binding tracks (Stadler et al., 2011) are below. The CTCF_PS forms a loop with two CTCF sites downstream of the Gpr1 gene. The looping diminishes in EpiLCs. (B) CTCF ChIP-qPCR in WT ESCs and EpiLCs and Eed-/- ESCs. CTCF binding remains unchanged in all conditions on the two sites downstream of Gpr1 (termed CTCF Left_1 and Left_2). At the CTCF_PS, CTCF binding reduces from WT ESCs to EpiLCs, which is correlated with decreased interactions between CTCF_PS and the two upstream CTCF sites. CTCF binding remains enriched in Eed-/- ESCs, consistent with the maintained loop structure. Data shown as ±s.e.m. from three biological replicates. (C) CTCF ChIP-qPCR in WT, Dnmt tKO and ∆Liz ESCs and EpiLCs. CTCF binding is depleted at the CTCF_PS in EpiLCs in all three contexts. Data shown as ±s.e.m. from three biological replicates. (D) Model for CTCF-mediated partitioning of the locus. In ESCs, pLiz and E1-3 are active, and physically separated from the silent E4 and pZdbf2. During differentiation, the partition is diminished, allowing E1-3 to bolster pZdbf2 activation, while pLiz has become silent. (E) RT-qPCR of Liz (left) and Zdbf2 (right) during EpiLC differentiation in WT and the ∆CTCF_PS mutant. Liz is less expressed in mutant ESCs, but reaches WT levels of expression during differentiation. Nevertheless, Zdbf2 does not properly activate in the mutant. Data are shown as ±s.e.m. from four biological replicates for each genotype. (F) DNA methylation of pLiz (left) and the sDMR (right) during EpiLC differentiation as measured by BS-pyro in WT and the ∆ mutant. DNA methylation is unperturbed in the mutant at pLiz, but is reduced at the sDMR. Data shown as ±s.e.m. from four biological replicates for each genotype. (G) RT-qPCR of Zdbf2 in ESCs in absence of CTCF partition and/or PRC2. While Zdbf2 is already upregulated in the Eed mutant, this effect is exacerbated in the absence of the partition, likely because pZdbf2 is less restrained from interacting with E1-3. Data shown as ±s.e.m. from three biological replicates for each genotype. Statistical analyses were performed by two-tailed unpaired t-test: n.s. = not significant, *p≤0.05, **p≤0.01, ***p≤0.001.
-
Figure 4—source data 1
Source data for Figure 4.
- https://doi.org/10.7554/eLife.44057.017
Figure 4—figure supplement 1
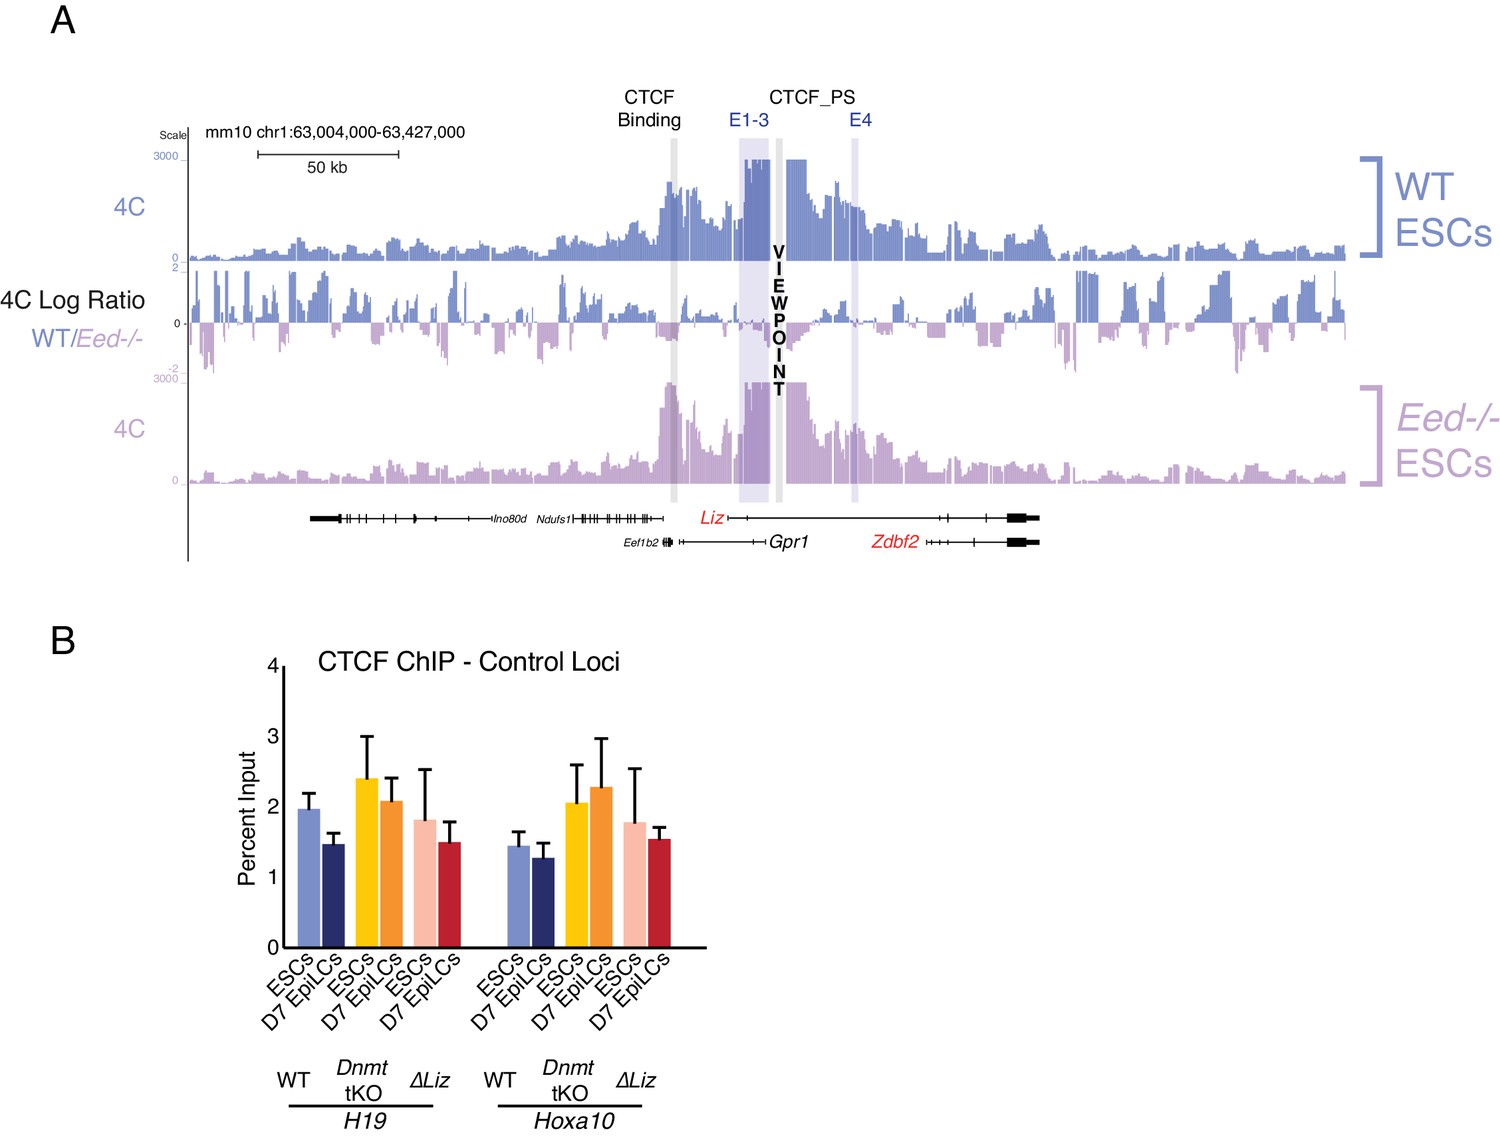
CTCF dynamics maintained in polycomb, DNA methylation, and Liz mutant background.
(A) 4C-seq tracks from the CTCF_PS VP in WT and Eed-/- ESCs. Ratios between 4C-seq signals is indicated between the samples. The partition loop still persists in Eed-/- ESCs, even though Zdbf2 is active. Data from one representative biological replicate (two total). (B) CTCF ChIP-qPCR in WT, Dnmt tKO and ∆Liz ESCs and EpiLCs at control loci. Statistical analyses were performed by two-tailed unpaired t-test: *p≤0.05, **p≤0.01.
Figure 4—figure supplement 2
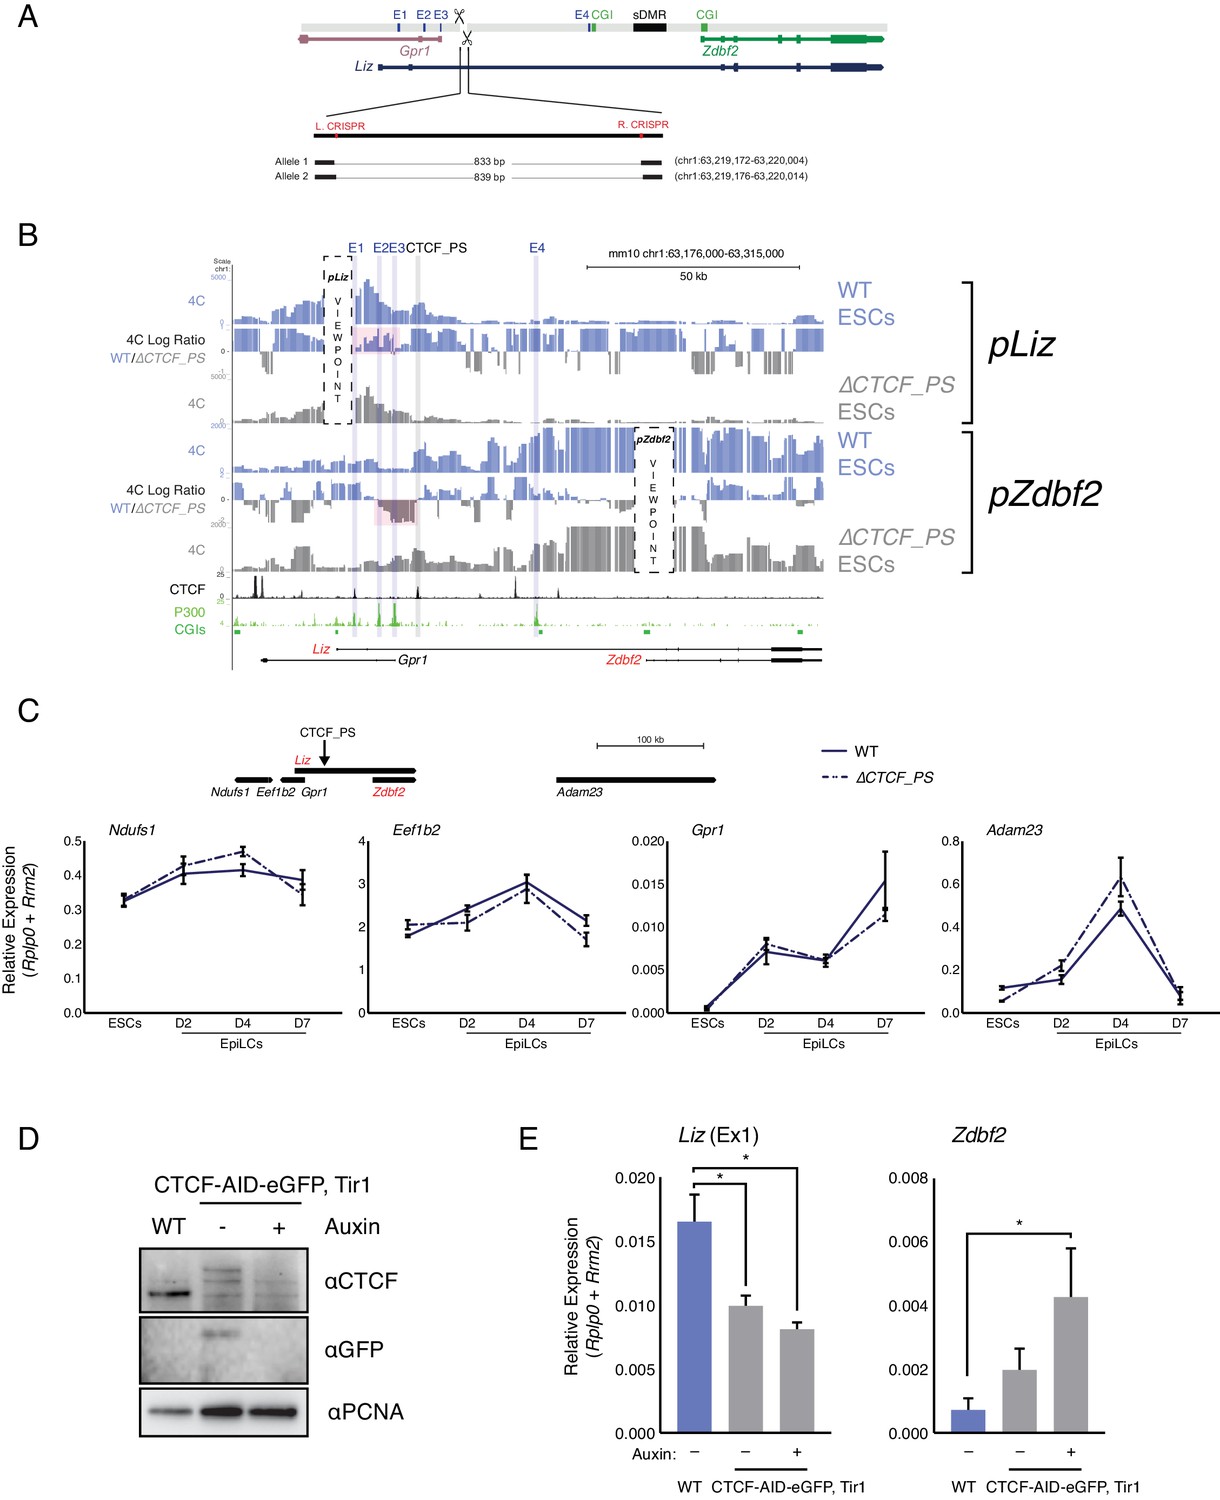
CTCF_PS deletion impacts locus regulation.
(A) Alleles generated by CRISPR/Cas9-mediated deletions of CTCF_PS. (B) 4C-seq tracks for WT and ∆ ESCs. Top: pLiz VP exhibits less interactions with E1-3 in absence of CTCF partition (high-lighted in pink). Bottom: pZdbf2 VP exhibits less restricted looping with E2 and E3, although no increase with E1 (highlighted in pink). (C) RT-qPCR of genes flanking Zdbf2 locus in WT and the ∆CTCF_PS mutant. No significant alteration of the expression pattern is observed. Note: The gene model at top of figure is not to scale. (D) Western blot showing decrease and loss of CTCF in CTCF-eGFP-AID and CTCF-eGFP-AID+Auxin treated cells, respectively (E) RT-qPCR of Liz (left) and Zdbf2 (right) in CTCF-eGFP-AID line ESCs. Liz is downregulated even in the absence of auxin, but the decrease is not greatly exacerbated with complete loss of CTCF. Zdbf2 is upregulated when CTCF is globally depleted and lost, indicating CTCF-based regulation, either directly or indirectly, in ESCs. Statistical analyses were performed by two-tailed unpaired t-test: *p≤0.05.
Figure 4—figure supplement 3
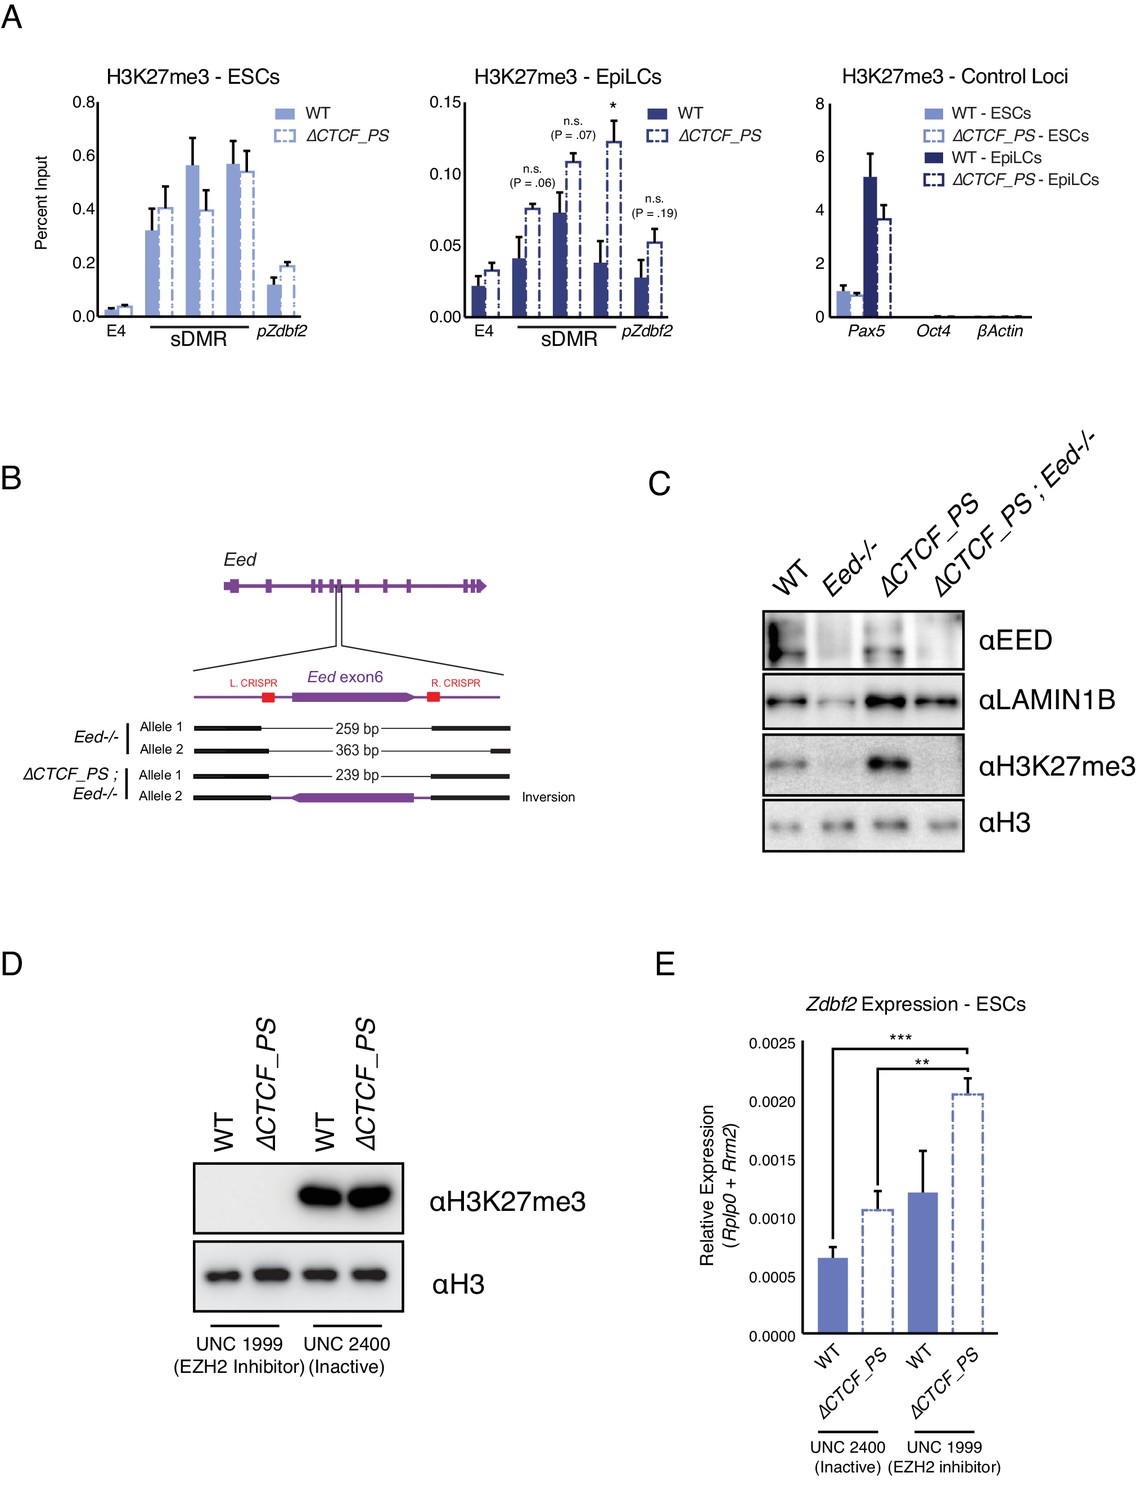
Polycomb and 3D organization both impact Zdbf2 activation.
(A) H3K27me3 ChIP-qPCR in ESCs (Left) and EpiLCs (Middle) in WT and the ∆ mutant. There is no significant effect on polycomb dynamics in ESCs. In EpiLCs, the ∆ mutant retains residual H3K27me3 relative to WT. H3K27me3 ChIP-qPCR in WT and ∆ ESCs and EpiLCs at control loci are displayed in right panel. Data shown as ±s.e.m. from three biological replicates for each genotype. (B) Alleles generated by CRISPR/Cas9-mediated mutagenesis of Eed in WT and ∆ contexts. (C) Western blot confirming loss of EED protein and H3K27me3 in Eed-/- cell lines. (D) Western blot showing no detection of H3K27me3 loss after four days of incubation with PRC2 inhibitor. Negative control exhibited strong H3K27me3 signal. (E) RT-qPCR of Zdbf2 in absence of CTCF partition with EZH2 inhibitor. In ∆CTCF_PS mutants, there is a further increase of Zdbf2 de-repression when H3K27me3 is depleted. Data shown as ±s.e.m. from three biological replicates for each genotype. Statistical analyses were performed by two-tailed unpaired t-test: *p≤0.05, **≤0.01, ***p≤0.001.
Author response image 1
Author response image 2

Tables
Key resources table
| Reagent type (species) or resource | Designation | Source or reference | Identifier | Additional information |
|---|---|---|---|---|
| Cell Line (M. musculus) | E14TG2a (WT) | ATCC | CRL-1821 | |
| Cell Line (M. musculus) | E14TG2a_∆Liz | Bourc’his Lab | Greenberg et al., 2017 | |
| Cell Line (M. musculus) | E14TG2a_∆E1 | Bourc’his Lab | Greenberg et al., 2017 | |
| Cell Line (M. musculus) | E14TG2a_∆E1-3 | This study | CRISPR/Cas9 generated mutant, sgRNA oligos are listed in Supplementary file 1 | |
| Cell Line (M. musculus) | E14TG2a_∆E4 | This study | CRISPR/Cas9 generated mutant, sgRNA oligos are listed in Supplementary file 1 | |
| Cell Line (M. musculus) | E14TG2a_CTCF-AID-eGFP, Tir1 | Gift from E Nora | Nora et al., 2017 | |
| Cell Line (M. musculus) | J1 (WT) | ATCC | SCRC-1010 | |
| Cell Line (M. musculus) | J1_Dnmt tKO | Gift from M Okano | Tsumura et al., 2006 | |
| Cell Line (M. musculus) | J1_Eed-/- | This study | CRISPR/Cas9 generated mutant, sgRNA oligos are listed inSupplementary file 1 | |
| Cell Line (M. musculus) | J1_∆CTCF_PS | This study | CRISPR/Cas9 generated mutant, sgRNA oligos are listed in Supplementary file 1 | |
| Cell Line (M. musculus) | J1_Eed-/-; ∆CTCF_PS | This study | CRISPR/Cas9 generated mutant, sgRNA oligos are listed in Supplementary file 1 | |
| Cell Line (M. musculus) | J1 Clone 36 (WT) | Gift from A Wutz | Wutz and Jaenisch, 2000 | |
| Cell Line (M. musculus) | J1 Clone 36_Eed-/- | Gift from A Wutz | Schoeftner et al., 2006 | |
| Antibody | Anti-H3K27me2, mouse monoclonal | Active Motif | 61435 | (1:5000) |
| Antibody | Anti-H3K27me3, rabbit monoclonal | Cell Signaling Technology | C36B11 | (1:5000) |
| Antibody | Anti-H3K27ac, rabbit polyclonal | Active Motif | 39133 | (1:5000) |
| Antibody | Anti-CTCF, rabbit polyclonal | Millipore | 07–729 | (1:5000) |
| Antibody | Anti-GFP, mix of two mouse monoclonal | Roche | 11814460001 | (1:2000) |
| Antibody | Anti-PCNA, mouse monoclonal | Dako | M0879 | (1:5000) |
| Antibody | Anti-EED, rabbit polyclonal | Other | Gift from R Margueron (1:5000) | |
| Antibody | Anti-Lamin B1, rabbit polyclonal | Abcam | Ab16048 | (1:5000) |
| Antibody | Anti-H3, rabbit polyclonal | Abcam | Ab1791 | (1:10000) |
| Chemical Compound, Drug | L-Absorbic Acid | Sigma | A4544 | |
| Chemical Compound, Drug | Gsk3 inhibitor | Other | CT-99021 | Gift from E Heard |
| Chemical Compound, Drug | MEK inhibitor | Other | PD0325901 | Gift from E Heard |
| Chemical Compound, Drug | FGF2 | R and D Systems | 233-FB-025/CF | |
| Chemical Compound, Drug | Activin A | R and D Systems | 338-AC-050/CF | |
| Chemical Compound, Drug | EZH2 Inhibitor | Tocris Bioscience | UNC 1999 | |
| Chemical Compound, Drug | EZH2 Inhibitor Negative Control | Tocris Bioscience | UNC 2400 | |
| Chemical Compound, Drug | Indole-3-acetic acid sodium salt (auxin analog) | Sigma | I5148-2G | |
| Recombinant DNA Reagent | pX459 | Addgene | 62988 | |
| Commercial Assay or Kit | EpiTect Bisulfite Kit | Qiagen | 59104 | |
| Software, Algorithm | BWA v0.7.5a | Li and Durbin, 2009 | ||
| Software, Algorithm | Picard v1.130 | Broad Institute | ||
| Software, Algorithm | HOMER v4.7 | Heinz et al., 2010 | ||
| Software, Algorithm | FASTX-Toolkit v0.0.13 | Greg Hannon Lab | ||
| Software, Algorithm | Cutadapt | Martin, 2011 | ||
| Software, Algorithm | Bismark v0.12.5 | Krueger and Andrews, 2011 | ||
| Software, Algorithm | Bowtie2 v2.1.0 | Langmead and Salzberg, 2012 | ||
| Software, Algorithm | STAR v2.5.0a | Dobin et al., 2013 | ||
| Software, Algorithm | Trim Galore v0.4.0 | Babraham Institute | ||
| Software, Algorithm | FourCSeq v1.12.0 | Klein et al., 2015 | ||
| Software, Algorithm | HTSeq v0.9.1 | Anders et al., 2015 |
Additional files
-
Supplementary file 1
List of oligonucleotides used in this study.
- https://doi.org/10.7554/eLife.44057.018
-
Transparent reporting form
- https://doi.org/10.7554/eLife.44057.019
Download links
A two-part list of links to download the article, or parts of the article, in various formats.
Downloads (link to download the article as PDF)
Open citations (links to open the citations from this article in various online reference manager services)
Cite this article (links to download the citations from this article in formats compatible with various reference manager tools)
Dynamic enhancer partitioning instructs activation of a growth-related gene during exit from naïve pluripotency
eLife 8:e44057.
https://doi.org/10.7554/eLife.44057


