Structure of Vps4 with circular peptides and implications for translocation of two polypeptide chains by AAA+ ATPases
- University of Utah, United States
- New York Structural Biology Center, United States
Figures
Figure 1 with 9 supplements

Linear and circular peptides bind Vps4 with similar affinities.
Sequences of the linear and circular peptides used in this study are shown, together with competition fluorescence polarization binding isotherms and calculated KD and Ki values.
-
Figure 1—source data 1
Binding of peptides to Vps4 in a fluorescence polarization competition assay related to Figure 1 and Figure 1—figure supplement 1.
- https://doi.org/10.7554/eLife.44071.013
Figure 1—figure supplement 1

Competitive binding assays.
Competition binding data for the linear and circular peptides used in this study against Vsp4 and Vps4-Hcp1.
Figure 1—figure supplement 2
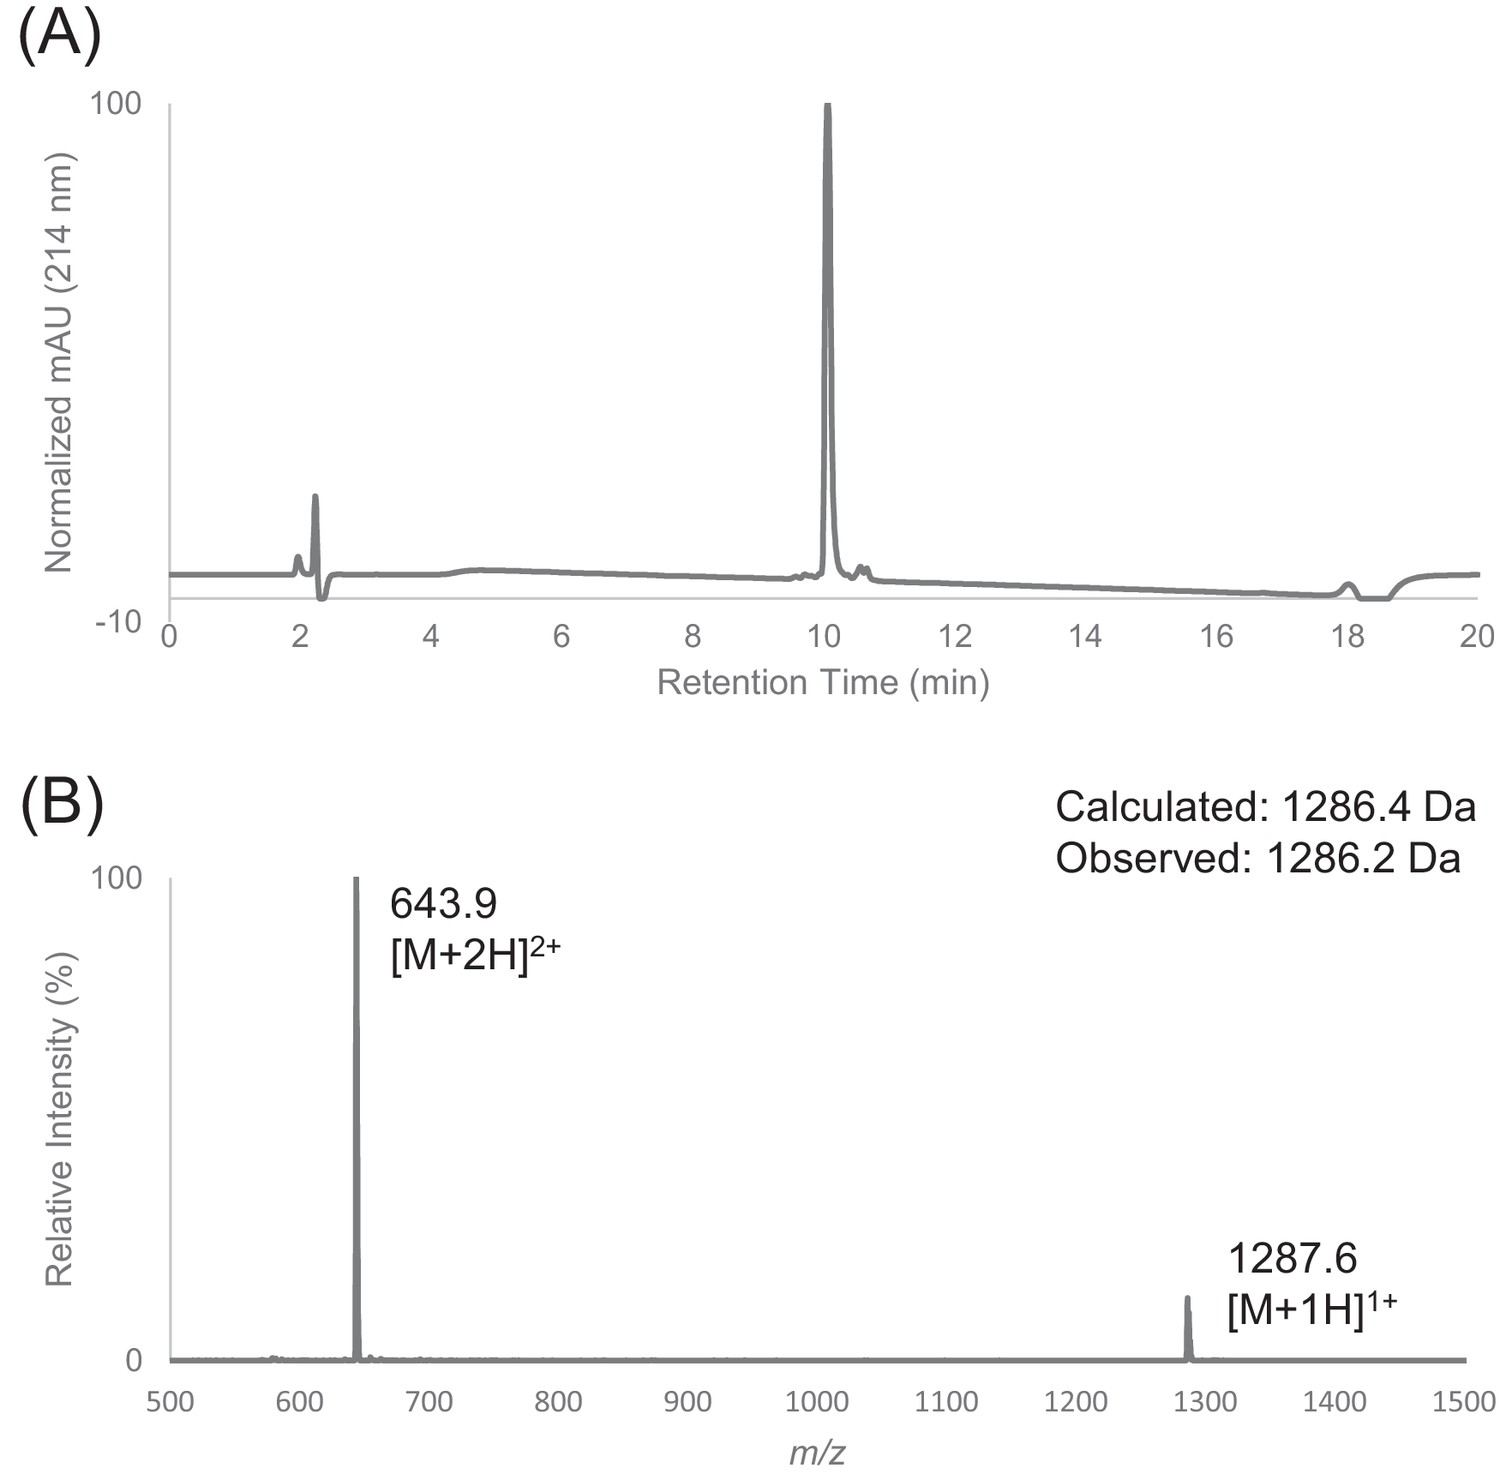
Characterization of HPLC purified peptide F by LC-MS.
(A) Analytical HPLC trace of peptide F using FortisBIO C4 column (5 µM, 300 Å, 4.6 × 150 mm) at 214 nm. Sample was injected with an isocratic flow of 10% Buffer B at 1 mL/min. After 2 min, the solvent gradient was increased from 10% to 90% Buffer B over 15 min. (B) Electrospray mass spectrum of peptide F.
Figure 1—figure supplement 3
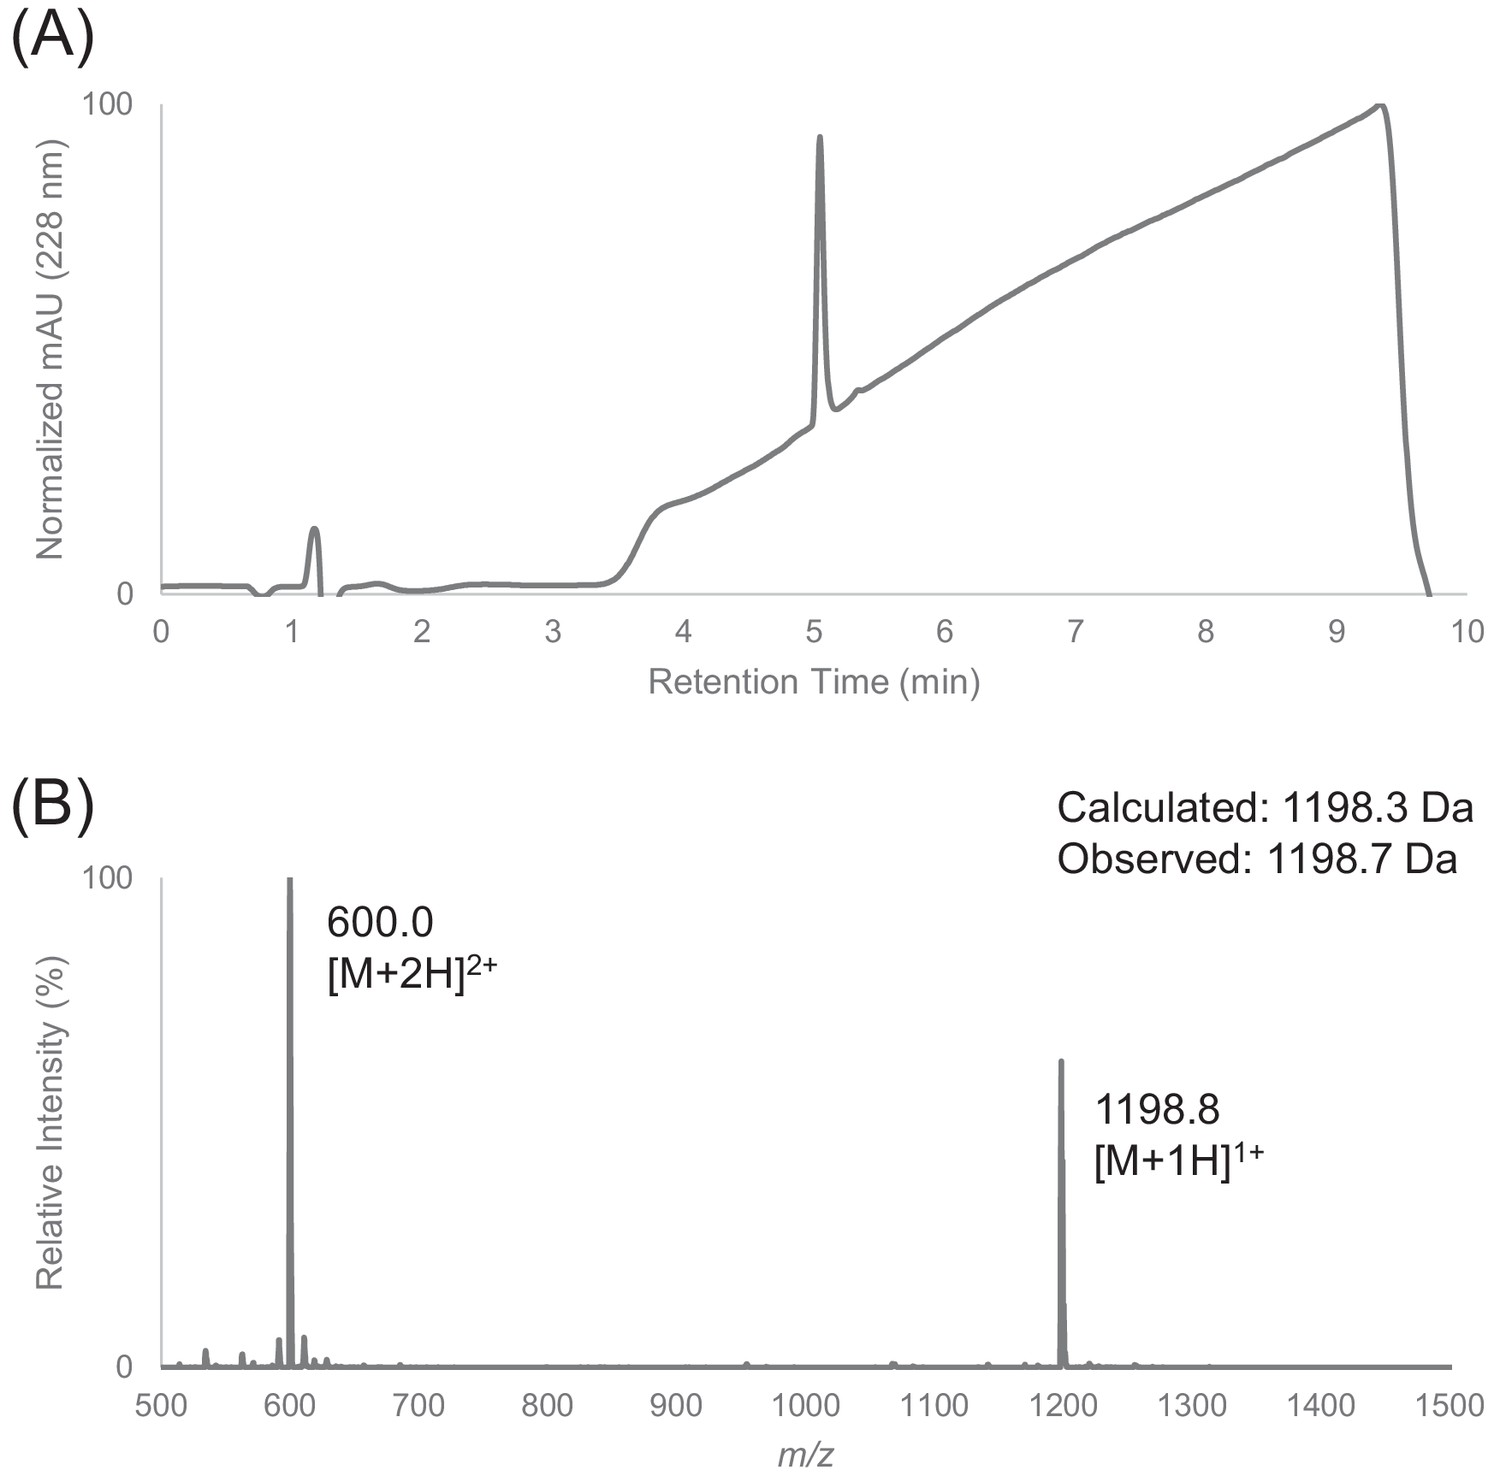
Characterization of HPLC purified F12 by LC-MS.
(A) Analytical HPLC trace of peptide F12 at 228 nm. Sample was injected with an isocratic flow of 5% Buffer B (0.1% FA in ACN) at 0.75 mL/min. After 1 min, the solvent gradient was increased from 5% to 90% Buffer B over 7 min. (B) Electrospray mass spectrum of peptide F12.
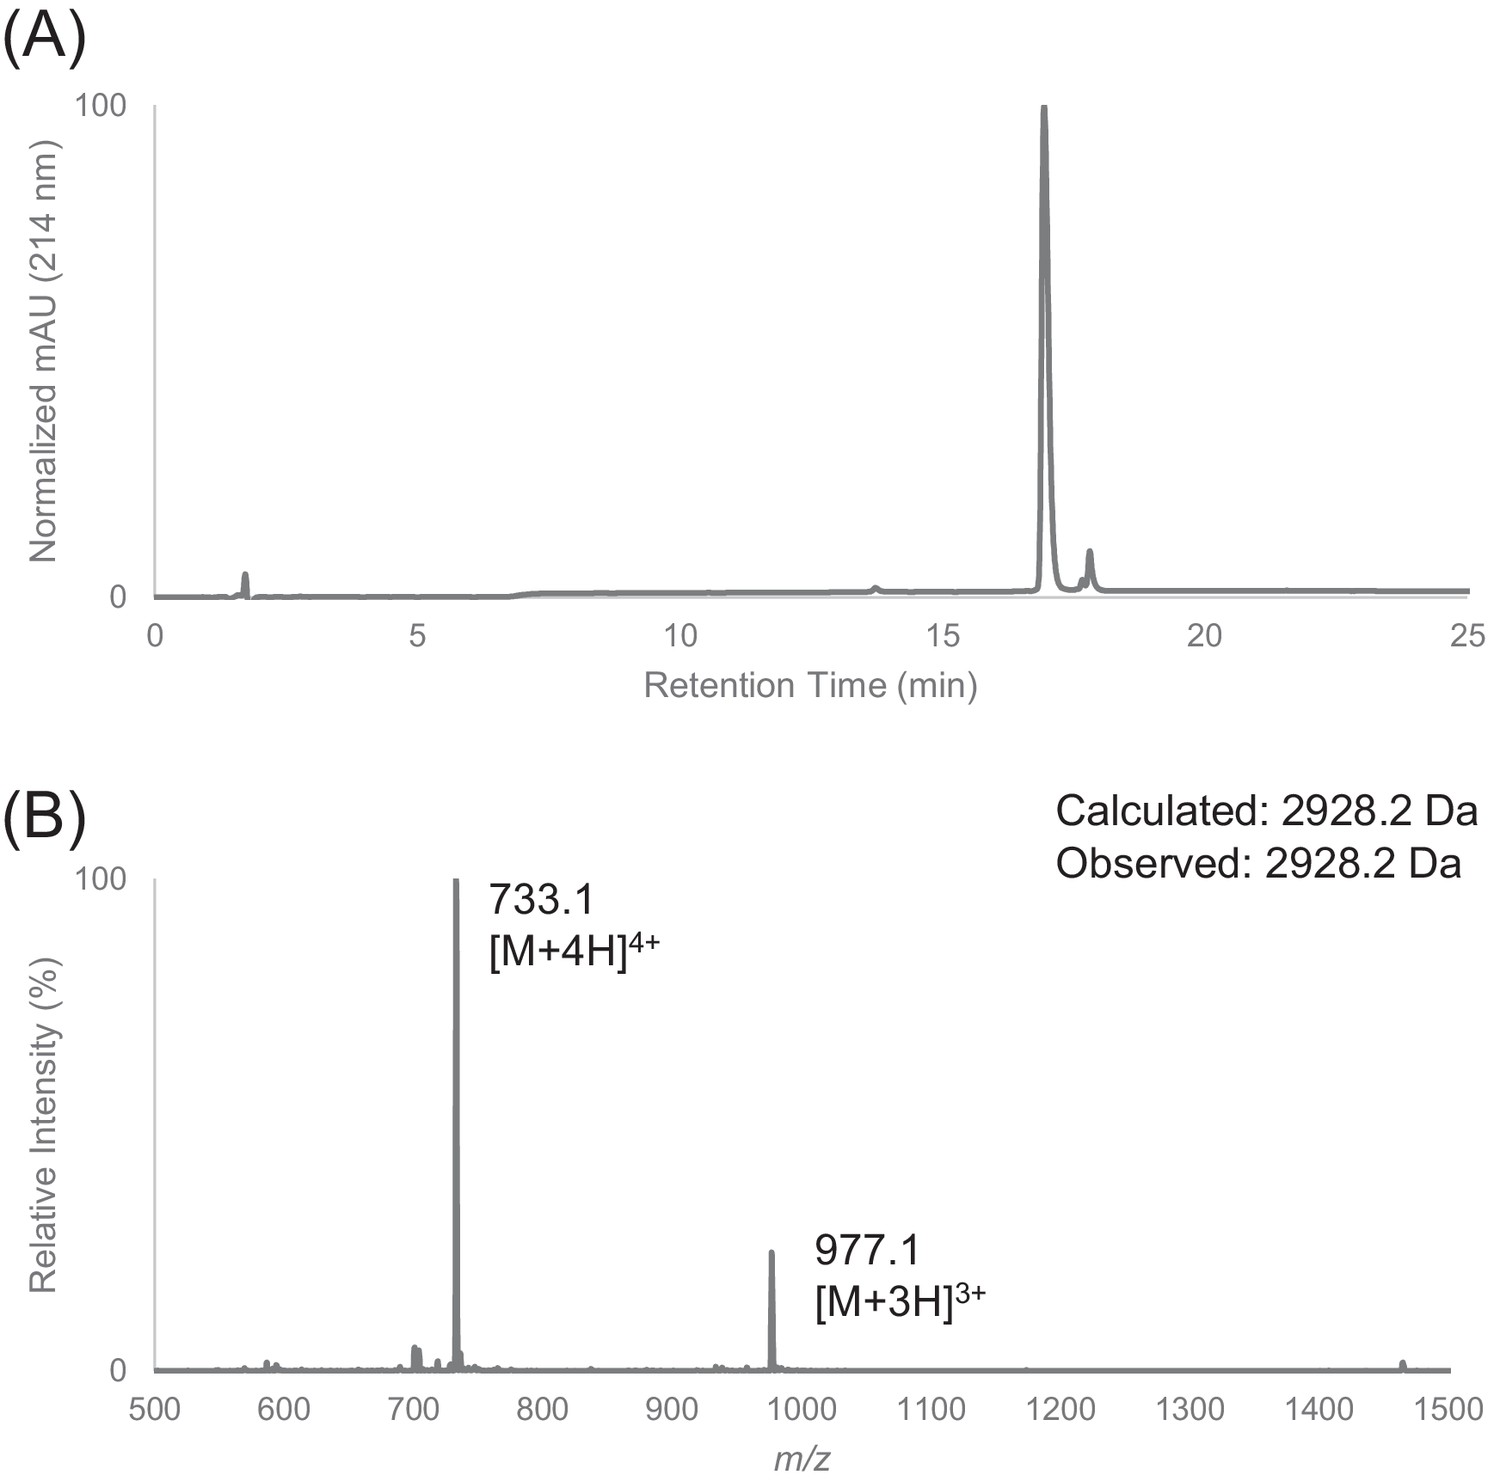
Figure 1—figure supplement 4
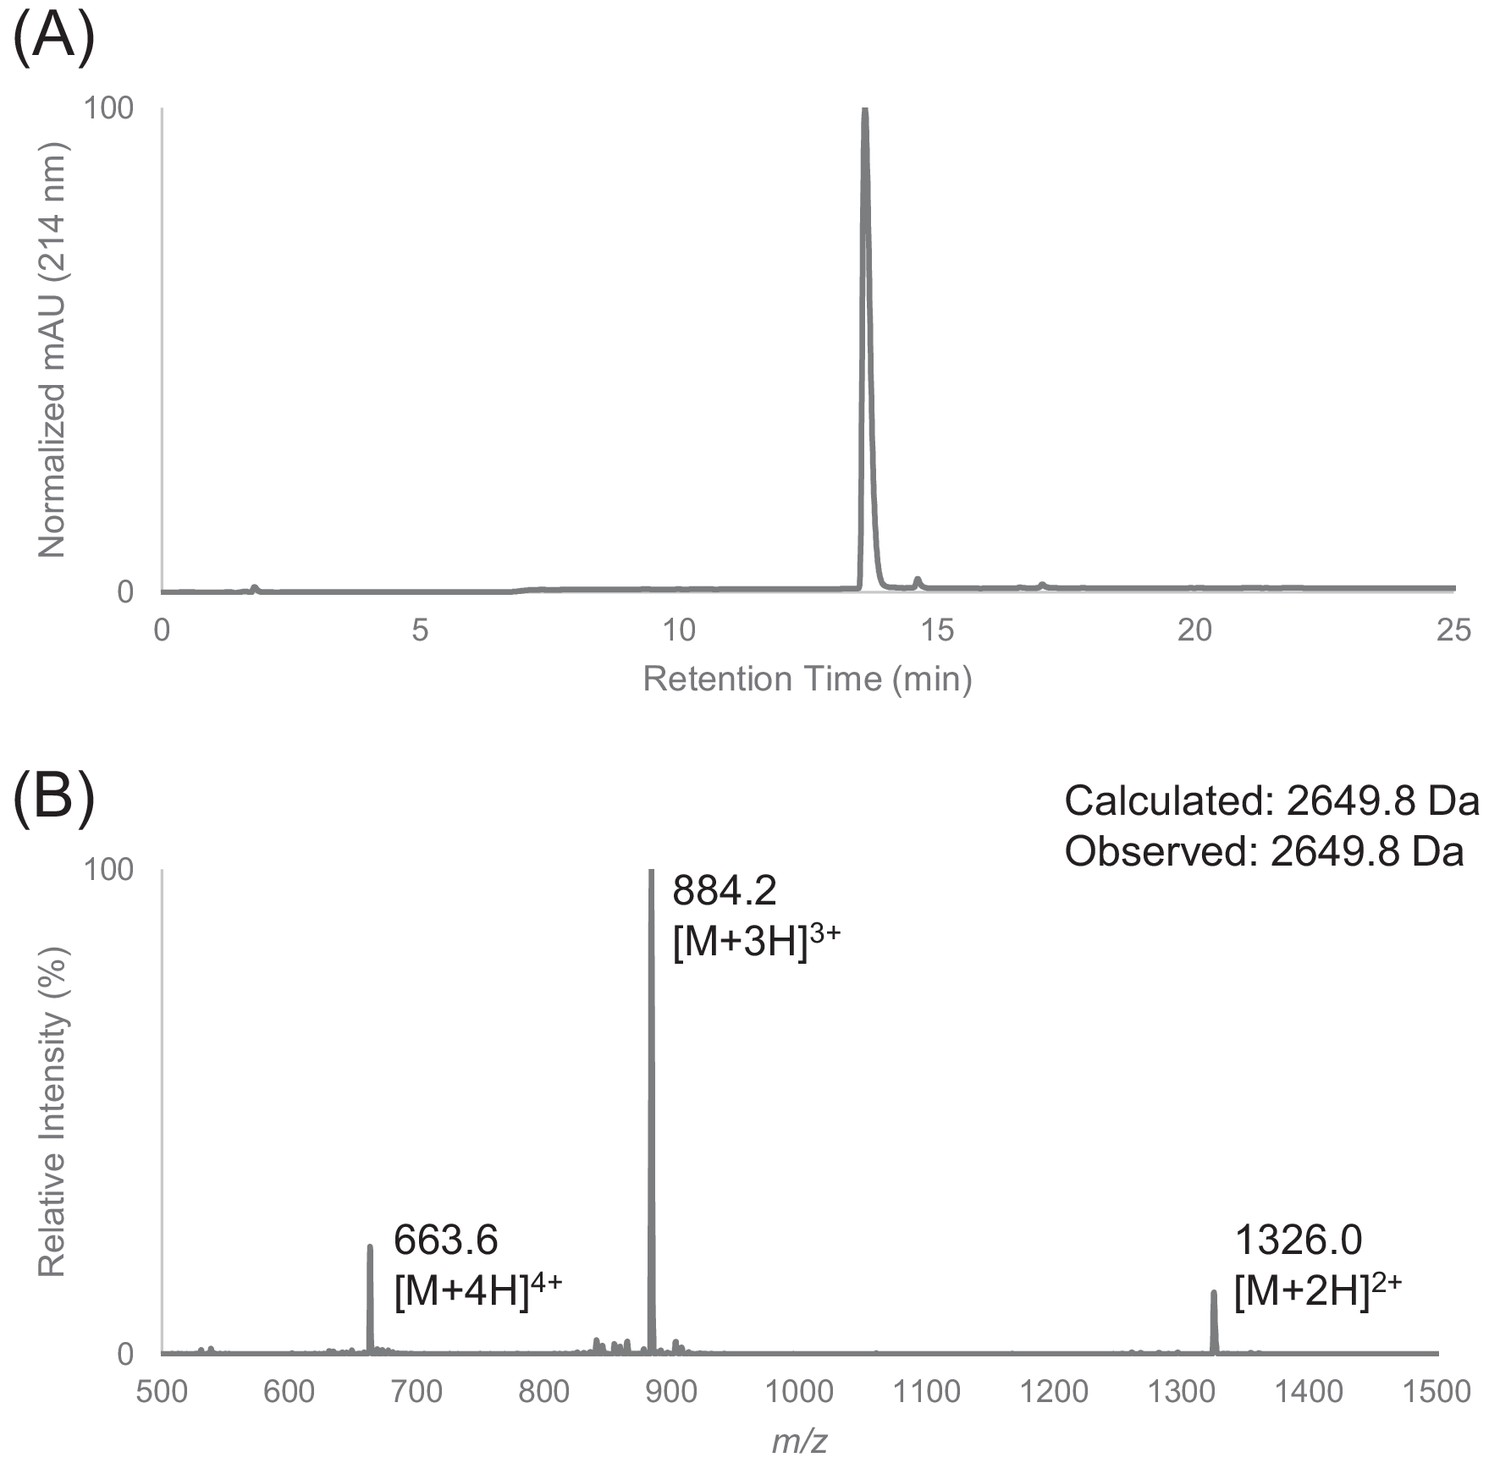
Characterization of HPLC purified F30 by LC-MS.
(A) Analytical HPLC trace of peptide F30. (B) Electrospray mass spectrum of F30.
Figure 1—figure supplement 5
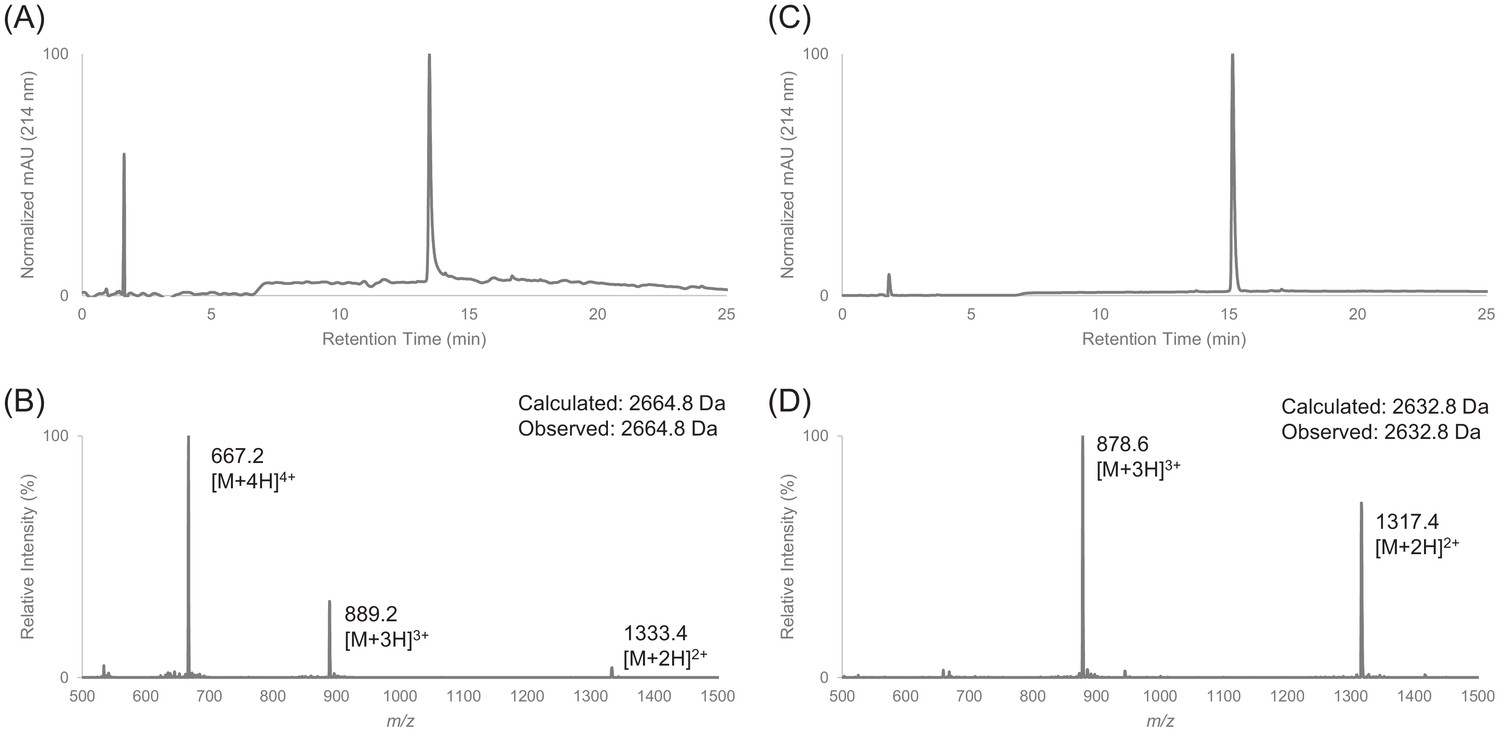
Characterization of HPLC purified cF30 by LC-MS.
(A) Analytical HPLC trace of peptide cF30 (pre-cyclization). (B) Electrospray mass spectrum of cF30 (pre-cyclization). (C) Analytical HPLC trace of peptide cF30. (D) Electrospray mass spectrum of cF30.
Figure 1—figure supplement 6
Characterization of HPLC purified FF30 by LC-MS.
(A) Analytical HPLC trace of peptide FF30. (B) Electrospray mass spectrum of FF30.
Figure 1—figure supplement 7
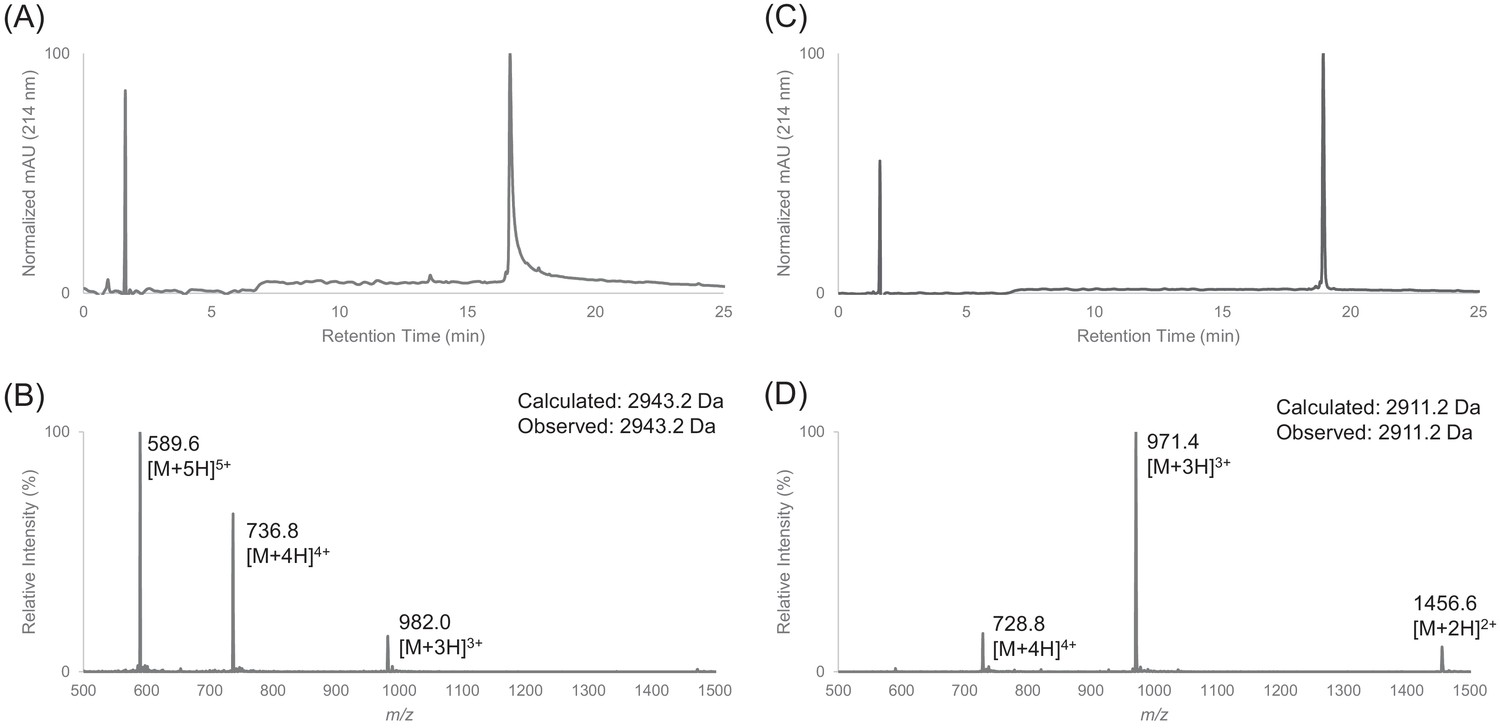
Characterization of HPLC purified cFF30 by LC-MS.
(A) Analytical HPLC trace of peptide cFF30 (pre-cyclization). (B) Electrospray mass spectrum of cFF30 (pre-cyclization). (C) Analytical HPLC trace of peptide cFF30. (D) Electrospray mass spectrum of cFF30.
Figure 1—figure supplement 8
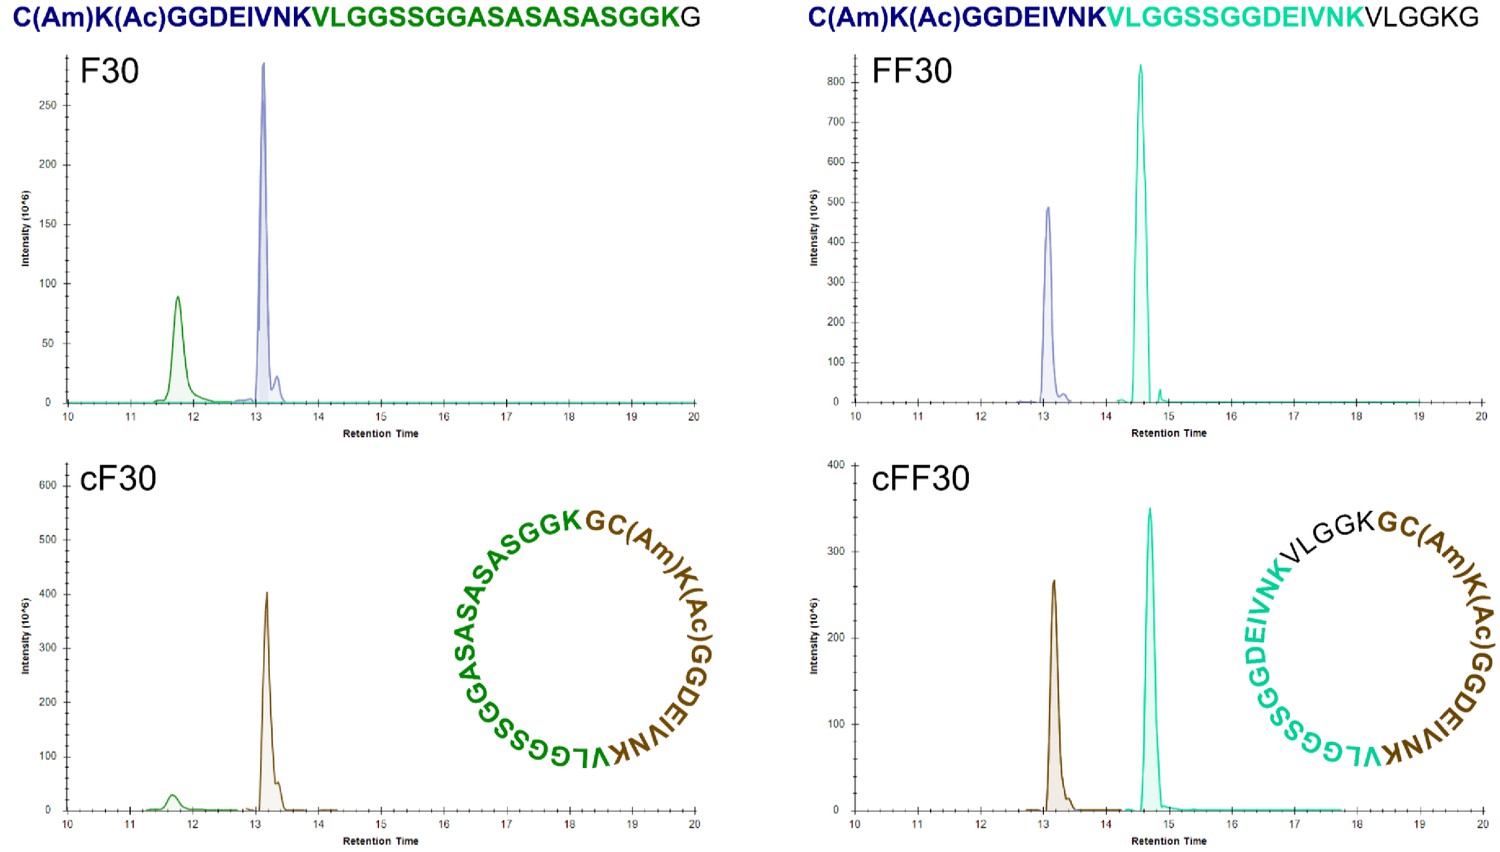
High-resolution LC-MS analysis of trypsin-digested peptides.
Extracted ion chromatograms after trypsin digestion of linear and cyclic peptides. Colors of peptides are matched to colors of ion signals. The brown tryptic peptide of cF30 and cFF30 differ from the corresponding blue tryptic peptides of the linear F30 and F30 by the presence of a glycine at the N-terminus.
Figure 1—figure supplement 9
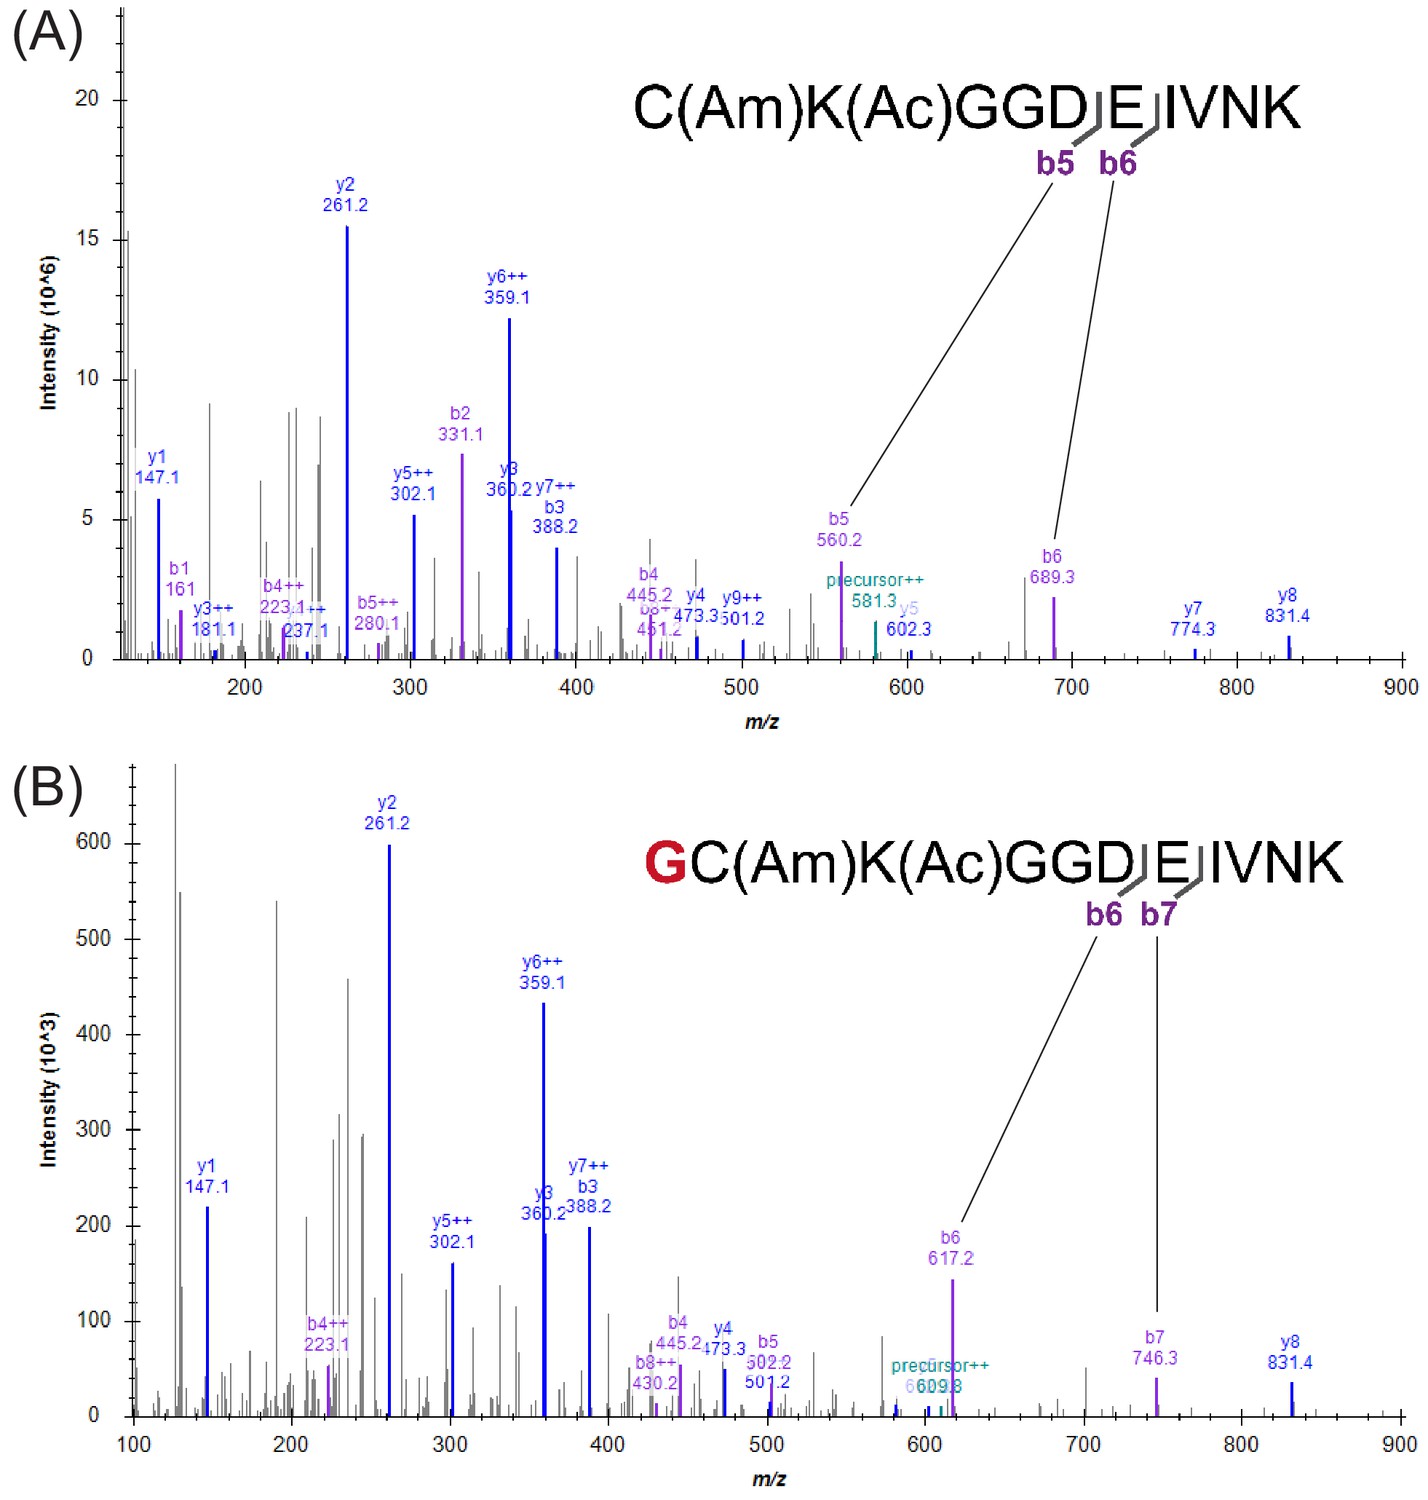
Comparison of MS2 spectra from trypsin-digested linear and cyclic peptides.
(A) Representative MS2 spectrum for trypsin digested F30. MS2 spectra of FF30 are essentially identical. (B) Representative MS2 spectrum for trypsin digested cF30. MS2 spectra of cFF30 are essentially identical. Successful cyclization is indicated by the 57 m/z shifts of b6 and b7 ions compared to the b5 and b6 ions of the linear peptide MS2 spectrum (panel A).
Figure 2 with 11 supplements
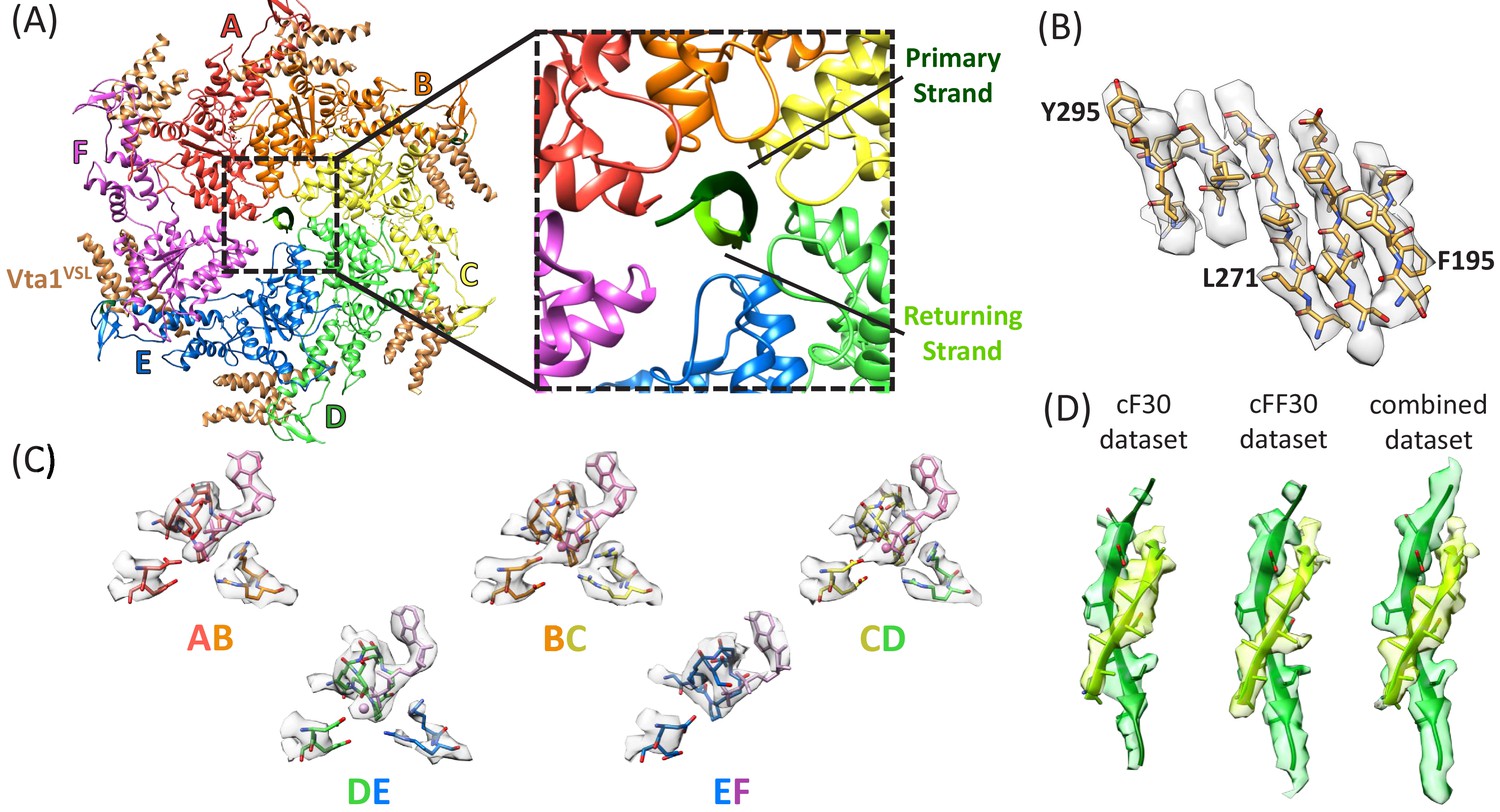
Structure determination.
(A) Overall structure of the Vps4-cyclic peptide complex. The close up view of the pore region shows the primary strand (dark green) and returning strand (light green) of the cyclic peptide. (B) Representative section of density in the large domain of the Vps4 B subunit. (C) Density around the nucleotides and coordinating residues for the active sites of Vps4 subunits A-E. These binding sites occur at the interface with the following subunit. (D) Density around the circular peptides. Shown as side views separately for the cF30, cFF30, and combined maps.
Figure 2—figure supplement 1
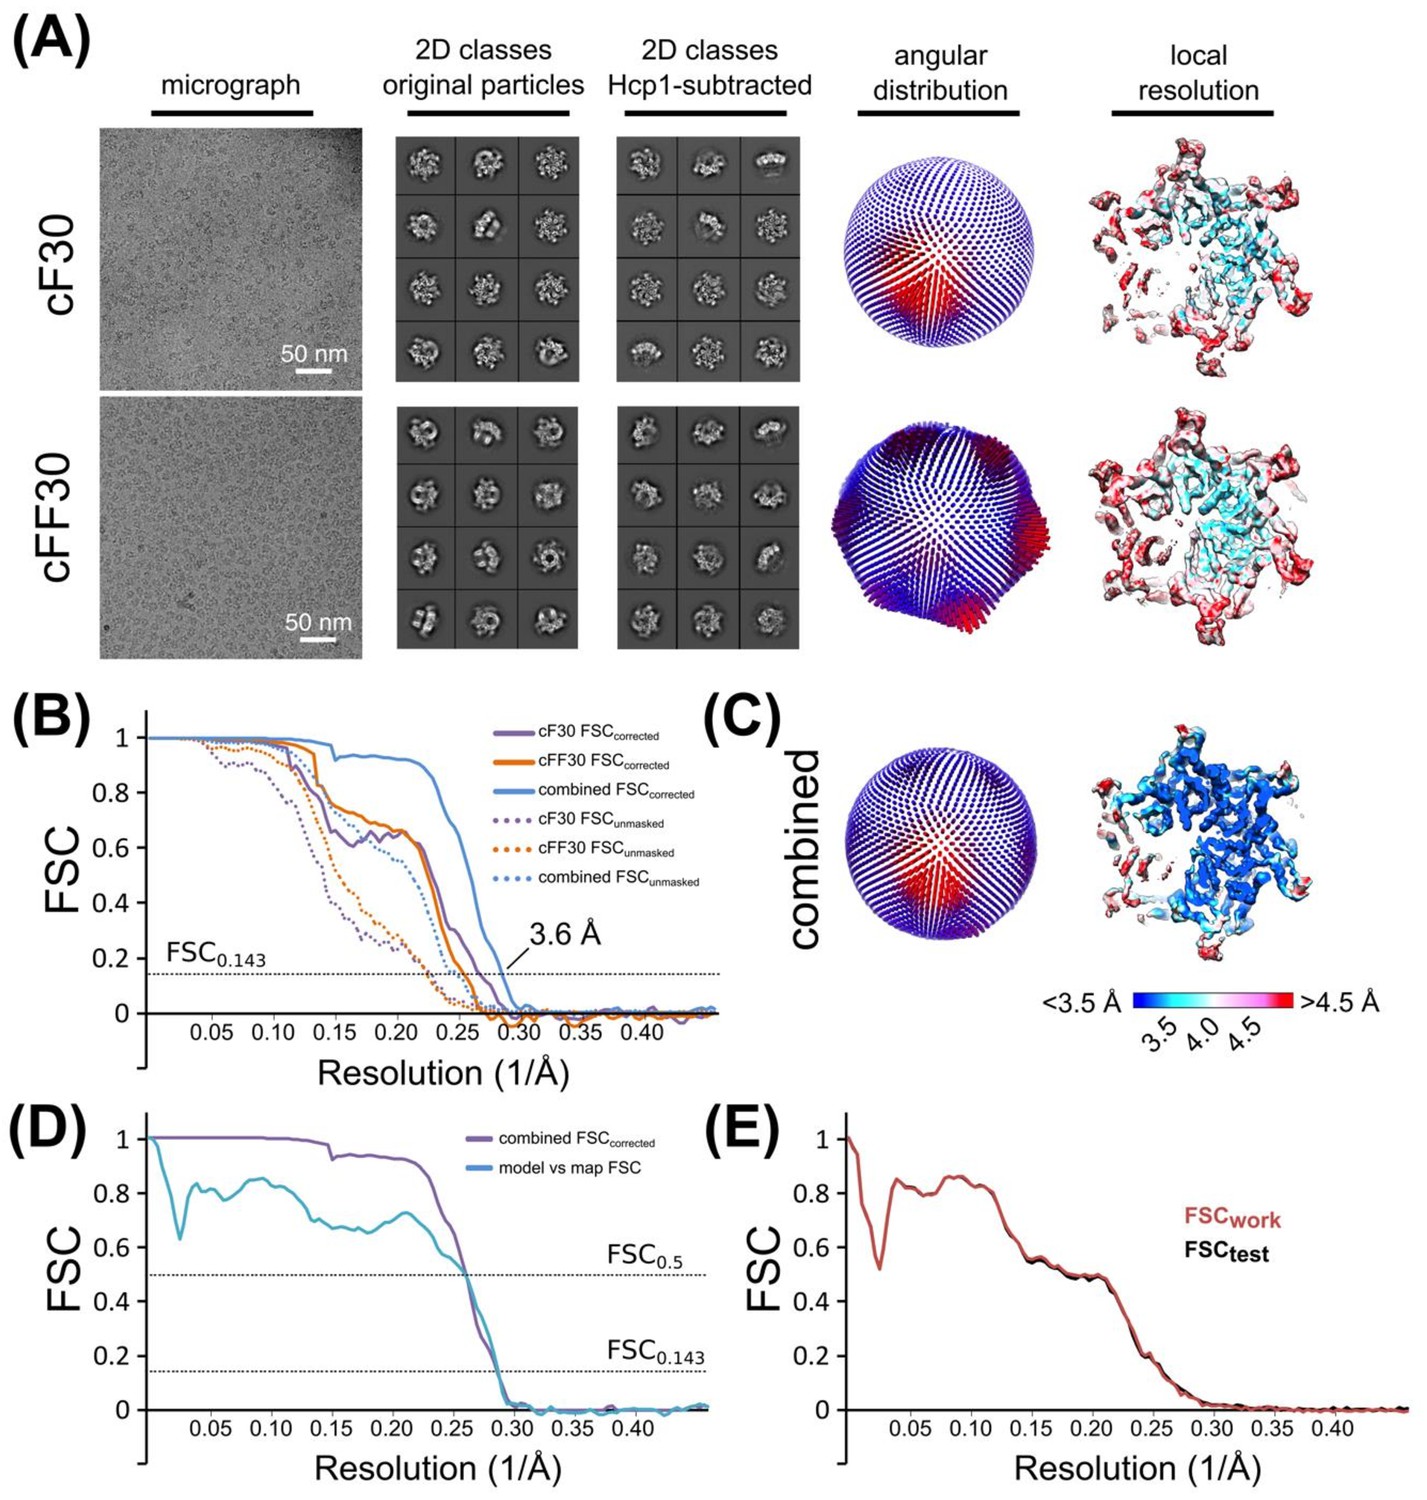
Cryo-EM structure determination and validation of Vps4 bound to cyclic peptides.
(A) Cryo-EM micrograph, representative 2D classes (before and after Hcp1 subtraction), orientation distribution, and local resolution of Vps4 bound to cF30 and cFF30. (B) Gold-standard FSC plots of Vps4 (Hcp1-subtracted) bound to cF30 (purple), cFF30 (orange), and the combined dataset (blue). Dotted lines represent unmasked FSC plots, solid lines represent masked, corrected FSC plots from RELION post-processing. (C) Orientation distribution and local resolution of the combined dataset. (D) FSC plots of the combined (cF30 and cFF30) dataset (as in B), and the refined model versus the 3.6 Å map (blue). (E) Cross-validation of the refined model. Overlay of FSCwork and FSCtest plots.
Figure 2—figure supplement 2
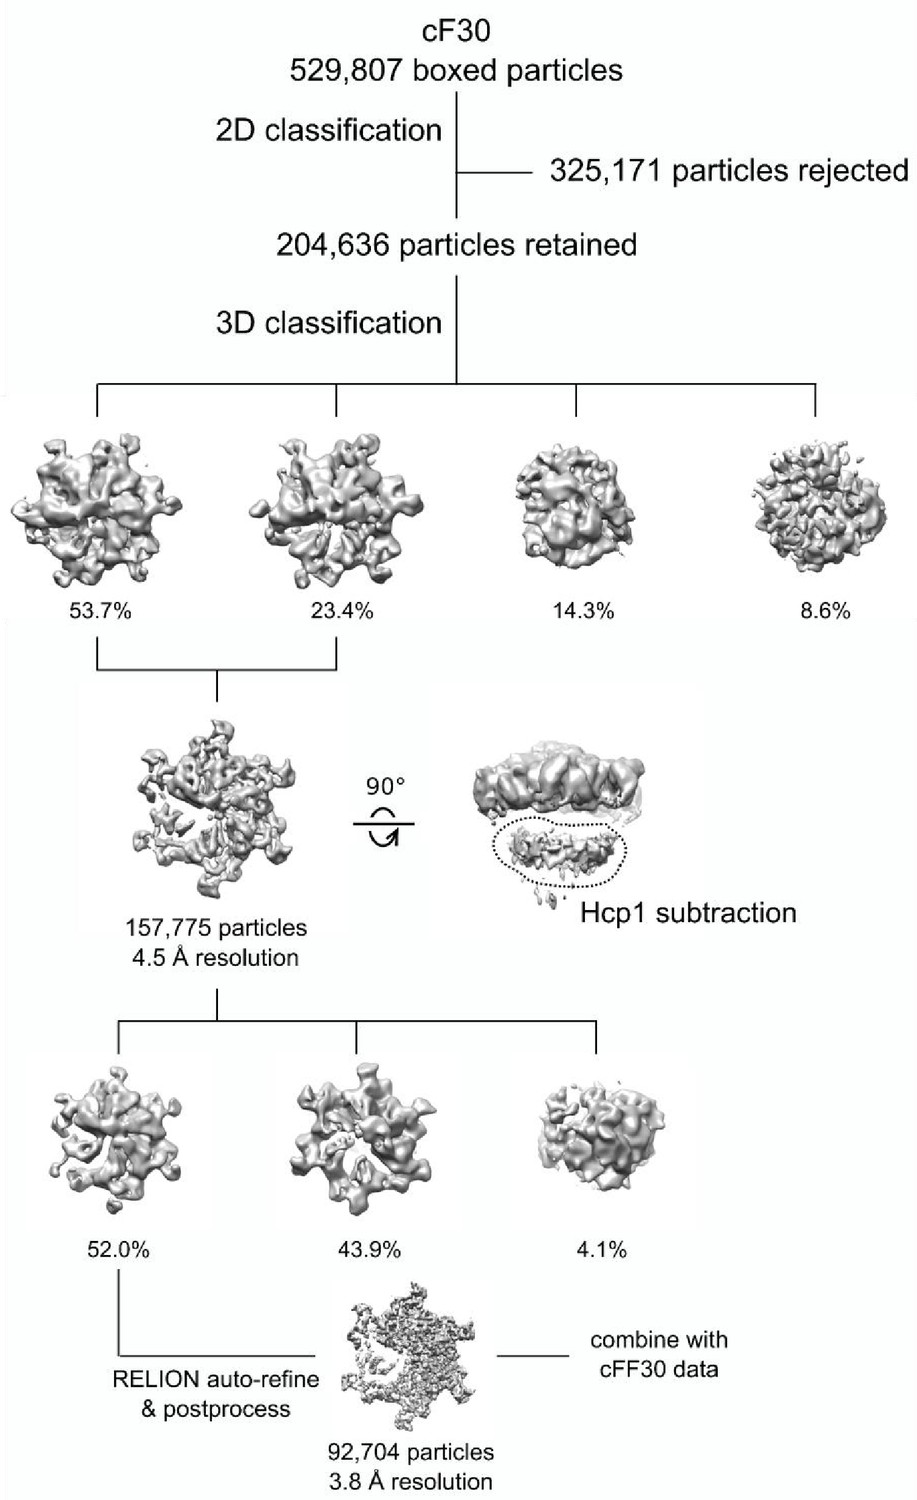
Cryo-EM processing workflow of the Vps4-cF30 complex.
https://doi.org/10.7554/eLife.44071.016
Figure 2—figure supplement 3
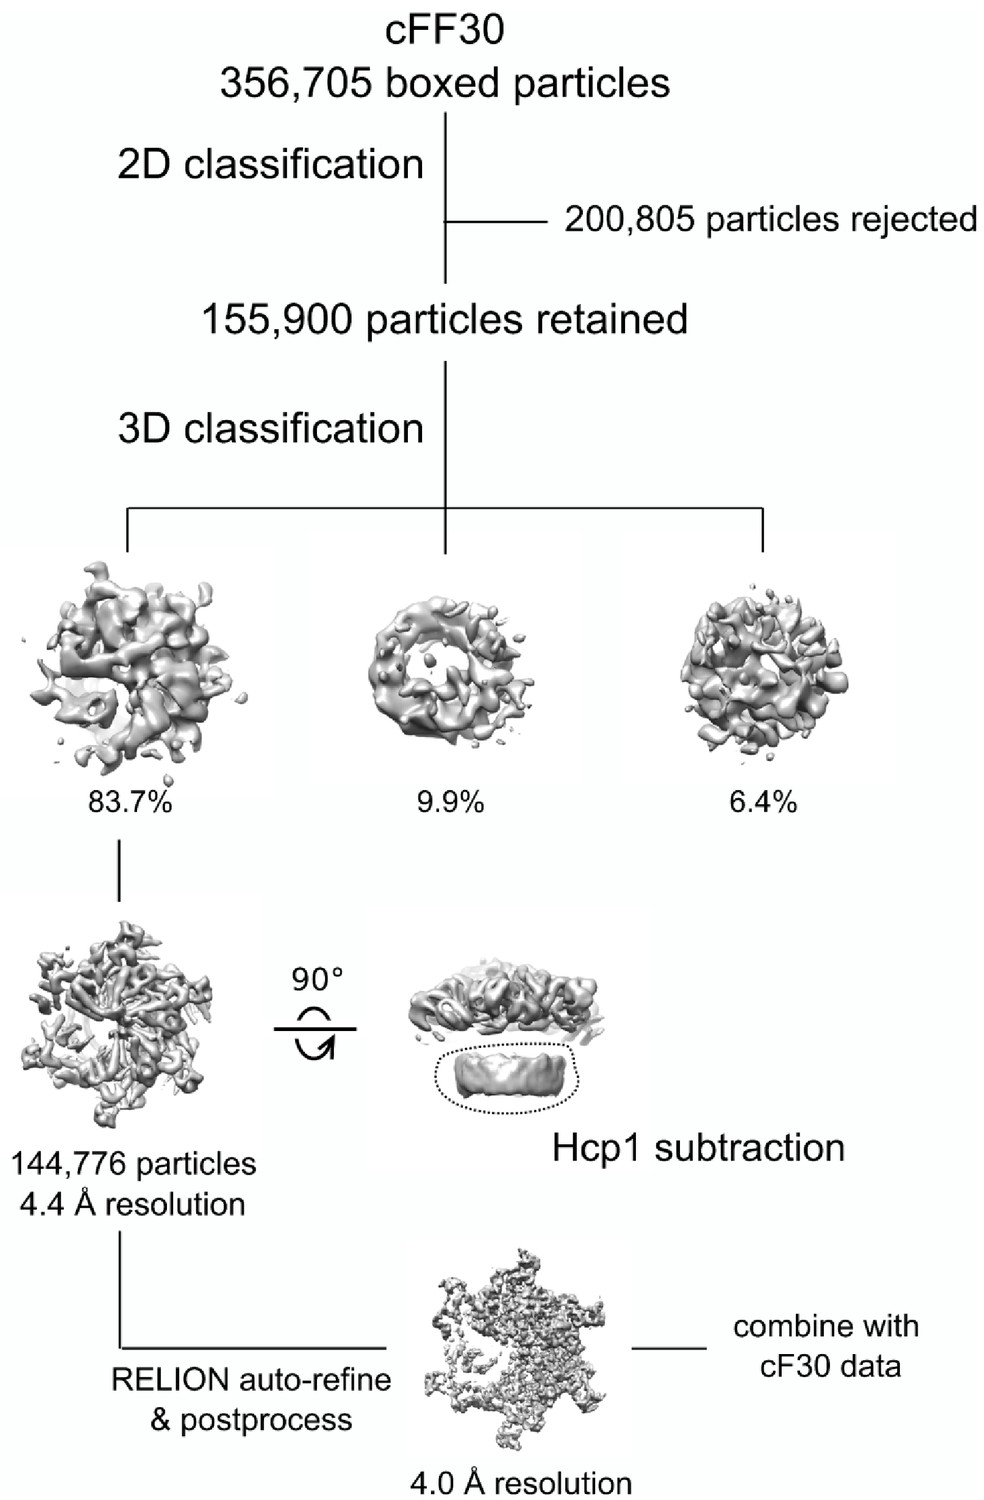
Cryo-EM processing workflow of Vps4-cFF30 complex.
https://doi.org/10.7554/eLife.44071.017
Figure 2—figure supplement 4
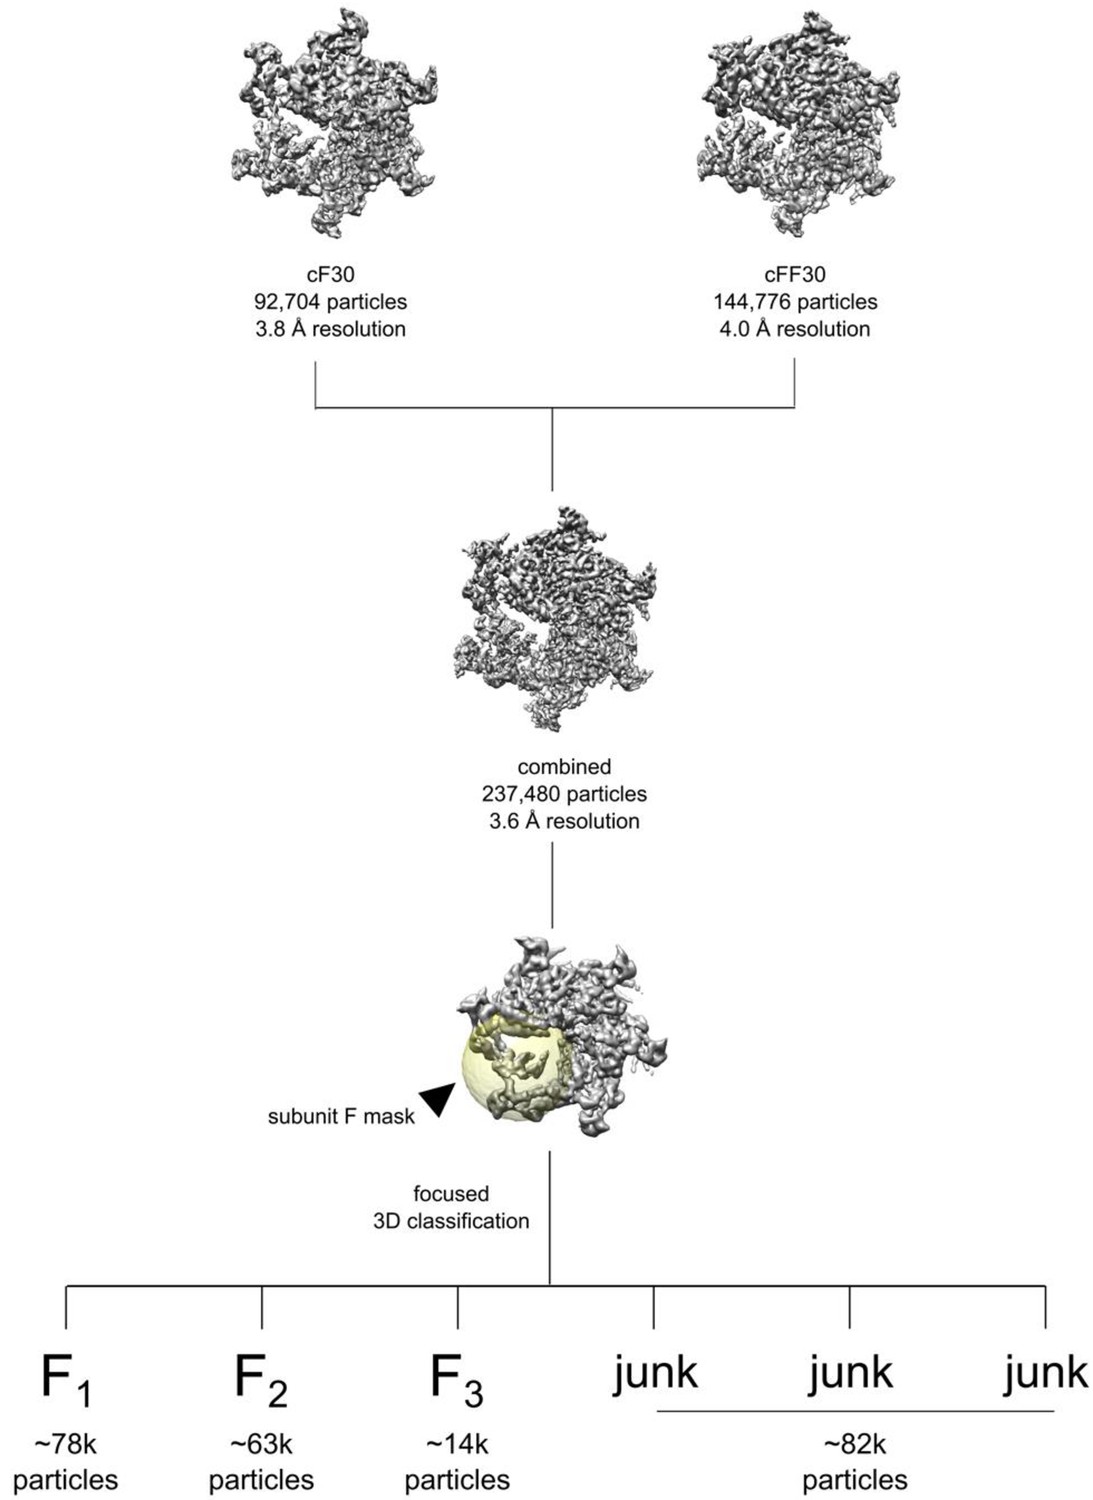
Data processing workflow for combining the cyclic peptide datasets and subunit F classification.
Focused classification was performed using a spherical mask over subunit F (yellow), leading to three populated conformations (F1, F2, and F3) and junk classes with poor densities. Particles sorting into F1, F2, F3 were processed separately within RELION.
Figure 2—figure supplement 5
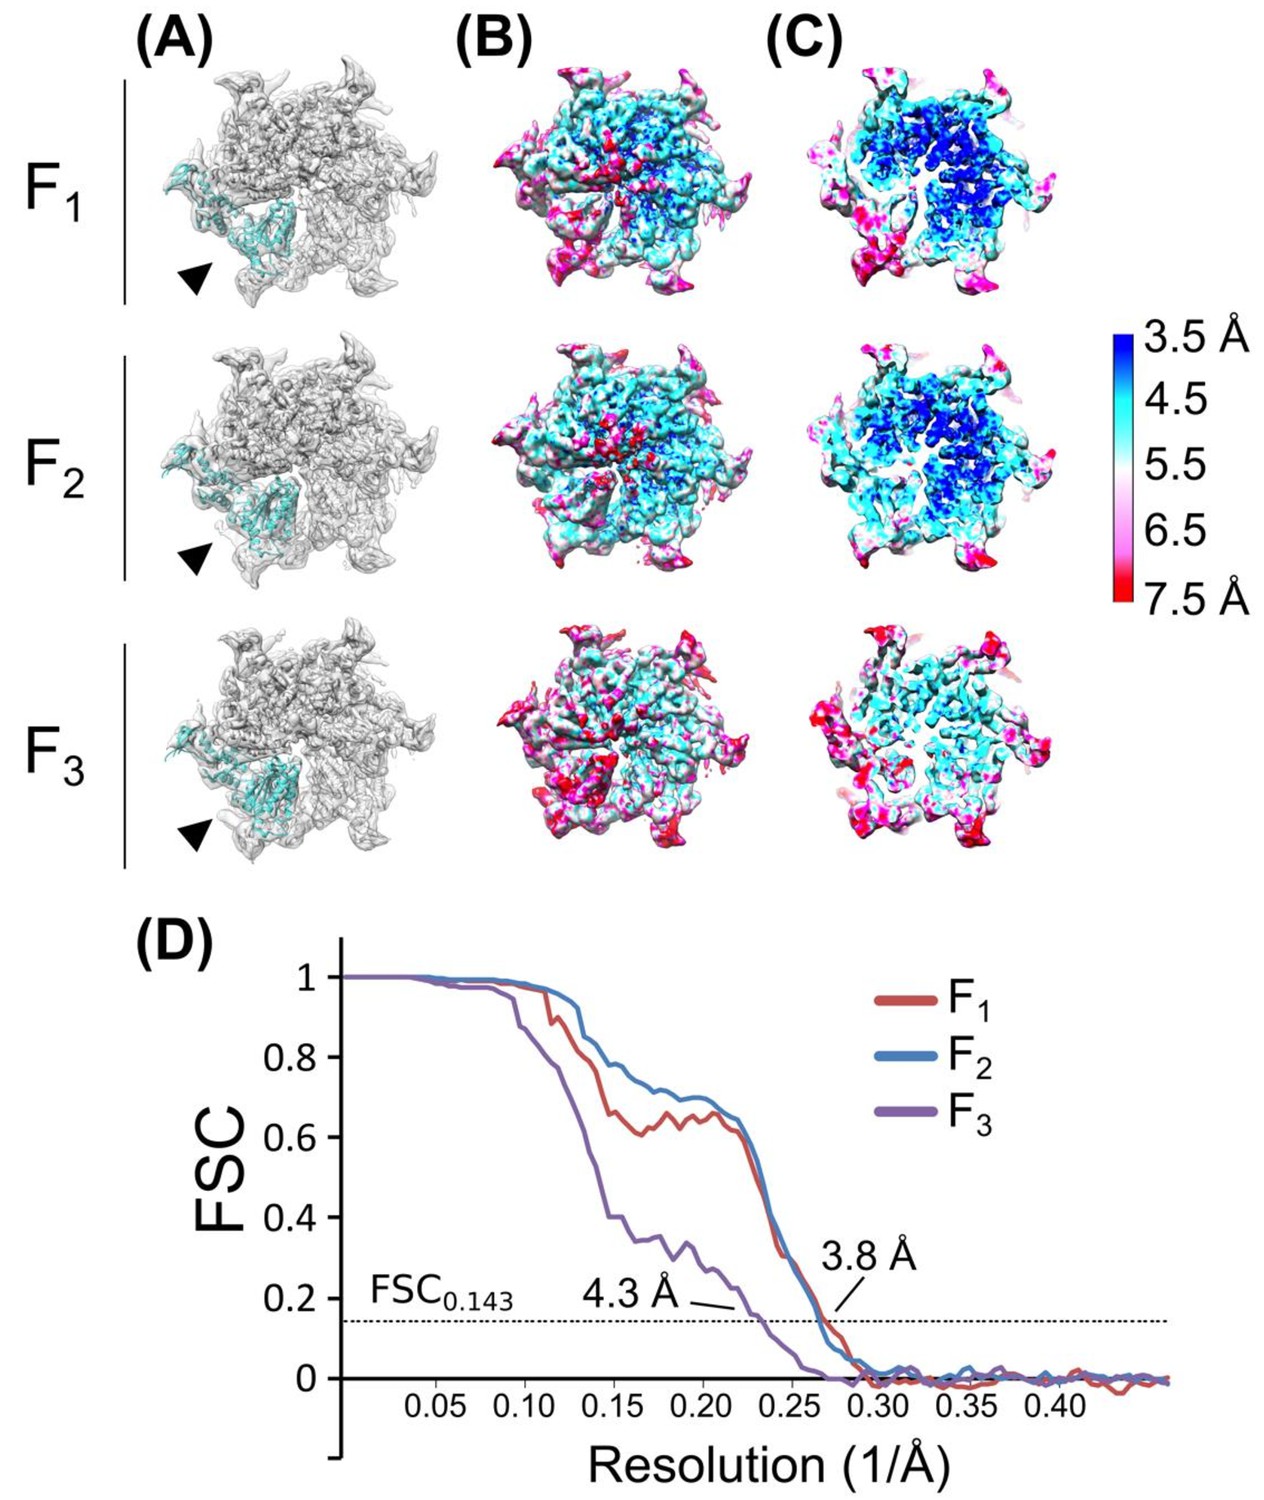
Validation of subunit F classes.
(A) Rigid body fits of the Vps4 protomer (PDBID: 3EIE (Gonciarz et al., 2008) into subunit F (arrowhead) after focused 3D classification. (B) Local resolution heat map generated from ResMap showing a surface view. (C) Same as (B), cut away view. (D) Gold standard, corrected FSC plots of each of the subunit F classes after RELION auto-refinement.
Figure 2—figure supplement 6
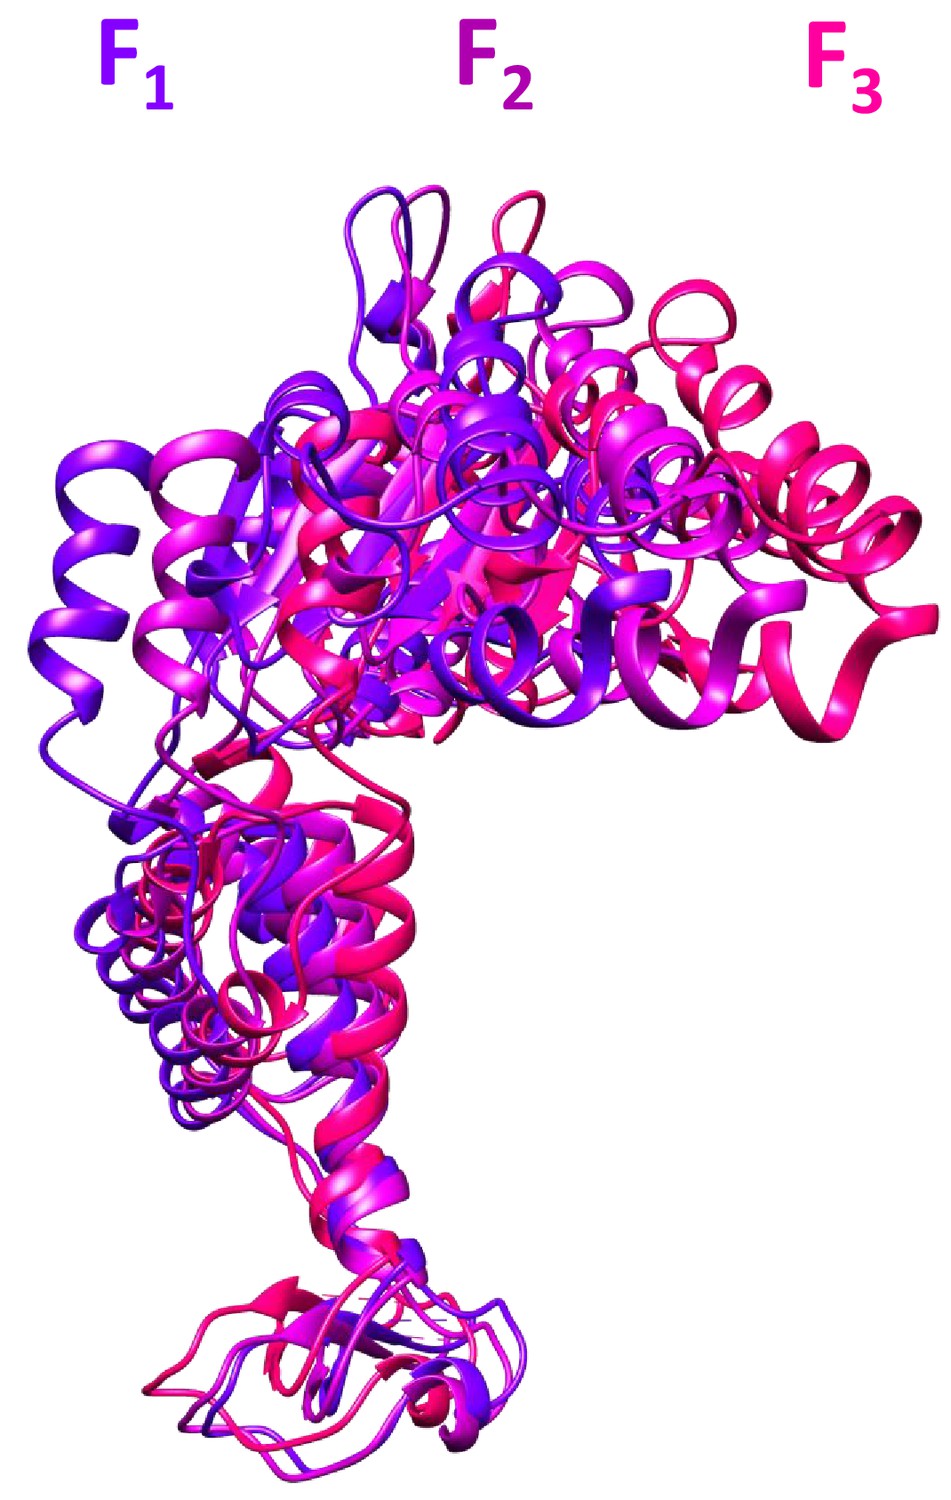
The three subunit F conformations.
These models were derived from the cF30/cFF30 focused classification maps, and are shown after overlap on subunits A-E.
Figure 2—figure supplement 7
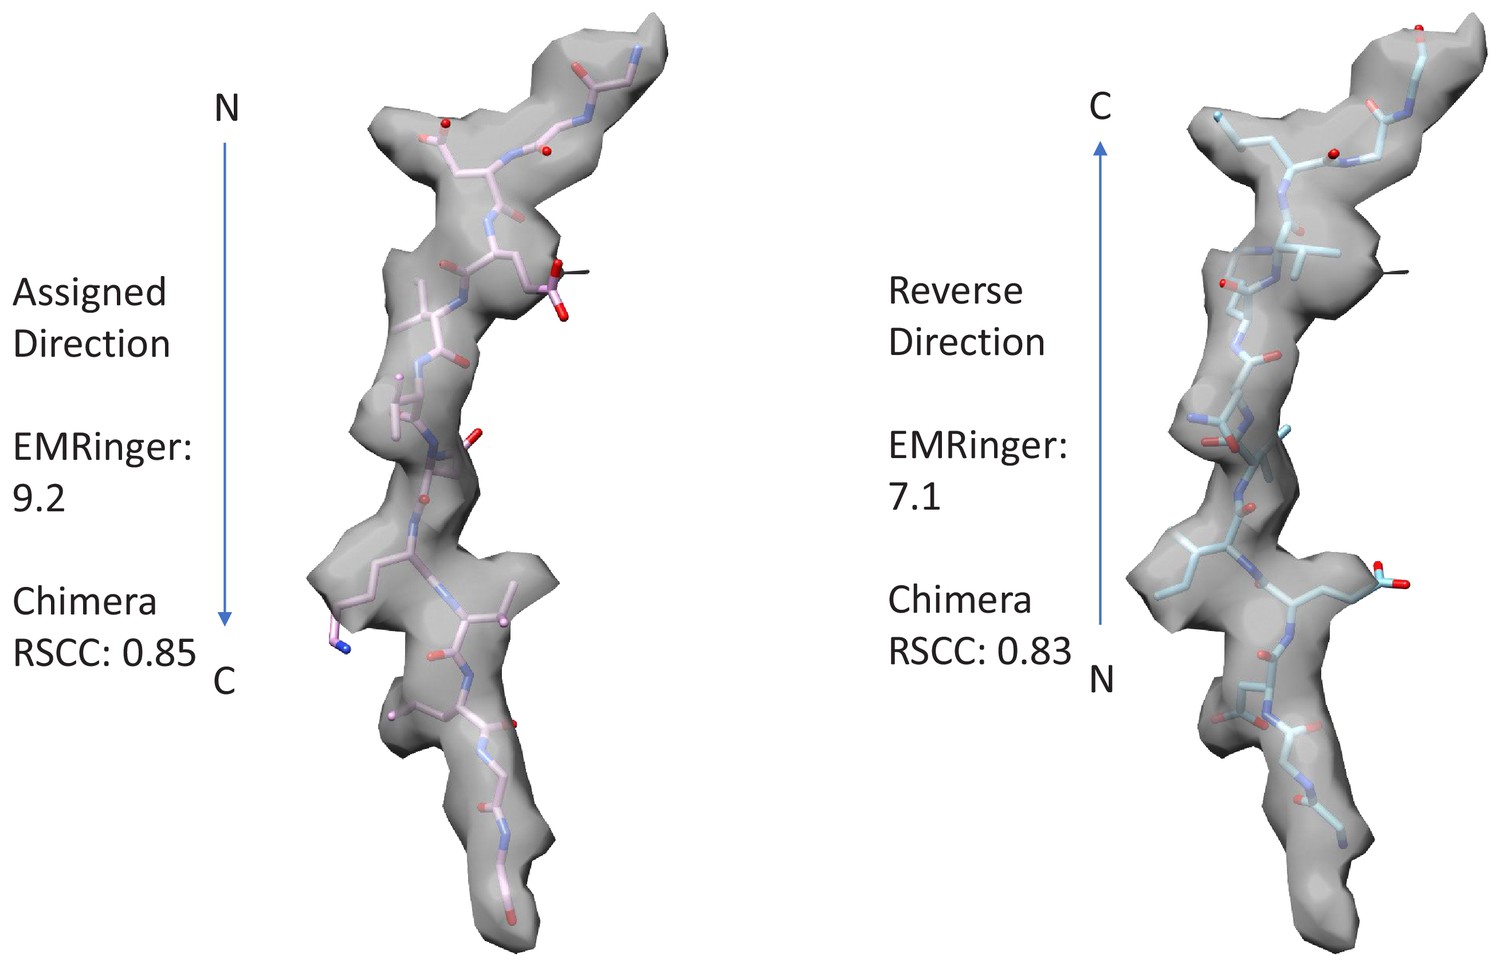
Fit of peptide to the cF30/cFF30 combined density when refined in the assigned and reversed orientations.
The peptide primary strand sequence was built optimally in the assigned and reversed orientations, and refined equivalently. Visual inspection does not give a strong indication of peptide orientation. Chimera (RRID:SCR_004097) RSCC (Pettersen et al., 2004) and EMRinger (Barad et al., 2015) scores support the assigned orientation by small margins. The assigned orientation agrees with that of a previously reported structure with an extended, linear peptide that was determined at slightly higher resolution (Han et al., 2017).
Figure 2—figure supplement 8
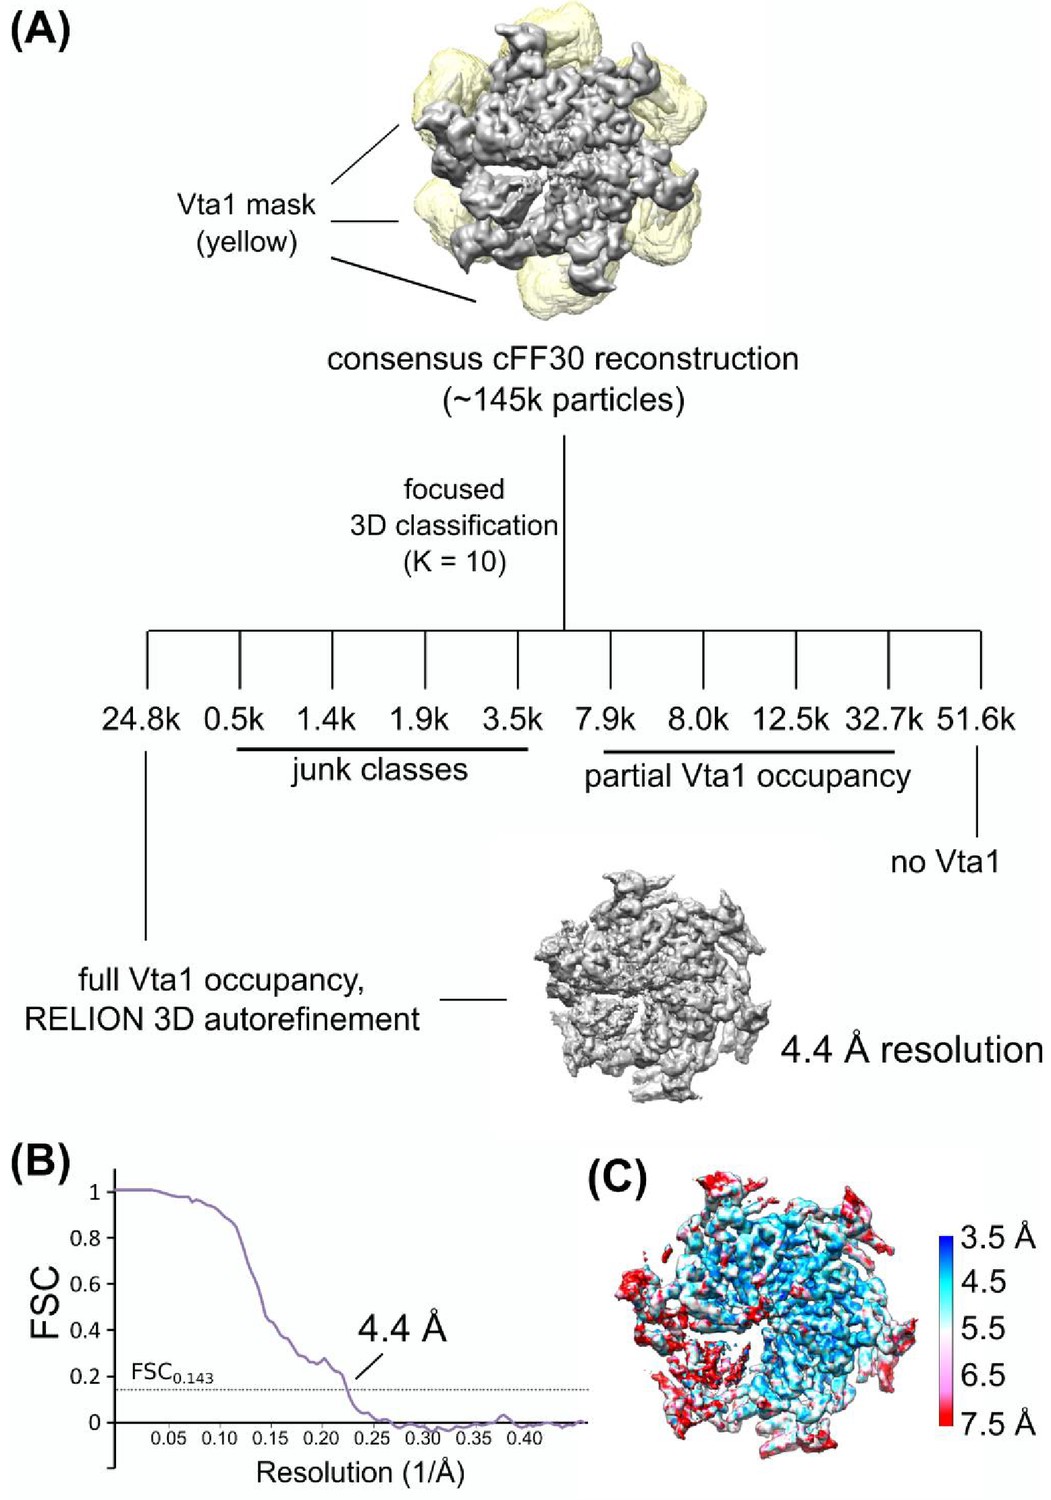
Focused 3D classification of Vta1VSL.
(A) Focused classification schematic of Vta1VSL. A mask covering all Vta1VSL binding sites was applied to the cFF30 reconstruction. Particles were sorted into ten classes, one of which showed robust Vta1VSL densities at all six binding sites. Particles in this class were then used for RELION 3D auto-refinement. (B) Gold-standard FSC plot of Vps4-Vta1VSL. (C) Local resolution of Vps4-Vta1VSL.
Figure 2—video 1
Representative density shown around the β-sheet of Vps4 subunit B for the combined cF30 and cFF30 dataset.
https://doi.org/10.7554/eLife.44071.023
Figure 2—video 2
Density around the cyclic peptide.
Primary strand, dark green. Returning stand, light green. The returning strand is modeled as polyalanine.
Figure 2—video 3
Density around the nucleotides.
https://doi.org/10.7554/eLife.44071.025
Figure 3 with 3 supplements
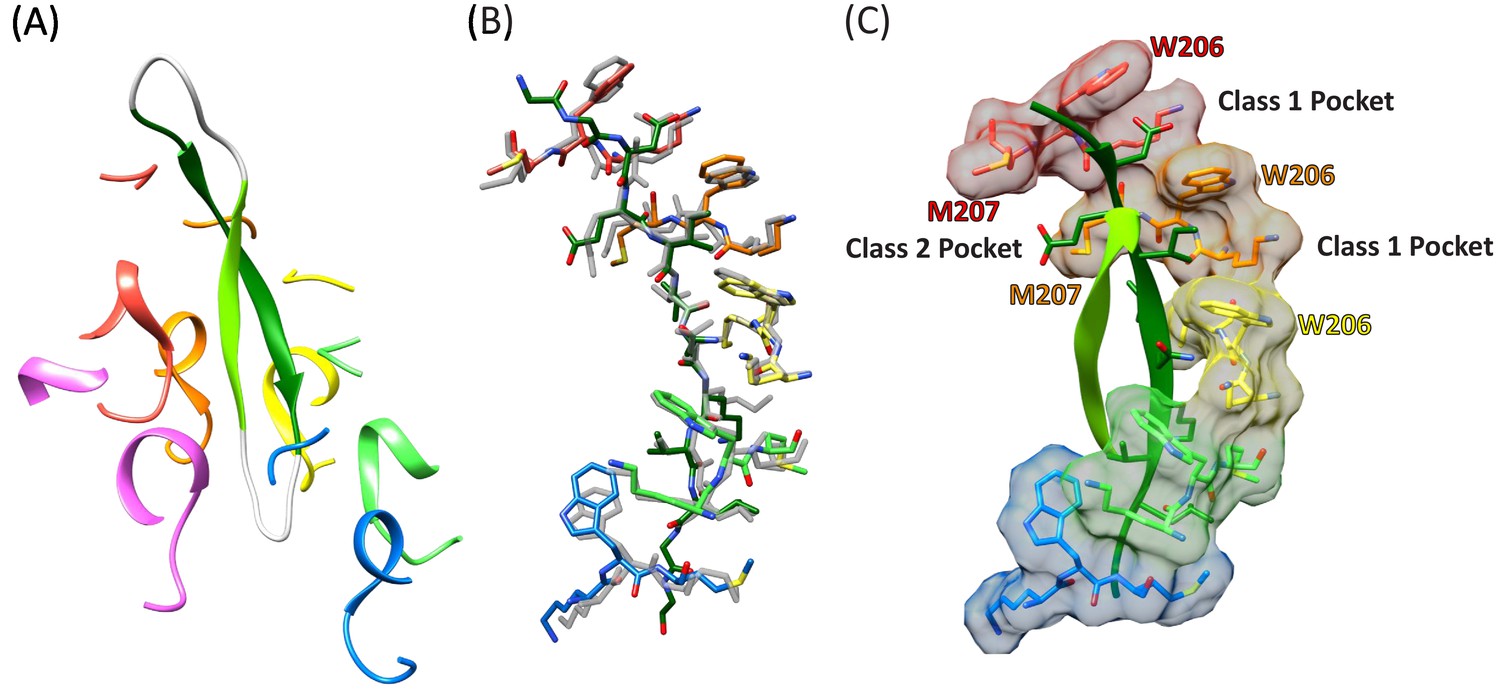
Cyclic peptide structure and coordination.
(A) Model of the entire cyclic peptide, including the residues that lack density (gray), with the Vps4 pore loop 1 and 2 residues. (B) Superposition of the cyclic peptide structure (colors) on the previously determined structure of the linear peptide F (gray). The returning strand of the cyclic peptide is omitted for clarity. (C) Ordered residues of the cyclic peptide are shown as green ribbons. Pore loop one residues K205, W206, and M207 of the five Vps4 subunits that form the helical assembly that binds the substrate peptide are shown as sticks and molecular surfaces. Alternating side chains bind to class I pockets between pairs of W206 residues of adjacent subunits (two examples labeled), and to class II pockets between pairs of M207 side chains from adjacent subunits (one example labeled).
Figure 3—video 1
Cyclic peptide complex structure.
https://doi.org/10.7554/eLife.44071.028
Figure 3—video 2
Superposition of the cyclic peptide complex with the previously reported linear peptide complex (gray) (Han et al., 2017).
https://doi.org/10.7554/eLife.44071.029
Figure 3—video 3
The primary strand of the cyclic peptide (dark green) binds the Vps4 pore loop one residues.
Pore loop one residues K205, W206, M207 are shown for subunits A-E in the closeup. Odd numbered peptide residues (D1, I3, N5, V7) bind to Class I binding pockets formed by W206 side chains of adjacent Vps4 subunits. Even-numbered peptide residues (E2, V4, K6, L8) bind to Class II binding pockets formed by M207 side chains of adjacent Vps4 subunits.
Figure 4 with 1 supplement

Cyclic peptide aligns with the helical axis.
Side and top views of the cyclic peptide and Vps4 pore loop one residues. The pseudo two-fold axis that relates the path of the two peptide strands to each other (albeit with opposite direction) aligns with the helical axis of Vps4 subunits A-E (gray). This ensures that the second strand is maximally distant from subunits A-E, thereby explaining the lack of contacts between Vps4 and the second strand.
Figure 4—video 1
The Vps4 pore is shown with peptide removed, followed by inclusion of just the primary strand (which superimposes on the previously reported linear peptide structure), and then with both strands of the cyclic peptide complex shown.
The returning strand is accommodated in the pore because it is maximally distant from the five helical subunits.
Figure 5 with 1 supplement
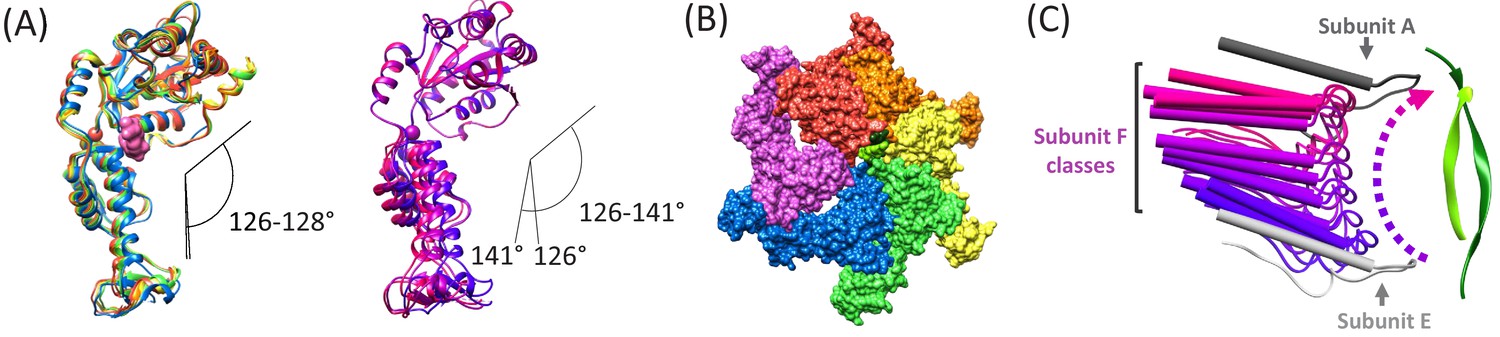
Subunit F conformation and contacts.
(A) Overlap of subunits showing variation in the hinge angle between large and small domains, as defined in Gonciarz et al. (2008). The overlaps were performed on the large domains. Left, Subunits A-E. Right, three classification structures of subunit F. (B) The large domain interfaces for AB, BC, CD, and DE subunit pairs are closely associated. These interfaces are much more open for the EF and FA subunit pairs, as seen by the openings in this slightly tilted view. (C) Side view of the Vps4 circular peptide complex with all of the classified subunit F models from all structures: cF30, cFF30, and combined cF30 and cFF30, plus the two previously reported data sets of Vps4 with the linear peptide F (Han et al., 2017; Monroe et al., 2017). Subunit F is colored based on position along its proposed trajectory.
Figure 5—video 1
Shown as linear interpolation between the different subunit states seem in the combined cF30 and cFF30 reconstruction, including the subunit F classifications.
https://doi.org/10.7554/eLife.44071.034
Figure 6

Transition of subunit F is coupled to movement of subunit E.
The maps reconstructed by focused classification over subunit F show that the uppermost subunit F position from the cyclic peptide data correlates with displacement of the subunit E small domain (cyan). This domain is connected by an extended 10-residue stretch of residues to the finger arginines that complete the subunit D active site.
Figure 7 with 3 supplements

Overlap of cyclic peptide structure suggests compatibility with YME1, Hsp104, and NSF.
(A) Vps4 color, YME1 (Puchades et al., 2017) gray. Overlap is on the Cα atoms of the peptide and pore loop 1 residues of the five helical subunits. (B) Same as (A) but without Vps4 and showing the zoomed in region of panels (C), (D), and (E). (C) Vps4 cyclic peptide after overlap on YME1. (D) Same as (C) for Hsp104 ring 1 (Gates et al., 2017). (E) Same as (C) for Hsp104 ring 2. (F) Same as (C) for NSF (White et al., 2018).
Figure 7—video 1
Overlap with other AAA+ ATPases.
Simple modeling suggests that the YME1, Hsp104, and NSF structures are compatible with binding a cyclic peptide.
Figure 7—video 2
Model for AAA+ ATPase translocation of substrate from an internal loop.
A general AAA+ ATPase structure is represented by the Vps4 ATPase cassette, with the N-terminal MIT domain and linker sequences removed. An ESCRT-III subunit is shown in green. The motion is modeled by linear interpolation between the six states for different Vps4 subunits that are represented in the structure. The relative rotation displayed by the substrate during translocation of two strands results from the match of helical symmetry between the pore loops and the bound substrate, and the sequential passage of substrate around the AAA+ ATPase ring. The animation was created using Autodesk Maya using molecular geometry exported from UCSF Chimera (RRID:SCR_004097).
Figure 7—video 3
Model for AAA+ ATPase translocation of a ubiquitylated substrate.
A general AAA+ ATPase structure is represented in the same manner as Figure 7—video 2. Ubiquitin conjugated to the substrate is shown in cyan. The animation was created using Autodesk Maya using molecular geometry exported from UCSF Chimera (RRID:SCR_004097).
Author response image 1
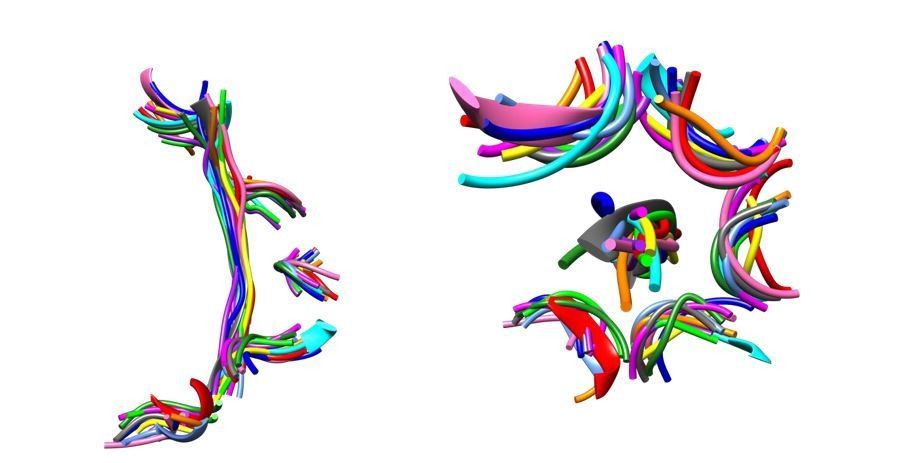
The Vps4-peptide F complex superimposes closely with other AAA+ ATPase-substrate complexes.
Overlap on AAA domains shows that pore loop 1 residues and the C α trace of the bound peptides superimpose closely. Left, side view. Right, top view. Vps4, gray. Other structures, colors: proteasome (5 structures), HSP104 (2 structures), YME1, NSF, TRIP13, ClpB (2 structures).
Author response image 2
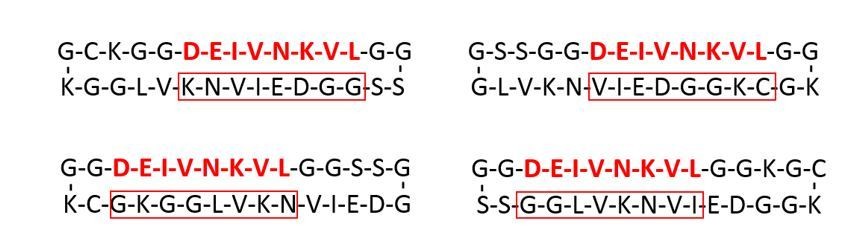
The cFF30 peptide displays “high complexity” residues on both strands in the pore.
The map shows that a peptide F sequence (red font) binds in the central region of the primary strand and that this is flanked by two ordered glycine residues on each side. The four possible configurations that display a reverse turn between the first/last ordered primary strand residue are shown. The secondary strand residues that would lie in the central region of the pore are indicated with a red box. In all cases these include at least five “high complexity” residues.
Tables
Table 1
Reconstruction, refinement, and validation statistics.
https://doi.org/10.7554/eLife.44071.026| Reconstruction | |
|---|---|
| Number of particle images | 237,480 |
| Resolution (0.143 FSC) (Å) | 3.6 |
| Map sharpening B-factor (Å2) | −157 |
| EMDB accession number | EMD-0443 |
| Model refinement of Vps4 subunits A-E | |
| PDB accession number | 6NDY |
| Resolution used for refinement (Å) | 3.6 |
| Number of atoms | 12531 |
| RMSD: Bond length (Å) | 0.003 |
| RMSD: Bond angles (°) | 0.739 |
| Ramachandran: Favored (%) | 94.1 |
| Ramachandran: Allowed (%) | 5.9 |
| Ramachandran: Outlier (%) | 0 |
| Validation | |
| Molprobity score/percentile (%) | 1.64 (100%) |
| Clashscore/percentile (%) | 4.67 (100%) |
| EMRinger score | 1.04 |
Key resources table
| Resource type | Designation | Source or reference | Identifiers |
|---|---|---|---|
| Recombinant protein | Vps4-HCP1 | PMID: 28379137 | Addgene (RRID:SCR_002037): 87737 |
| Recombinant protein | Vta1VSL | PMID: 28379137 | Addgene (RRID:SCR_002037): 87738 |
| Software, algorithm | GraphPad Prism | GraphPad Software, Inc, La Jolla, C | RRID:SCR_002798 |
| Software, algorithm | MotionCor2 | PMID: 28250466 | RRID:SCR_016499 |
| Software, algorithm | RELION | PMID: 23000701 | RRID:SCR_016274 |
| Software, algorithm | UCSF Chimera | PMID: 15264254 | RRID:SCR_004097 |
| Software, algorithm | Coot | PMID: 20383002 | RRID:SCR_014222 |
| Software, algorithm | Phenix | PMID: 20124702 | RRID:SCR_014224 |
Table 2
HPLC purification conditions for the peptides used in this study.
https://doi.org/10.7554/eLife.44071.040| Peptide | HPLC column | Flow rate | Gradient |
|---|---|---|---|
| F | Phenomenex C4 Luna (100 Å, 10 μm, 10 × 250 mm) | 5 mL/min | 20 to 80% Buffer B |
| F12 | Phenomenex C12 Jupiter (90 Å, 10 μm, 21.2 × 250 mm) | 5 mL/min | 25 to 45% Buffer B |
| F30 | Phenomenex C12 Jupiter (90 Å, 10 μm, 21.2 × 250 mm) | 10 mL/min | 20 to 45% Buffer B |
| cF30 (pre-cyclization) | Phenomenex C12 Jupiter (90 Å, 10 μm, 21.2 × 250 mm) | 10 mL/min | 20 to 45% Buffer B |
| cF30 | Phenomenex C4 Jupiter (100 Å, 10 μm, 10 × 250 mm) | 5 mL/min | 10 to 35% Buffer B |
| FF30 | Phenomenex C12 Jupiter (90 Å, 10 μm, 21.2 × 250 mm) | 10 mL/min | 29 to 37% Buffer B |
| cFF30 (pre-cyclization | Phenomenex C12 Jupiter (90 Å, 10 μm, 21.2 × 250 mm) | 10 mL/min | 20 to 45% Buffer B |
| cFF30 | Phenomenex C4 Jupiter (100 Å, 10 μm, 10 × 250 mm) | 5 mL/min | 27 to 38% Buffer B |
Additional files
-
Transparent reporting form
- https://doi.org/10.7554/eLife.44071.041
Download links
A two-part list of links to download the article, or parts of the article, in various formats.
Downloads (link to download the article as PDF)
Open citations (links to open the citations from this article in various online reference manager services)
Cite this article (links to download the citations from this article in formats compatible with various reference manager tools)
Structure of Vps4 with circular peptides and implications for translocation of two polypeptide chains by AAA+ ATPases
eLife 8:e44071.
https://doi.org/10.7554/eLife.44071


