Neck linker docking is critical for Kinesin-1 force generation in cells but at a cost to motor speed and processivity
- University of Michigan, United States
- Vanderbilt University, United States
- University of California, San Diego, United States
- Vanderbilt University School of Medicine, United States
- University of Michigan Medical School, United States
Figures
Figure 1 with 2 supplements

MD simulations identify key interactions between the kinesin-1 NL and motor domain.
(A) Surface representation of the kinesin-1 (RnKIF5C) motor domain in the nucleotide-free (apo) state (top, PDB 4LNU) or ATP-bound, post-power stroke state (bottom, PDB 4HNA). The neck linker (NL, light green) is represented as a cartoon and is flexible in the apo state and docked along the motor domain in the ATP-bound state. Additional secondary structure elements are indicated: coverstrand (CS, purple), α1 (dark green), β7 (yellow), Loop13 (L13, orange), β8 (teal), neck linker (NL: β9 and β10, light green). (B) Differences in residue-residue distances between kinesin-1 motors in the apo versus ATP-bound states as determined from MD simulations. The secondary structure elements are laid out along the x- and y-axes with α-helices colored in black, β-strands in grey, or colored according to (A). Residue-residue interactions that are significantly closer (p<0.05) in the apo state (red) or ATP-bound state (blue) are indicated on the graph. The magnitude of the distance change is indicated by color intensity. Interactions between key structural elements are labeled. Zoomed views are depicted in Figure 1—figure supplement 1. A complete list of residue distance differences are in Supplementary file 1. (C) Sequence alignment of the kinesin-1 motor domain across species (Dm, Drosophila melanogaster; Rn, Rattus norvegicus; Hs, Homo sapiens). For simplicity, only secondary structure elements indicated in (A) are displayed; an asterisk indicates the asparagine-latch (N-Latch). Sequence alignments across kinesin families are in Figure 1—figure supplement 2. (D) Schematic of key structural elements involved in CNB formation and NL latching in WT and mutant motors. The first-half of the NL (β9, light green) interacts with the C-terminal end of the CS (purple) to form the cover-neck bundle (CNB). The second half of the NL (N-Latch and β10) interacts with β7 (yellow) of the core motor domain for NL docking. Residue-residue contacts for NL docking are depicted as blue lines. Point mutations generated to disrupt CNB formation, N-latch formation, or both are shown in red text.
Figure 1—figure supplement 1
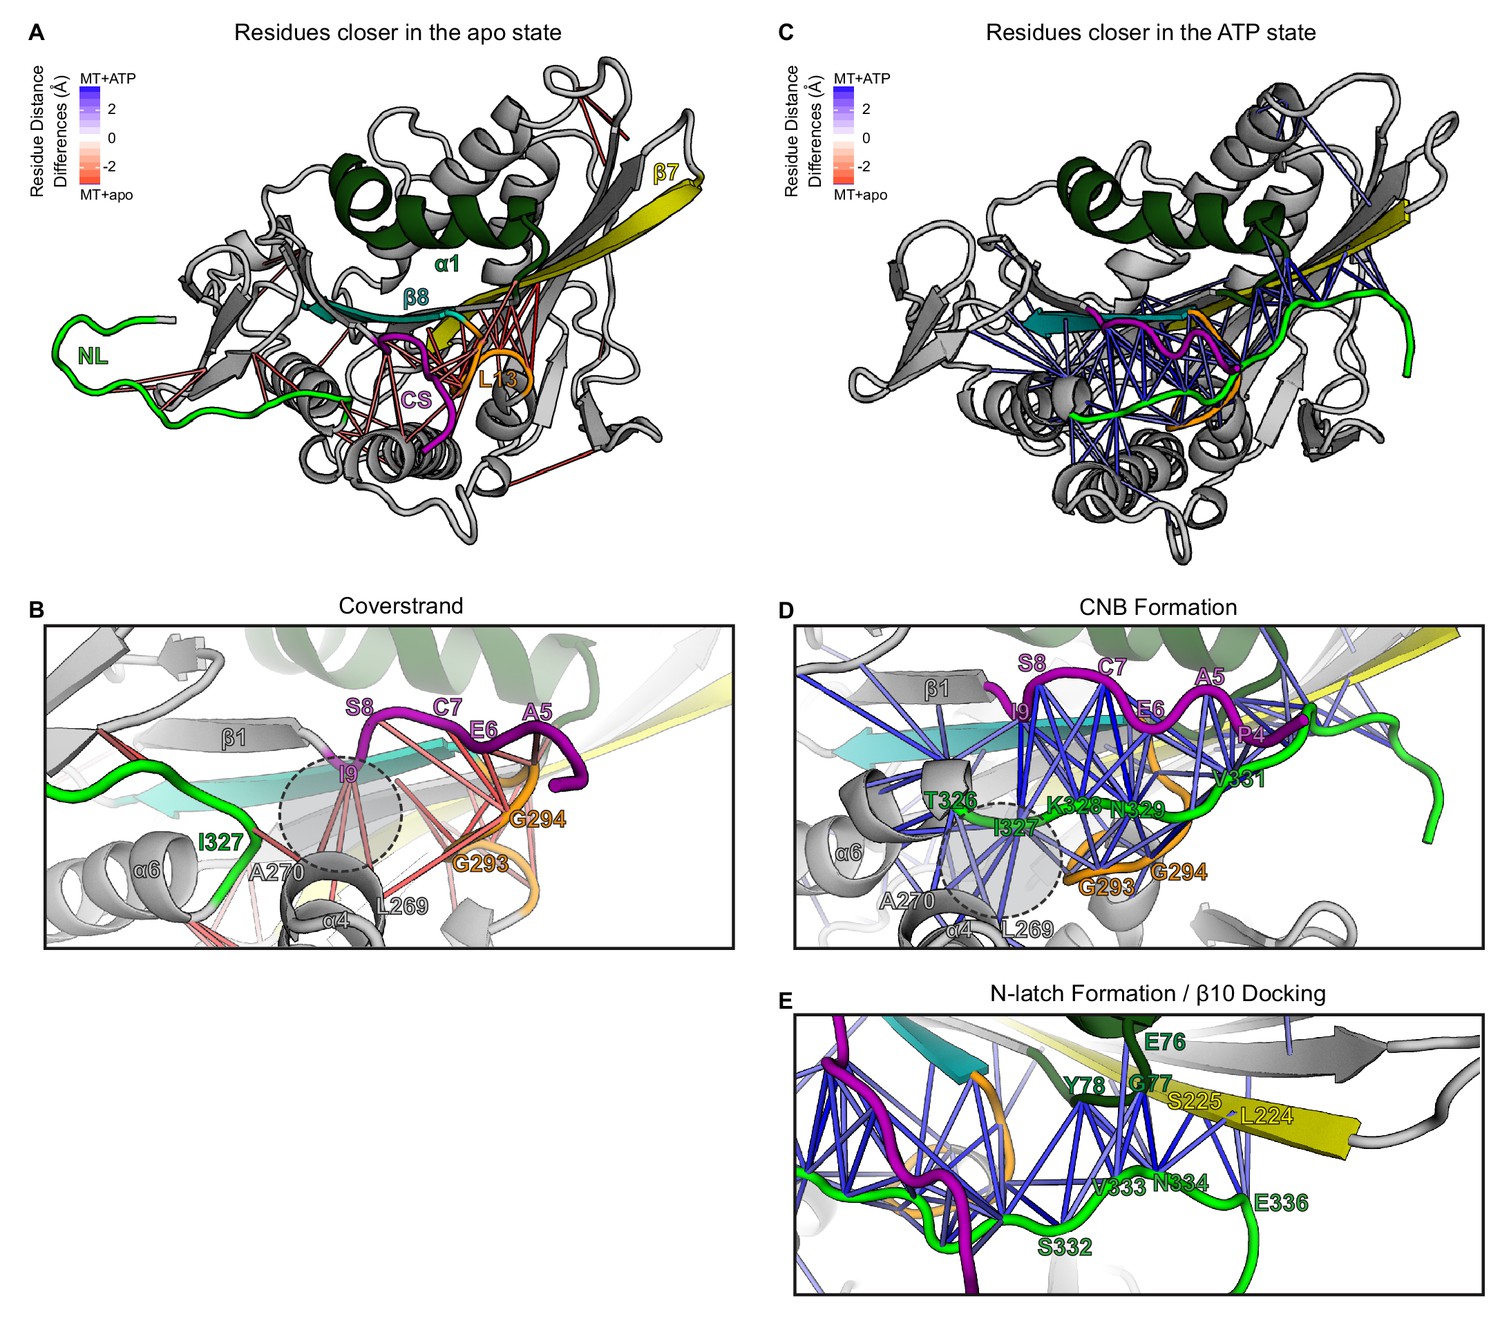
CS and NL interactions in the no nucleotide (apo) and ATP-bound, post-power stroke states of the kineisn-1 motor domain bound to tubulin.
(A, B) Nucleotide-free (apo) state. (A) Cartoon representation of the kinesin-1 motor domain (PDB 4LNU) in the nucleotide-free (apo) state. Secondary structure elements: coverstrand (CS, purple), α1 (dark green), β7 (yellow), Loop13 (orange), β8 teal, neck linker (NL: β9 and β10, light green). Red lines depict residue-residue distances that are significantly closer (p<0.05) in the apo state compared to the ATP-bound state across replicate MD simulations. The magnitude of the distance change is indicated by color intensity. The CS (purple) shows close interactions with Loop13 (orange) and α4 (grey). The NL (light green) is flexible and shows few interactions with other elements of the motor domain. (B) Enlarged view of CS interactions. The C-terminal residue of the CS [the coverstrand terminal residue (CTR), I9] lies in the docking pocket (dashed circle) and interacts with residues in α4 (I266, L269, A270) while the N-terminal residues of the CS (A5, E6, C7, S8) interact with residues in Loop13 (L292, G293, G294, N295). (C–E) ATP-bound state. (C) Cartoon representation of the kinesin-1 motor domain (PDB 4HNA) in the ATP-bound state. Secondary structure elements are colored as in (A). Blue lines depict residue-residue distances that are significantly closer (p<0.05) in the ATP-bound state compared to the apo state across replicate MD simulations. The magnitude of the distance change is indicated by color intensity. The CS and N-terminal half of the NL (β9) interact to form the cover-neck bundle (CNB) and the C-terminal half of the NL (N-latch and β10) interacts with the core motor domain (α1 and β7) to complete NL docking. (D) Enlarged view of CNB interactions. The N-terminal residue of the NL (I327) now occupies the docking pocket (dashed circle) and interacts with residues in α4 (I266, L269, A270). The CS (A5, E6, C7, S8, I9) interacts with residues in β9 of the NL (K328, N329, T330) to form the CNB. (E) Enlarged view of NL docking interactions. The highly-conserved asparagine residue (N-latch, N334) forms critical interactions with α1 residues (G77, Y78) and β7 residues (S225, G226). Interactions between subsequent residues of β10 of the NL (E336) and β7 (L224, S225) complete NL docking.
Figure 1—figure supplement 2
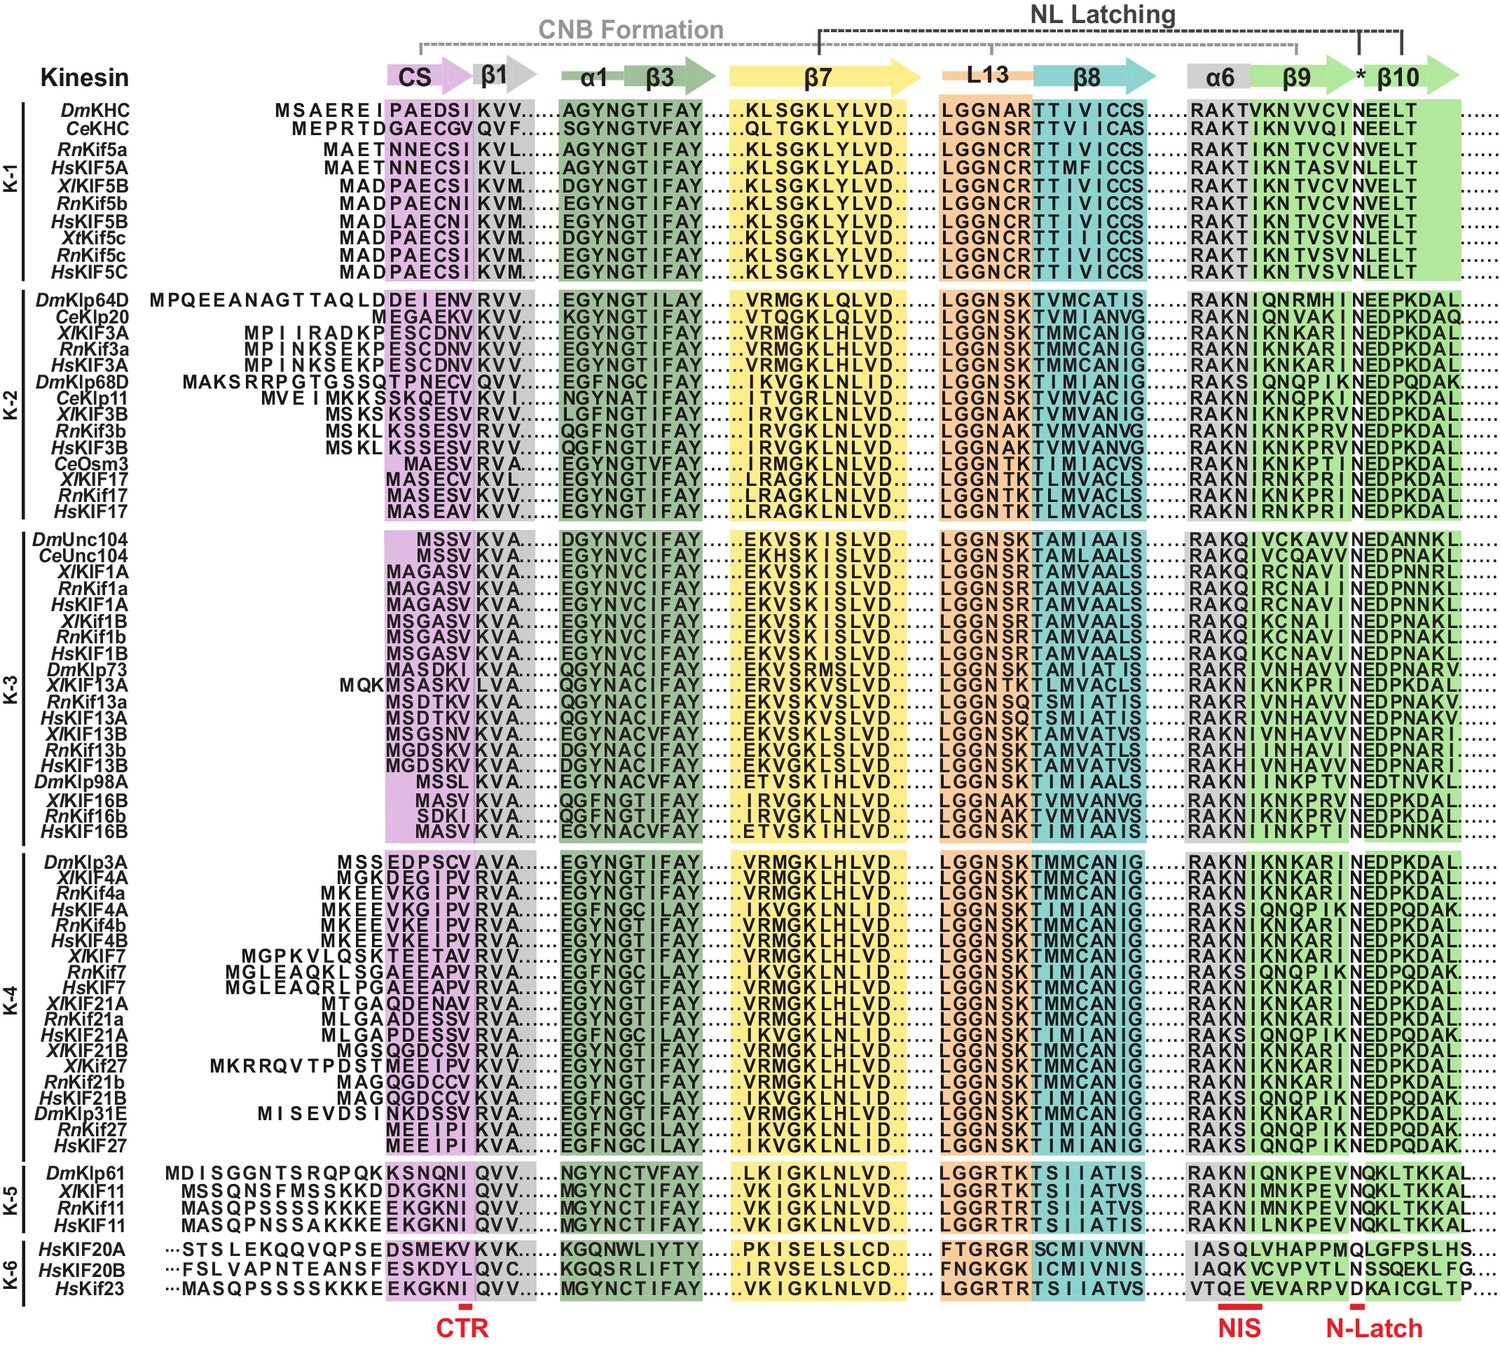
Sequence alignment of the motor domain reveals subtle sequence changes that may alter CNB formation and NL docking across the kinesin superfamily.
Sequence alignment of the motor domain from kinesin-1,–2, −3,–4, −5,–6 families across species (Dm, Drosophila melanogaster; Ce, Caenorhabditis elegans, Xl, Xenopus laevis; Rn, Rattus norvegicus; Hs, Homo sapiens). For simplicity, only secondary structure elements critical for CNB and N-Latch formation in kinesin-1 are indicated: coverstrand (CS, purple), α1 (dark green), β7 (yellow), Loop13 (L13, orange), β8 (teal), neck linker (NL: β9 and β10, light green). The coverstrand terminal residue (CTR), NL initiation sequence (NIS), and asparagine-latch (N-Latch) are indicated at the bottom in red text.
Figure 2 with 1 supplement
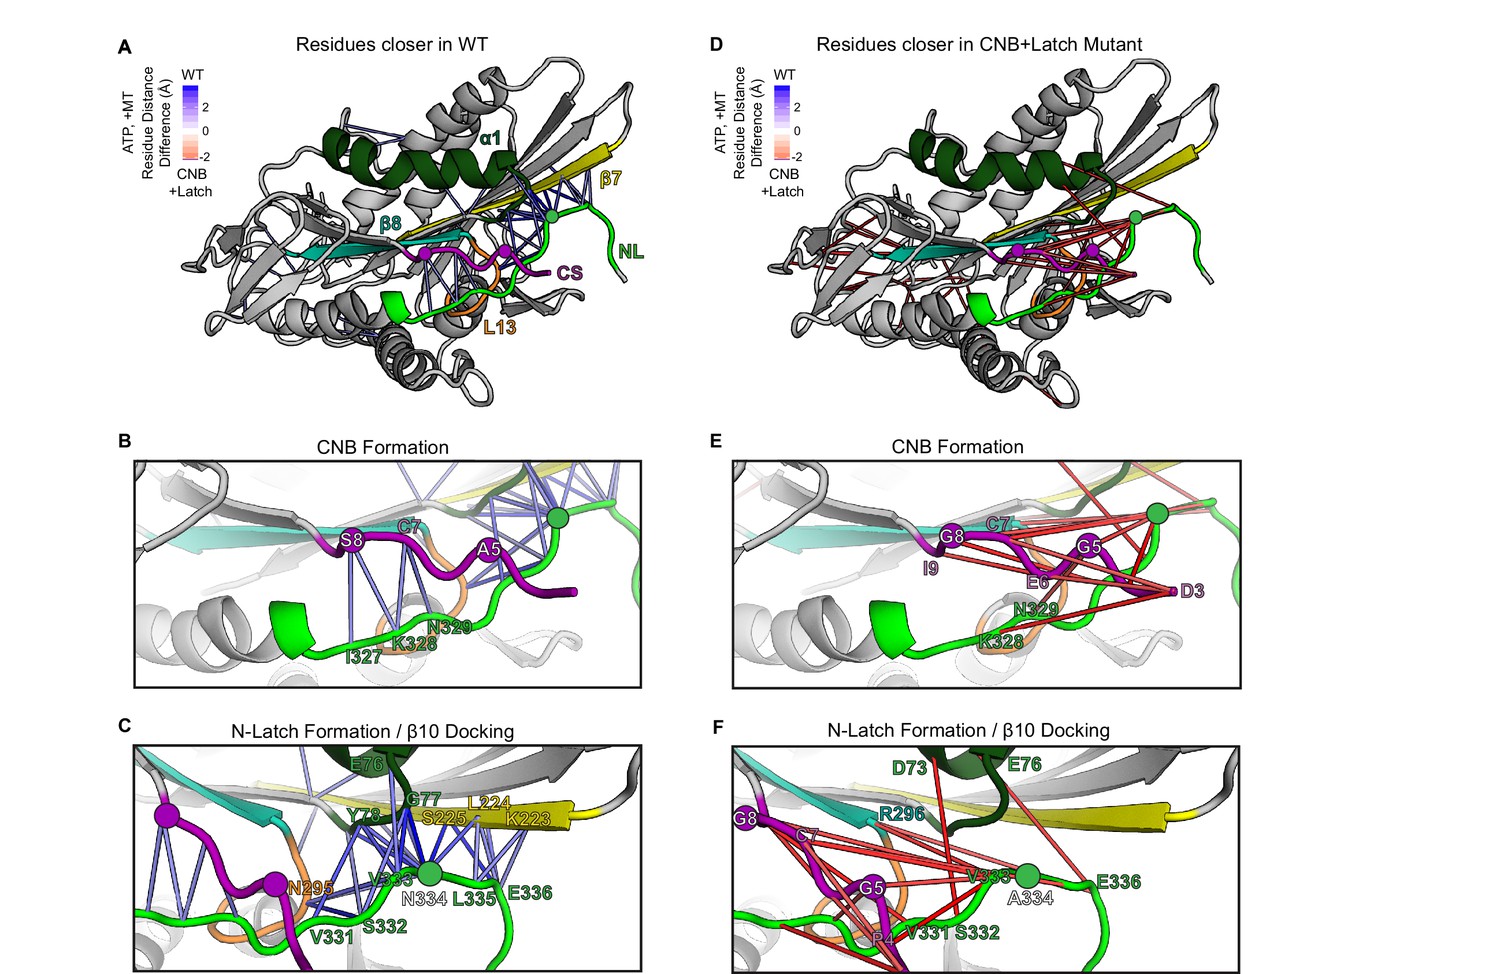
MD simulations predict that CNB+Latch mutations alter CNB formation and NL docking.
(A–F) The kinesin-1 motor domain in the ATP-bound, post-power stroke state is shown as a cartoon representation (PDB 4HNA). Secondary structure elements are colored: coverstrand (CS, purple), α1 (dark green), β7 (yellow), Loop13 (L13, orange), β8 (teal), neck liker (NL: β9 and β10, light green). Residues targeted for mutations are indicated as circles. (A) Blue lines depict residue-residue that are significantly (p<0.05) closer in the WT motor as compared to the CNB+Latch mutant across replicate MD simulations. The magnitude of the distance change is indicated by color intensity. (D) Red lines depict residue-residue that are significantly (p<0.05) closer in the CNB+Latch mutant as compared to the WT motor across replicate MD simulations. The magnitude of the distance change is indicated by color intensity. A similar comparison between WT and Latch mutant motors is described in Figure 2—figure supplement 1. (B,E) Enlarged view of CNB interactions. (B) Contacts between the CS (residues S8, C7) and the NL (β9 residues I327, K328, N329) are shorter in the WT motor, suggesting that CNB formation is disrupted in the CNB+Latch mutant. (E) The mutated CS makes intra-CS contacts rather than interactions with the NL. (C,F) Enlarged view of NL-β7 interactions. (C) The WT motor shows shorter contacts for (i) the N-latch (N334) with β7 (L224, S225) and α1 (G77, Y78) residues, (ii) the N-terminal half of the NL (β9 residues V331, S332, V333) with the core motor domain (L13 residue N295 and α1 residues E76, G77, Y78), and (iii) the C-terminal half of the NL (β10 residue E336) with the core motor domain (β7 residues L224, S225). This suggests that NL docking is disrupted in the CNB+Latch mutant. (F) The mutated NL makes interactions with the CS rather than β7.
Figure 2—figure supplement 1
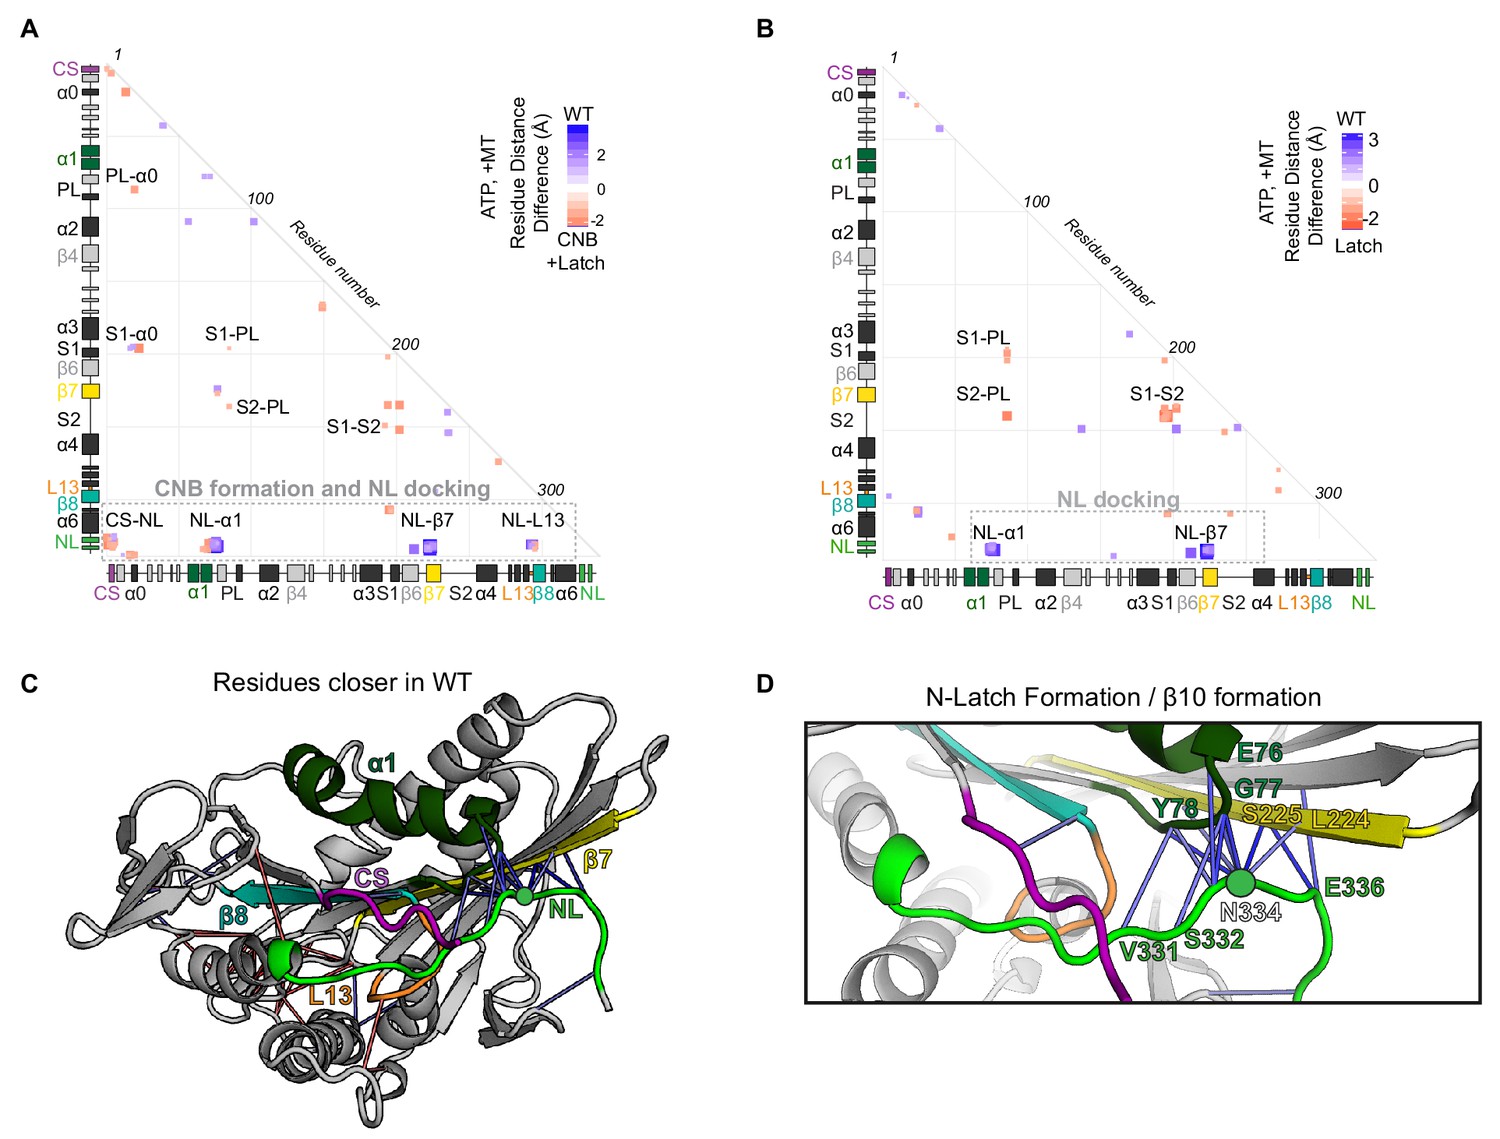
MD simulations predict that mutations of the N-Latch alter CNB formation and NL docking.
(A,B) Differences in residue-residue distances between (A) WT and CNB+Latch mutant motors or (B) WT and Latch mutant motors based on MD simulations of tubulin-bound motors in the ATP-bound state. The secondary structure elements are laid out along the x- and y-axes with α- helices in black, β-strands in grey, or colored according to Figure 2A. Distances that are significantly (p<0.05) shorter in the apo state (red) or ATP-bound state (blue) are displayed. The magnitude of the distance change is indicated by color intensity; interactions between elements are labeled. A complete list of residue distance differences for WT kinesin-1 versus CNB+Latch mutant motors in the ATP-bound, post power stroke state are in Supplementary file 2. A complete list of residue distance differences for WT kinesin-1 versus Latch mutant motors in the ATP-bound, post power stroke state are in Supplementary file 3. (C,D) Ribbon representation of (C) the kinesin-1 motor domain (PDB 4HNA) associated with tubulin in the ATP-bound state and (D) enlarged view of NL docking interactions. Secondary structure elements responsible for NL docking are colored; coverstrand (CS, purple), α1 (dark green), β7 (yellow), Loop13 (L13, orange), β8 (teal), neck linker (NL: β9 and β10, light green). Blue lines depict residue contact that are closer in the WT motor as compared to the Latch mutant. The magnitude of distance change is indicated by line color intensity. Contacts between the N-latch (N334) with the core motor domain (β7 residues L224, S225 and α1 residues G77, (Y78) and contacts between the C-terminal half of the NL (β10 residue E336) with the core motor domain (β7 residues L224, S225) are closer in the WT, suggesting that NL docking is disrupted in the Latch mutant.
Figure 3

CNB and N-Latch formation are critical for force generation by single kinesin-1 motors.
(A) Schematic of single-molecule optical trap assay. Cell lysates containing FLAG-tagged KIF5C(1-560) motors were incubated with beads functionalized with anti-FLAG antibodies and subjected to standard optical trapping assays. (B,C) Force generation of WT (black), CNB (purple), Latch (green), and CNB+Latch (yellow) motors under single-molecule conditions. (B) Detachment forces are plotted as a dot plot where each dot indicates the maximum detachment force of an event and the mean for each construct is indicated by a black horizontal line. Maximum detachment forces include motility events where single motors reached a plateau stall before detachment and events where the motor abruptly detached from the microtubule. N ≥ 20 events for each construct; ***, p<0.001, compared to the WT motor. (C) Representative traces. Black arrowheads indicate abrupt detachment events.
Figure 4 with 1 supplement
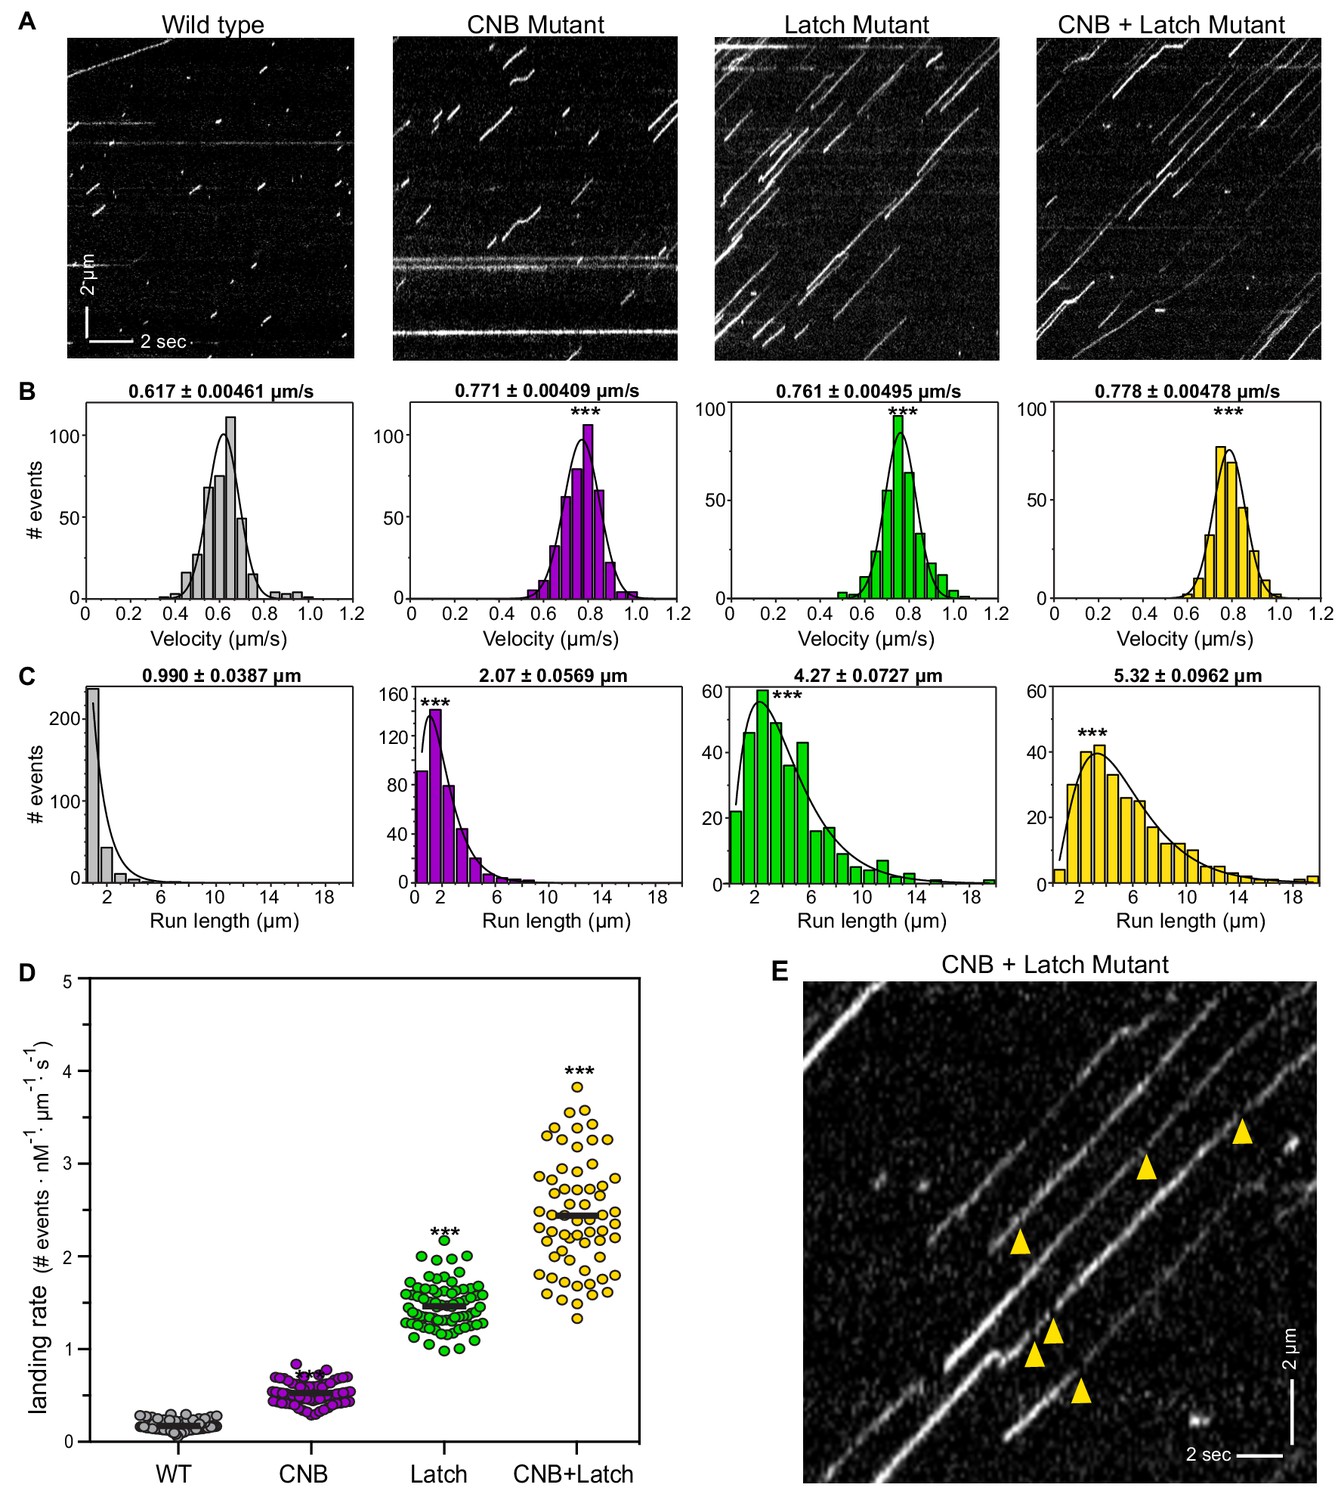
CNB and Latch mutants display enhanced motility properties under single-molecule, unloaded conditions.
(A) Motility properties of WT or mutant motors tagged with three tandem monomeric Citrines (3xmCit) at their C-termini were analyzed in standard single-molecule motility assays using TIRF microscopy. Representative kymographs are shown with time displayed on the x-axis (bar, 2 s) and distance displayed on the y-axis (bar, 2 μm). (B–D) Quantification of motility properties. From the kymographs, single-motor (B) velocities, (C) run lengths, and (D) landing rates were determined and the data for each population is plotted as a histogram. (B,C) The mean ± SEM are indicated above each graph; N ≥ 250 events across three independent experiments for each construct; ***, p<0.001 as compared to the WT motor. (D) Each dot indicates the landing rate of a single motor with the mean indicated by horizontal black line; N ≥ 250 events across three independent experiments for each construct; ***, p>0.001 as compared to the WT motor. (E) Magnified view of the representative kymograph of the CNB+Latch mutant shown in (A) (y-axis bar, 2 μm; x-axis bar, 2 s); yellow arrowheads indicate gaps in the runs. The gaps are characterized in Figure 4—figure supplement 1.
Figure 4—figure supplement 1
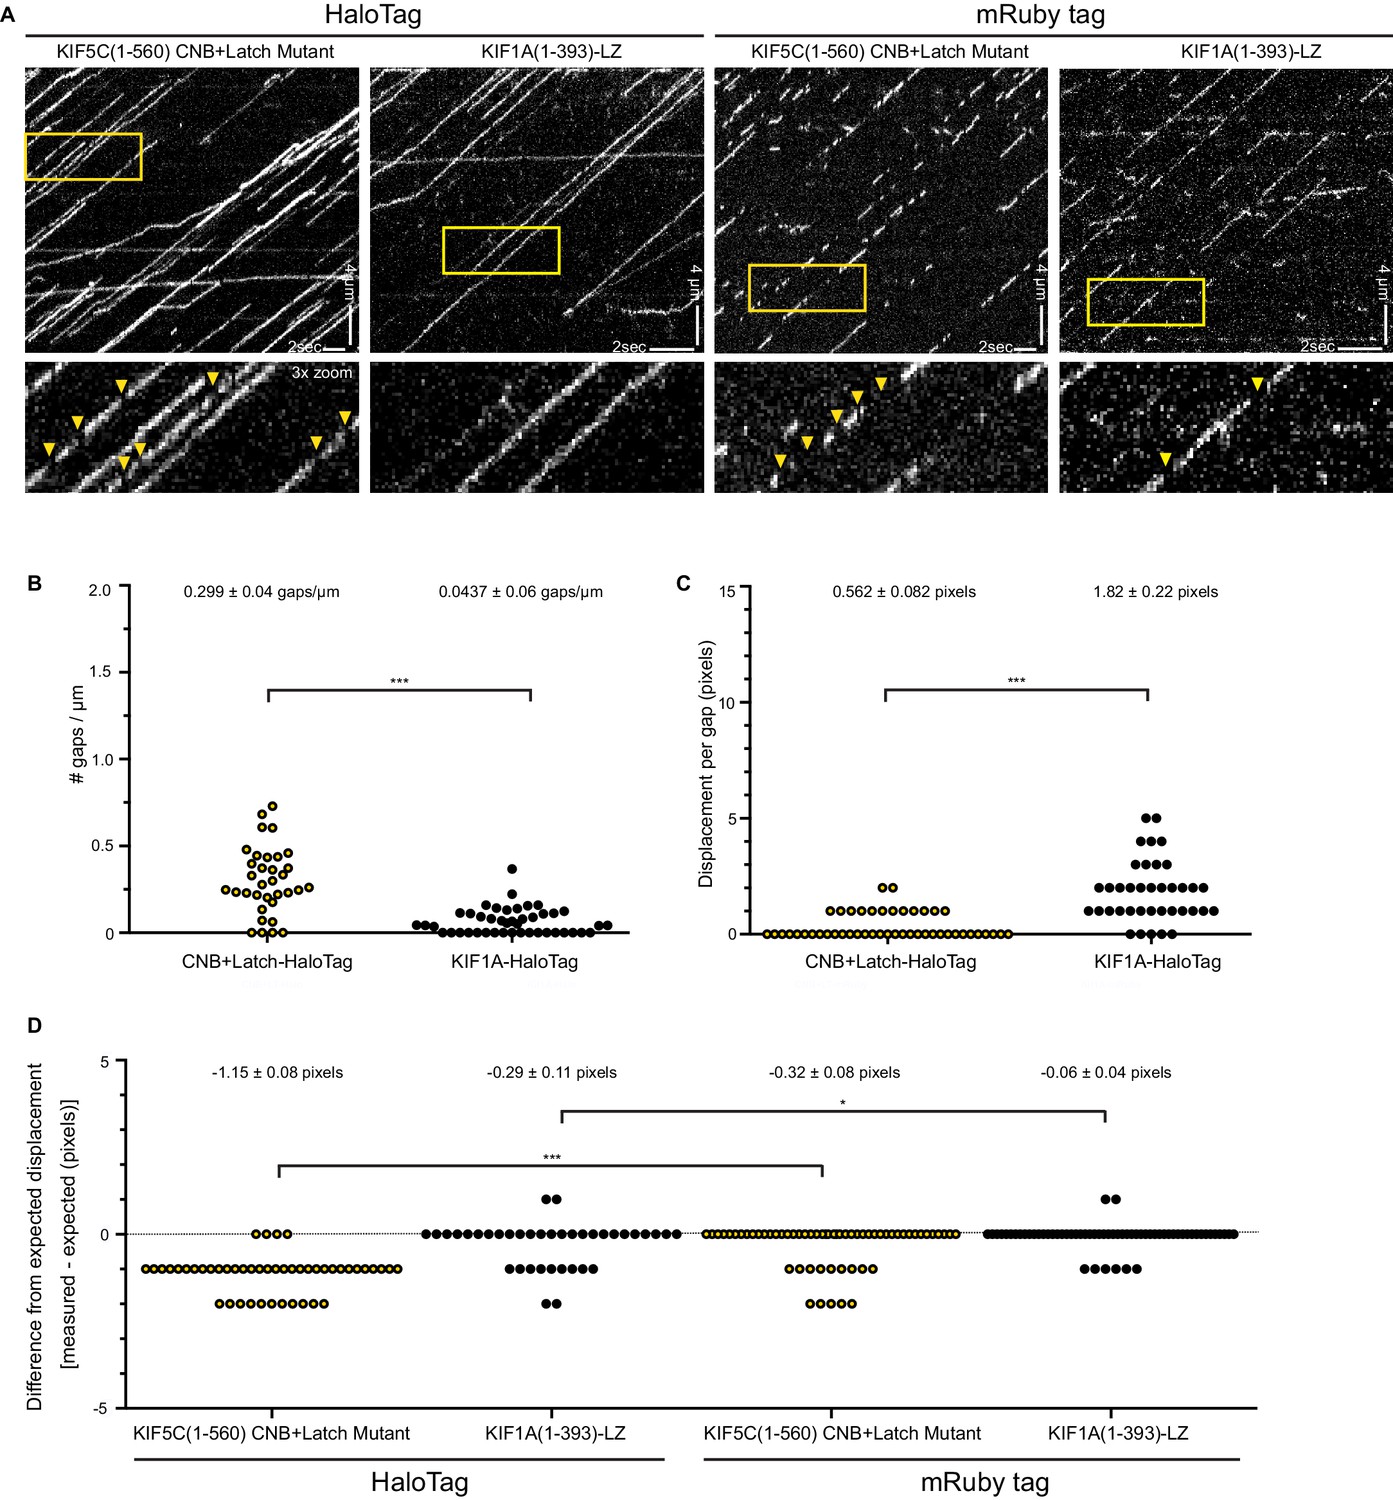
CNB+Latch mutants exhibit fast reattachment events during processive runs.
(A) Motility properties of kinesin-1 KIF5C(1-560) CNB+Latch mutant or the highly processive kinesin-3 motor KIF1A(1-393)-LZ. The motors were tagged with either a HaloTag and labeled with an JF649 fluorescent dye or with monomeric Ruby3 fluorescent protein. Motors were analyzed in cell lysates in standard single-molecule motility assays using TIRF microscopy. Representative kymographs are shown with time displayed on the x-axis (bar, 2 s) and distance displayed on the y-axis (bar, 4 μm). Red boxes indicate magnified region displayed in bottom panels; arrow heads indicate gaps in runs. (B–D) Characterization of gaps. (B) The number of gaps per μm of microtubule for motors labeled with HaloTag-JF649. The data for each population is plotted as a dot plot; the mean ± SEM are indicated at the top of the graph; ***, p<0.001. (C) The displacement during the gap for motors labeled with HaloTag-JF649. The data for each population is plotted as a dot plot; the mean ± SEM are indicated at the top of the graph; ***, p<0.001. (D) The difference in measured versus expected displacement during the gap for motors labeled with HaloTag-JF649 or mRuby3. The displacement during the gaps was measured from the kymographs. The expected displacement of the motor during the time frame of the same gap was calculated using the measured velocity of the motor. The difference between measured and expected displacement for each population is plotted as a dot plot; the mean ± SEM are indicated at the top of the graph; ***, p<0.001 for HaloTagged compared to mRuby-tagged versions for each motor. If the gaps in the runs are due to fluorophore blinking, the measured displacement during the gap will be the same as the expected displacement (difference = 0, dotted black line). If the gaps in the runs are due to fast reattachment of the motor to the microtubule track, the measured distance during the gap will be shorter than the expected displacement (difference <0).
Figure 5 with 1 supplement
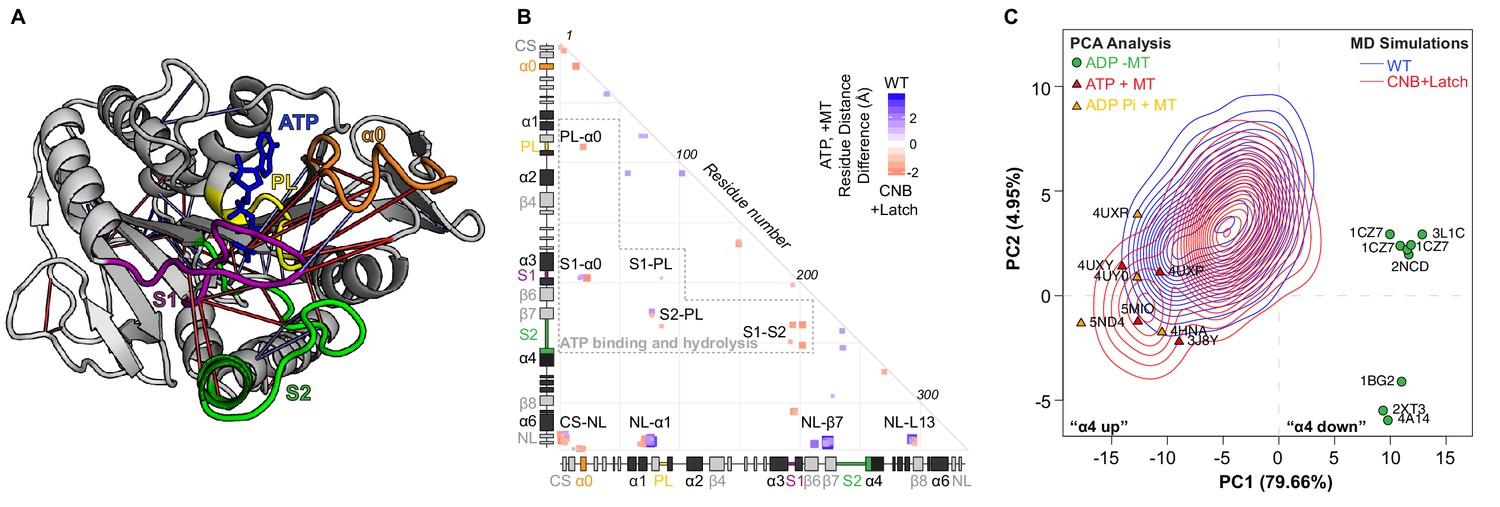
CNB+Latch mutations enhance microtubule binding and catalytic site closure.
(A) Ribbon representation of the kinesin-1 motor domain in the ATP-bound, post-power stroke state (PDB 4HNA). Secondary structure elements critical for nucleotide binding and hydrolysis are colored as follows: Switch 1 (S1, purple), Switch 2 (S2, green), P-loop (yellow), and α0 (orange). Red lines depict residue-residue distances that are shorter in the CNB+Latch mutant motor versus WT motor (p<0.05); blue lines depict residue-residue distances that are shorter in the WT motor versus CNB+Latch mutant motor (p<0.05). The magnitude of the distance change is indicated by line color intensity. Note that the point of view is rotated with respect to previous figures. A more detailed comparison of residue-residue distances within structural elements critical for nucleotide binding and hydrolysis for WT, Latch, and CNB+Latch motors are in Figure 5—figure supplement 1. (B) Differences in residue-residue distances between WT kinesin-1 and CNB+Latch mutant motors in the ATP-bound, tubulin-bound state in MD simulations. The secondary structure elements are laid out along the x- and y-axes with α- helices in black, β-strands in grey, or colored according to (A). Distances that are significantly shorter (p<0.05) in CNB+Latch (red) or WT (blue) motor are displayed. The magnitude of the distance changes is indicated by color intensity; interactions between structural elements are labeled. (C) Principle component analysis (PCA) was used to define states of the microtubule-binding surface of kinesin-1. The x-ray structures of seventeen motor domains from five different kinesin families (listed in Supplementary file 4) in the ADP-bound or ATP-bound states were utilized. The position of each motor domain structure within the PCA map is indicated together with its nucleotide state (red, ATP; yellow, ADP-Pi; green, ADP), microtubule state (circle, no microtubule; triangle, bound to microtubule), and PDB code. The first two principle components (PC1 and PC2) represent over 80% of the structural variation across the microtubule-binding surface between the ADP-bound and ATP-bound states. PC1 represents the positioning of α4 as ‘down’ in the ADP-like state and ‘up’ in the ATP-like state. The ability of WT versus CNB+Latch mutant motors to sample these states was then analyzed by MD simulations starting from the 2KIN structure in the ADP-bound and microtubule-free state. The conformational space explored by each motor is projected as a topographic map (WT, blue; CNB+Latch, red) onto the PCA analysis plot.
Figure 5—figure supplement 1
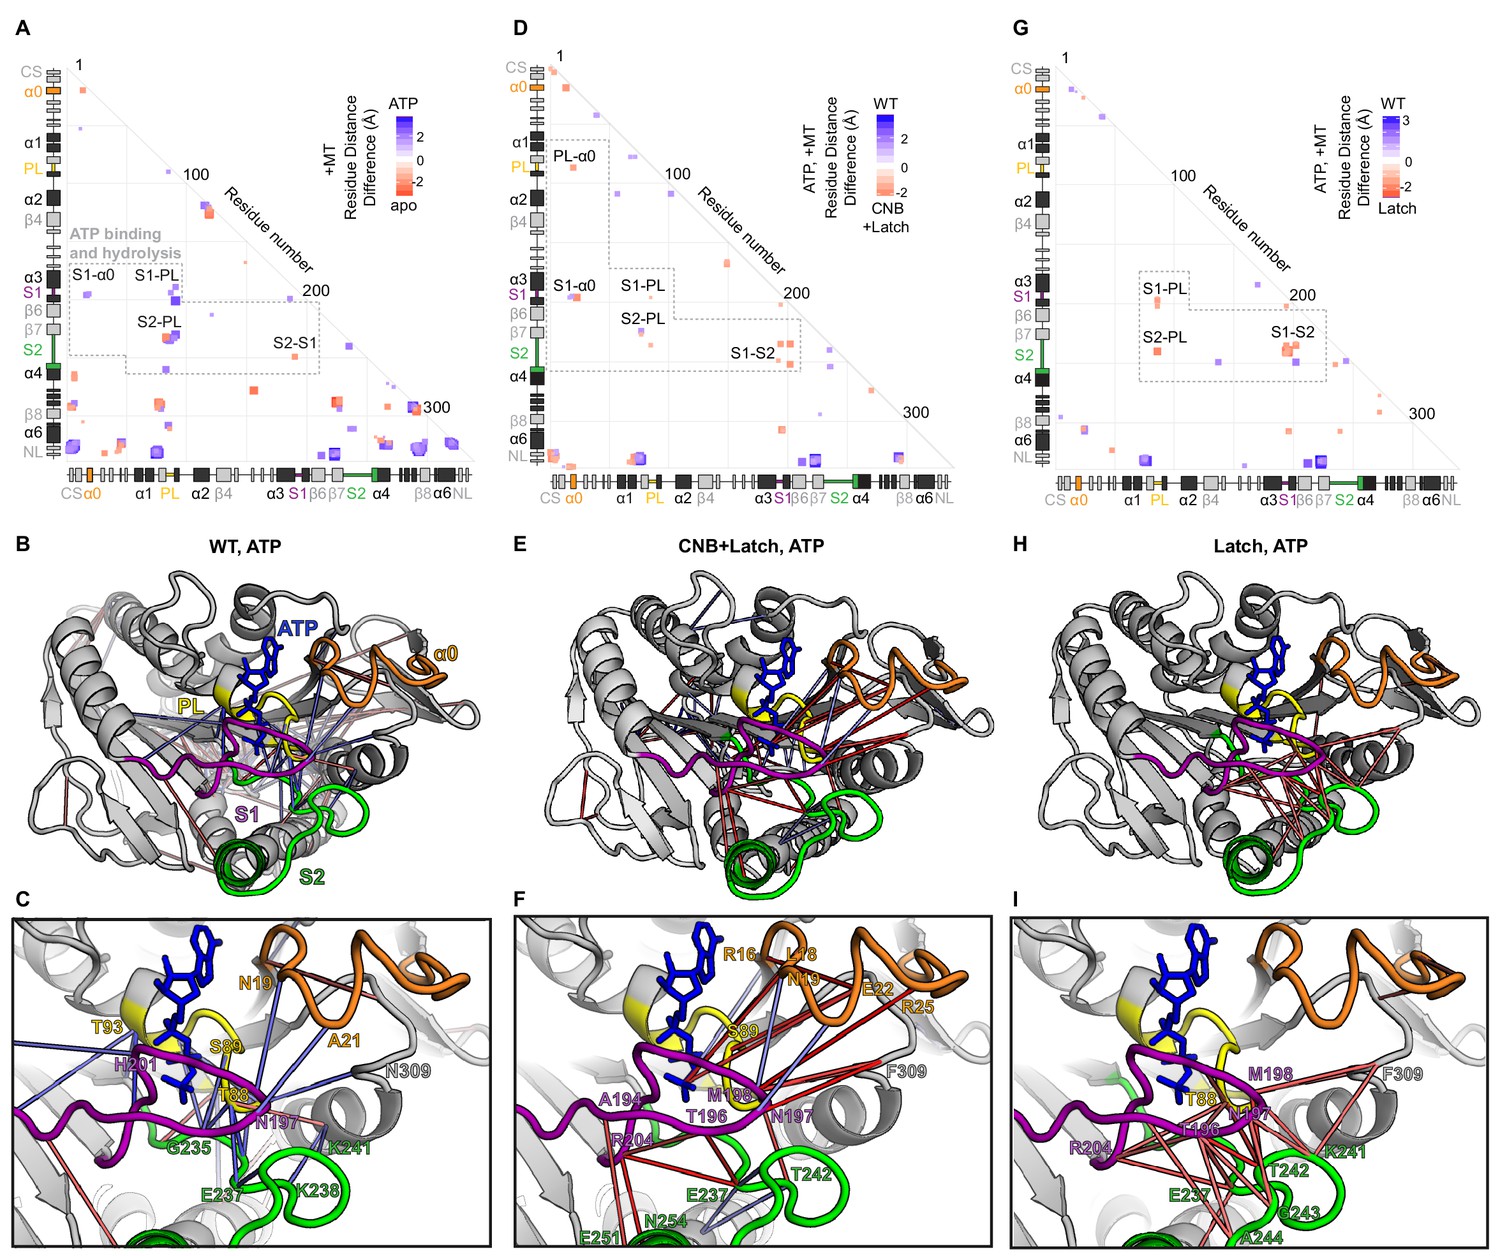
Interactions between nucleotide coordinating elements (P Loop, Switch 1, Switch 2, and α0) in WT, CNB+Latch, and Latch mutant motors.
Differences in residue-residue distances based on MD simulations between (A–C) the nucleotide-free (apo) and ATP-bound states of WT kinesin-1 associated with tubulin, (D–F) WT and CNB+Latch mutants associated with tubulin in the ATP-bound state, and (G–I) WT and Latch mutants associated with tubulin in the ATP-bound state. (A,D,G) Summary of distance differences. The secondary structure elements are laid out along the x- and y-axes with α- helices in black, β-strands in grey, or colored according to Figure 5A. Distances that are significantly (p<0.05) shorter are indicated by the color of the boxes. The magnitude of the distance change is indicated by intensity; interactions between elements are labeled. (B,E,H) Ribbon representations of the kinesin-1 motor domain (PDB 4HNA) associated with tubulin in the ATP-bound state and (C,F,I) enlarged views of PL, S1, S2, and α0 interactions. Secondary structure elements are indicated by color, P-loop (PL, yellow), Switch 1 (S1, purple), and Switch 2 (S2, green), α0 (orange). (E,F) For the CNB+Latch mutant motor, enhanced interactions between S2-PL, S1-S2, α0-PL, and α0-S1 suggest enhanced nucleotide coordination and closure of the catalytic site. (H,I) For the Latch mutant motor, enhanced interactions between S1-PL, S2-PL, and S1-S2 suggest enhanced catalytic site closure.
Figure 6 with 2 supplements
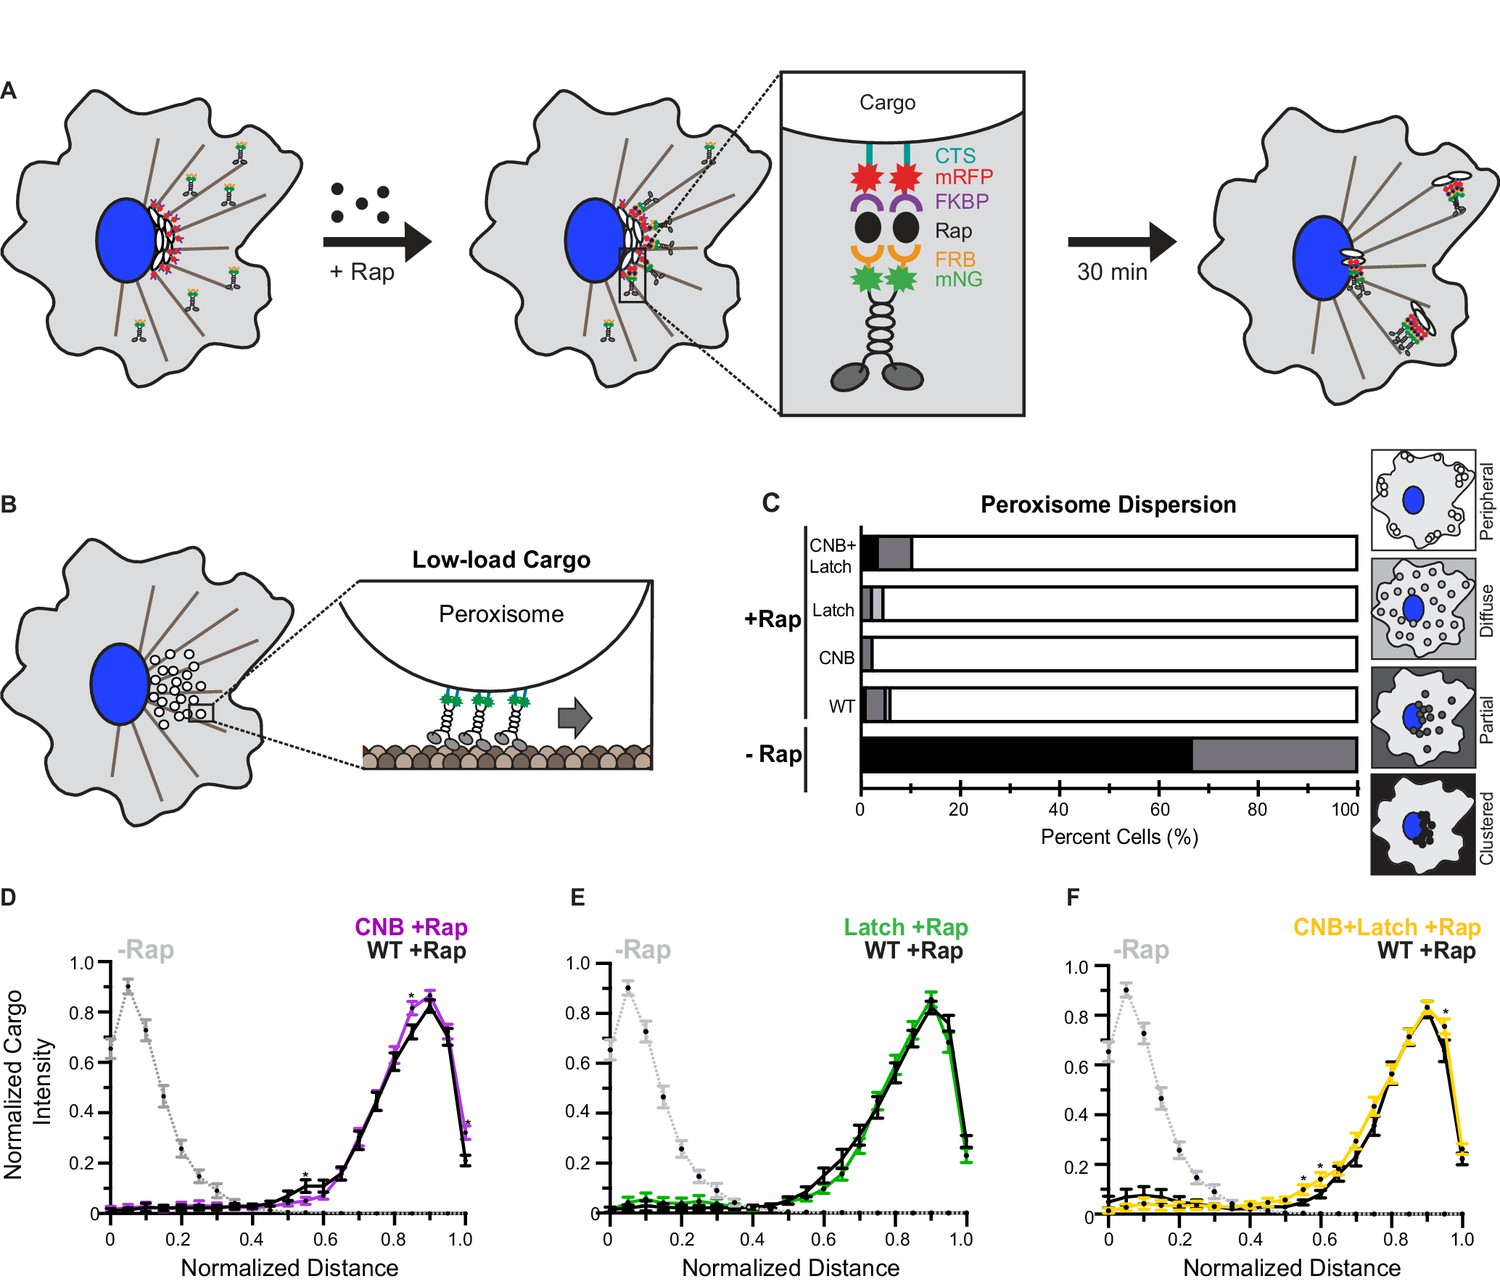
CNB and Latch mutations do not affect transport of peroxisomes (low-load cargo) by teams of kinesin-1 motors in cells.
(A) Schematic of the inducible motor recruitment assay. A kinesin motor tagged with monomeric NeonGreen (mNG) and an FRB domain (KIF5C-mNG-FRB) is coexpressed with a cargo targeting sequence (CTS) tagged with monomeric red fluorescent protein (mRFP) and FKBP domain (CTS-mRFP-FKBP) in COS7 cells. Addition of rapamycin (+Rap) causes heterodimerization of the FRB and FKBP domains and recruitment of motors to the cargo membrane. Recruitment of active motors drives cargo dispersion to the cell periphery. (B) Schematic of the inducible peroxisome dispersion assay. Peroxisomes are loosely clustered in the perinuclear region of COS7 cells and are largely immotile, thus providing a low-load cargo for transport by teams of recruited motors. (C) Qualitative analysis of peroxisome dispersion. Peroxisome localization in individual cells was scored as clustered (black), partially dispersed (dark grey), diffusely dispersed (light grey), or peripherally dispersed (white) 30 min after recruitment of teams of WT, CNB, Latch, or CNB+Latch motors. The data for each construct is summarized as a stacked bar plot. For each construct, N ≥ 50 cells were analyzed across three separate experiments. Representative images of peroxisome dispersion by teams of WT or mutant motors are in Figure 6—figure supplement 1. (D–F) Quantitative analysis of peroxisome dispersion. A radial profile of peroxisome intensity was generated for each cell and the data for each condition was converted to an averaged and normalized distance distribution across all cells. Each data point indicates the mean normalized cargo intensity ± SEM for N ≥ 50 cells across three separate trials. Gray dotted line: WT -Rap; Black line: WT +Rap; Purple line: CNB +Rap; Green line: Latch +Rap; Yellow line: CNB+Latch +Rap. Statistically significant differences in peroxisome localization comparing the mean normalized cargo intensity of the mutant motors to the wild type at any binned distance was determined; *, p<0.05. Detailed method of quantitative analysis of cargo dispersion is illustrated in Figure 6—figure supplement 2.
Figure 6—figure supplement 1
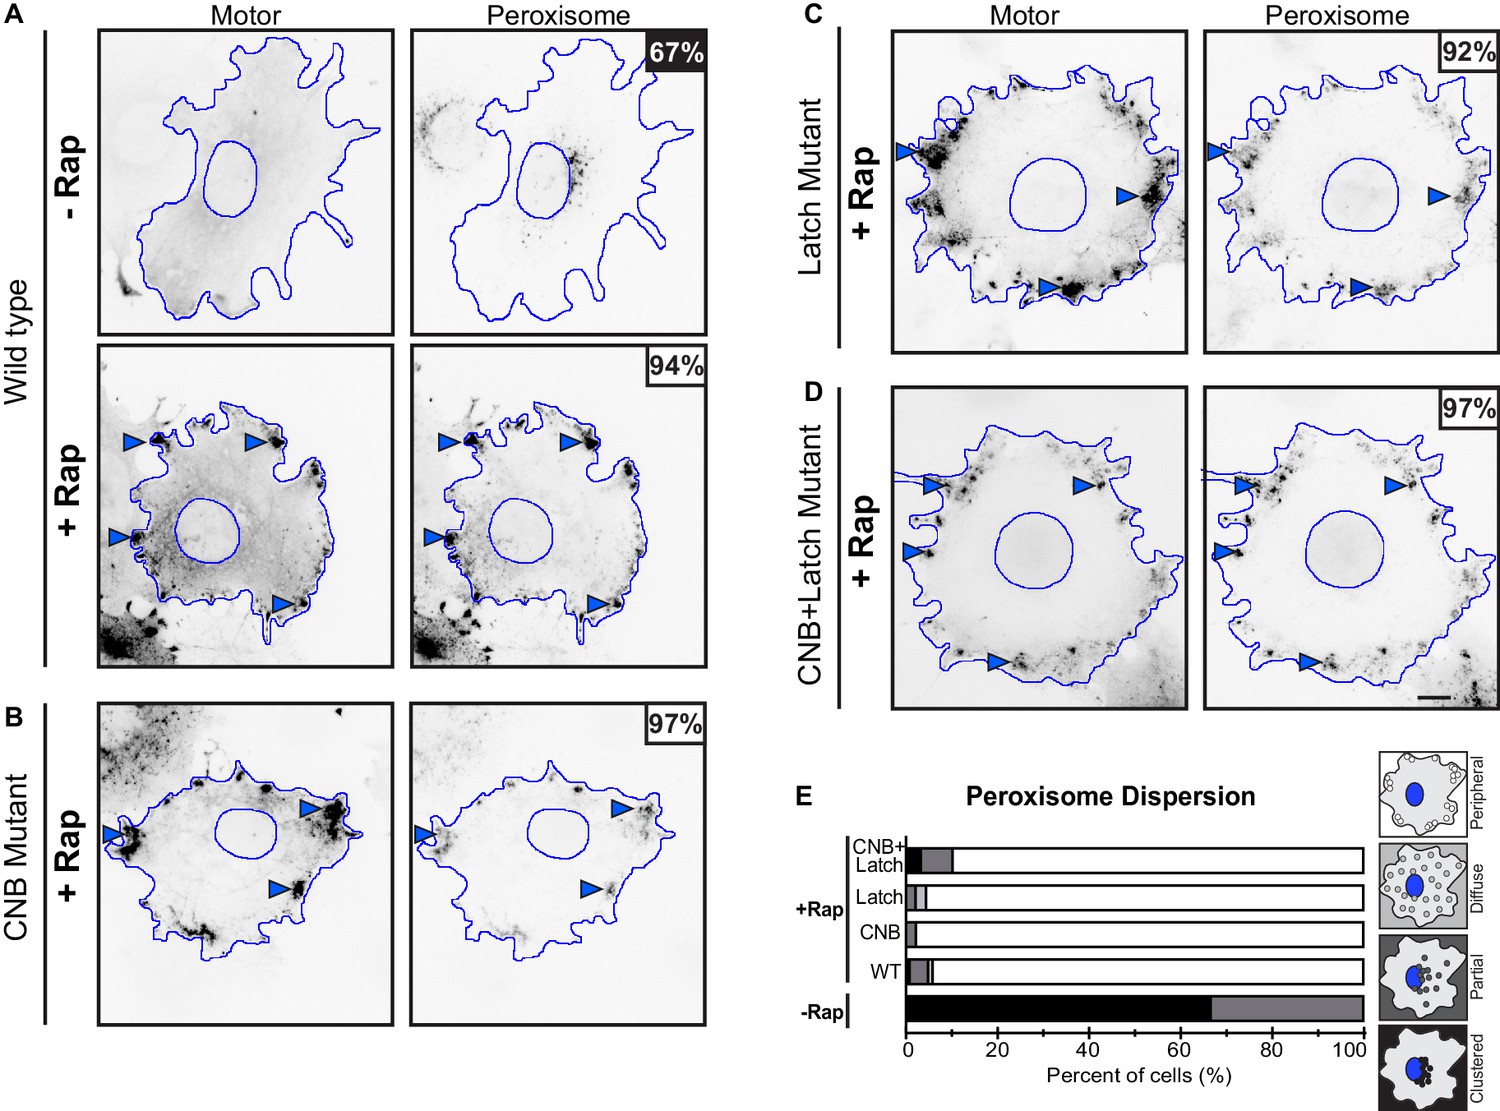
Peroxisome dispersion (low-load cargo) by teams of WT or CNB and/or NL docking mutant motors.
(A–D) Representative images of peroxisome dispersion before (-Rap) and after (+Rap) motor recruitment to the peroxisome surface. Blue lines indicate the nucleus and periphery of each cell. Blue arrowheads indicate redistribution of peroxisomes after addition of rapamycin (+Rap), bar 10 μm. Percentages in the upper corner indicate the percent of cells with the indicated dispersion phenotype: black: clustered peroxisomes; dark gray: partially dispersed peroxisomes; light gray: diffusely dispersed peroxisomes; white: peripherally dispersed peroxisomes. (E) Qualitative analysis of peroxisome dispersion. Cells were scored as clustered (black), partially dispersed (dark grey), diffusely dispersed (light grey), or peripherally dispersed (white) for N ≥ 50 cells for each construct across at least three trials. The data for each construct are summarized as a stacked bar plot.
Figure 6—figure supplement 2
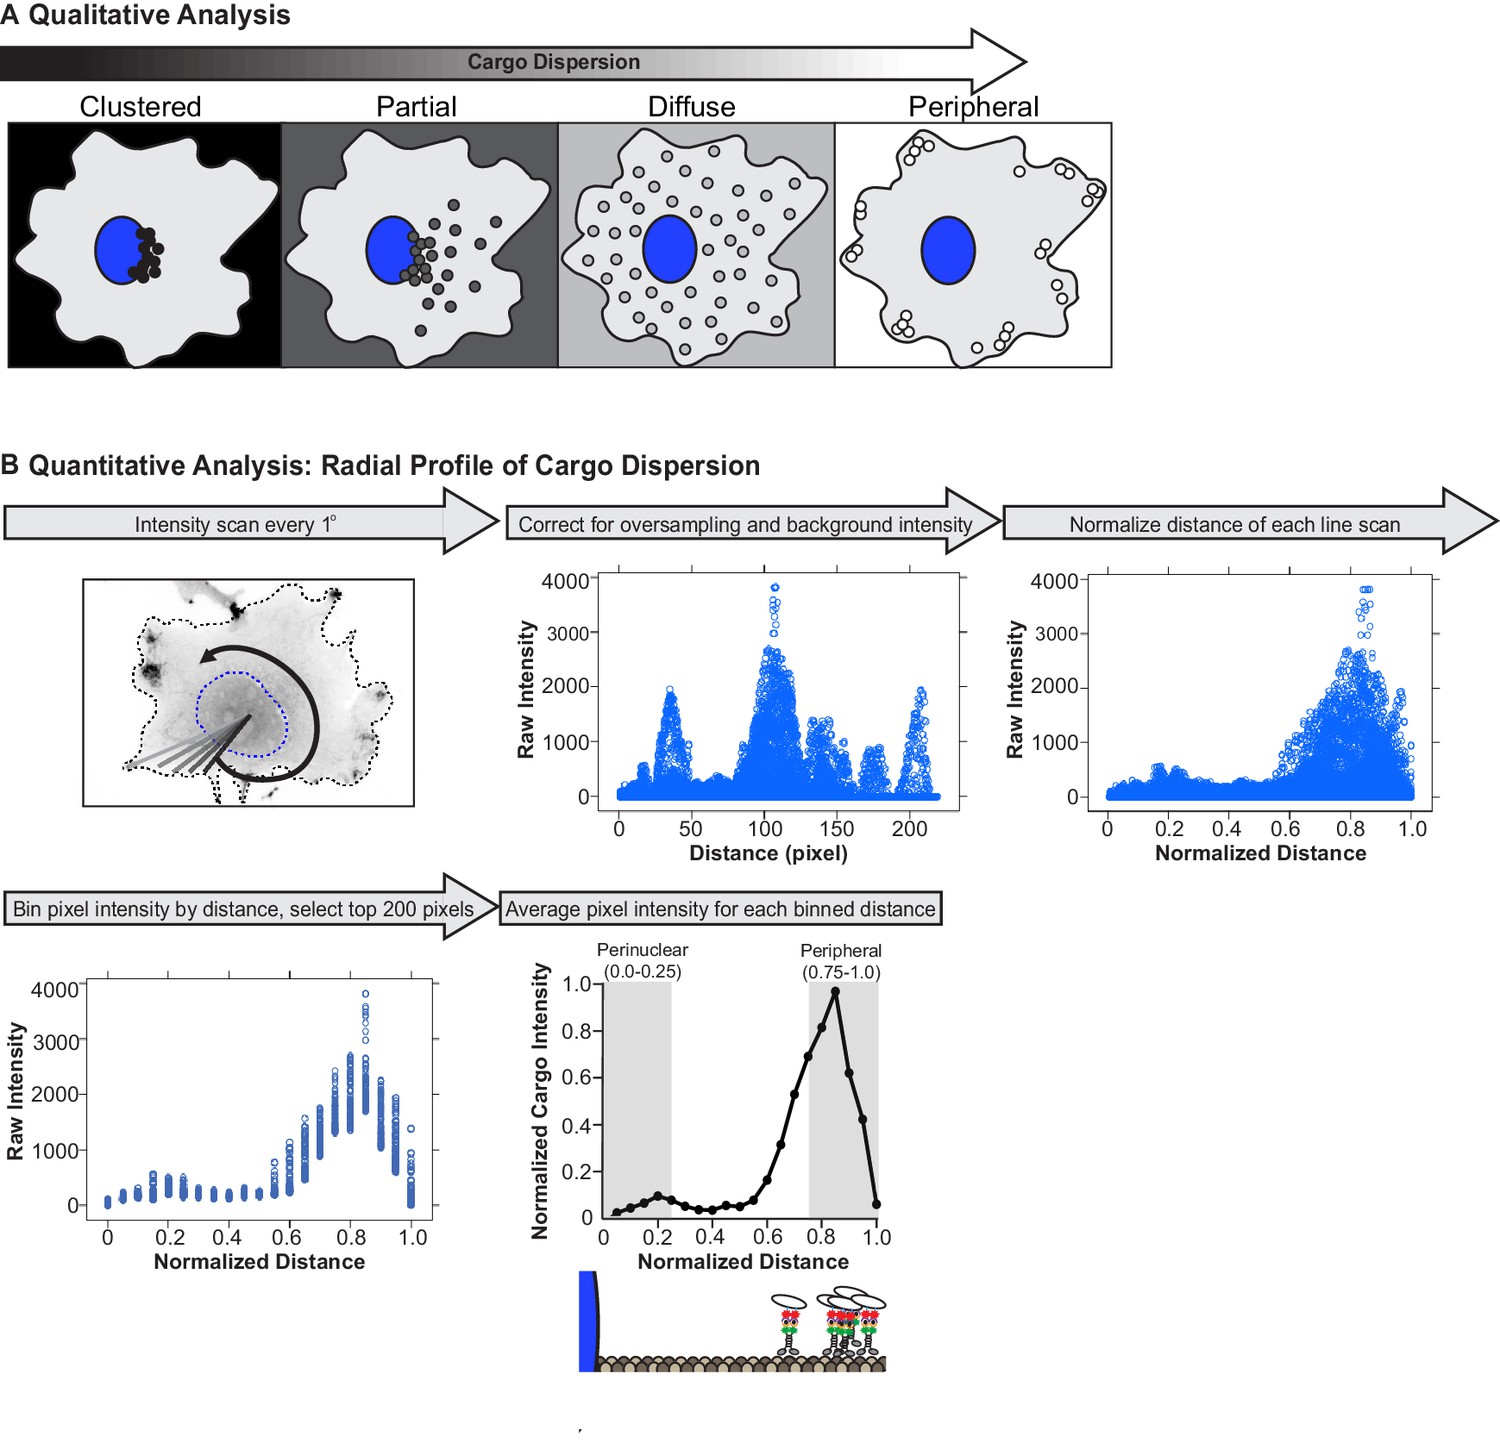
Analysis of cargo dispersion in cells.
(A) Qualitative analysis of cargo dispersion. Cargo localization was scored as: black: clustered (cargo is tightly clustered near the nucleus of the cell); dark gray: partially dispersed (cargo is loosely clustered, majority of the cargo remains near nucleus, but some cargo has been redistributed closer to the cell periphery); light gray: diffusely dispersed (cargo is dispersed diffusely throughout the cell with minimal cargo remaining in the perinuclear region); or white: peripherally dispersed (cargo is no longer clustered in the perinuclear region of the cell but instead accumulated at the cell periphery). (B) Quantitative analysis of cargo dispersion. To quantify cargo localization in a cell, (1) a custom ImageJ plugin generates a line scan from the centroid of the nucleus to the periphery of the cell; this is repeated every one degree for a total of 360 line scans around the cell. The fluorescence intensity along each line scan is determined. (2) For background subtraction, a line scan starting from the centroid of the nucleus to the cell periphery is generated in a region of the cell that lacks cargo and is subtracted from each line scan (scaled background subtraction). Distances that correspond to regions inside the nucleus are removed from each line scan, such that point 0 corresponds to the edge of the nuclear membrane. Oversampling of pixels in the center of the cell was corrected, following the assumption that the cell is a perfect circle. (3) The total distance of each line scan was normalized to itself, such that the distance of each line scan was between 0 (nuclear membrane) and 1 (cell periphery). (4) Pixel intensities were grouped in bins by distance (width, 0.05) and only the top 200 pixels within each bin were included in further analysis. (5) Pixel intensity was averaged for each binned distance to generate a dispersion profile for the cell. Dispersion profiles of all cells were averaged and plotted as mean ± SEM for each normalized distance bin. Cargo intensity in 0.0–0.25 normalized distance bins is in the perinuclear region of the cell while cargo intensity in 0.75–1.0 normalized distance bins is at the periphery of the cell.
Figure 7 with 3 supplements
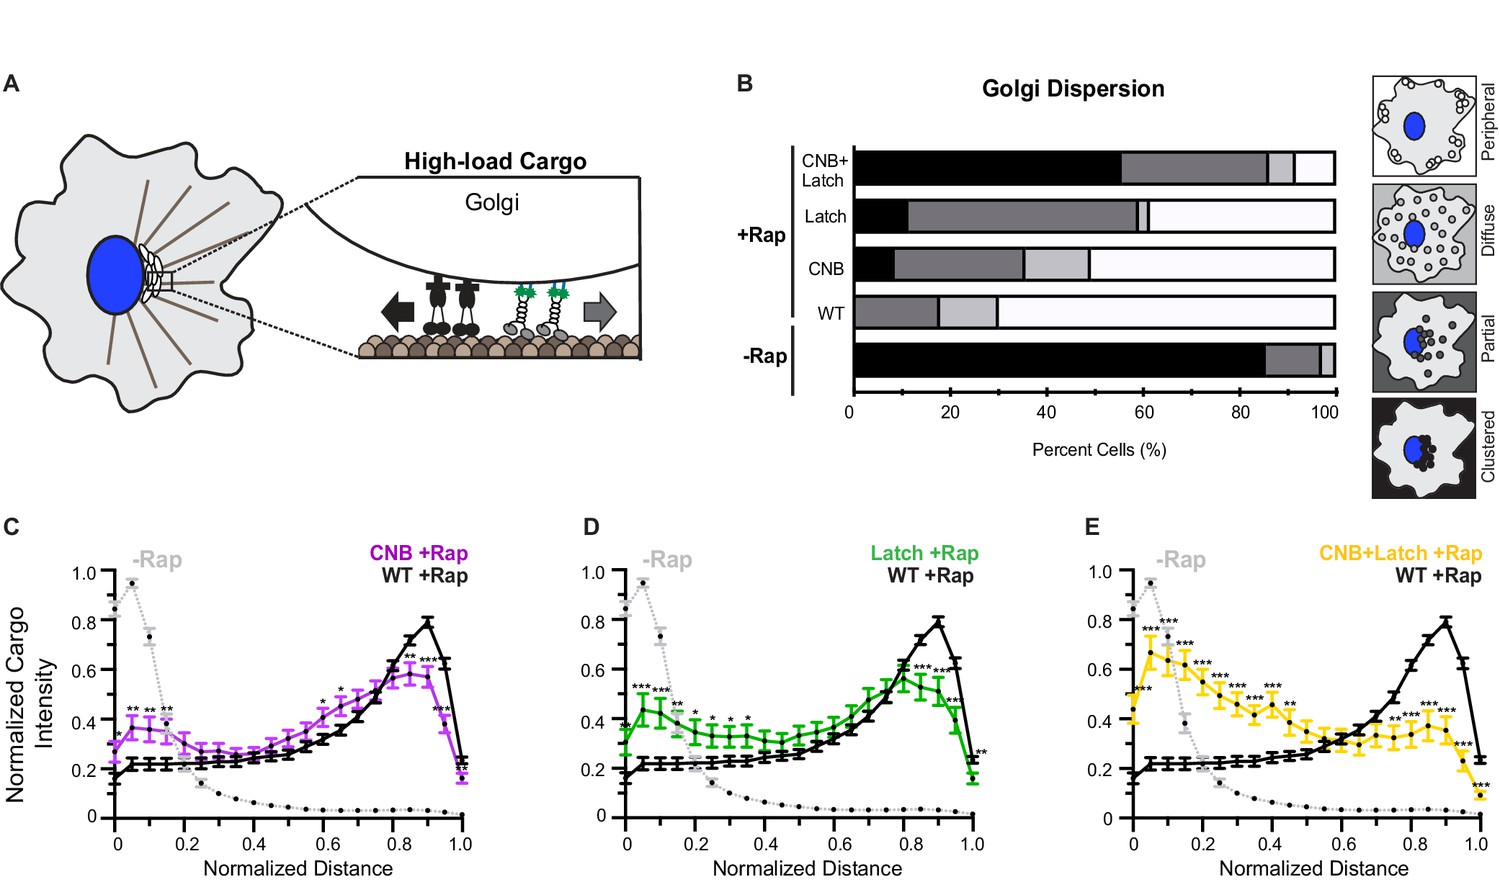
CNB and NL docking mutations impair transport of Golgi elements (high-load cargo) by teams of kinesin-1 motors in cells.
(A) Schematic of inducible Golgi dispersion assay. A variety of mechanisms, including the action of cytoplasmic dynein motors (black), maintain the Golgi in a compact cluster near the nucleus. Thus, the Golgi is a high-load cargo for transport by teams of recruited team of kinesin motors. The ability of low force generating kinesin-8 motor to drive peroxisome and Golgi dispersion is shown in Figure 7—figure supplement 1. Representative images of Golgi dispersion be teams of WT, CNB, Latch, and CNB+Latch motors is shown in Figure 7—figure supplement 2. The ability of kinesin motors to drive Golgi dispersion after interfering with the function of endogenous dynein motors is shown in Figure 7—figure supplement 3. (B) Qualitative analysis of Golgi dispersion. COS7 cells were co-transfected with plasmids encoding for the expression of WT or mutant KIF5C-mNG-FRB motors together with the Golgi-targeting GMAP210p-mFRP-FKBP fusion protein. Motor recruitment was induced by addition of rapamycin (+Rap) and cells were fixed after 30 min and stained with an antibody to the Golgi marker giantin. Golgi localization in individual cells was scored as clustered (black), partially dispersed (dark grey), diffusely dispersed (light grey), or peripherally dispersed (white) after recruitment of teams of WT, CNB, Latch, or CNB+Latch motors. For each construct, N ≥ 30 cells were analyzed across three separate experiments. The results for each construct are summarized as a stacked bar plot. (C–E) Quantitative analysis of Golgi dispersion. A radial profile of Golgi intensity was generated for each cell and the data for each condition were converted to an averaged and normalized distance distribution across all cells. Each data point indicates the mean normalized cargo intensity ± SEM for N ≥ 30 cells across three separate experiments. Gray line: WT -Rap; Black line: WT +Rap; Purple line: CNB +Rap; Green line: Latch +Rap; Yellow line: CNB+Latch + Rap. Significant differences in mean normalized cargo intensity after recruitment of mutant motors as compared to WT motors are indicated for each distance; *, p<0.05; **, p<0.01; ***, p<0.001.
Figure 7—figure supplement 1
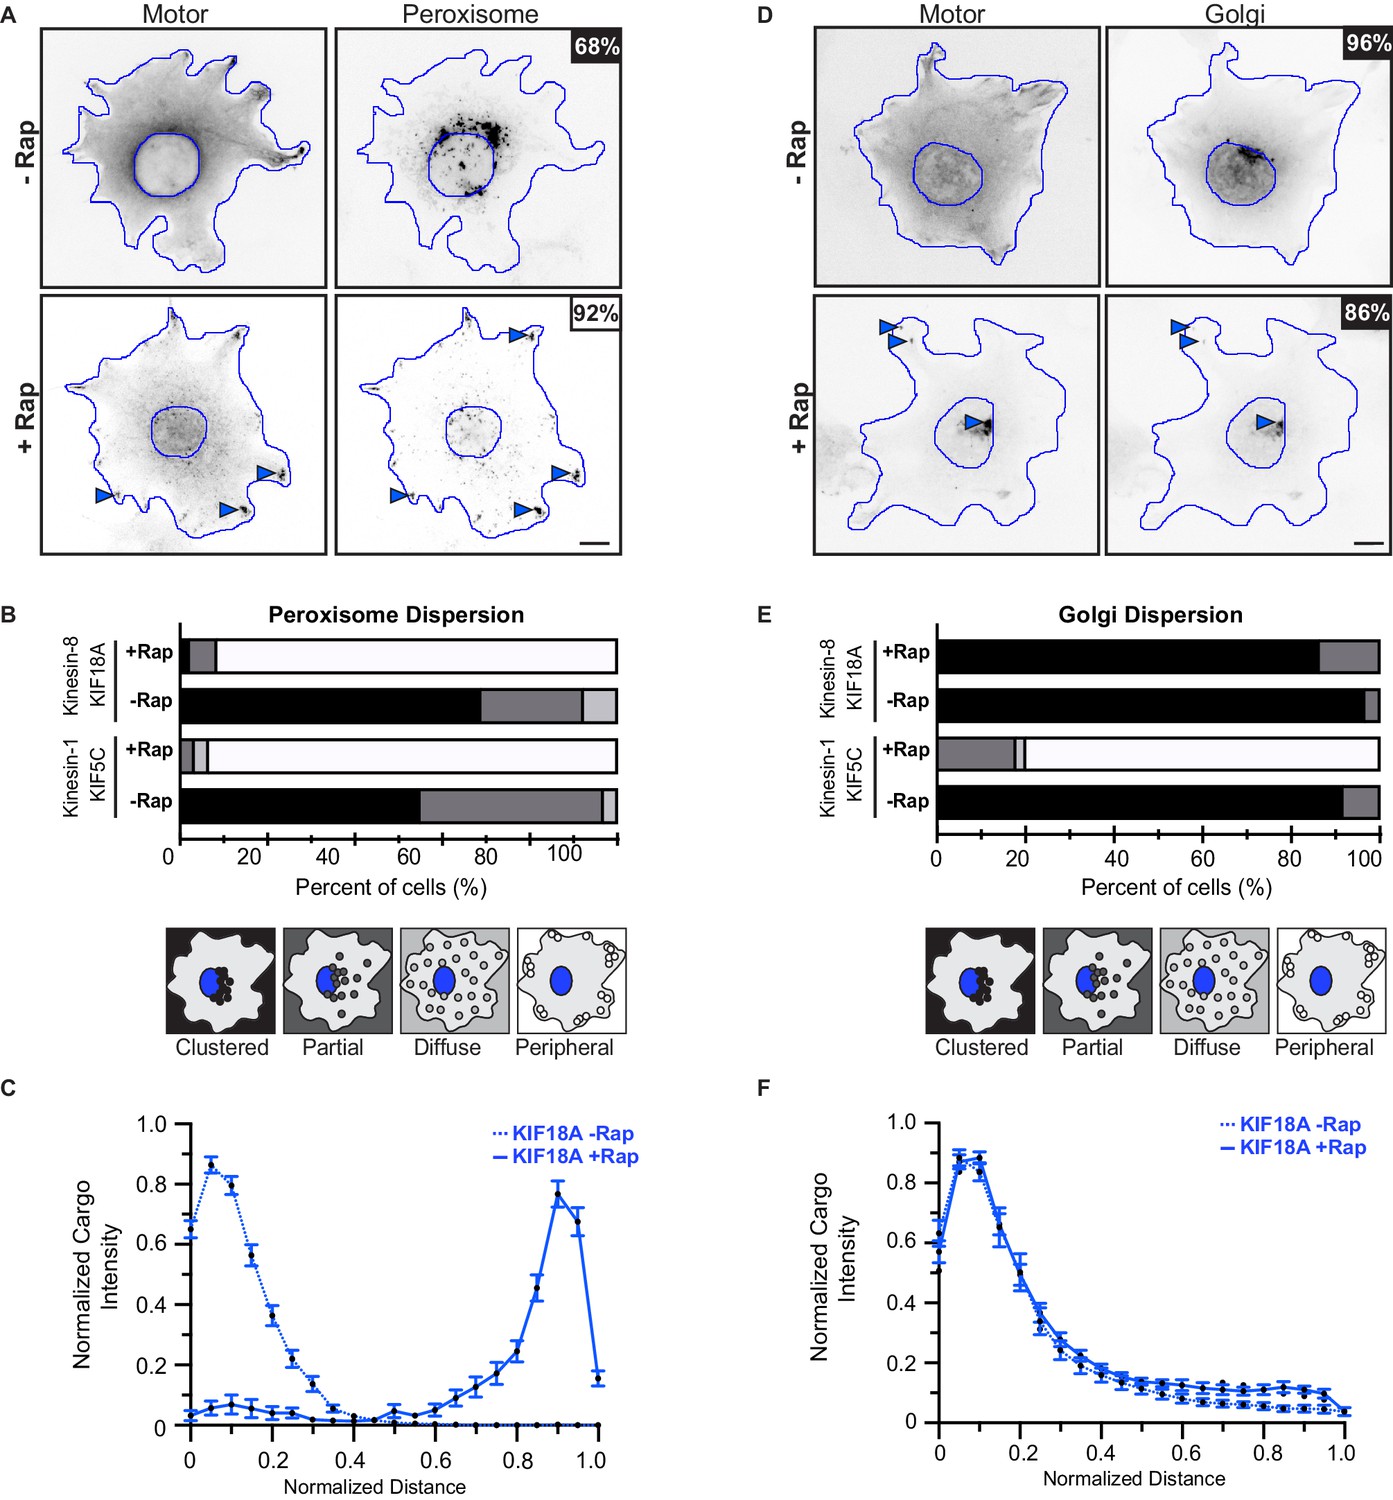
Validation of peroxisome and Golgi as low- and high-load cargoes, respectively.
(A,D) Representative images of (A) peroxisome dispersion or (D) Golgi dispersion before (-Rap) and after (+Rap) recruitment of teams of KIF18A motors. (A) COS7 cells were cotransfected with plasmids encoding for the expression of KIF18A-mNG-FRB and peroxisome targeting PEX3-mFRP-FKBP fusion proteins. (D) COS7 cells were cotransfected with plasmids encoding for the expression of KIF18A-mNG-FRB and the Golgi-targeting GMAP201p-mRFP-FKBP fusion proteins. Blue lines indicate the nucleus and periphery of each cell. Blue arrowheads indicate peroxisomes dispersed after addition of rapamycin (+Rap), bar 10 μm. Percentages in the upper corner indicate the percent of cells with the indicated dispersion phenotype: Black: clustered; Dark gray: partially dispersed; Light gray: diffusely dispersed; White: peripherally dispersed. (B,E) Qualitative analysis of (B) peroxisome or (E) Golgi dispersion. Cells were scored as clustered (black), partially dispersed (dark grey), diffusely dispersed (light grey), or peripherally dispersed (white) for N ≥ 40 cells for each construct across two experimental trials and results are summarized as a stacked bar plot. (C,F) Quantitative analysis of (C) peroxisome or (F) Golgi dispersion. A radial profile of peroxisome or Golgi intensity was generated for each cell and the data for each condition was converted to an averaged and normalized distance distribution across all cells. Each data point indicates the mean normalized cargo intensity ± SEM for N ≥ 40 cells across three separate trials. KIF18A, -Rap (dotted blue); KIF18A, +Rap (solid blue).
Figure 7—figure supplement 2

Golgi dispersion (high-load cargo) by teams of WT or NL docking mutant motors.
(A–D) Representative images of Golgi dispersion before (-Rap) and after (+Rap) recruitment of teams of motors to the Golgi surface. COS7 cells were cotransfected with plasmids encoding for the expression of (A) WT, (B) CNB, (C) Latch, or (D) CNB+Latch KIF5C-mNG-FRB motors and Golgi-targeting GMAP210p-mFRP-FKBP fusion proteins. Blue lines indicate the nucleus and periphery of each cell. Blue arrowheads indicate Golgi elements dispersed after addition of rapamycin (+Rap), bar 10 μm. Percentages in the upper corner indicate the percent of cells with the indicated dispersion phenotype: Black: clustered Golgi; Dark gray: partially dispersed Golgi; Light gray: diffusely dispersed Golgi; White: peripherally dispersed Golgi. (E) Qualitative analysis of Golgi dispersion. Cells were scored as clustered (black), partially dispersed (dark grey), diffusely dispersed (light grey), or peripherally dispersed (white) for N ≥ 30 cells for each construct across multiple trials. The data for each construct is summarized as a stacked bar plot.
Figure 7—figure supplement 3
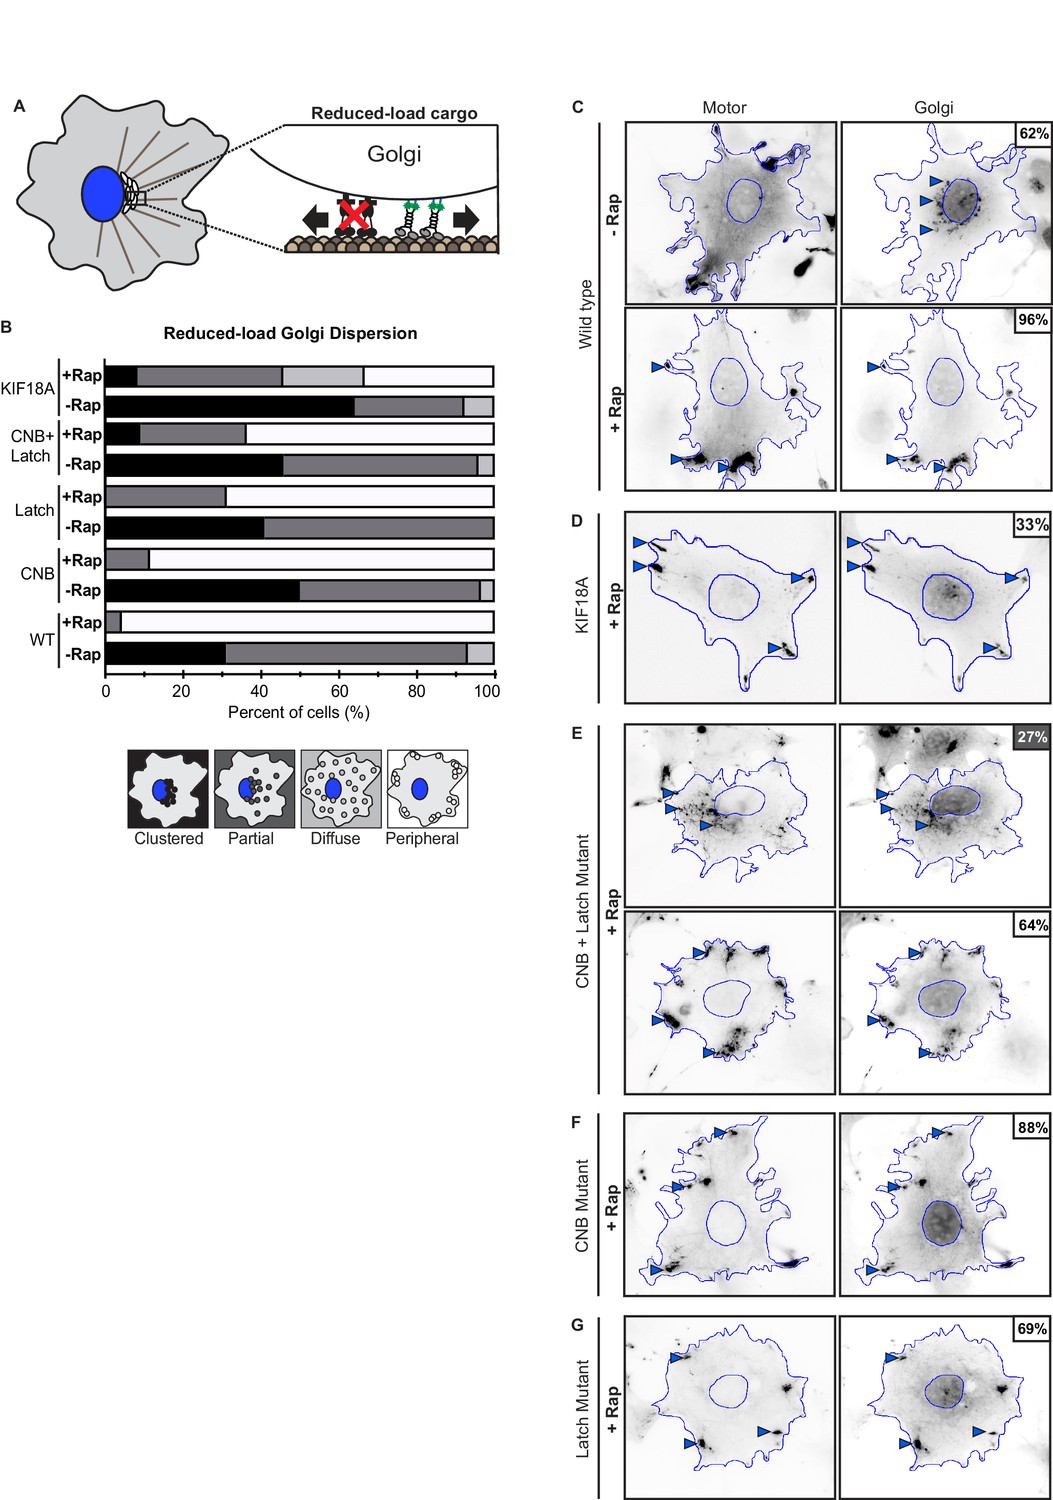
Kinesin-1 CNB and/or Latch mutants can drive transport of reduced-load Golgi elements.
(A) Schematic of Golgi dispersion assay with reduced-load. A truncated dynein intermediate chain (IC2), which acts as a dominant negative (DN) for dynein function, was expressed to interfere with dynein association with Golgi elements. In cells expressing the dynein DN, Golgi elements are a reduced-load for recruited kinesin-1 motors. (B–F) Representative images of reduced-load Golgi dispersion (in cells expressing dynein DN) before (-Rap) or after (+Rap) recruitment of teams of kinesin motors to the Golgi surface. COS7 cells were cotransfected with plasmids encoding for the expression of mNG-FRB tagged motors, Golgi targeting GMAP201p-mRFP-FKBP, and dynein DN IC2 (IC2-N237-BFP) fusion proteins. Cells were selected and Golgi dispersion scored in cells expressing high levels of dynein DN IC2. Blue lines indicate the nucleus and periphery of each cell. Blue arrowheads indicate Golgi elements dispersed after addition of rapamycin (+Rap), bar 10 μm. Percentages in the upper corner indicate the percent of cells with the indicated dispersion phenotype: Black: clustered Golgi; Dark gray: partially dispersed Golgi; Light gray: diffusely dispersed Golgi; White: peripherally dispersed Golgi. (G) Qualitative analysis of Golgi dispersion. Cells were scored as clustered (black), partially dispersed (dark grey), diffusely dispersed (light grey), or peripherally dispersed (white) before (- Rap) or after (+Rap) recruitment of teams of kinesin motors. N ≥ 16 cells for each construct across two trials. The results for each construct are summarized as a stacked bar plot.
Videos
Video 1
NL docking in WT kinesin-1.
Representative simulation of WT kinesin-1 KIF5C motor domain in the ATP-bound, post-power stroke state. The N-terminal half of the NL (β9) and the N-latch residue N334 (shown as a sphere) are docked along the core motor domain and the C-terminal half of the NL (β10) is dynamic. Secondary structure elements are colored as: coverstrand (CS, purple), α1 (dark green), β7 (yellow), Loop13 (L13, orange), β8 (teal), neck liker (NL: β9 and β10, light green), with α-tubulin (blue) and β-tubulin (light blue).
Video 2
NL undocking in the Latch mutant.
Representative simulation of the Latch mutant motor domain in the ATP-bound state. The C-terminal half of the NL (N-latch residue N334 and β10) undock followed by complete undocking of the NL. Secondary structure elements are colored as: coverstrand (CS, purple), α1 (dark green), β7 (yellow), Loop13 (L13, orange), β8 (teal), neck liker (NL: β9 and β10, light green), with α-tubulin (blue) and β-tubulin (light blue). The changes in residue-residue distances in the Latch mutant compared to the WT are listed in Supplementary file 2.
Video 3
NL undocking and disruption of CNB in CNB+Latch mutant.
Representative simulation of CNB+Latch mutant motor domain in the ATP-bound state. The C-terminal half of the NL (N-latch residue N334 and β10) undocks from the core motor domain followed by disruption of the CNB. Secondary structure elements are colored as: coverstrand (CS, purple), α1 (dark green), β7 (yellow), Loop13 (L13, orange), β8 (teal), neck liker (NL: β9 and β10, light green), with α-tubulin (blue) and β-tubulin (light blue). The changes in residue-residue distances in the CNB+Latch mutant compared to the WT are listed in Supplementary file 3.
Tables
Key resources table
| Reagent type | Designation | Source or reference | Identifiers | Additional information |
|---|---|---|---|---|
| Cell line | COS-7 (Cercopithecus aethiops) male | AATC | Cat. #: CRL-1651, RRID: CVCL_0224 | |
| Transfected construct | KIF5C(1-560) -mNG-FRB | (Schimert et al., 2019) PMID: 30850543 | ||
| Transfected construct | PEX3-mRFP-FKBP | (Kapitein et al., 2010) PMID: 20923648 | ||
| Transfected construct | GMAP-mRFP-FKBP | (Engelke et al., 2016) PMID: 27045608 | ||
| Transfected construct | dyneinIC2-N237 | (King et al., 2003) PMID: 14565986 | ||
| Transfected construct | KIF18A(1-452) | (Weaver et al., 2011) PMID: 21885282 | ||
| Antibody | cis-Golgi marker giantin | BioLegend | Cat. #: 924302 RRID: AB_2565451 | IF(1:1200) |
| Antibody | β-tubulin | Developmental Studies Hybridoma Bank | Cat. #: E7, RRID: AB_528499 | IF(1:2000) |
| Antibody | goat anti-rabbit Alexa680 | Jackson Immuno Research Labs | Cat. #: 111-625-144, RRID: AB_2338085 | IF(1:500) |
| Antibody | goat anti-mouse Alexa350 | Molecular Probes | Cat. #: A-11045, RRID: AB_142754 | IF(1:500) |
| Drug | rapamycin | Calbiochem, Millipore Sigam | Cat. #: 553210 | |
| Software | GraphPad Prism | GraphPad Software Inc | RRID: SCR_002798 | Version 7.0 c |
| Software | MATLAB, code used for single molecule analysis | MathWorks | RRID: SCR_001622 | R2016b, PMID: 25365993 |
| Software | Origin 2017 | OriginLab | RRID: SCR_014212 | |
| Software | RStudio, code used for quantitative dispersion analysis | Rstudio | RRID: SCR_000432 | Version 3.4.1, manuscript in preparation |
| Software | ImageJ | NIH | RRID: SCR_003070 | |
| Software | PyMOL | PyMOL Molecular Graphics System, Schrödinger | RRID: SCR_000304 | Version 2.2.0 |
| Software | MODELLER | PMID: 8254673 | RRID: SCR_0083595 | Version 9.18 |
| Software | AMBER 14 Package | PMID: 16200636 | RRID: SCR_014230 |
Additional files
-
Supplementary file 1
List of residue-residue distances for WT KIF5C in the apo versus ATP-bound states.
Differences in residue-residue distances based on MD simulations of tubulin-bound motors in the ATP-bound, post power stroke state.
- https://doi.org/10.7554/eLife.44146.022
-
Supplementary file 2
List of residue-residue distances for WT versus Latch mutant motors in the tubulin- and ATP-bound states.
Differences in residue-residue distances are based on MD simulations of tubulin-bound motors in the ATP-bound, post power stroke state.
- https://doi.org/10.7554/eLife.44146.023
-
Supplementary file 3
List of residue-residue distances for WT versus CNB+Latch mutant motors in the tubulin- and ATP-bound states.
Differences in residue-residue distances are based on MD simulations of tubulin-bound motors in the ATP-bound, post power stroke state.
- https://doi.org/10.7554/eLife.44146.024
-
Supplementary file 4
List of structures used for PCA analysis.
- https://doi.org/10.7554/eLife.44146.025
-
Transparent reporting form
- https://doi.org/10.7554/eLife.44146.026
Download links
A two-part list of links to download the article, or parts of the article, in various formats.
Downloads (link to download the article as PDF)
Open citations (links to open the citations from this article in various online reference manager services)
Cite this article (links to download the citations from this article in formats compatible with various reference manager tools)
Neck linker docking is critical for Kinesin-1 force generation in cells but at a cost to motor speed and processivity
eLife 8:e44146.
https://doi.org/10.7554/eLife.44146


