PAX8 regulon in human ovarian cancer links lineage dependency with epigenetic vulnerability to HDAC inhibitors
- School of Medicine, Shanghai Jiao Tong University, China
- Shanghai Jiao Tong University, China
- GenenDesign Co. Ltd, China
Figures
Figure 1 with 5 supplements

COPA identifies a lineage-specific PAX8 regulon in ovarian cancer.
(A) TumorMap analysis visualizing RNAseq-based transcriptional compendium of human cancer cell lines. Each dot in the map represented a cancer cell line. Colors indicated different tissues of origin. (B) The indicated putative lineage-survival oncogenes were overlaid to cancer cell lines in which they were identified as outlier genes. Note that they displayed enrichment in the previously reported tumor types. (C) Immunohistochemical staining of PAX8 in tissue microarrays containing 674 ovarian cancer cases. Left panel showed representative IHC images. Quantification in the right panel indicated that PAX8 was expressed in various histotypes of ovarian carcinomas, but not adjacent or normal tissues. (D) Confined gene expression of the PAX8 regulon in ovarian cancer cell lines. (E) Confined gene expression of the PAX8 regulon in TCGA ovarian tumor tissues. (F) Regulatory network of the PAX8 regulon as inferred by individually knocking out each member with CRISPR-Cas9 system and quantifying relative gene expression in ovarian cancer cells.
Figure 1—figure supplement 1
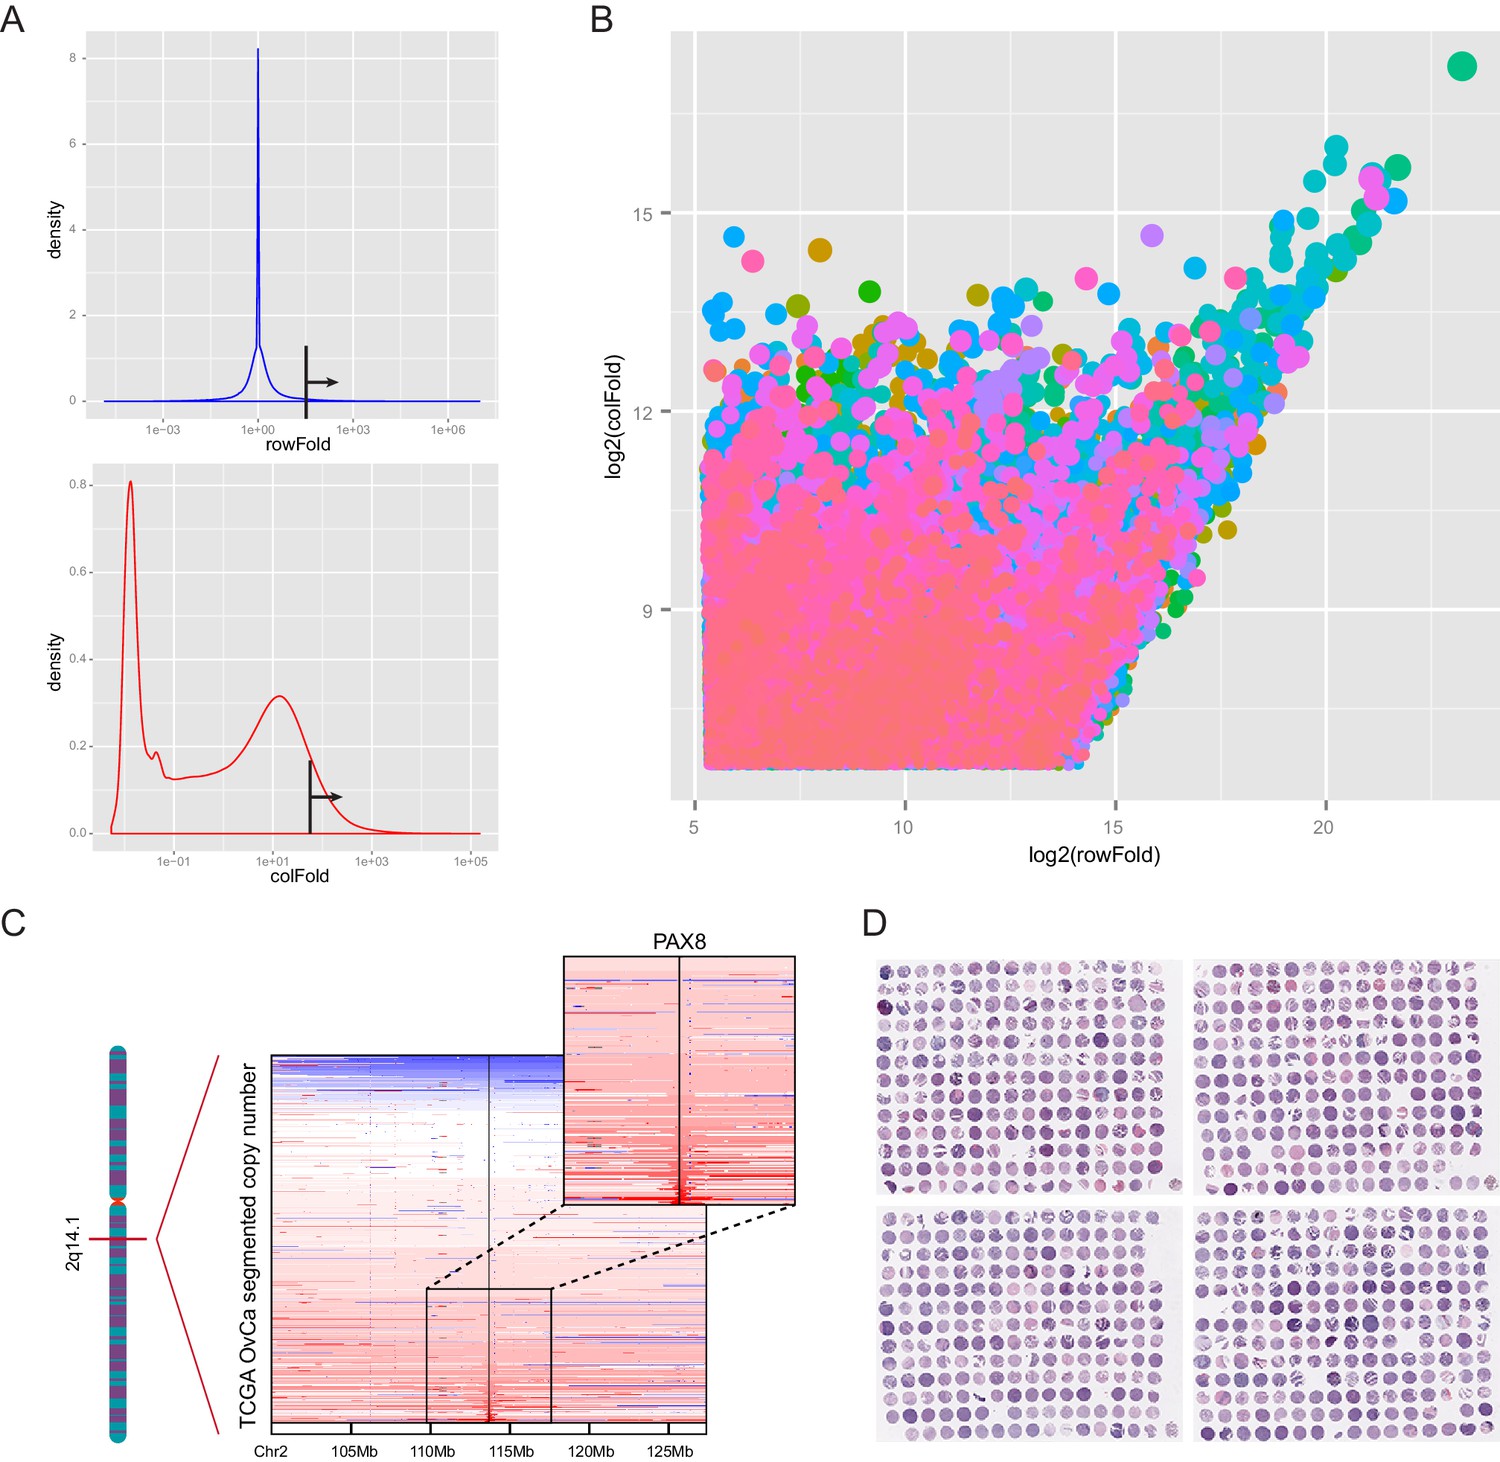
COPA identified PAX8 as an outlier gene in ovarian cancer.
(A) Thresholds (black lines) used for cancer outlier profile analysis. X and Y axes indicated the range and density of outlier scores, respectively. (B) Plot of nominated outlier genes across all cancer cell lines (sample-wise comparison) and among genome-wide mRNA measurements in a given sample (gene-wise comparison). Each color represented a different tissue of origin. (C) Focal amplification of PAX8 gene in a subset of TCGA ovarian carcinomas. (D) Hematoxylin and eosin (H and E) staining of tissue microarrays containing 674 epithelial ovarian cancer samples.
Figure 1—figure supplement 2
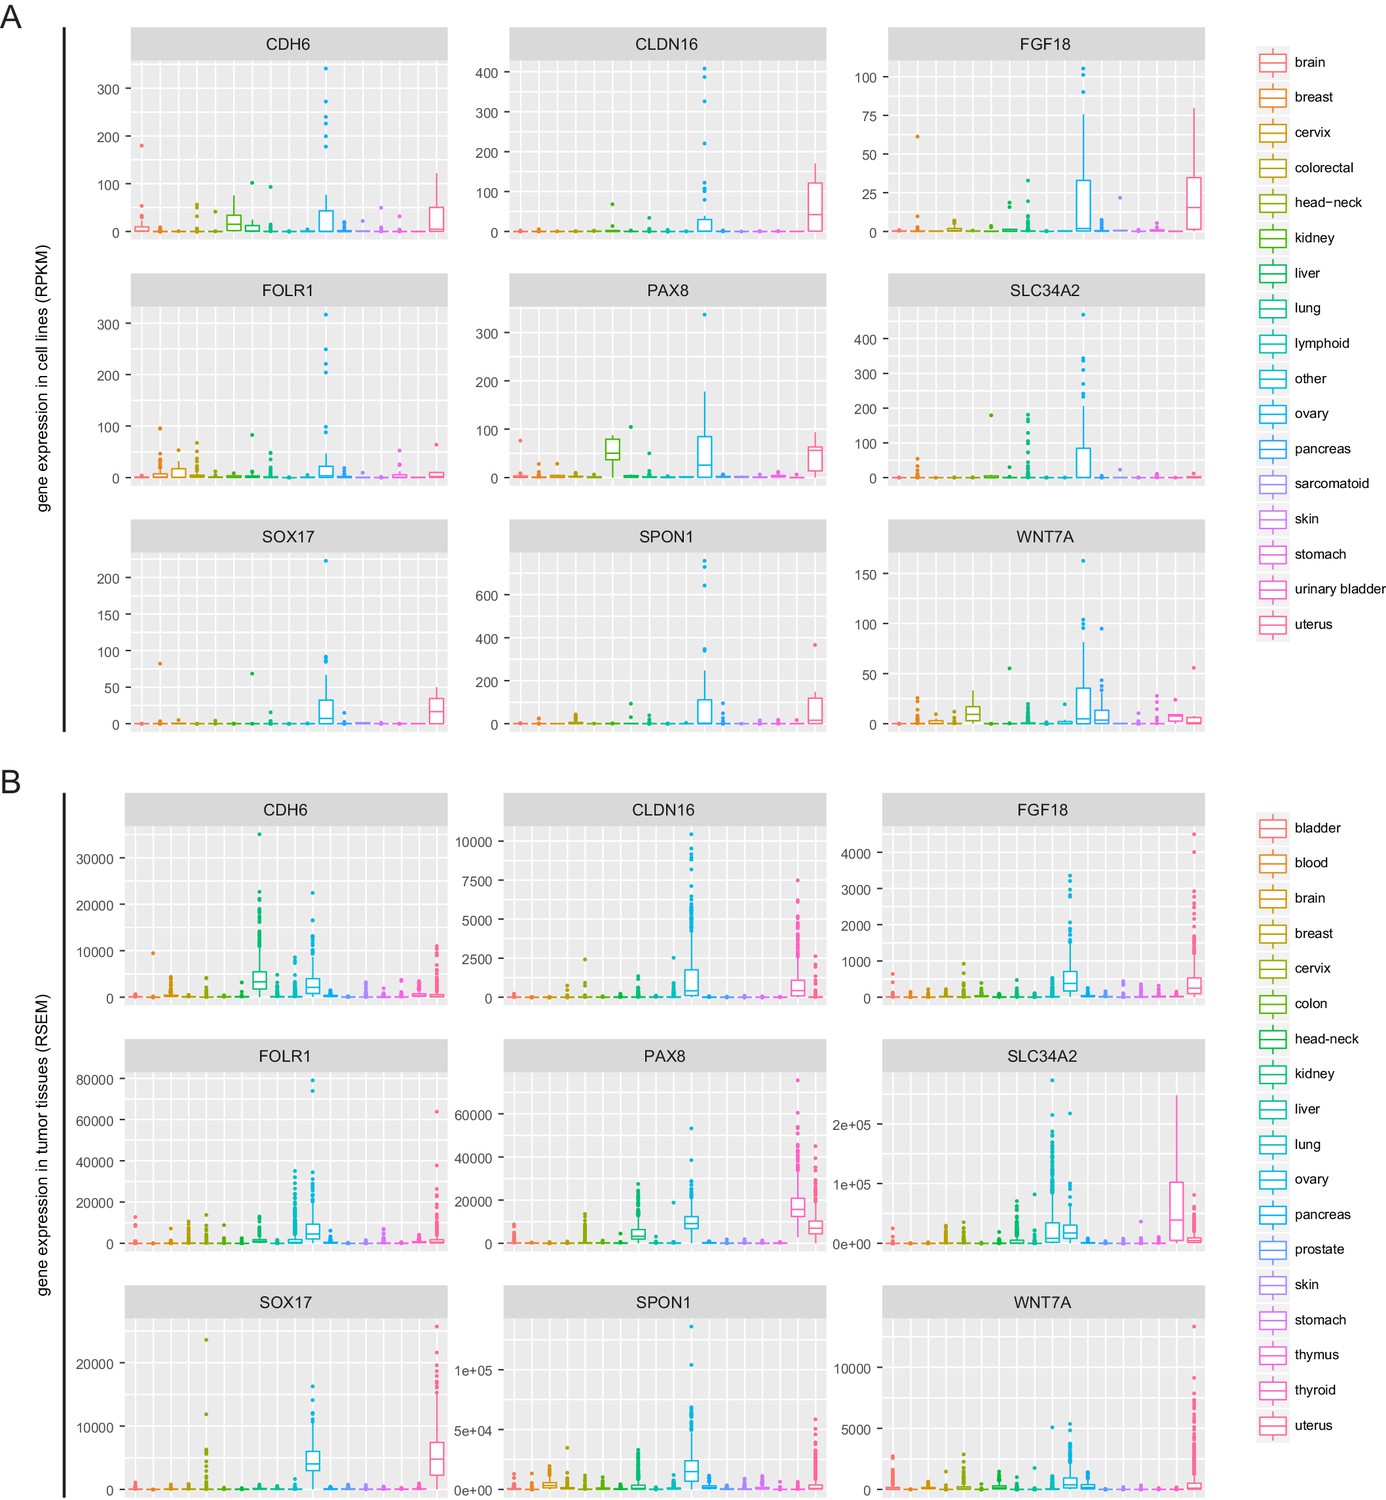
PAX8 regulon gene expression in cell lines and TCGA tumor tissues.
(A) Boxplots of PAX8 regulon gene expression in cancer cell lines. (B) Boxplots of PAX8 regulon gene expression in TCGA tumor tissues.
Figure 1—figure supplement 3
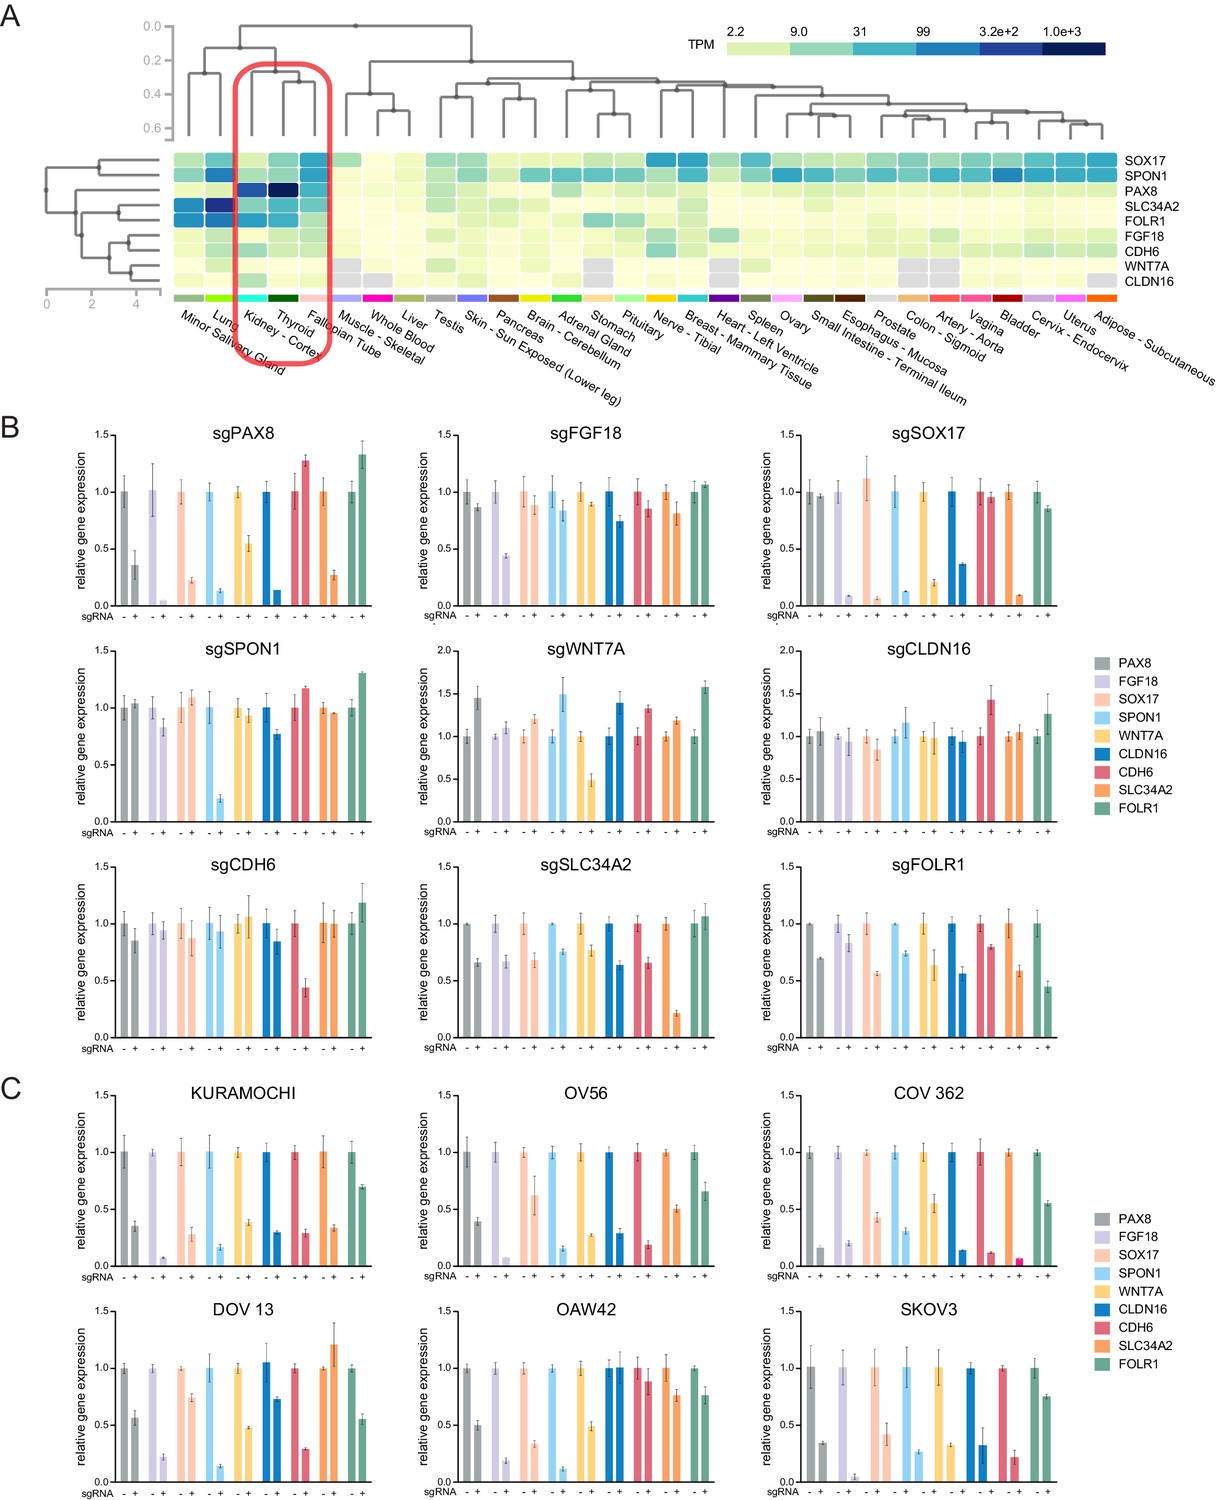
PAX8 regulon gene expression in normal tissues and relative expression of each PAX8 regulon upon knocking out the indicated genes.
(A) Hierarchical clustering of PAX8 regulon gene expression in normal human tissues. (B) Relative expression of each PAX8 regulon gene upon knocking out the indicated members. (C) Relative expression of each PAX8 regulon gene upon knocking out PAX8 in the indicated cell lines.
Figure 1—figure supplement 4
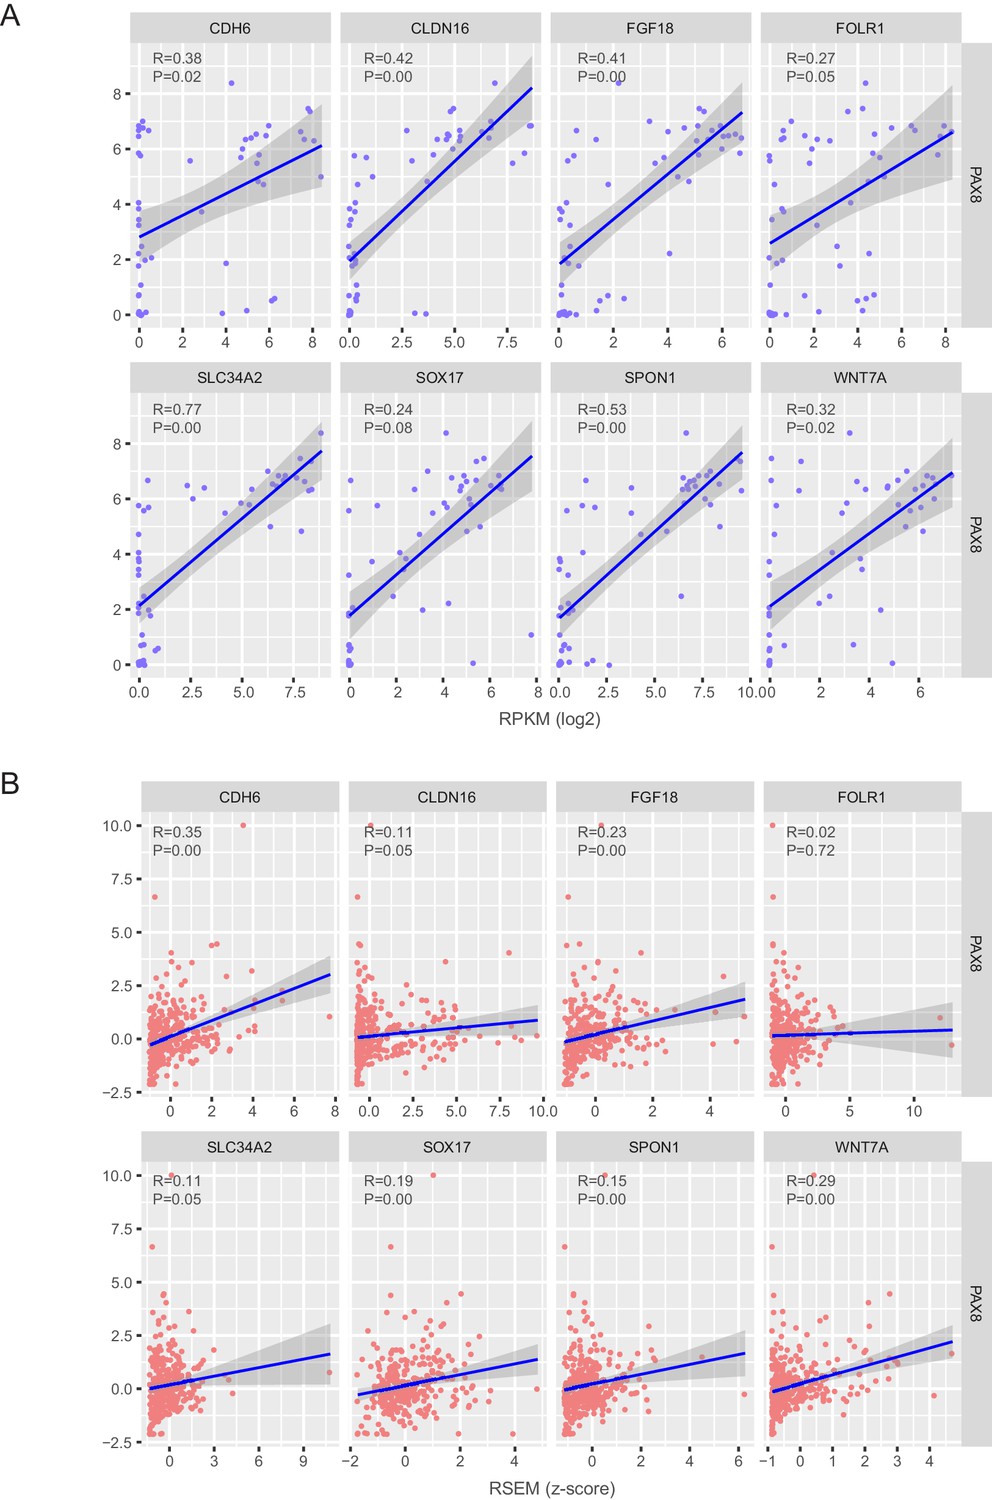
Correlation estimation of PAX8 and each regulon gene in ovarian cancer cell lines and TCGA ovarian tumors.
(A) Correlation estimation of PAX8 and each regulon gene at the mRNA level in ovarian cancer cell lines. (B) Correlation estimation of PAX8 and each regulon gene at the mRNA level in TCGA ovarian tumors.
Figure 1—figure supplement 5
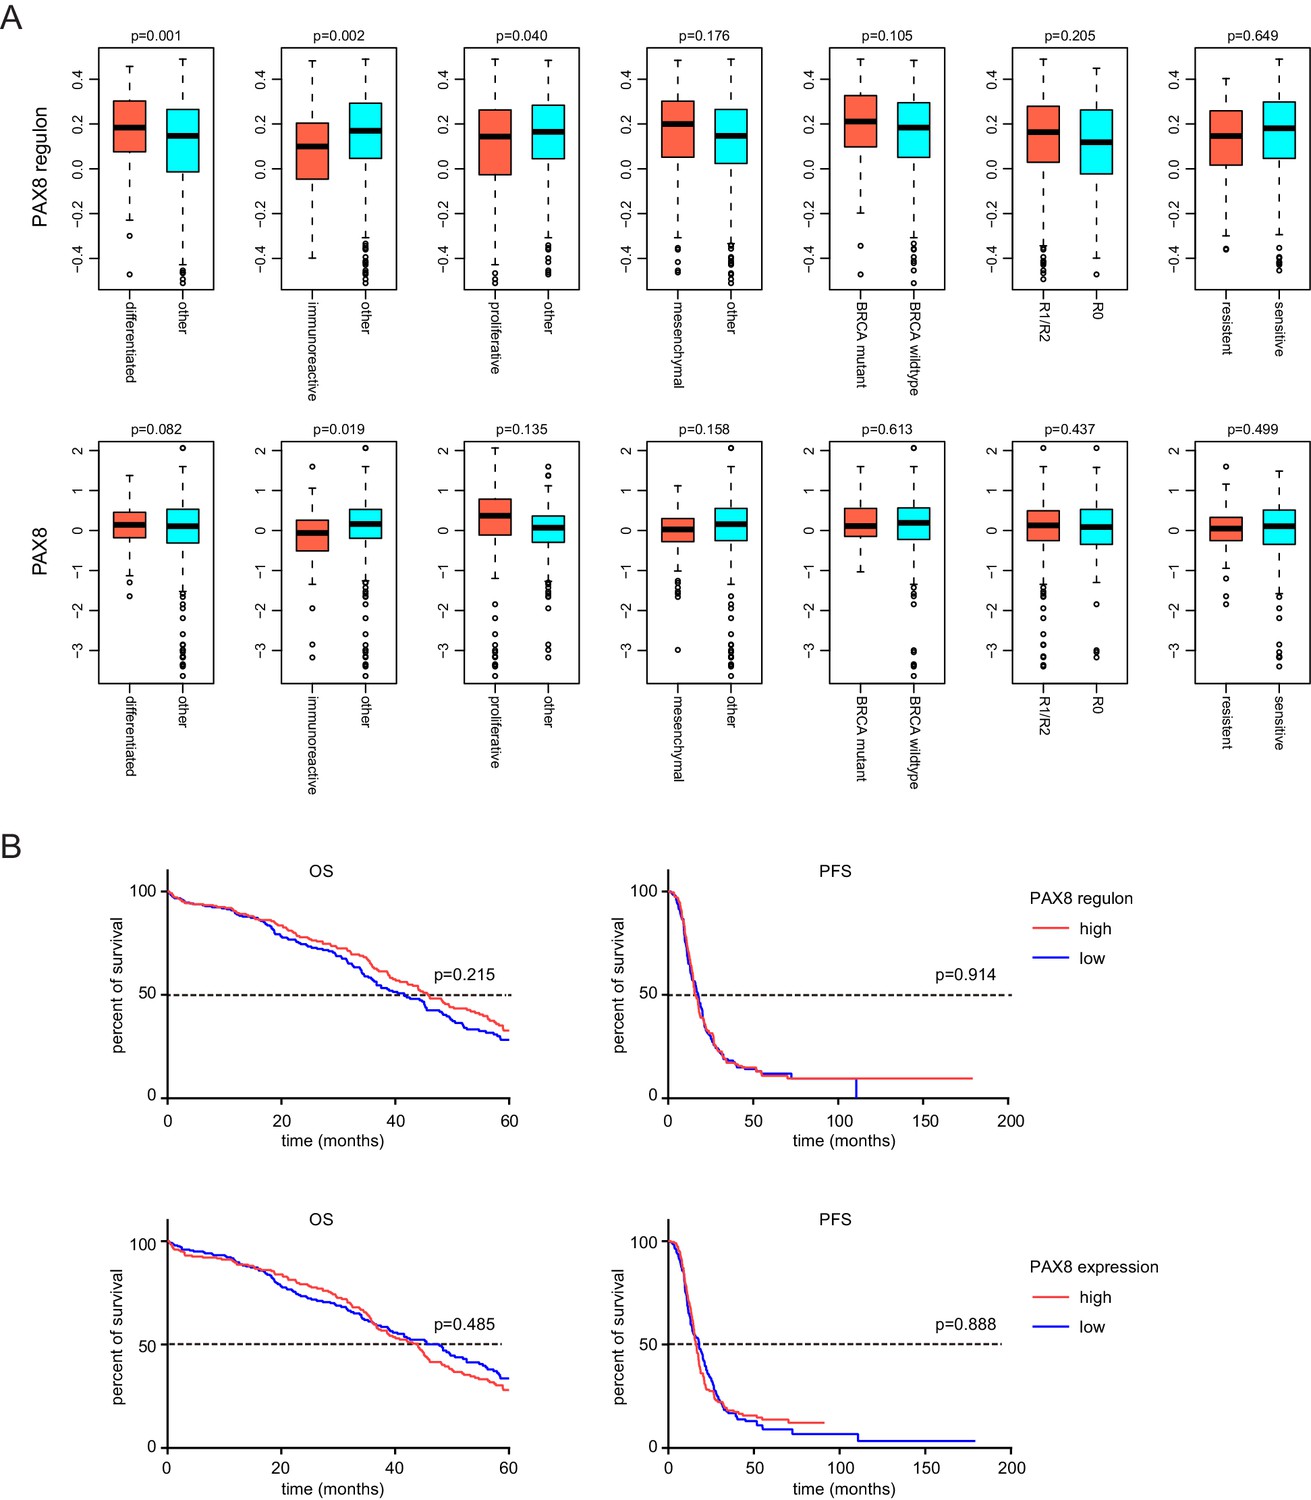
Molecular subgroup analysis and prognosis analysis of PAX8 and PAX8 regulon signature.
(A) Comparison of PAX8 regulon signature or PAX8 gene expression between indicated ovarian cancer subgroups. (B) Kaplan-Meier plots of overall survival (OS) or progression-free survival (PFS) in ovarian cancer patients stratified by PAX8 regulon signature or PAX8 gene expression levels.
Figure 2 with 2 supplements

The PAX8-FGF18 signaling axis promotes tumor cell motility.
(A) Hierarchical clustering of the microarray data in OVTOKO cells transduced with PAX8 siRNA or scrambled control. (B) GSEA plots indicated downregulation of cell cycle or tumor metastasis related gene sets upon PAX8 knockdown in OVTOKO cells. (C) PAX8 was knocked out in KURAMOCHI, HEY, SKOV3 and OVTOKO cells using CRISPR-Cas9 system with two independent sgRNAs, and the indicated proteins were analyzed by immunoblotting. (D) PAX8 was knocked out in KURAMOCHI, HEY, SKOV3 and OVTOKO cells. Cell growth was assayed by phase-contrast microscopy or crystal violet staining. The bar graphs showed quantification of crystal violet staining. Each column represented the mean value of three biological replicates, and error bars indicated standard deviation. (E) Transwell migrated cells as stained by crystal violet. The bar graphs showed quantification of cell migration. Each column represented the mean value of three biological replicates, and error bars indicated standard deviation. (F) Cell viability and motility upon individual knockout of indicated PAX8 regulon genes. (G) Transwell cell migration with or without FGF18 stimulation (100 ng/ml). The bar graphs showed quantification of cell migration. Each column represented the mean value of three biological replicates, and error bars indicated standard deviation. (H) ChIP-qPCR using primer set C illustrated PAX8 binding at FGF18 promoter. (I) FGF18 or FGFR gene expression in microarray analysis of OVTOKO cells transduced with PAX8 siRNA or scrambled control. (J) FGF18-stimulated transwell cell migration with or without FGFR inhibitor BGJ398 (1 μM). The bar graphs showed quantification of cell migration. Each column represented the mean value of three biological replicates, and error bars indicated standard deviation. (K) FGF18-stimulated transwell cell migration with or without PAX8 depletion. The bar graphs showed quantification of cell migration. Each column represented the mean value of three biological replicates, and error bars indicated standard deviation.
Figure 2—figure supplement 1
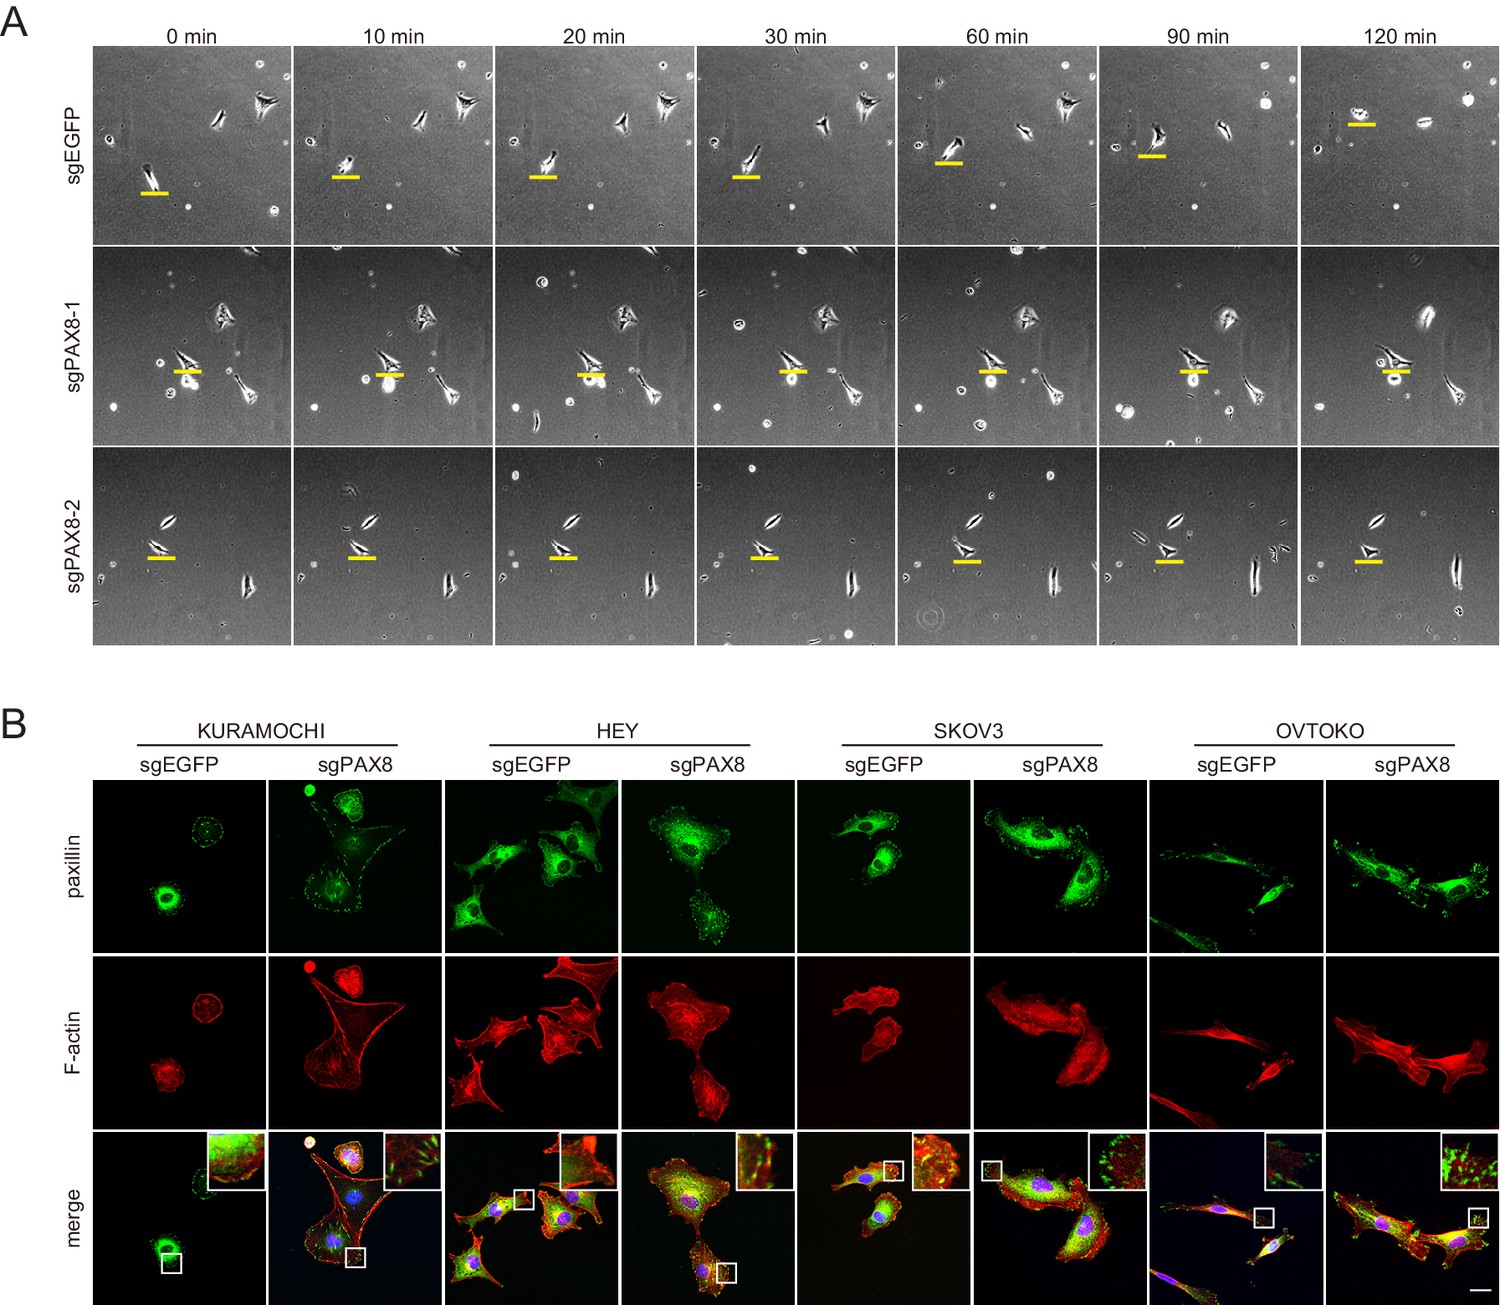
PAX8 deficient cells showed impaired cell motility and enhanced focal adhesions.
(A) Live imaging of ovarian tumor cells in the presence or absence of PAX8 gene. (B) Immunofluorescent staining of paxillin (green) and F-actin (red) demonstrated abnormally enhanced focal adhesions in PAX8-depleted ovarian cancer cells.
Figure 2—figure supplement 2
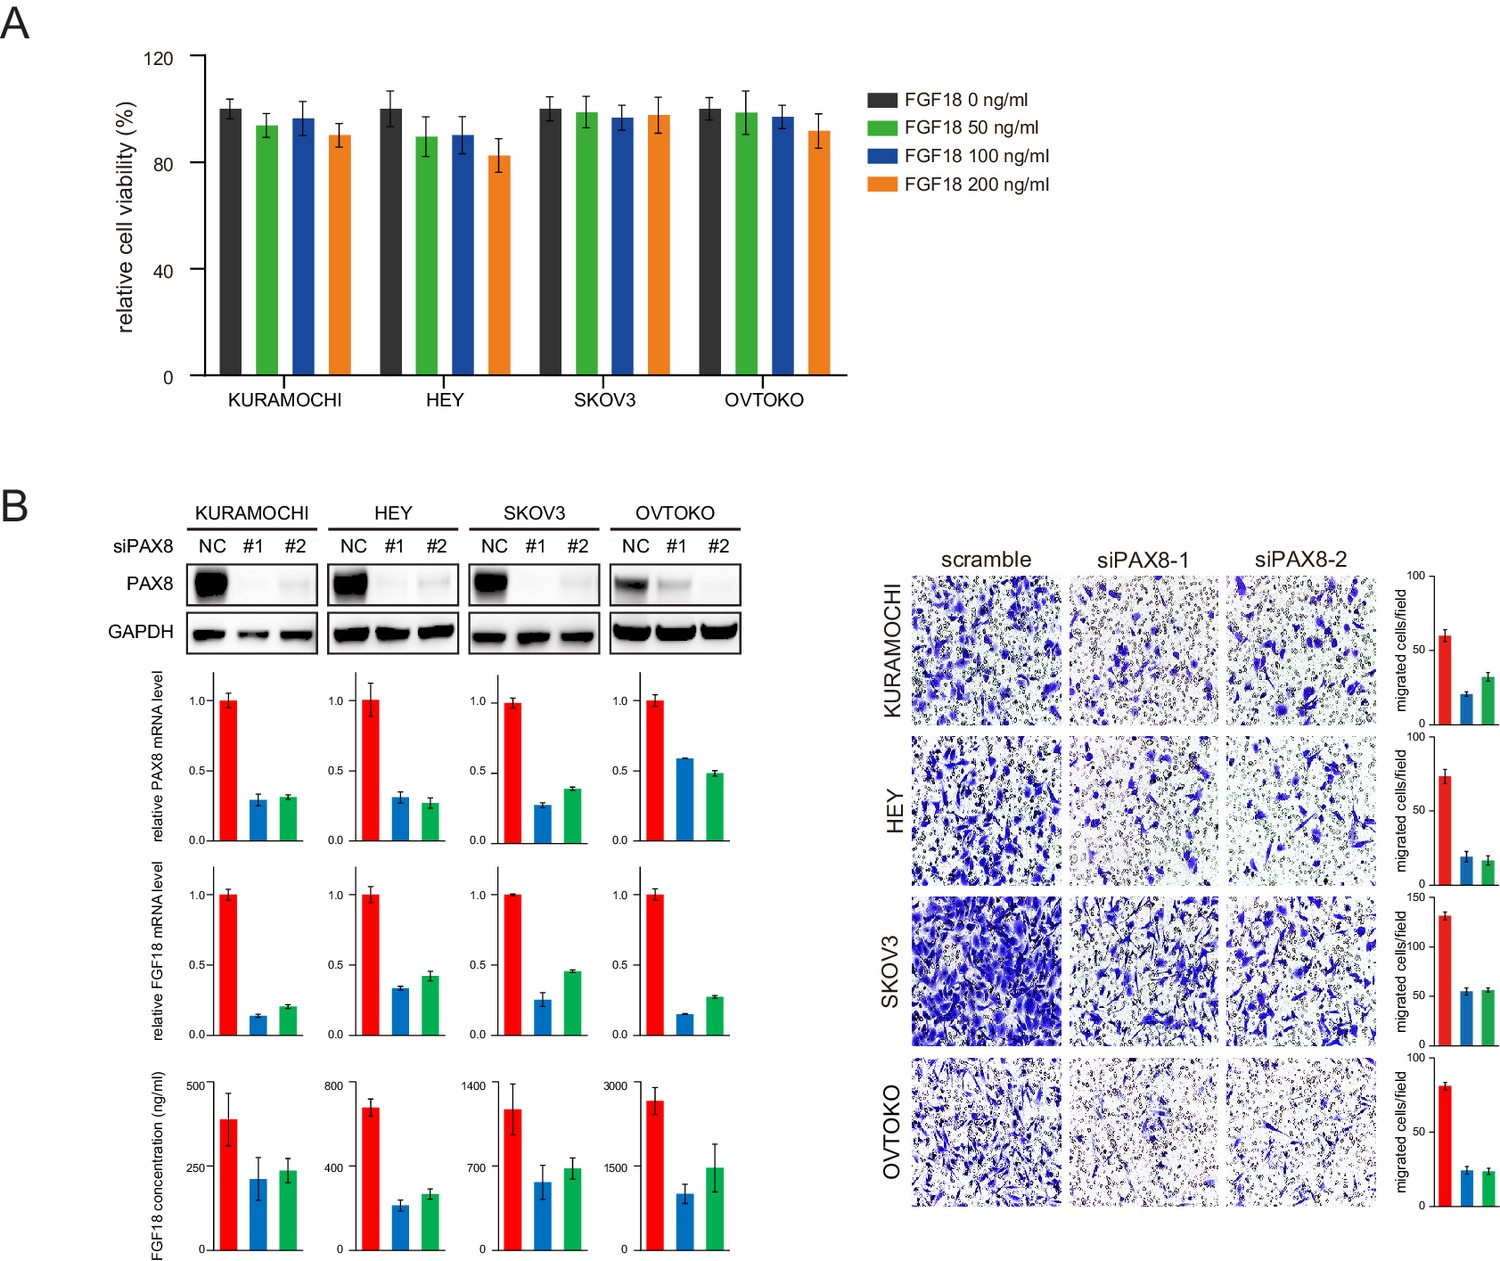
PAX8 knockdown decreased FGF18 production and cellular motility.
(A) Relative viability of ovarian tumor cells stimulated with indicated concentrations of FGF18 protein. (B) PAX8 knockdown using siRNAs inhibited FGF18 expression and cell migration.
Figure 3 with 2 supplements
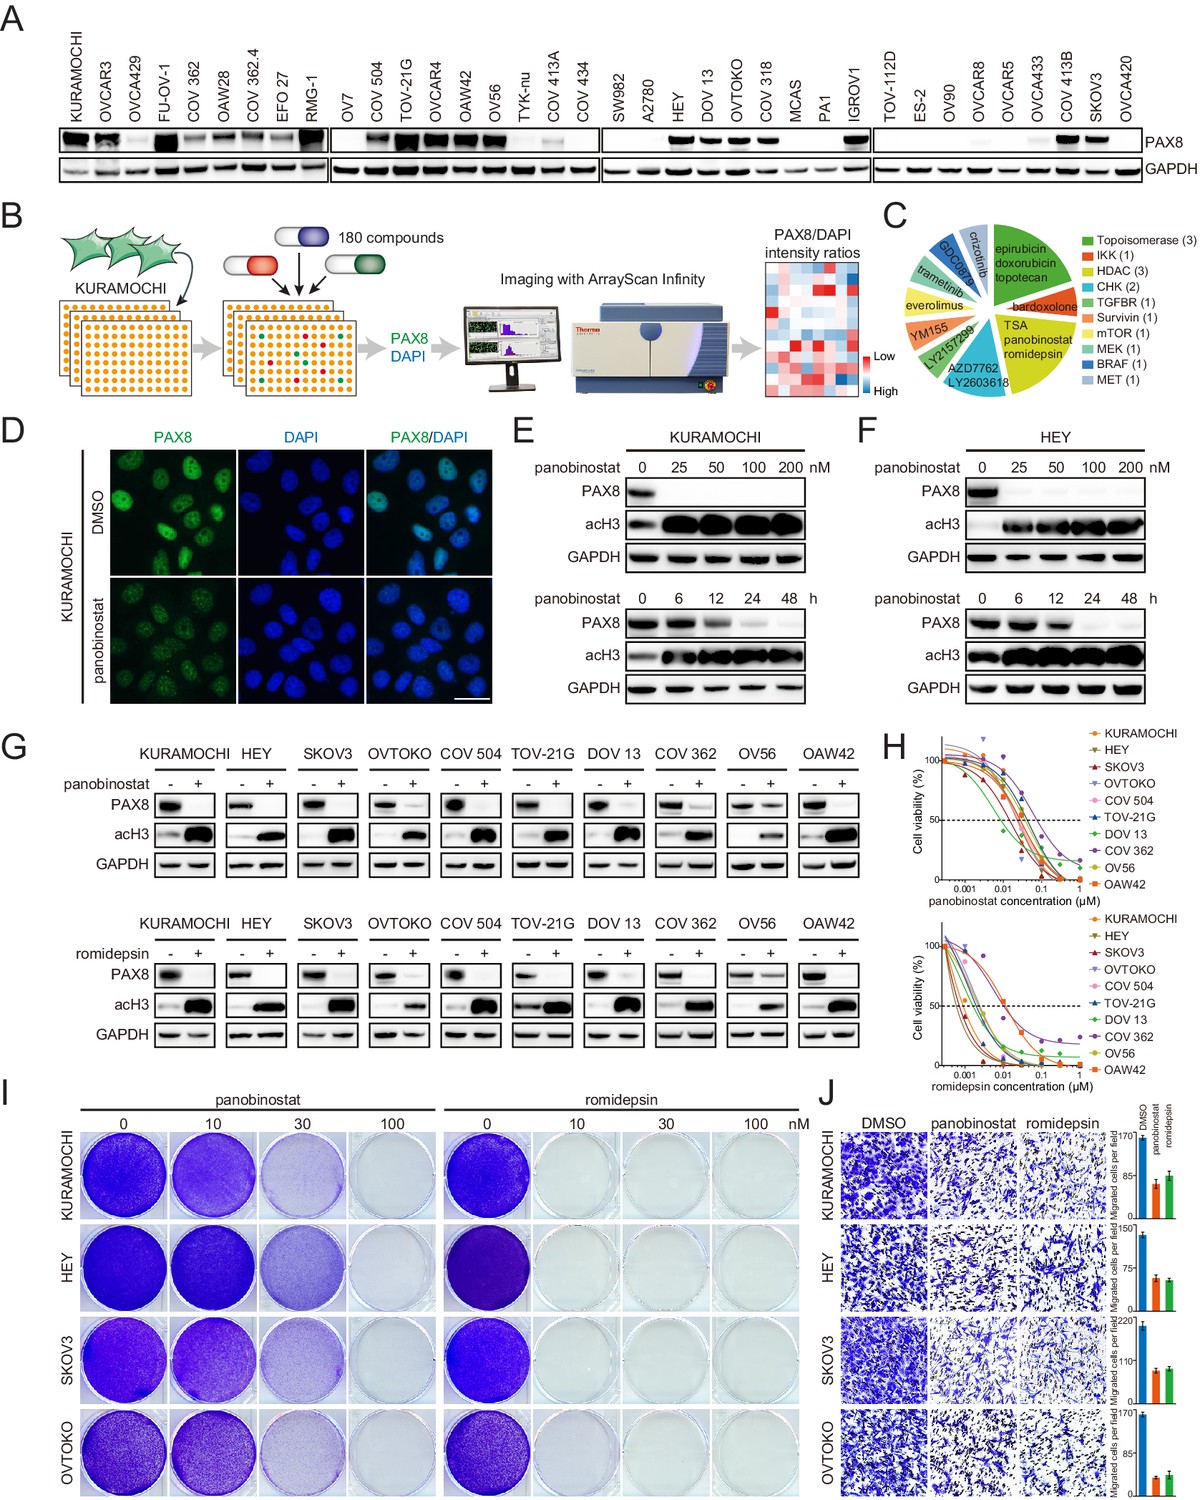
Class I HDAC inhibition antagonizes PAX8 expression.
(A) PAX8 immunoblotting across a panel of ovarian cancer cell lines. (B) Schematic overview of high-throughput image-based small-molecule screen in KURAMOCHI cells. (C) Top 15 ranked compounds reducing PAX8/DAPI intensity ratios and their corresponding targets. (D) Immunofluorescent images of PAX8 staining in the presence or absence of panobinostat treatment (100 nM). (E) KURAMOCHI cells were treated with panobinostat and cell lysates were analyzed by immunoblotting. Panobinostat reduced PAX8 protein levels in dose- (treatment duration: 48 hr) and time- (drug concentration: 100 nM) dependent manners. (F) HEY cells were treated with panobinostat and cell lysates were analyzed by immunoblotting. Panobinostat reduced PAX8 protein levels in dose- (treatment duration: 48 hr) and time- (drug concentration: 100 nM) dependent manners. (G) Indicated ovarian cancer cells were treated with panobinostat (100 nM) or romidepsin (50 nM) for 48 hr, and cell lysates were analyzed by immunoblotting. (H) Cell viability in the indicated panel of ovarian cancer cell lines treated with various concentrations of panobinostat or romidepsin for 72 hr. (I) KURAMOCHI, HEY, SKOV3 and OVTOKO cells were treated with panobinostat or romidepsin, and were analyzed by crystal violet staining. (J) Transwell cell migration with or without HDAC inhibitors (panobinostat: 100 nM; romidepsin: 50 nM). The bar graphs showed quantification of cell migration. Each column represented the mean value of three biological replicates, and error bars indicated standard deviation.
Figure 3—figure supplement 1
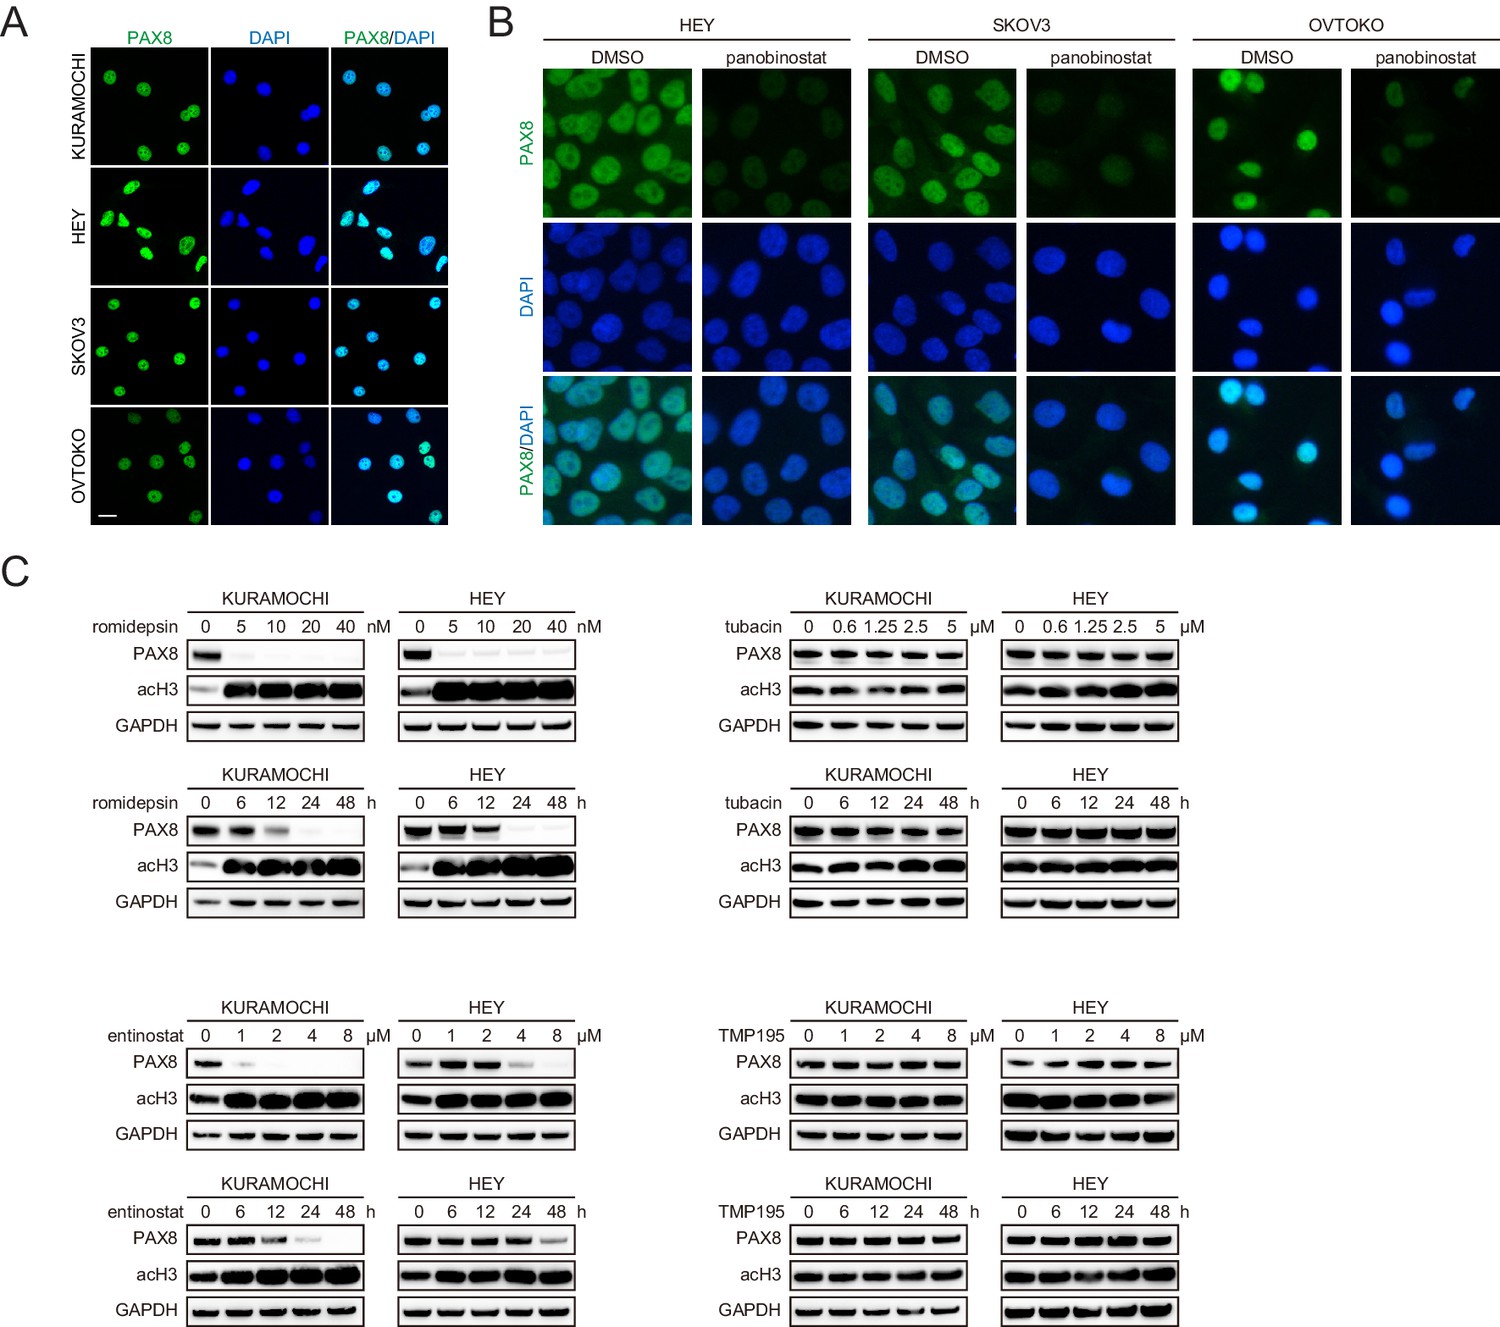
Class I ,but not class II, HDAC inhibitors reduced PAX8 expression.
(A) Immunofluorescence staining of PAX8 (green) in ovarian cancer cell nuclei (blue). (B) Immunofluorescent images of PAX8 staining in the presence or absence of panobinostat treatment (100 nM). (C) KURAMOCHI and HEY cells were treated with romidepsin, entinostat, tubacin or TMP195, and analyzed by immunoblotting as indicated. Romidepsin or entinostat but not tubacin or TMP195 reduced PAX8 protein levels in dose- (treatment duration: 48 hr) and time- (romidepsin concentration: 40 nM; entinostat concentration: 8 μM; tubacin concentration: 5 μM; TMP195 concentration: 8 μM) dependent manners.
Figure 3—figure supplement 2
The effects of HDAC gene knockout and PAX8 overexpression.
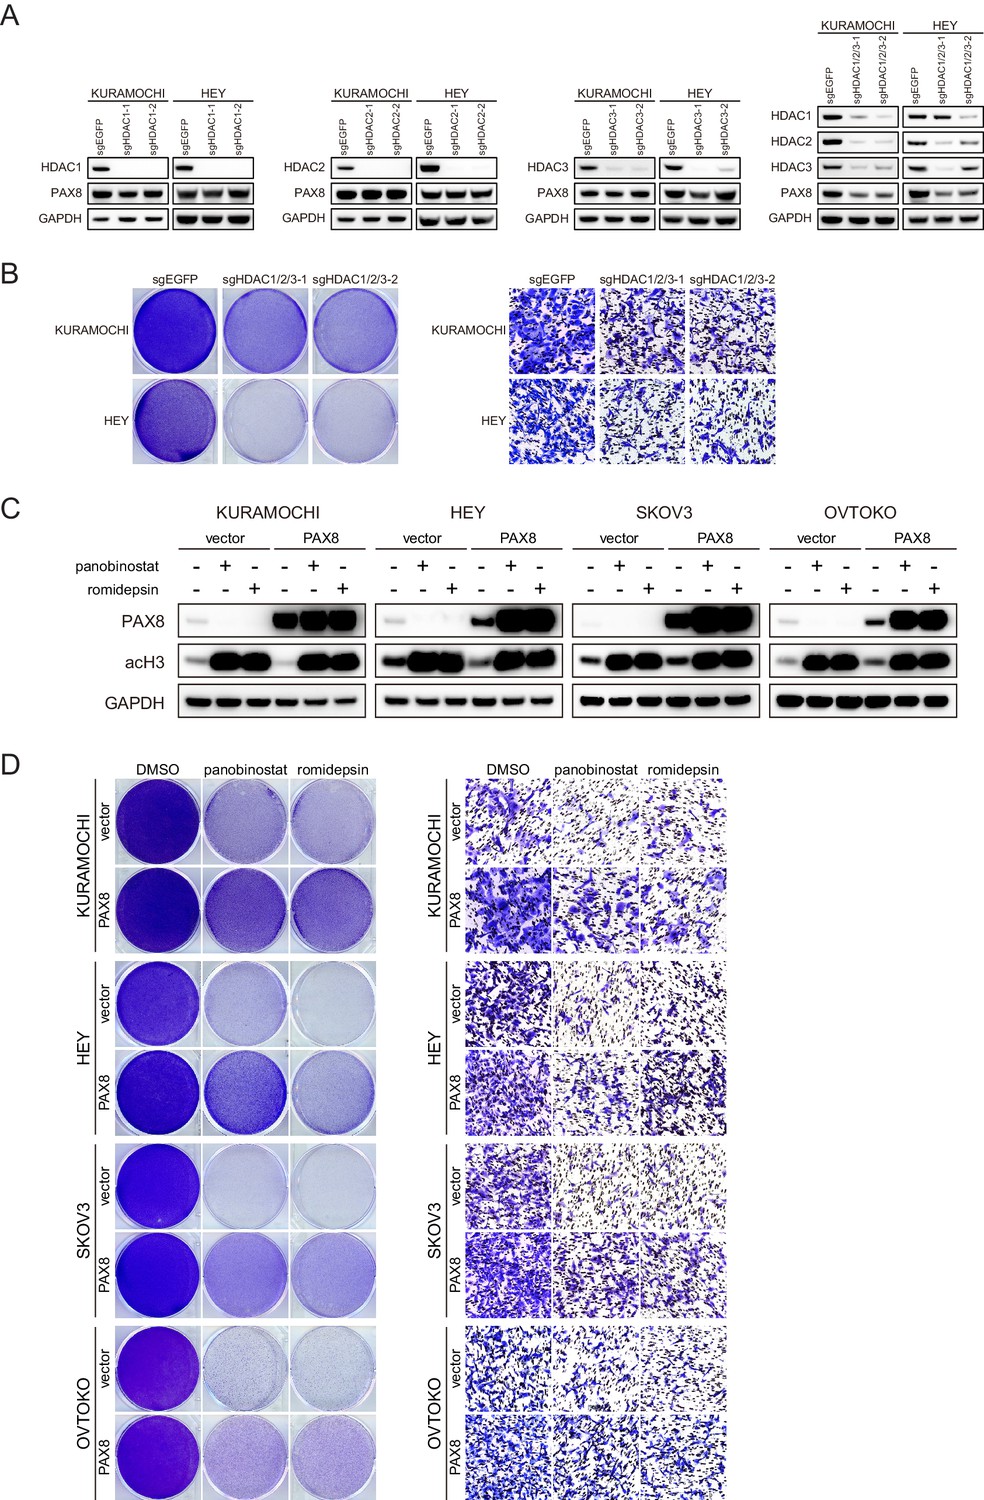
(A) HDAC1, HDAC2, and HDAC3 was knocked out in KURAMOCHI and HEY cells individually or in combination. Indicated proteins were analyzed by immunoblotting. (B) HDAC1, HDAC2, and HDAC3 was knocked out in KURAMOCHI and HEY cells. Cell viability and migration were analyzed by crystal violet staining and transwell assays, respectively. (C) PAX8 was overexpressed in KURAMOCHI, HEY, SKOV3 and OVTOKO cells with lentiviral infection. Cells were treated with panobinostat (100 nM) or romidepsin (50 nM) as indicated and analyzed by immunoblotting. (D) PAX8 was overexpressed in KURAMOCHI, HEY, SKOV3 and OVTOKO cells, followed by panobinostat (100 nM) or romidepsin (50 nM) treatment. Cell viability and migration were analyzed by crystal violet staining and transwell assays, respectively.
Figure 4 with 2 supplements
HDAC inhibitors epigenetically disrupt PAX8 transcription.
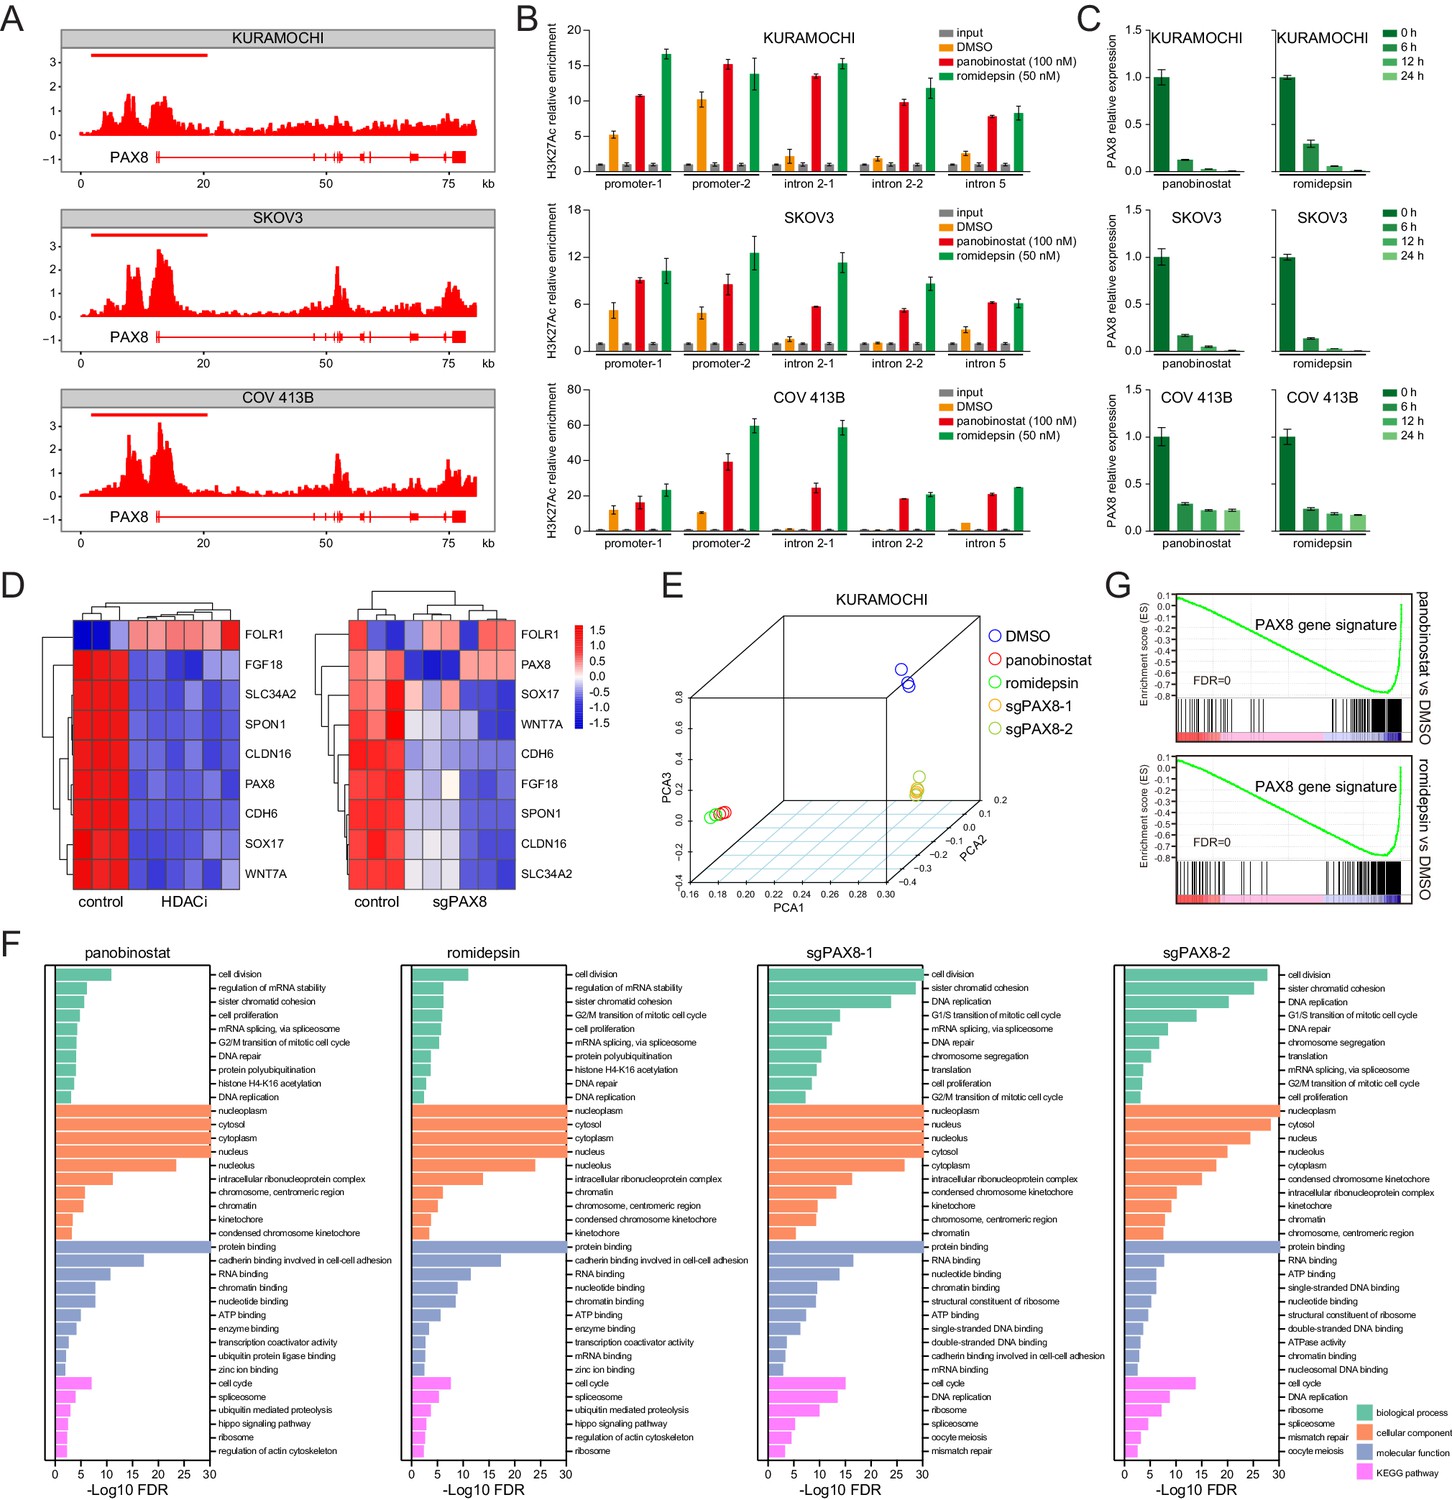
(A) ChIPseq profiles for H3K27ac occupancy of PAX8 gene locus in KURAMOCHI, SKOV3 and COV 413B cells. The x-axis showed gene tracks, and the y-axis showed the signal of H3K27ac binding within 50 bp bins in units of reads per million bin (rpm/bin). (B) ChIP-qPCR quantification of H3K27ac relative enrichment in PAX8 promoter or intron regions as compared to input signals. Each column represented the mean value of three biological replicates, and error bars indicated standard deviation. (C) Quantitative PCR analysis of PAX8 gene expression in KURAMOCHI, SKOV3 and COV 413B cells treated with panobinostat (100 nM) or romidepsin (50 nM). Each column represented the mean value of three biological replicates, and error bars indicated standard deviation. (D) Heatmaps of PAX8 regulon gene expression in KURAMOCHI cells as measured by RNAseq. (E) Principal component analysis (PCA) of RNAseq data in KURAMOCHI cells with HDAC treatment or PAX8 depletion. (F) Gene ontology categories and KEGG pathways overrepresented in differentially expressed transcripts that were inhibited upon HDAC treatment or PAX8 depletion in KURAMOCHI cells. (G) GSEA plots indicated downregulation of PAX8 gene signature upon HDAC treatment in KURAMOCHI cells.
Figure 4—figure supplement 1
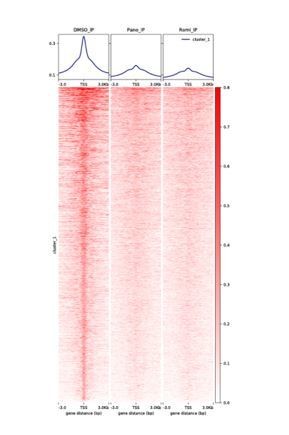
HDAC inhibitors altered H3K27ac distribution and resulted in rapid downregulation of PAX8.
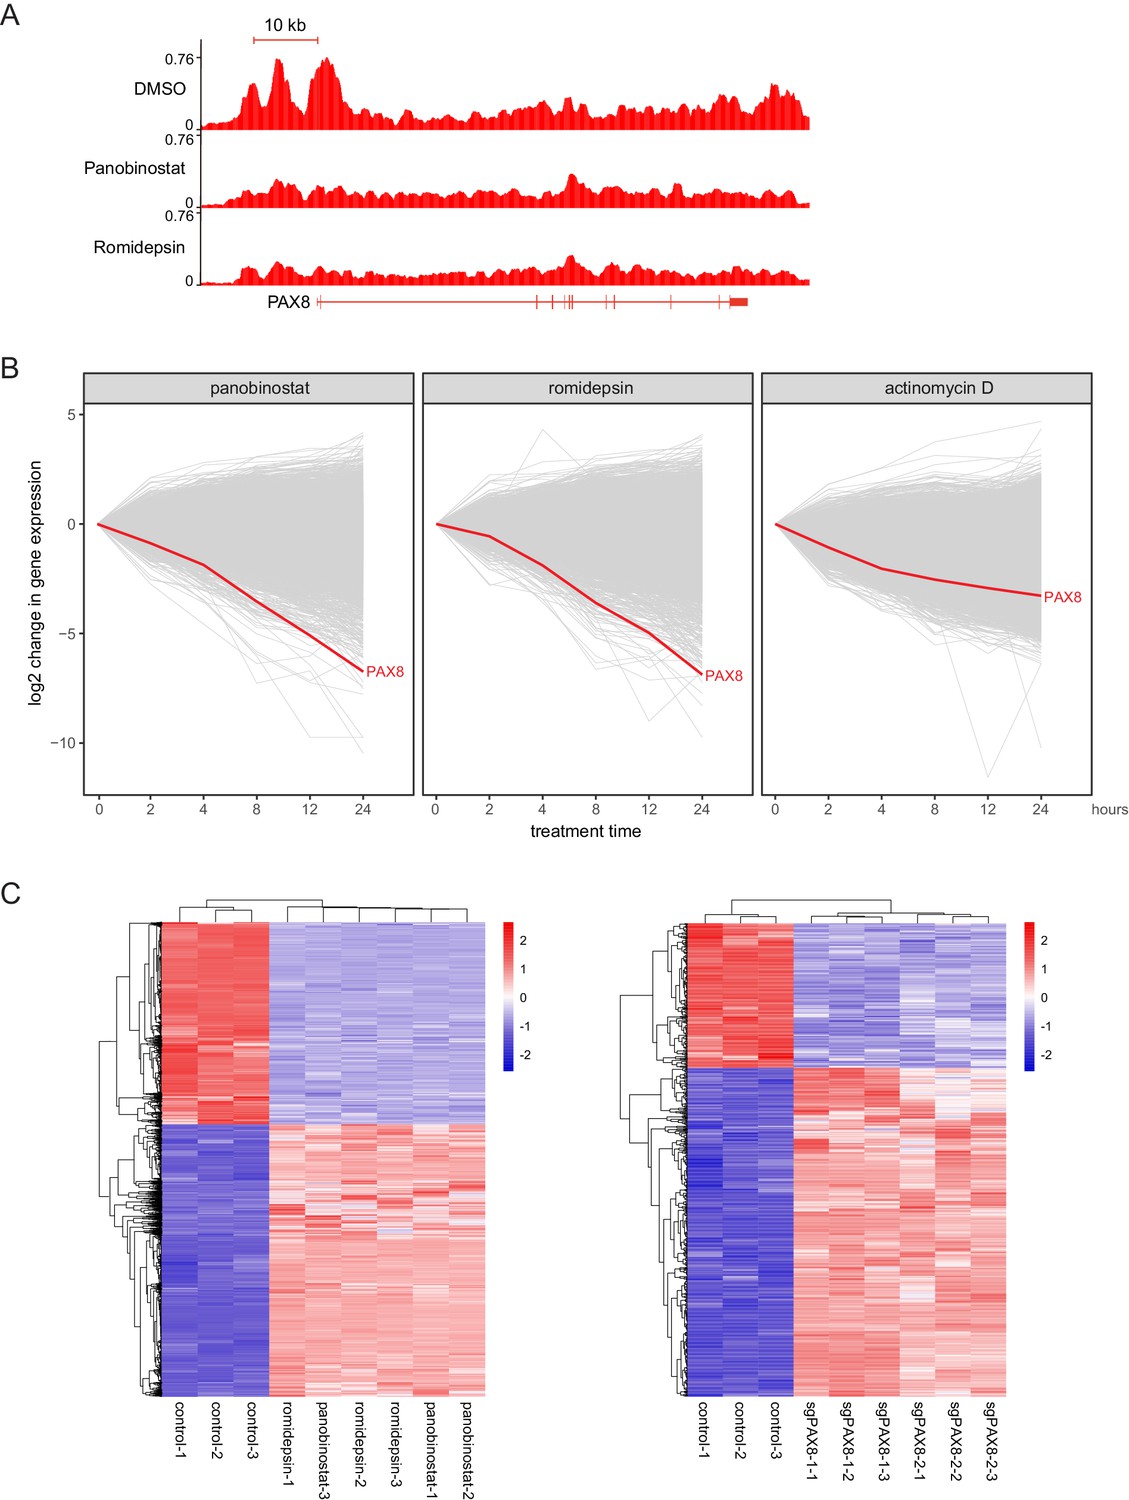
(A) ChIPseq profiles for H3K27ac occupancy of PAX8 gene locus in KURAMOCHI cells treated with DMSO, panobinostat or romidepsin. The x-axis showed gene tracks, and the y-axis showed the signal of H3K27ac binding. (B) The log2 change in gene expression after indicated drug treatment over time for expressed transcripts (FPKM +1 > 10) in KURAMOCHI cells. Each line represented a single gene with PAX8 drawn in red. (C) Heatmaps of RNAseq data for HDAC-inhibited or PAX8-depleted KURAMOCHI cells.
Figure 4—figure supplement 2
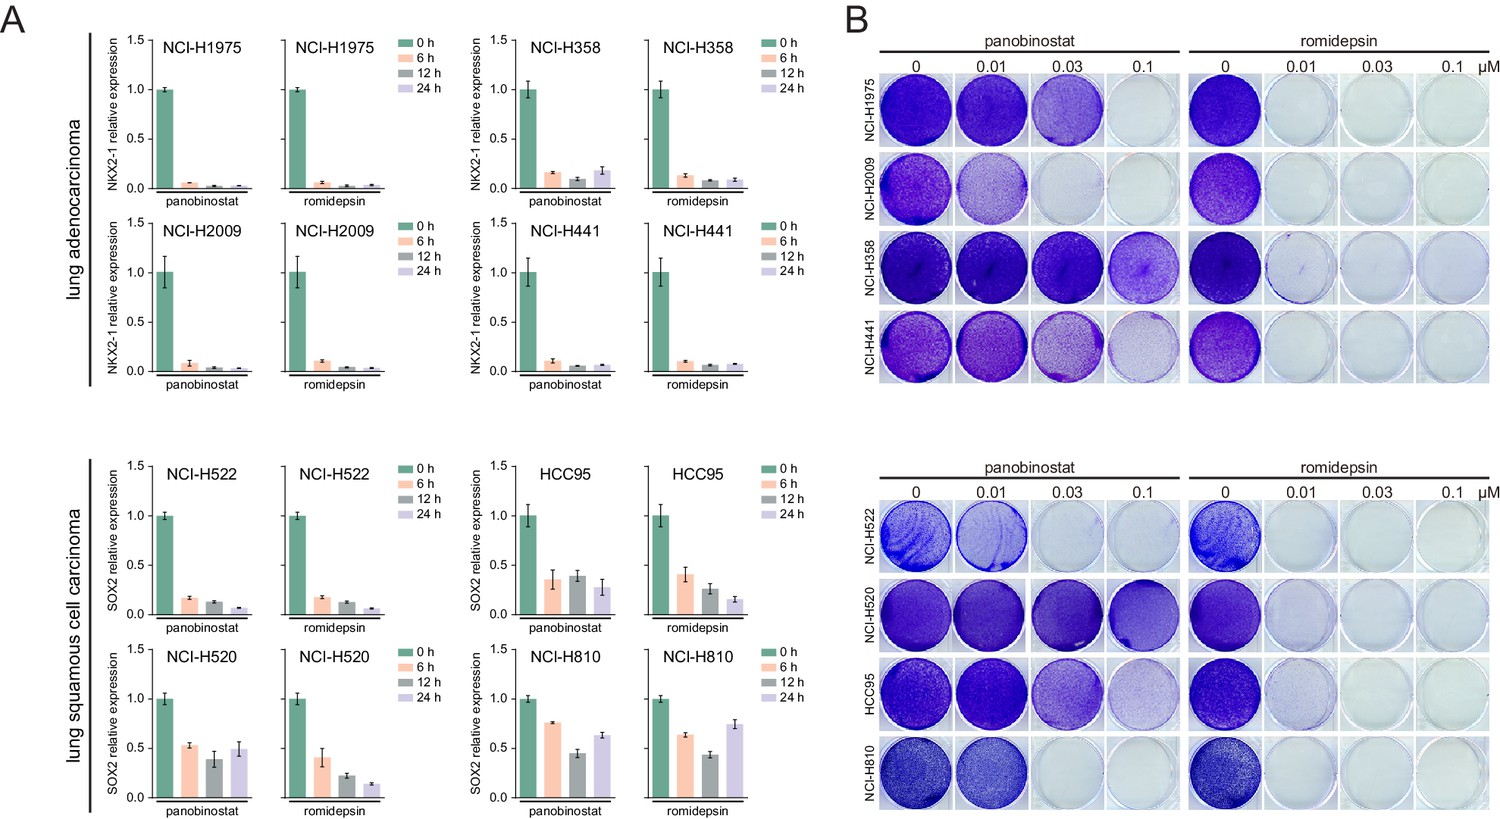
HDAC inhibitors suppressed lineage survival oncogenes expression and cell proliferation in lung cancer.
(A) Relative gene expression levels in indicated lung cancer cells treated with panobinostat (100 nM) or romidepsin (50 nM). (B) Indicated lung cancer cells were treated with panobinostat or romidepsin, and analyzed by crystal violet staining.
Figure 5
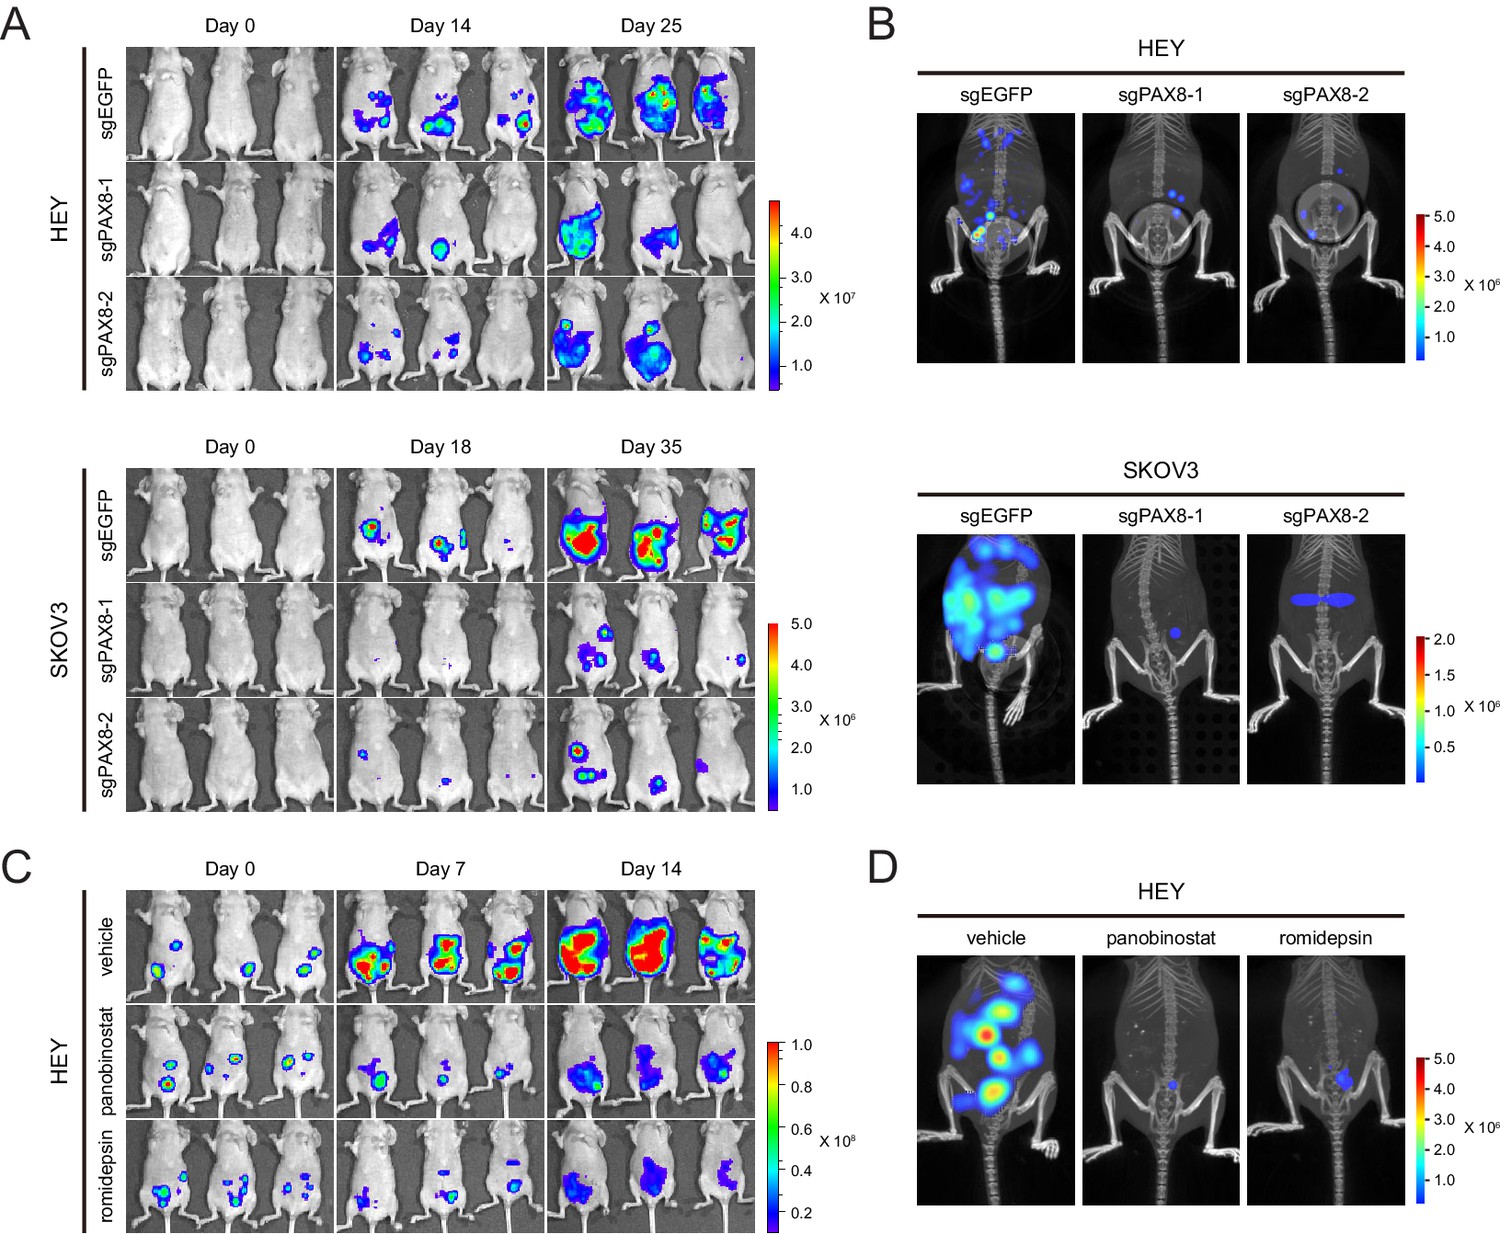
Targeting PAX8 or HDAC shows anti-tumor effects in mice.
(A) HEY or SKOV3 cells with or without PAX8 depletion were labeled with firefly luciferase and implanted intraperitoneally. Tumor development in mice was monitored by bioluminescence imaging. (B) Three-dimensional reconstruction of tumor lesions in mice illustrated impaired abdominopelvic spreading upon PAX8 depletion. (C) HEY cells labeled with firefly luciferase were implanted intraperitoneally and exposed to panobinostat or romidepsin treatment. Tumor development in mice was monitored by bioluminescence imaging. (D) Three-dimensional reconstruction of tumor lesions in mice illustrated impaired abdominopelvic spreading upon HDAC inhibition.
Figure 6 with 1 supplement

HDAC inhibitors and chemotherapy synergistically induce tumor death.
(A) KURAMOCHI, HEY, SKOV3 and OVTOKO cells were treated with cisplatin (2 μM) and HDAC inhibitors (panobinostat: 50 nM; romidepsin: 25 nM) as indicated, and cell lysates were analyzed by immunoblotting. (B) Heatmaps of bliss synergy scores demonstrated synergistic activities of cisplatin and HDAC inhibitors in KURAMOCHI (cisplatin: 0, 0.25, 0.5, 1, 2, 4, 8 μM; panobinostat: 0, 12.5, 25, 50, 100, 200, 400 nM; romidepsin: 0, 0.5, 1, 2, 4, 8, 16 nM), HEY (cisplatin: 0, 0.1, 0.3, 1, 3, 10, 30 μM; panobinostat: 0, 1, 3, 10, 30, 100, 300 nM; romidepsin: 0, 0.0625, 0.125, 0.25, 0.5, 1, 2 nM), SKOV3 (cisplatin: 0, 0.1, 0.3, 1, 3, 10, 30 μM; panobinostat: 0, 1, 3, 10, 30, 100, 300 nM; romidepsin: 0, 0.0625, 0.125, 0.25, 0.5, 1, 2 nM) and OVTOKO (cisplatin: 0, 0.25, 0.5, 1, 2, 4, 8 μM; panobinostat: 0, 12.5, 25, 50, 100, 200, 400 nM; romidepsin: 0, 0.5, 1, 2, 4, 8, 16 nM). (C) KURAMOCHI, HEY, SKOV3 and OVTOKO cells were treated with cisplatin (2 μM) and HDAC inhibitors (panobinostat: 50 nM; romidepsin: 25 nM) as indicated, and were analyzed by crystal violet staining. (D) Tumor growth curves were shown for the PDX EOC-002 model treated with indicated regimens. The right panel indicated relative tumor volume changes at the end point versus the treatment start point. (E) Tumor growth curves were shown for the PDX EOC-004 model treated with indicated regimens. The right panel indicated relative tumor volume changes at the end point versus the treatment start point. (F) Representative images of hematoxylin and eosin (H&E) and immunohistochemistry staining for PAX8, Ki-67 or cleaved PARP.
Figure 6—figure supplement 1
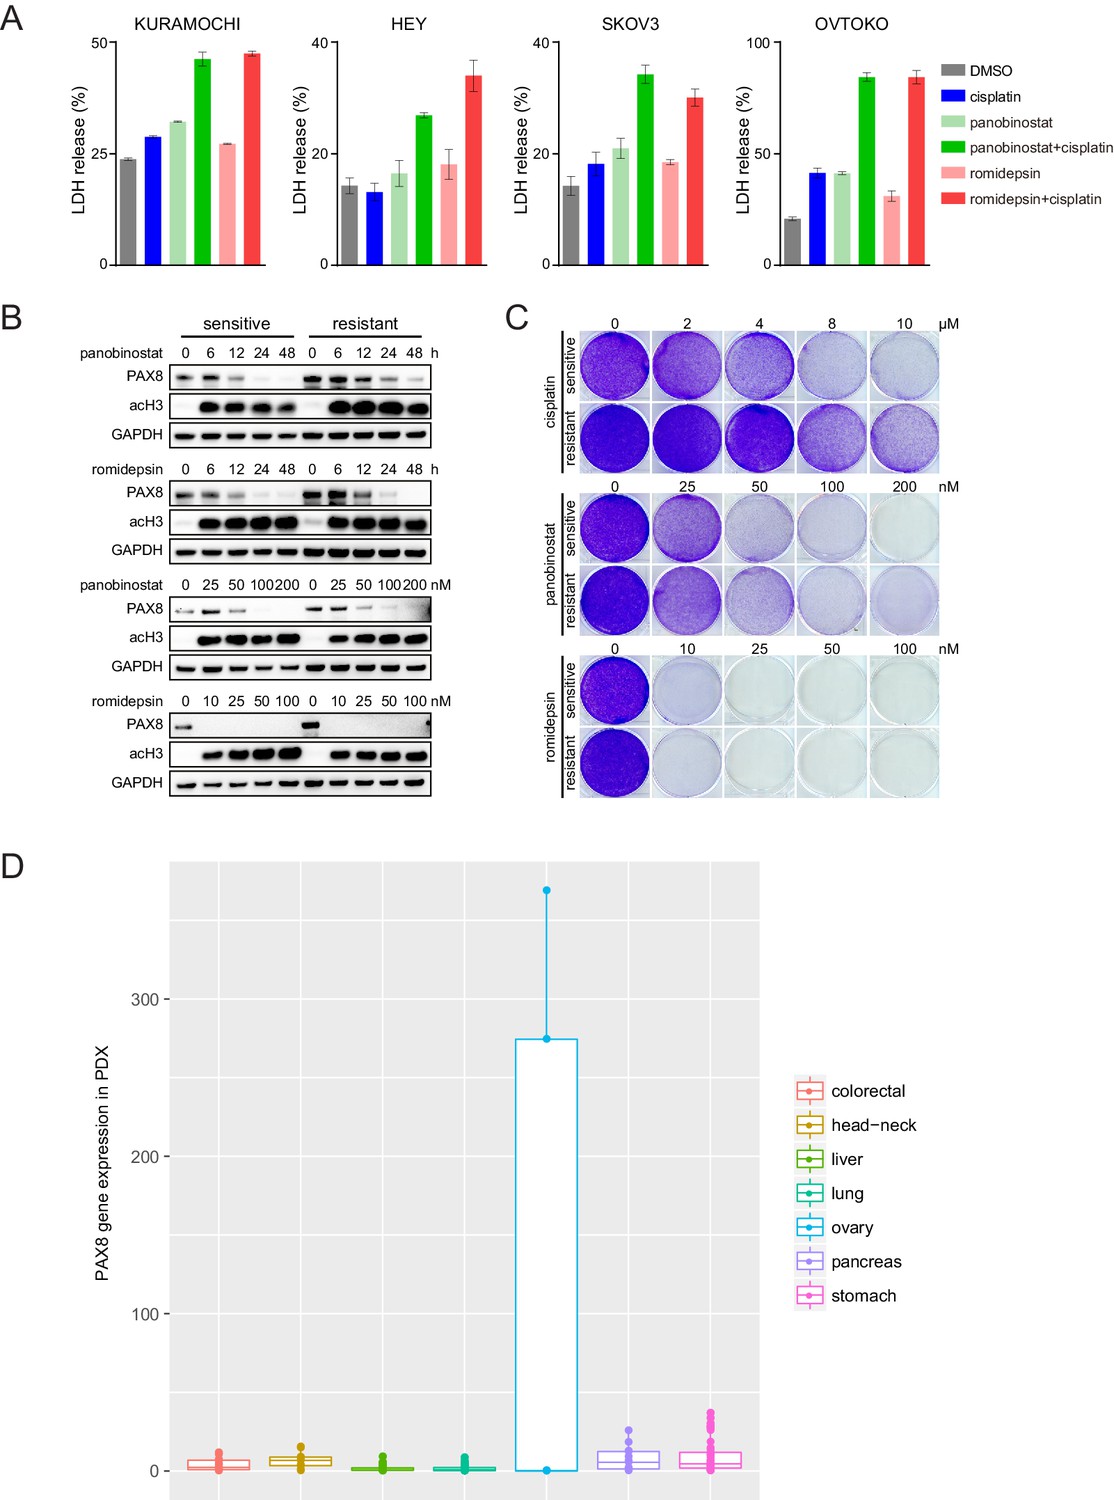
HDAC inhibitors induced cell pyroptosis and restrained chemo-resistant ovarian cancer cell proliferation.
(A) LDH release from ovarian cancer cells treated with indicated compounds (cisplatin: 2 μM; panobinostat: 50 nM; romidepsin: 25 nM). (B) Chemo-sensitive or resistant SKOV3 cells were treated with panobinostat or romidepsin, and analyzed by immunoblotting as indicated. HDAC inhibitors reduced PAX8 protein levels in dose- (treatment duration: 48 hr) and time- (panobinostat concentration: 100 nM; romidepsin concentration: 50 nM) dependent manners. (C) Chemo-sensitive or resistant SKOV3 cells were treated with cisplatin, panobinostat or romidepsin, and analyzed by crystal violet staining. (D) Boxplots of PAX8 gene expression in 221 PDX models from seven different types of solid cancers.
Author response image 1
Tables
Key resources table
| Reagent type (species) or resource | Designation | Source or reference | Identifiers | Additional information |
|---|---|---|---|---|
| Antibody | anti-PAX8 | GeneTex | GTX101583 | |
| Antibody | anti-PARP | Cell Signaling Technology | cat#9532 | |
| Antibody | anti-cleaved PARP | Cell Signaling Technology | cat#5625 | |
| Antibody | anti-GAPDH | Cell Signaling Technology | cat#8884 | |
| Antibody | anti-Paxillin | Abcam | ab32084 | |
| Antibody | anti-HDAC1 | Santa Cruz | sc-81598 | |
| Antibody | anti-HDAC2 | Abcam | ab32117 | |
| Antibody | anti-HDAC3 | Cell Signaling Technology | cat#3949 | |
| Antibody | anti-H3K27Ac | Abcam | ab4729 | |
| Antibody | anti-GSDME | Abcam | ab215191 | |
| Antibody | anti-cyclin D1 | Abcam | ab134175 | |
| Commercial assay or kit | Alexa Fluor 594 phalloidin | ThermoFisher Scientific | A12381 | |
| Peptide, recombinant protein | Recombinant human FGF18 | Biovision | cat#4082–25 | |
| Commercial assay or kit | FGF18 ELISA kit | Lifespan | LS-F23007 | |
| Commercial assay or kit | CytoTox 96 Non-Radioactve Cytotoxicity Assay Kit | Promega | G1780 | |
| Commercial assay or kit | D-luciferin | Promega | P1042 | in PBS |
| Chemical compound, drug | Panobinostat | Selleck Chemicals | S1030 | in DMSO |
| Chemical compound, drug | Romidepsin | Selleck Chemicals | S3020 | in DMSO |
| Chemical compound, drug | Entinostat | Selleck Chemicals | S1053 | in DMSO |
| Chemical compound, drug | TMP195 | Selleck Chemicals | S8502 | in DMSO |
| Chemical compound, drug | BGJ398 | Selleck Chemicals | S2183 | in DMSO |
| Cell line (H. sapiens) | HEK293T | ATCC | ||
| Cell line (H. sapiens) | HEY | ATCC | ||
| Cell line (H. sapiens) | SKOV3 | ATCC | HTB-77 | |
| Cell line (H. sapiens) | KURAMOCHI | JCRB | JCRB0098 | |
| Cell line (H. sapiens) | OVTOKO | JCRB | JCRB1048 | |
| Recombinant DNA reagent | LentiCRISPRv2 | PMID:25075903 | ||
| Recombinant DNA reagent | pLenti7.3/V5-DEST Gateway Vector | ThermoFisher Scientific | V53406 |
Additional files
-
Supplementary file 1
Cancer outlier genes.
- https://doi.org/10.7554/eLife.44306.020
-
Supplementary file 2
TMA patient information.
- https://doi.org/10.7554/eLife.44306.021
-
Supplementary file 3
Screening of 180 inhibitors in KURAMOCHI cells.
- https://doi.org/10.7554/eLife.44306.022
-
Supplementary file 4
PAX8 gene signature expression.
- https://doi.org/10.7554/eLife.44306.023
-
Supplementary file 5
PCR primers, sgRNA sequences and siRNA sequences.
- https://doi.org/10.7554/eLife.44306.024
-
Transparent reporting form
- https://doi.org/10.7554/eLife.44306.025
Download links
A two-part list of links to download the article, or parts of the article, in various formats.
Downloads (link to download the article as PDF)
Open citations (links to open the citations from this article in various online reference manager services)
Cite this article (links to download the citations from this article in formats compatible with various reference manager tools)
PAX8 regulon in human ovarian cancer links lineage dependency with epigenetic vulnerability to HDAC inhibitors
eLife 8:e44306.
https://doi.org/10.7554/eLife.44306


