Fast and flexible sequence induction in spiking neural networks via rapid excitability changes
- University of Washington, United States
Figures
Figure 1 with 1 supplement

Mechanism and consequences of LTP-IE.
(A) Demonstration using leaky integrate-and-fire (LIF) neuron model of fast activity-driven LTP-IE, which doubles membrane voltage responses to gate inputs as described in Hyun et al. (2013); Hyun et al. (2015). A spike in an upstream gate neuron (G) first elicits a small EPSP in the pyramidal cell (PC); a 1 s spike train (dots) at approximately 20 Hz is evoked by strong stimulation of sensory inputs S; when G spikes again, the EPSP has doubled in size. ‘RCR’ refers to recurrent inputs from other PCs (not used in this figure). Dashed lines show leak and spike-threshold voltages. (B) Shifted logistic function for LTP-IE strength (effective weight scaling factor) σ vs. PC firing rate over 1 s. (C) Example membrane voltages of PCs with different σ receiving stochastic but statistically identical gating input spikes. (D) Distribution of PC membrane voltage for σ values shown in C. (E) Mean (thick) and standard deviation (shading) of Vm as a function of σ for three gate firing rates. Black: rG = 75 Hz; dark red: rG = 125 Hz; red: rG = 175 Hz. (F) Example differential sensitivities of PC spike responses to injected current input (blue) for two different σ. Dashed lines show leak and spike threshold potential; dots indicate spikes (which only occur for the σ = 2 case [cyan]). (G) Difference between current-evoked spike probability and spontaneous spike probability as a function of σ for four initial gate input weights. Color code, in order of increasing lightness: wPG,G = 0.4,. 8, 1.2, 1.6 (see Materials and methods for units).
Figure 1—figure supplement 1
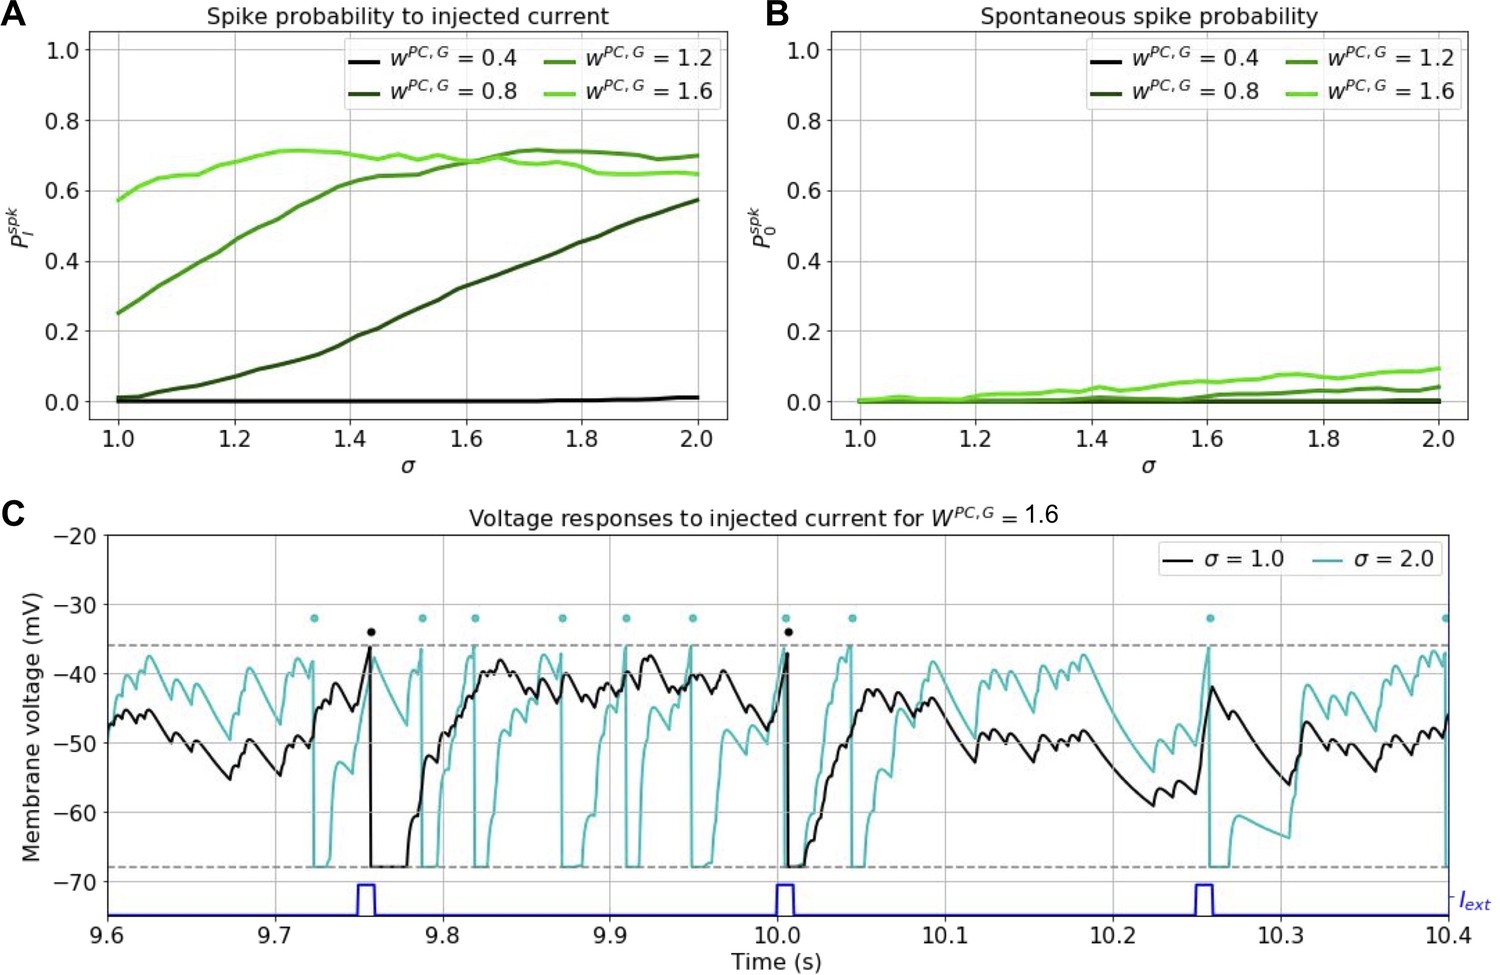
Effects of current pulses on spiking under LTP-IE.
(A) Probability of current-evoked spiking for different wPC,G and σ. (B) Spontaneous spiking probability for different different wPC,G and σ. (C) Example voltage traces for neurons with two different σ given large wPC,G. Same format as Figure 1F.
Figure 2 with 1 supplement

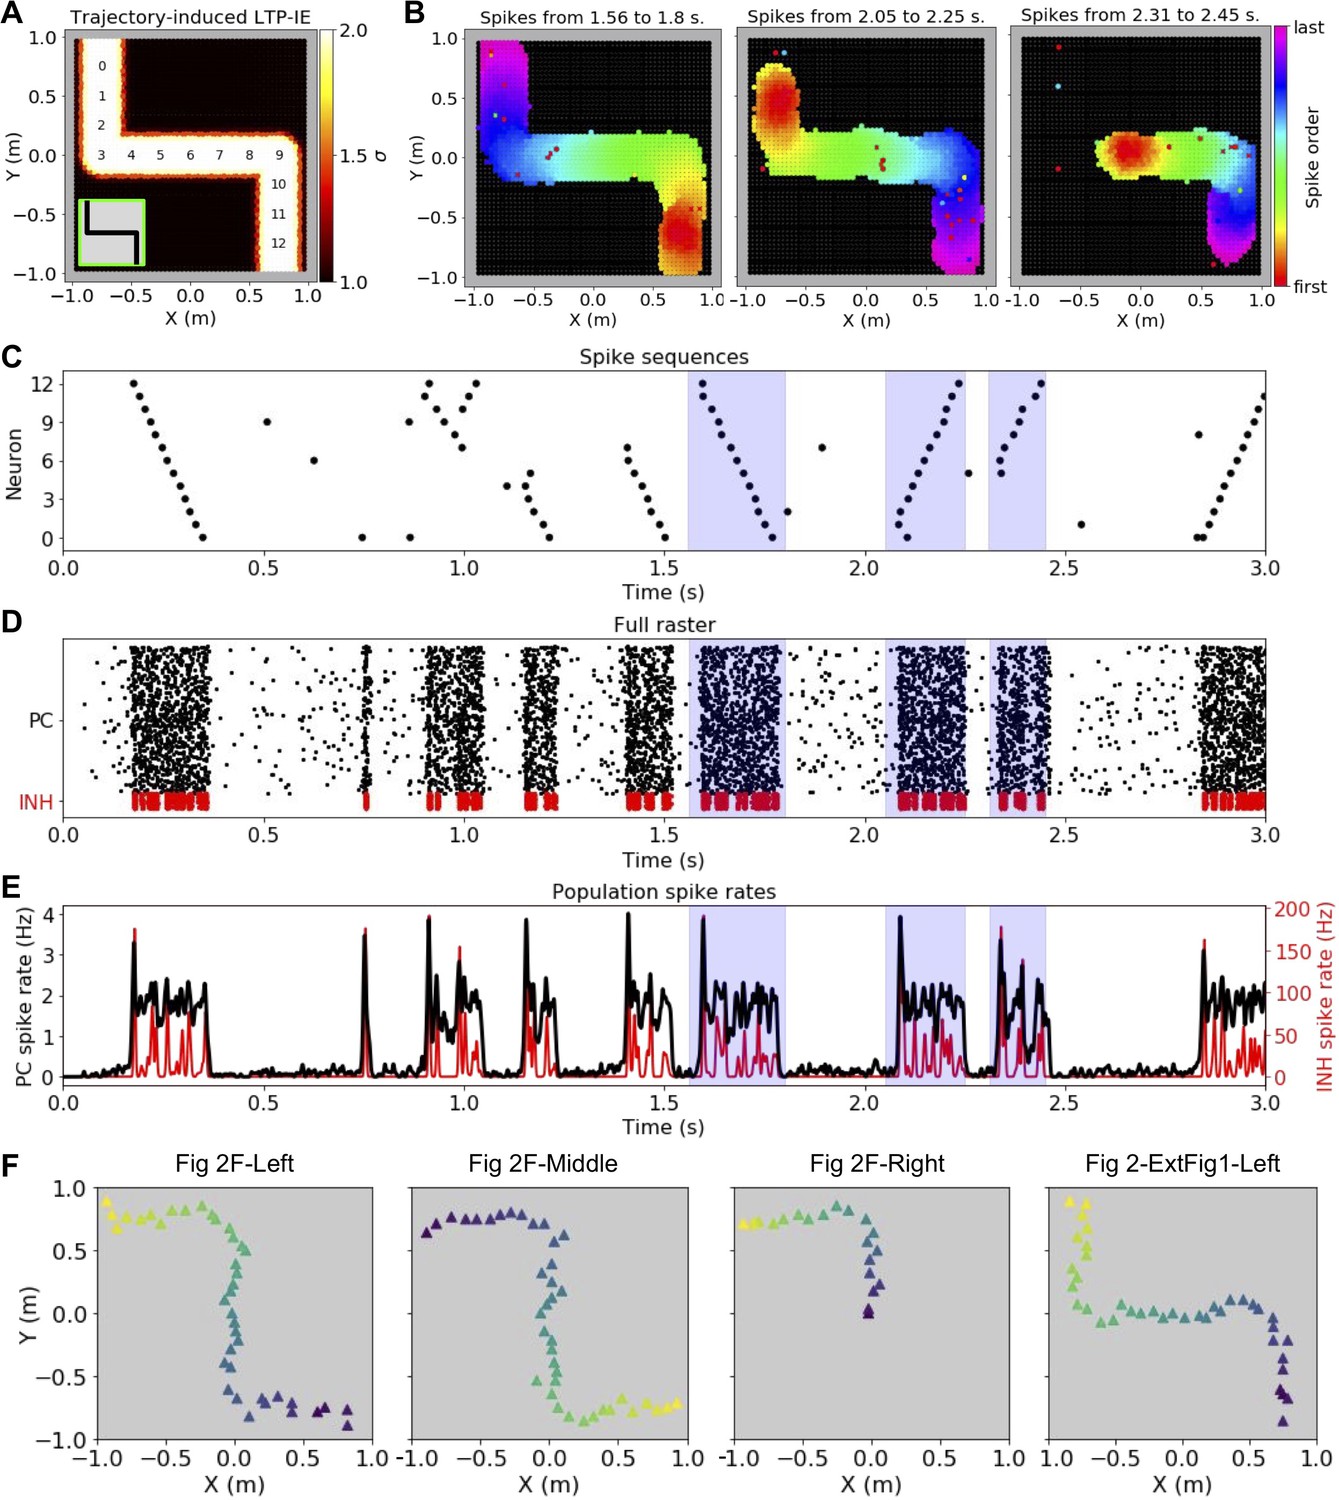
Demonstration of history-dependent sequence replay via LTP-IE.
(A) Network architecture used in simulations. The dashed oval around input S indicates that we did not explicitly simulate its interaction with the pyramidal cell (PC) network, but rather only the LTP-IE profile one would expect following the termination of S input. (B) Squared exponential position tuning for an example neuron (20 Hz max. firing rate, 0.15 m length scale). (C) Resultant LTP-IE as a function of distance between a cell’s maximum tuning and the closest point on the trajectory through the environment (red), computed as a sigmoidal function (Figure 1B) of position-dependent firing rate (black). (D) Recurrent excitatory weights between PCs as squared exponential function of distance between the two cells’ peak tuning positions. (E) LTP-IE profile induced in PCs by an example Z-shaped trajectory (inset) in a network of 3000 PC and 300 inhibitory (INH) cells. PCs are positioned according to peak tuning and colored by the LTP-IE level (σ) expected to result from the trajectory. The numbers indicate the position tunings of the PC identifiers in G. (Note: individual cells cannot be seen here due to their high density). (F) Cells activated during the different spontaneous replay events shaded in blue in G-I, colored by the order of the first spikes each cell emitted during the event. Black cells did not activate during replay. Left and middle: replay in two different directions; right: partial replay. G. Partial raster showing spike times for cells with position tunings marked in E. H. Full raster plot for PC and INH population over a 3 s trial. I. Cell-averaged spike rates for PC and INH populations throughout trial.
Figure 2—figure supplement 1
LTP-IE-based replay for an alternative trajectory/sequence to that shown in Figure 2.
(A-E) As in Figure 2E–H, but for the trajectory shown in A (inset). (F) Trajectories decoded from the replay events indicated above each panel (dark blue indicates start and yellow indicates end).
Figure 3

Parameter dependence of LTP-IE-based sequences.
(A) Spontaneous replay event frequency as a function of recurrent excitation (wPC,PC) and inhibitory feedback (wPC,INH) strengths. Black regions indicate regimes of ‘blowup’ replay events, which were not confined to LTP-IE profile. Weights are given in units of the conductance change in response to a presynaptic spike, relative to the leak conductance (inhibitory feedback weights are subsantially smaller because of the high connection probability between PCs and inhibitory cells). (B) As in A, but as a function of excitatory connectivity length scale (λPC,PC) and wPC,PC. (C) As in A, B, but as function of gate input frequency (rG) and the maximum LTP-IE level (σmax) a cell could attain. (D) Sequential firing of active cells (black cells did not spike) during replay events in a network without inhibition. (E) Partial (top) and full (bottom) raster plots showing replay event structure in network without inhibition. Cells in top raster are ordered by tuning positions indicated in 2E. (F) Virtual replay speed calculations for spontaneous replay events in networks with two different connectivity length scales λPC,PC. Point clouds show linear position of place fields of spiking PCs vs their spike times during replay. Thick lines are best-fit regression lines. (G) Estimated replay speed as a function of λPC,PC and wPC,PC. (H) Power spectral density of PC population activity during replay events for two different levels of inhibitory feedback wPC,INH. Thin lines correspond to individual replay events, and thick lines to event averages. (I) Example branched LTP-IE profile. (J) Spike order during spontaneous replay events given branched LTP-IE profile in I. Left and middle: example events in network with inhibition; right: example event in network without inhibition.
Figure 4
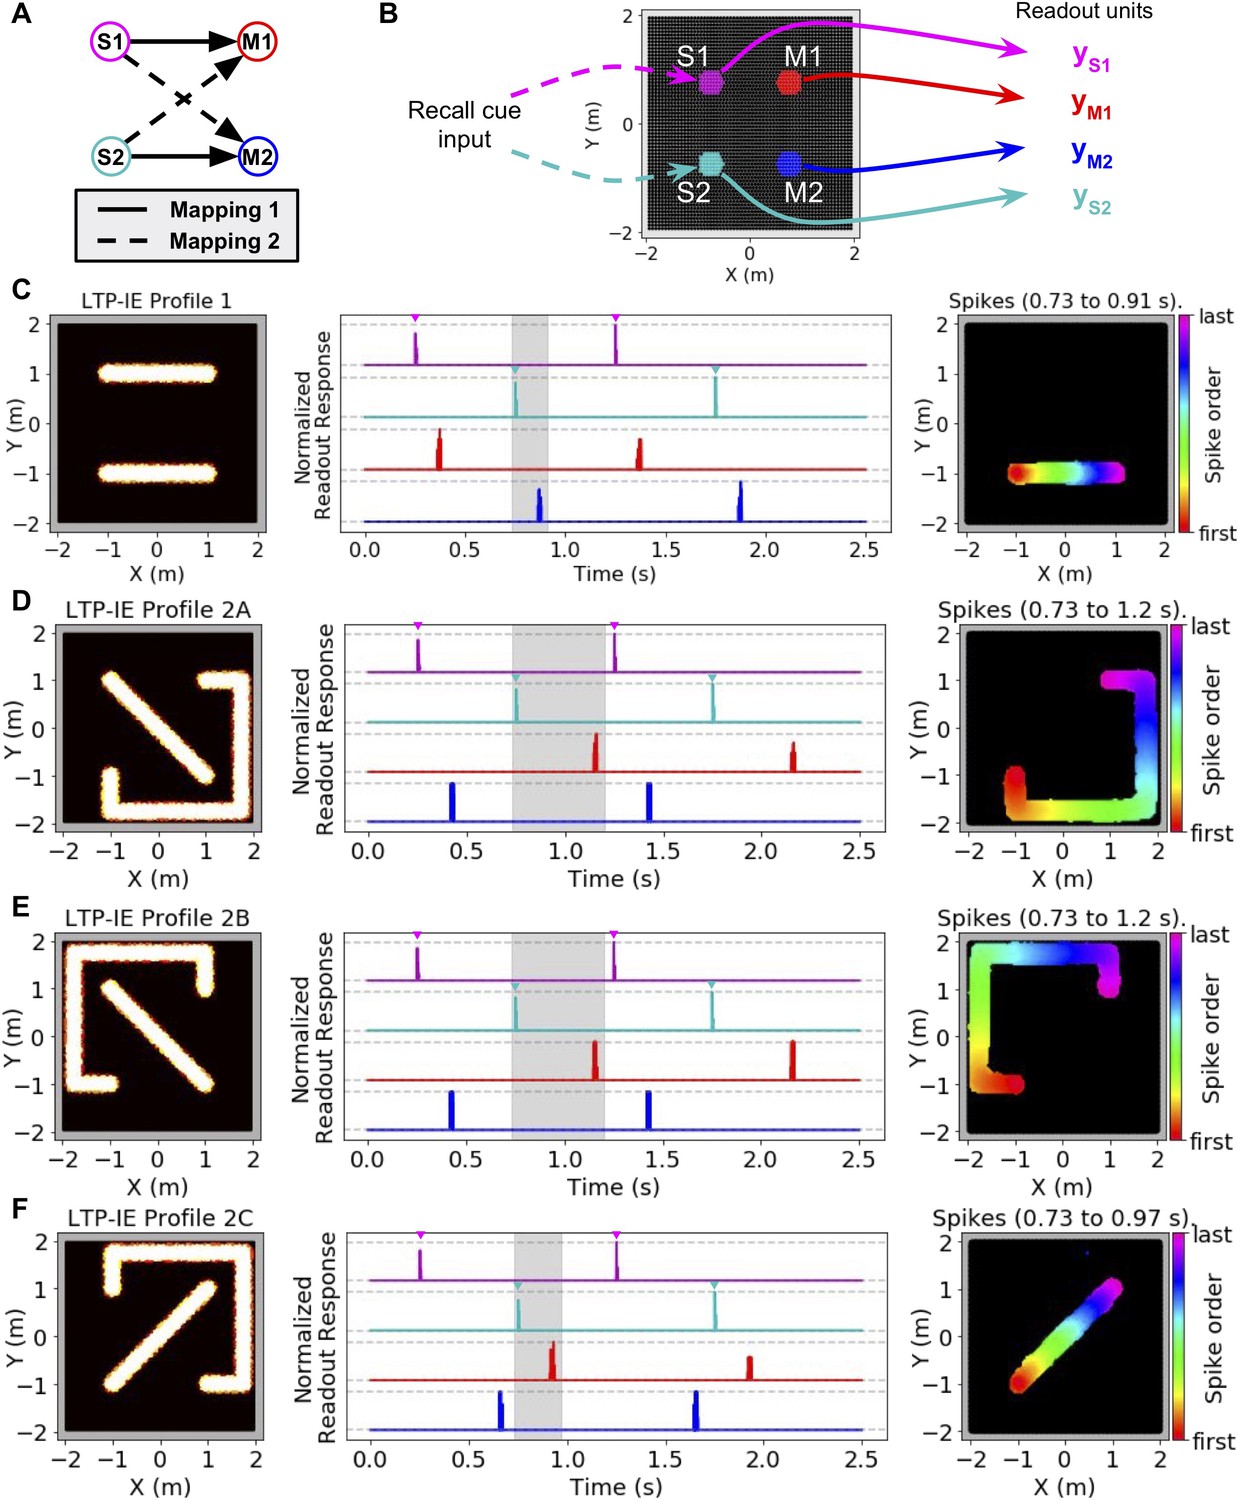
Using LTP-IE-based sequential activity propagation to maintain and decode pairwise associations.
Here we used a network with increased rG (200 Hz) and decreased wPC,G (0.5) and σmax (1.84), which decreased spontaneous activity without affecting propagation of sequences triggered by direct current injection (see Materials and methods). (A) Example of two different mappings between a pair of stimuli (S1, S2) and a pair of responses (M1, M2). In Mapping 1 (solid), activating S1 should activate M1, and activating S2 should activate M2. In Mapping 2 (dashed) activating S1 should activate M2, and activating S2 should activate M1. (B) Simulation protocol. Either S1 or S2 is activated with a recall cue (injected current input into colored cells). Readout units average all activity from either S1, S2, M1, or M2 units, indicated by colors. (C) Left: Example LTP-IE-based encoding of Mapping one with neurons laid out in 2-D space. Middle: Time-dependent readout responses (normalized to maximum readout response over the 2.5 s simulation), with colors corresponding to readout units depicted in B. S1 and S2 were each alternately activated 3 times by appropriate recall cue (direct current injection into the relevant neurons is indicated by the inverted colored triangles), and all readout responses were plotted. In this example, activating S1 (magenta) causes M1 (red) to activate, and activating S2 (cyan) causes M2 (blue) to activate, due to spike propagation along paths defined by LTP-IE profile in C-Left. Right: Order of first spikes of all neurons that spiked during shaded time period in C-Middle. (D) Example LTP-IE-based encoding of Mapping two with neurons laid out in same 2-D coordinate space as in C, along with readout responses and spike order during shaded epoch. (E) Same as C-D but for an LTP-IE profile encoding Mapping two that is distinct from that in D. (F) Same as D and E but for a third LTP-IE profile encoding Mapping 2.
Figure 5
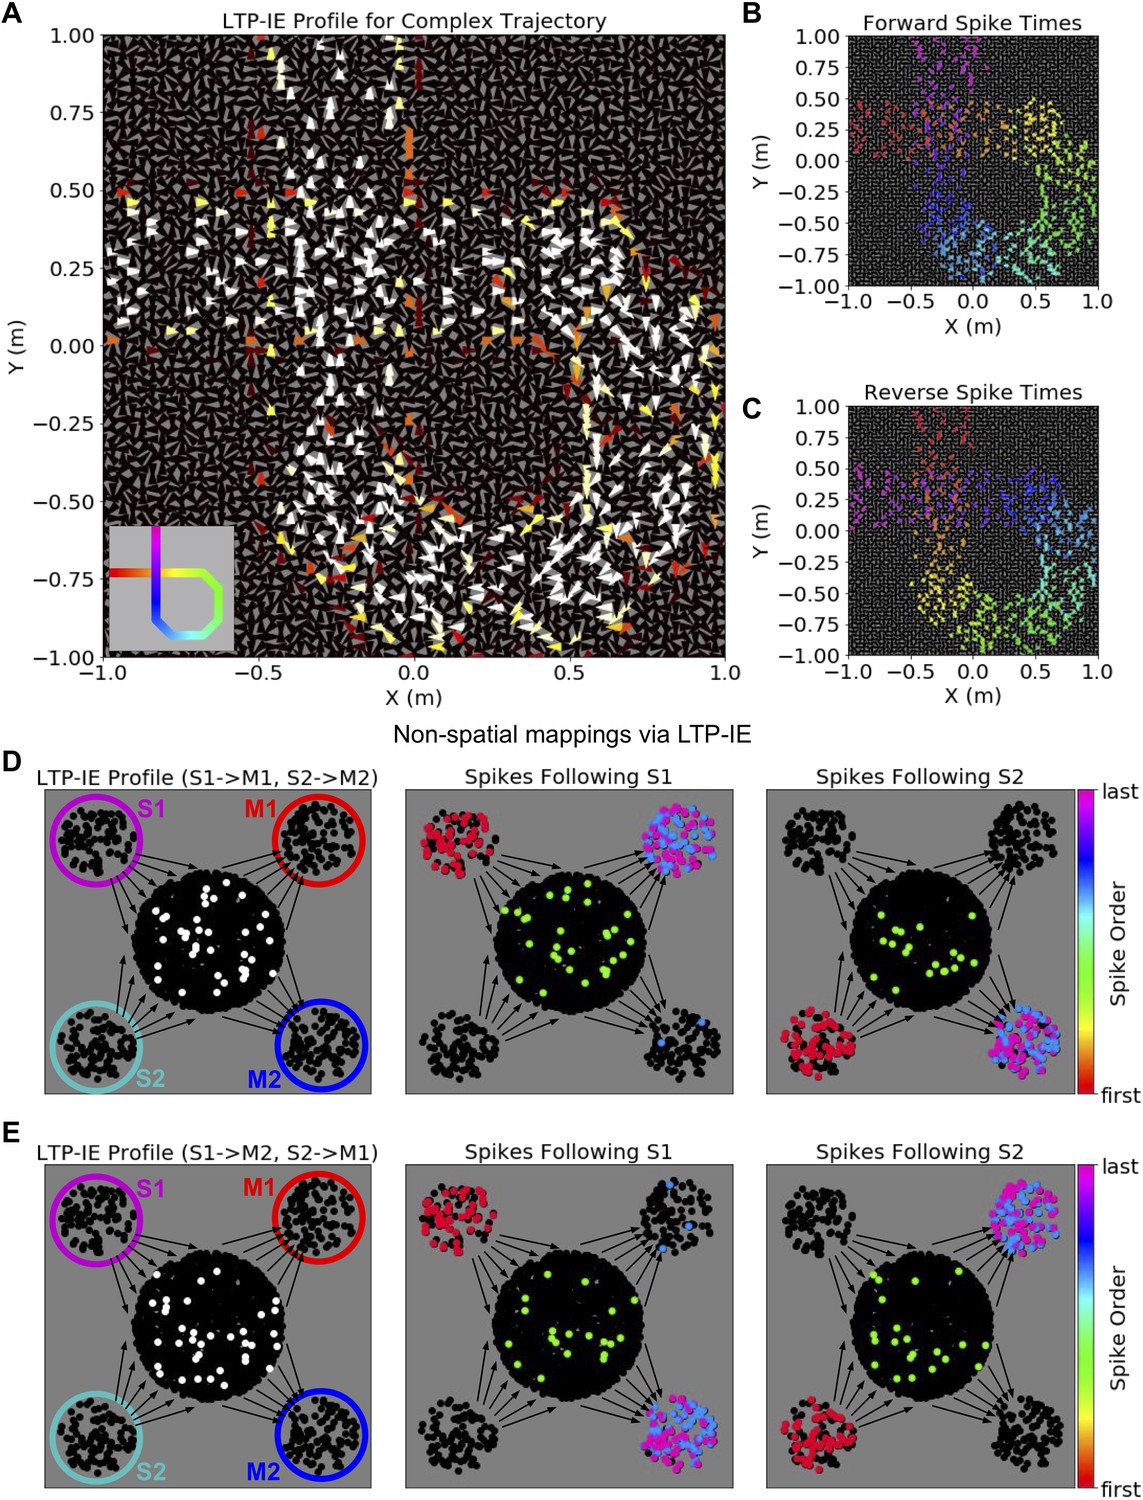
Complex sequences and non-spatial mappings via LTP-IE in our reduced network model.
(A) LTP-IE profile for self-intersecting trajectory in a network with cells tuned to both position and head direction. Each triangle corresponds to a single cell, with location indicating position tuning and triangle orientation indicating head-direction tuning. This LTP-IE profile corresponds to a ‘gamma’-shaped trajectory (inset) beginning at (−1,. 25) m and ending at (−0.25, 1) m, and which intersects itself at (−0.25,. 25) m. (B) ‘Forward’ cell activation sequence given the network and LTP-IE profile in A, triggered by current injection into cells with tuning near (−1,. 25) m. (C) ‘Reverse’ cell activation sequence given the network and LTP-IE profile in A, triggered by current injection into cells with tuning near (−0.25, 1) m. Colors in B, C indicate spike order, with same color code as in 2F. (D) Left: LTP-IE profile for one mapping between two stimuli (S1, S2) and two responses (M1, M2) in a network without spatial organization. (The only neurons tagged by LTP-IE were the ones shown in white, which had an LTP-IE level of σ = 2.) Each stimulus (magenta, cyan) or response (red, blue) is represented by an ensemble of 100 neurons, with the ‘switchboard ensemble’ containing 2000 neurons (recurrence with M1, M2 exists but is not depicted here); middle: spike order following current injection into the S1 neurons, leading to subsequent activation of M1; right: spike order following current injection into the S2 neurons, leading to subsequent activation of M2. (E) Left: As in D-Left, but with an LTP-IE profile encoding the opposite mapping from D; middle: spike order following current injection into the S1 neurons, leading to subsequent activation of M2; right: spike order following current injection into the S2 neurons, leading to subsequent activation of M1.
Additional files
-
Transparent reporting form
- https://doi.org/10.7554/eLife.44324.009
Download links
A two-part list of links to download the article, or parts of the article, in various formats.
Downloads (link to download the article as PDF)
Open citations (links to open the citations from this article in various online reference manager services)
Cite this article (links to download the citations from this article in formats compatible with various reference manager tools)
Fast and flexible sequence induction in spiking neural networks via rapid excitability changes
eLife 8:e44324.
https://doi.org/10.7554/eLife.44324


