Functional evaluation of transposable elements as enhancers in mouse embryonic and trophoblast stem cells
- Queen Mary University of London, United Kingdom
Figures
Figure 1 with 3 supplements
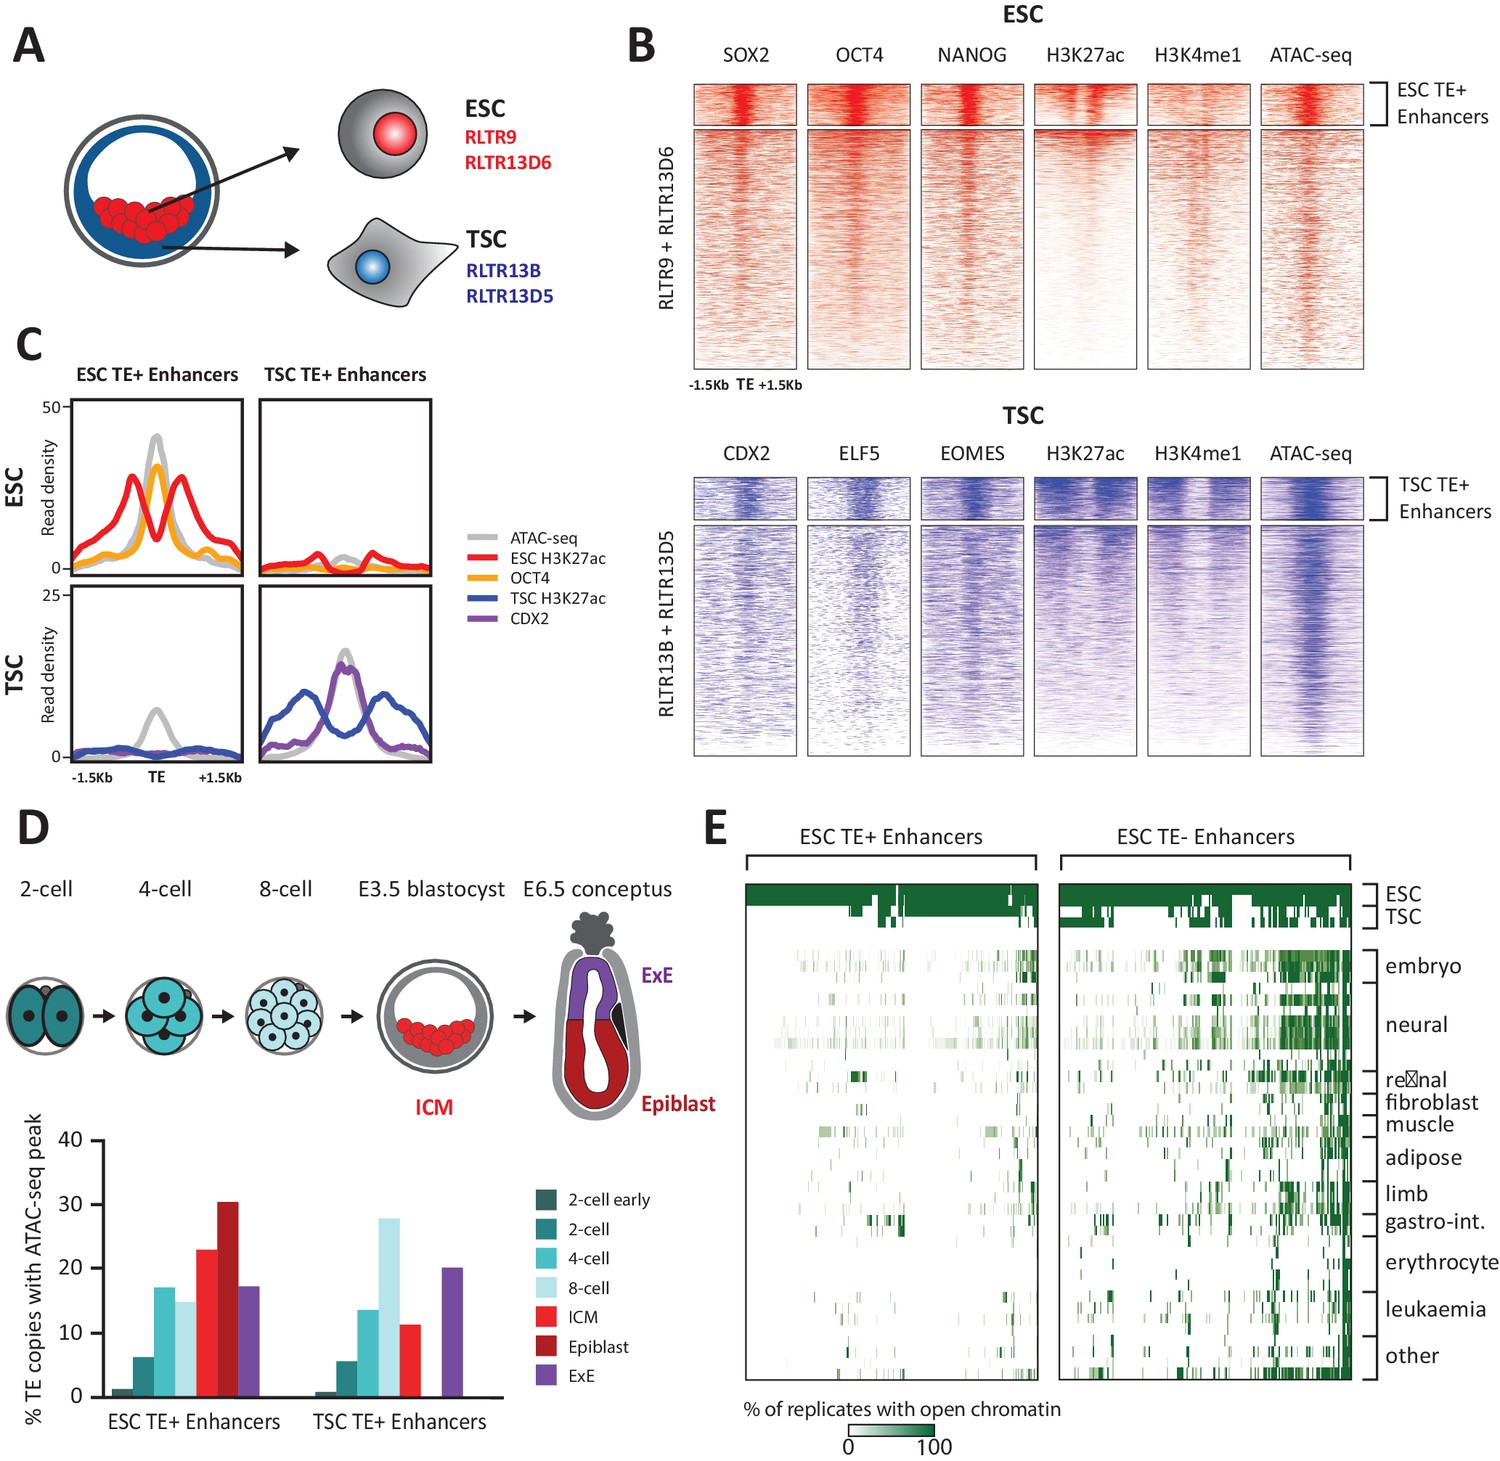
TE+ enhancers are highly tissue-specific.
(A) We focused on specific TE families that were previously associated with enhancer activity in ESCs and TSCs. (B) ChIP-seq and ATAC-seq profiles show how the selected ESC and TSC TE+ enhancers are highly enriched for cell-specific TFs, enhancer-associated chromatin marks, and open chromatin. (C) Comparison of average TE+ enhancer ChIP-seq and ATAC-seq profiles between ESCs and TSCs demonstrate that enhancer-like profiles are cell-specific with respect to each group of enhancer families. (D) Analysis of ATAC-seq data from pre- and post-implantation embryos, displaying the percentage of ESC and TSC TE+ enhancers with open chromatin in each stage/tissue. (E) Analysis of ENCODE DNase-seq data from multiple tissues, displaying overlaps of open chromatin regions with TE+ and TE- enhancers in ESCs. For each TE, the colour intensity is proportional to the percentage of replicates of the same tissue that overlapped an open chromatin region.
Figure 1—figure supplement 1
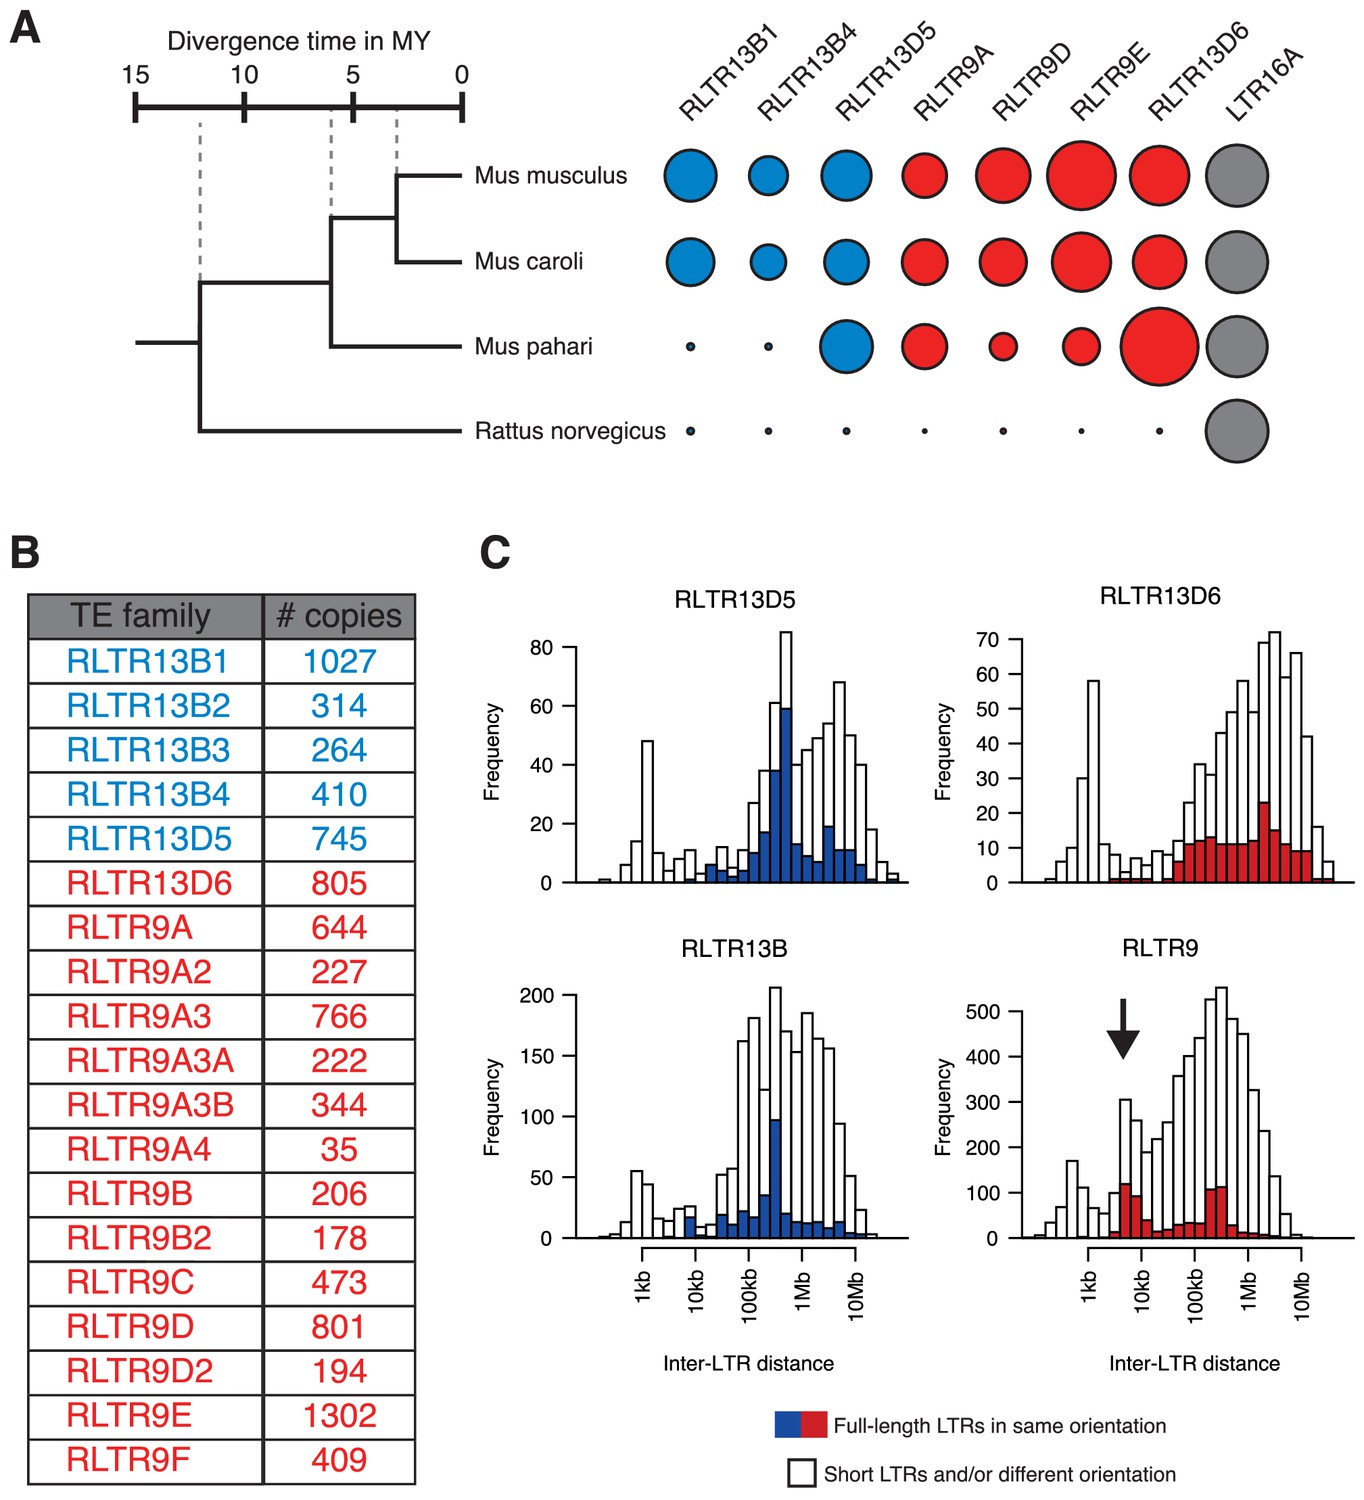
Genomic characteristics of selected TE families.
(A) Relative abundance of a subset of the TE families considered in this study across different rodent species, providing an indication of their age. Data were extracted from published Repeatmasker analyses (Thybert et al., 2018). (B) Copy numbers of all TE families considered, as per the Repeatmasker annotation of the mm10 genome build. (C) Identification of putative proviral elements by assessing the distance between consecutive LTRs of the same family, their length, and their relative arrangement. Putative proviral elements (indicated by the arrow in the RLTR9 group) contain a pair of full-length LTRs (>95% of median length) in the same orientation and lying 5–10 kb apart.
Figure 1—figure supplement 2
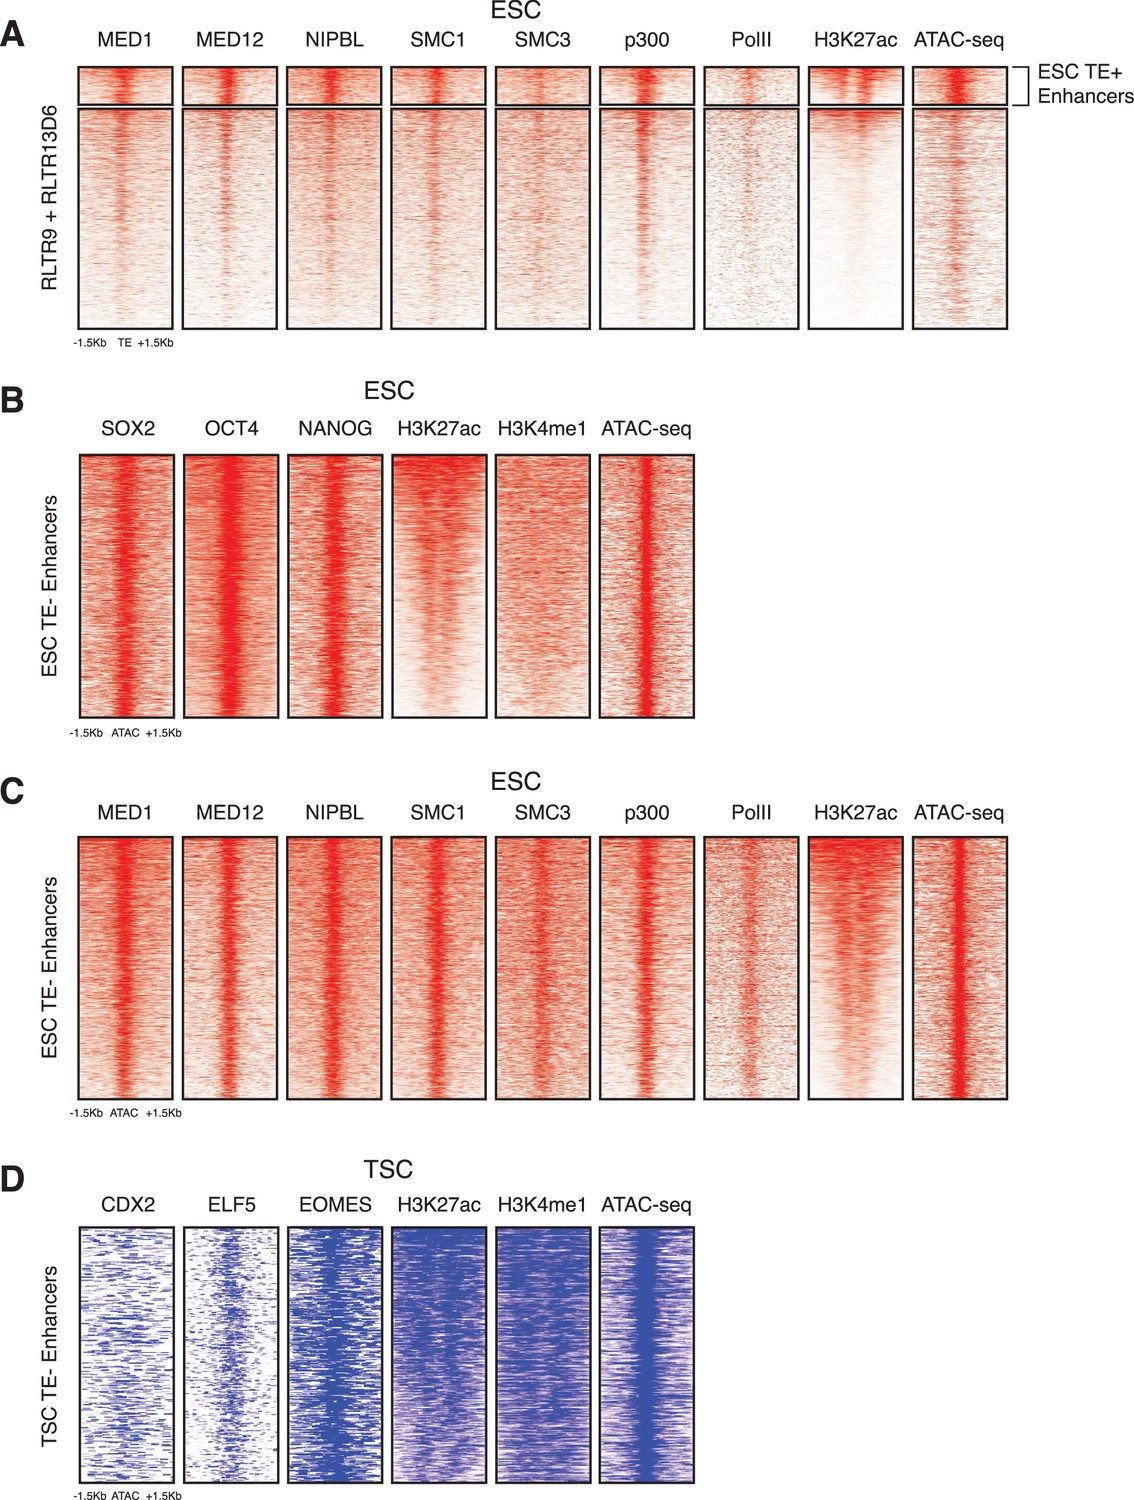
Additional chromatin profiles of TEs and enhancers.
(A) RLTR13D6 and RLTR9 ChIP-seq profiles for Mediator and cohesin complex components, p300 and RNA polymerase II, which are commonly associated with active enhancers. (B) ChIP-seq and ATAC-seq profiles of ESC TE- enhancers, using the same data as in Figure 1B. (C) Additional ChIP-seq profiles of TE- enhancers, using the same data as in panel A. (D) ChIP-seq and ATAC-seq profiles of TSC TE- enhancers, using the same data as in Figure 1B.
Figure 1—figure supplement 3
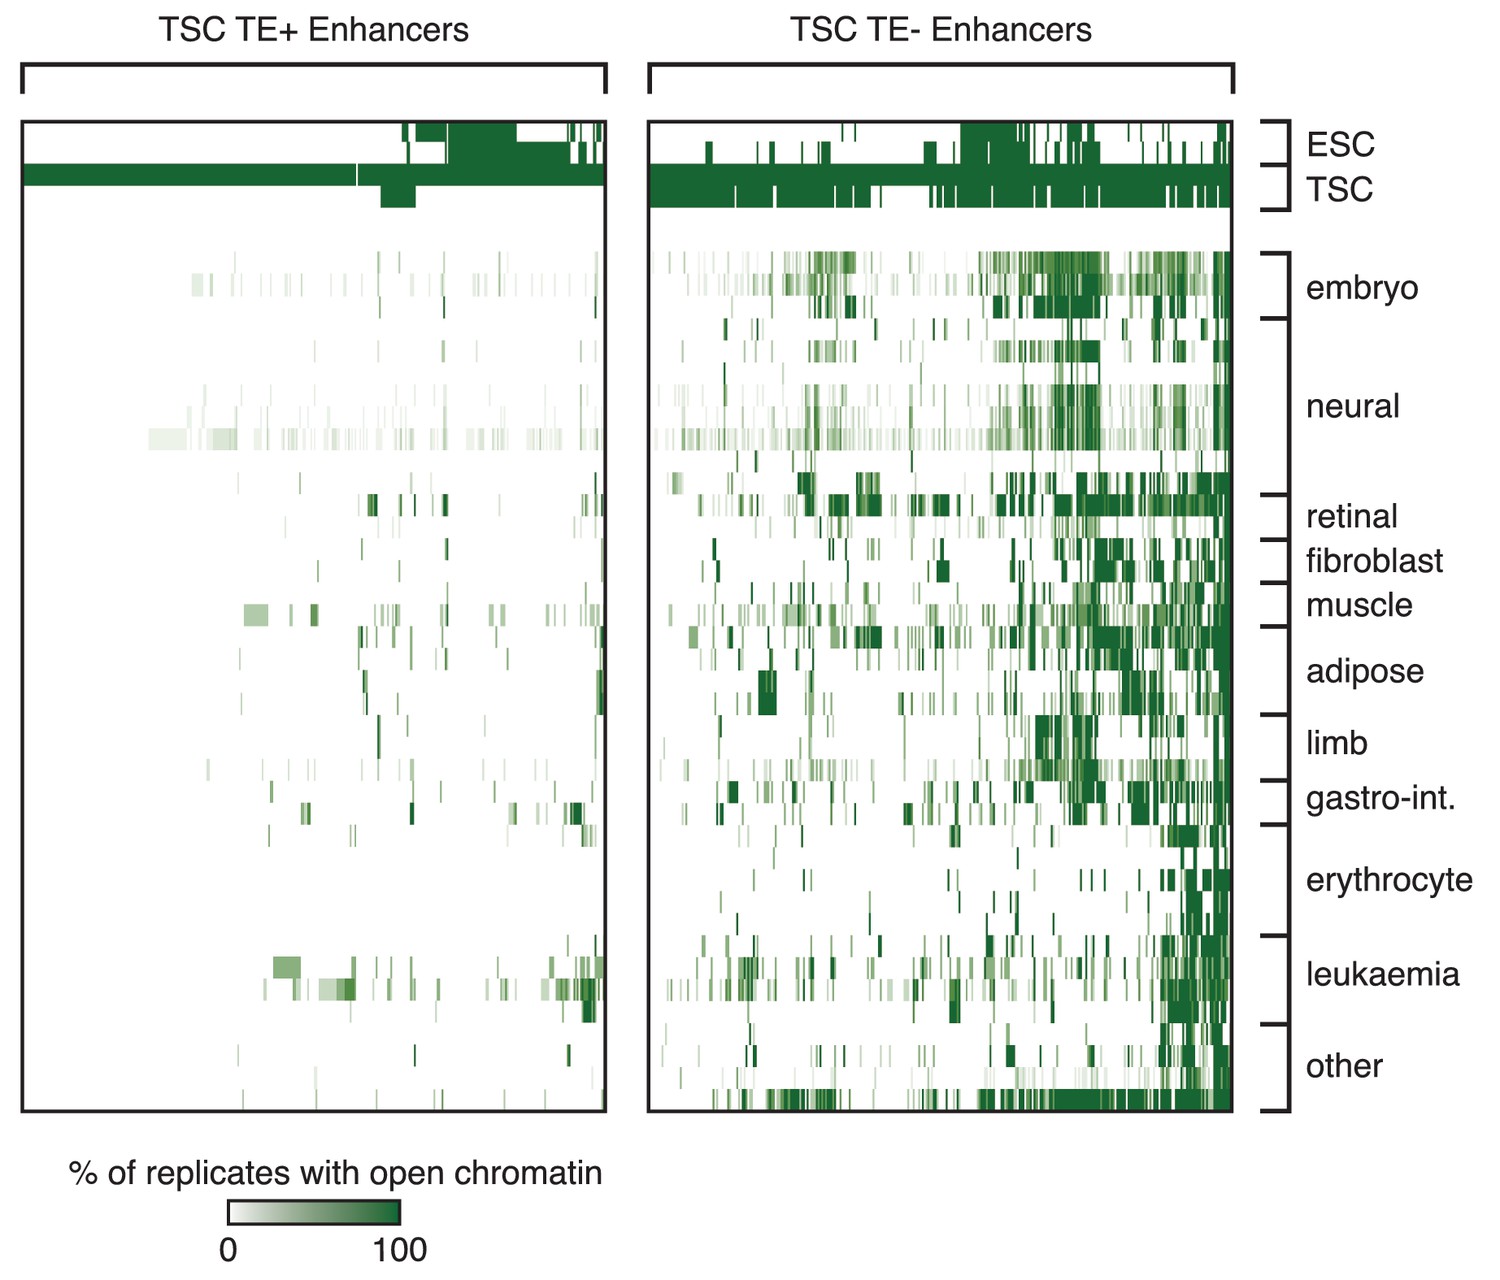
Tissue specificity of TSC TE+ enhancers.
Analysis of ENCODE DNase-seq data from multiple tissues, displaying overlaps of open chromatin regions with TE+ and TE- enhancers in TSCs. For each TE, the colour intensity is proportional to the percentage of replicates of the same tissue that overlapped an open chromatin region.
Figure 2 with 1 supplement

TF motifs do not predict TE enhancer potential.
(A,B) Abundance of TF motifs at TE+ enhancers and non-enhancer TEs from RLTR9E (A) and RLTR13D6 (B) families. Purple data points refer to the co-occurrence of multiple TF motifs in the same element. Inset: length distribution of elements in each category (****p<0.0001, Kolmogorov-Smirnov test); only elements longer than 60% of the maximum length (red line) were used for motif analysis. (C) A minority of TE copies with enhancer activity in a reporter-based assay (FIREWACh) harbour SOX2, NANOG or OCT4 motifs, as indicated in green. (D) Analysis of BS-seq and TAB-seq data shows that non-enhancer TEs display higher levels of DNA methylation than TE+ enhancers and only moderately higher levels of hydroxymethylation (***p<1E-10, Wilcoxon test). (E) DNase-seq and H3K27ac ChIP-seq profiles of TE+ enhancers and non-enhancer TEs in wildtype and Dnmt TKO ESCs, showing similar profiles between both cell lines.
Figure 2—figure supplement 1
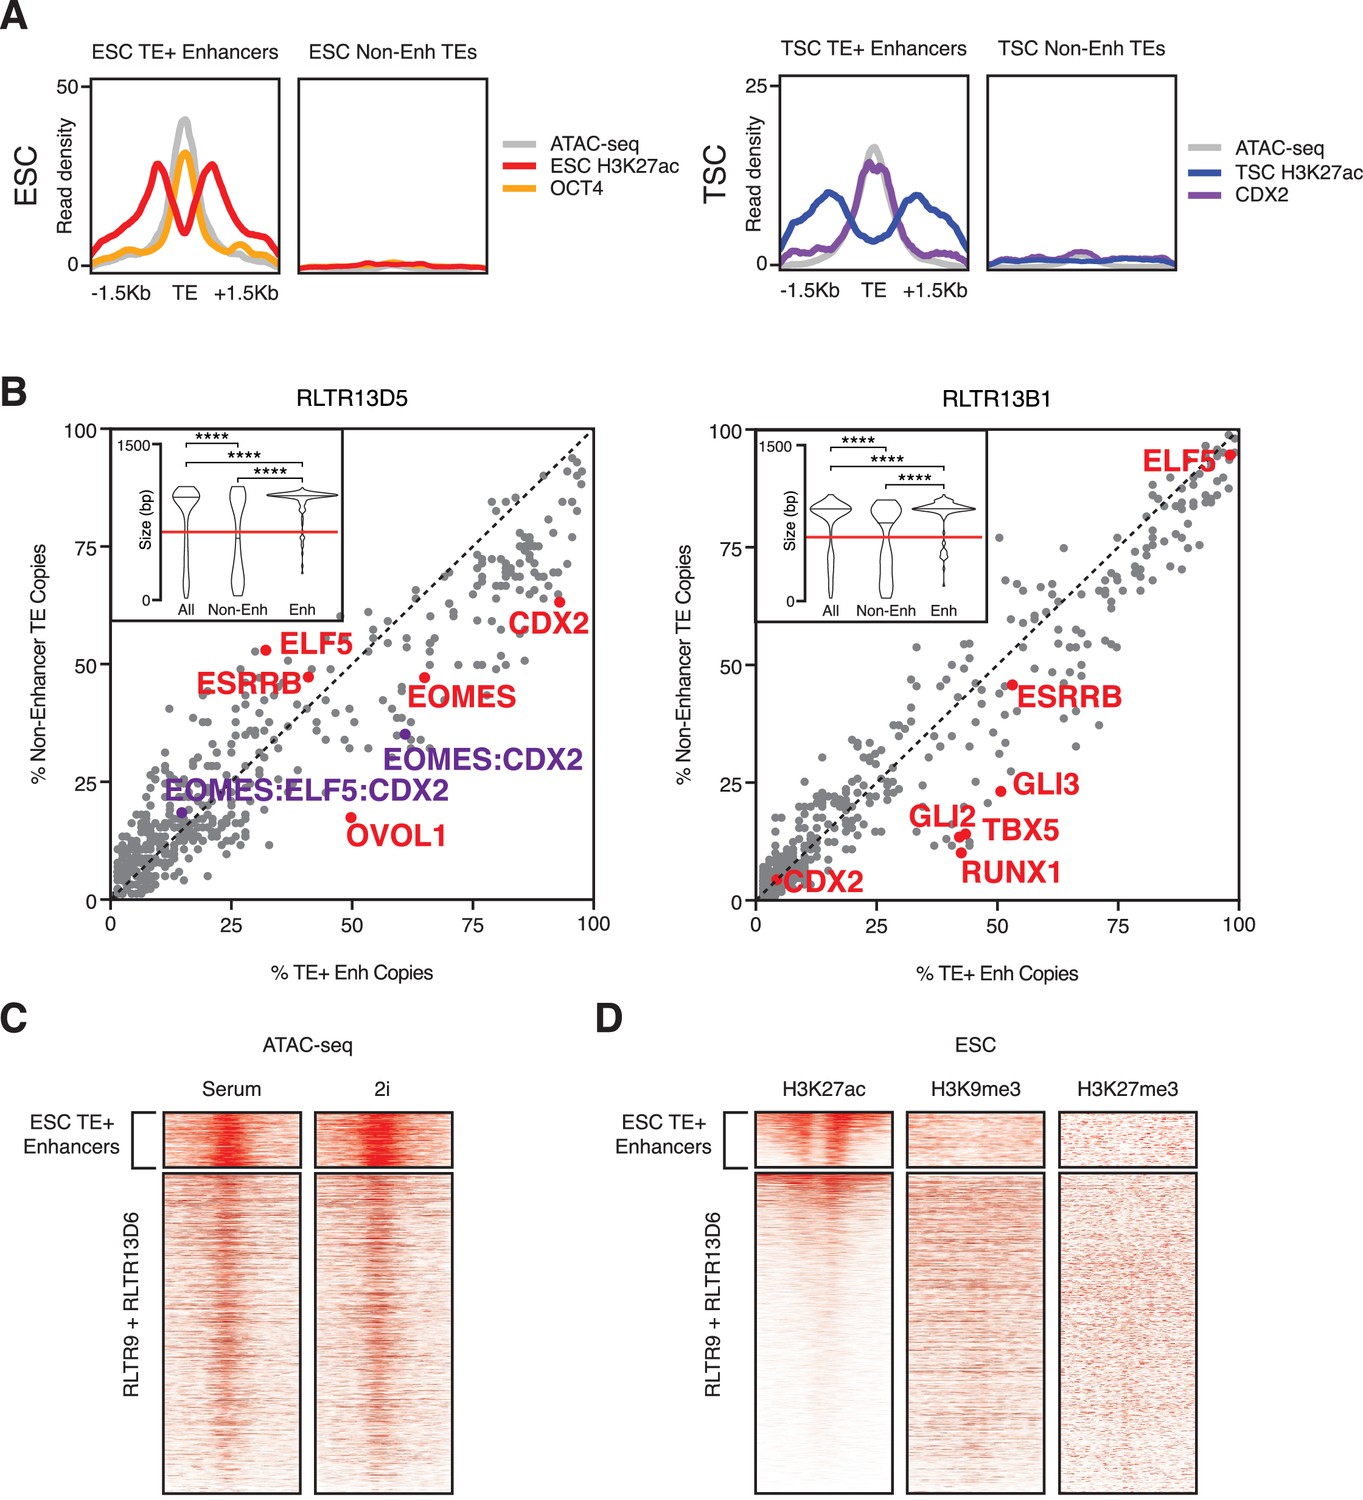
Additional comparisons between TE+ enhancers and non-enhancer TEs.
(A) Average ChIP-seq and ATAC-seq profiles of selected non-enhancer TEs, compared with TE+ enhancers of the same families. (B) Abundance of TF motifs at TSC TE+ enhancers and non-enhancer TEs from RLTR13D5 and RLTR13B1 subfamilies. Purple data points refer to the co-occurrence of multiple TF motifs in the same element. Inset: length distribution of elements in each category (****p<0.0001, Kolmogorov-Smirnov test); only elements longer than 60% of the maximum length (red line) were used for motif analysis. (C) ATAC-seq profiles of RLTR13D6 and RLTR9 elements in serum- or 2i-grown ESCs, showing similar profiles between both cell culture conditions. (D) ChIP-seq profiles of RLTR13D6 and RLTR9 elements for H3K9me3 and H3K27me3, suggesting that non-enhancer TEs are not repressed by these marks.
Figure 3 with 2 supplements
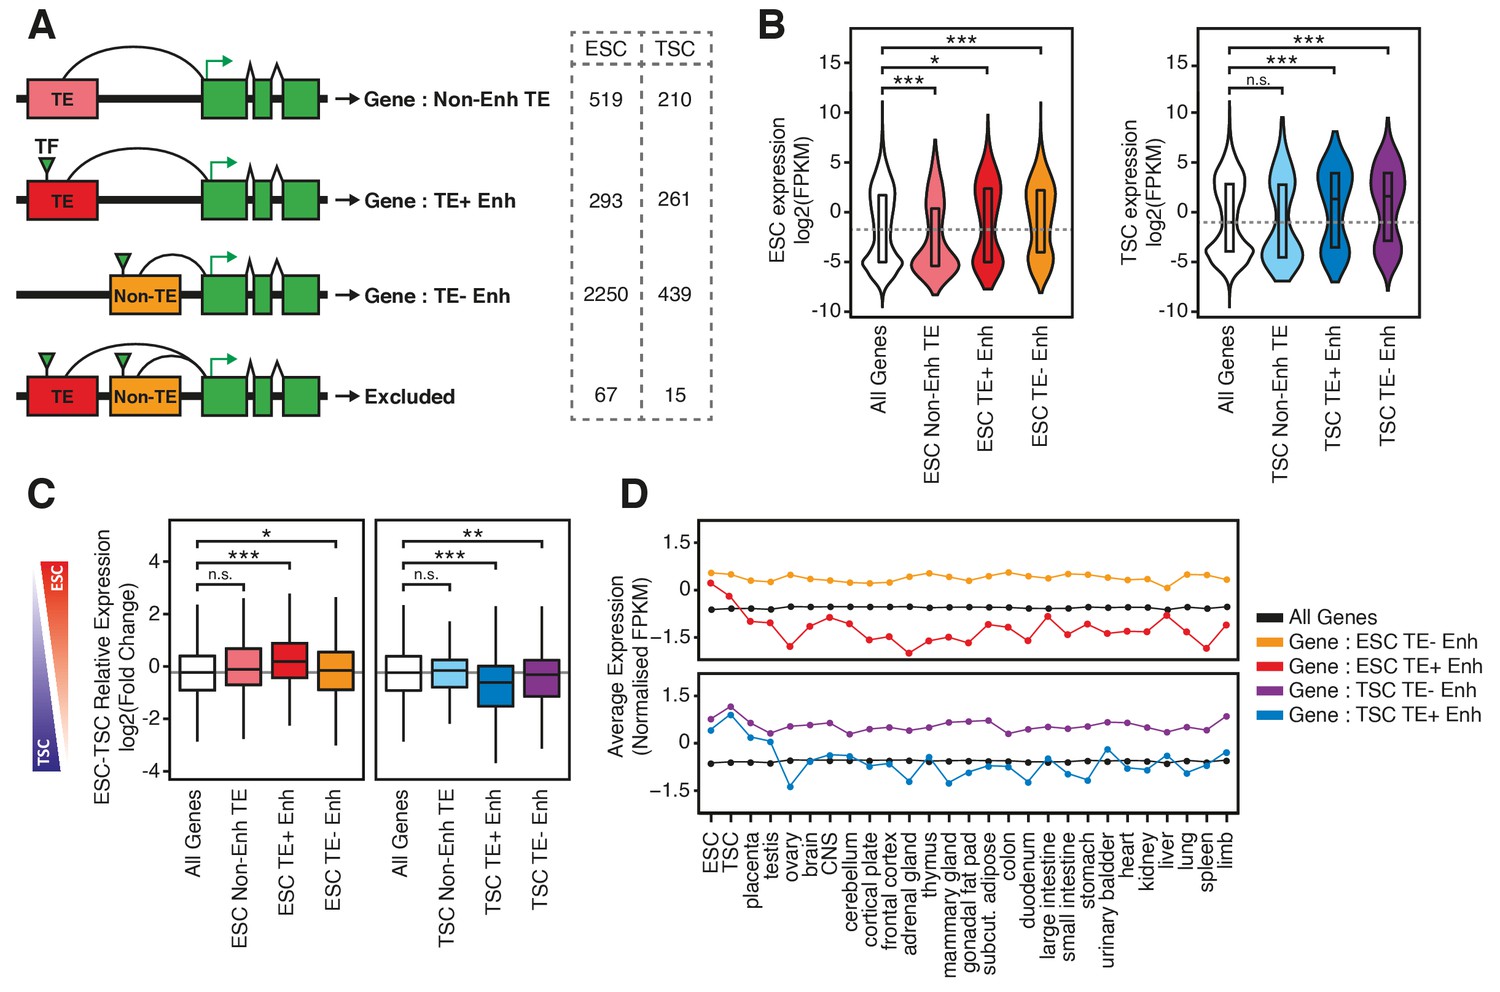
TE+ enhancers interact with tissue-specific genes.
(A) Different types of elements were linked with genes and their expression levels based on PCHi-C data. Genes interacting with both TE+ and TE- enhancers were not considered. Numbers of gene promoters in each group are shown. (B) ESC and TSC expression levels for genes interacting with each of the groups indicated in A, and compared with the full distribution of expression levels (*p<0.05, ***p<0.001, ANOVA with Holm-Sidak’s post-hoc test). (C) Relative expression levels (ESC/TSC ratio) for genes expressed in at least one of the two cell types (*p<0.05, **p<0.01, ***p<0.001, ANOVA with Holm-Sidak’s test). (D) Average expression levels of ENCODE RNA-seq datasets from multiple tissues, compared with data from ESCs and TSCs. Data were normalised through distribution matching.
Figure 3—figure supplement 1
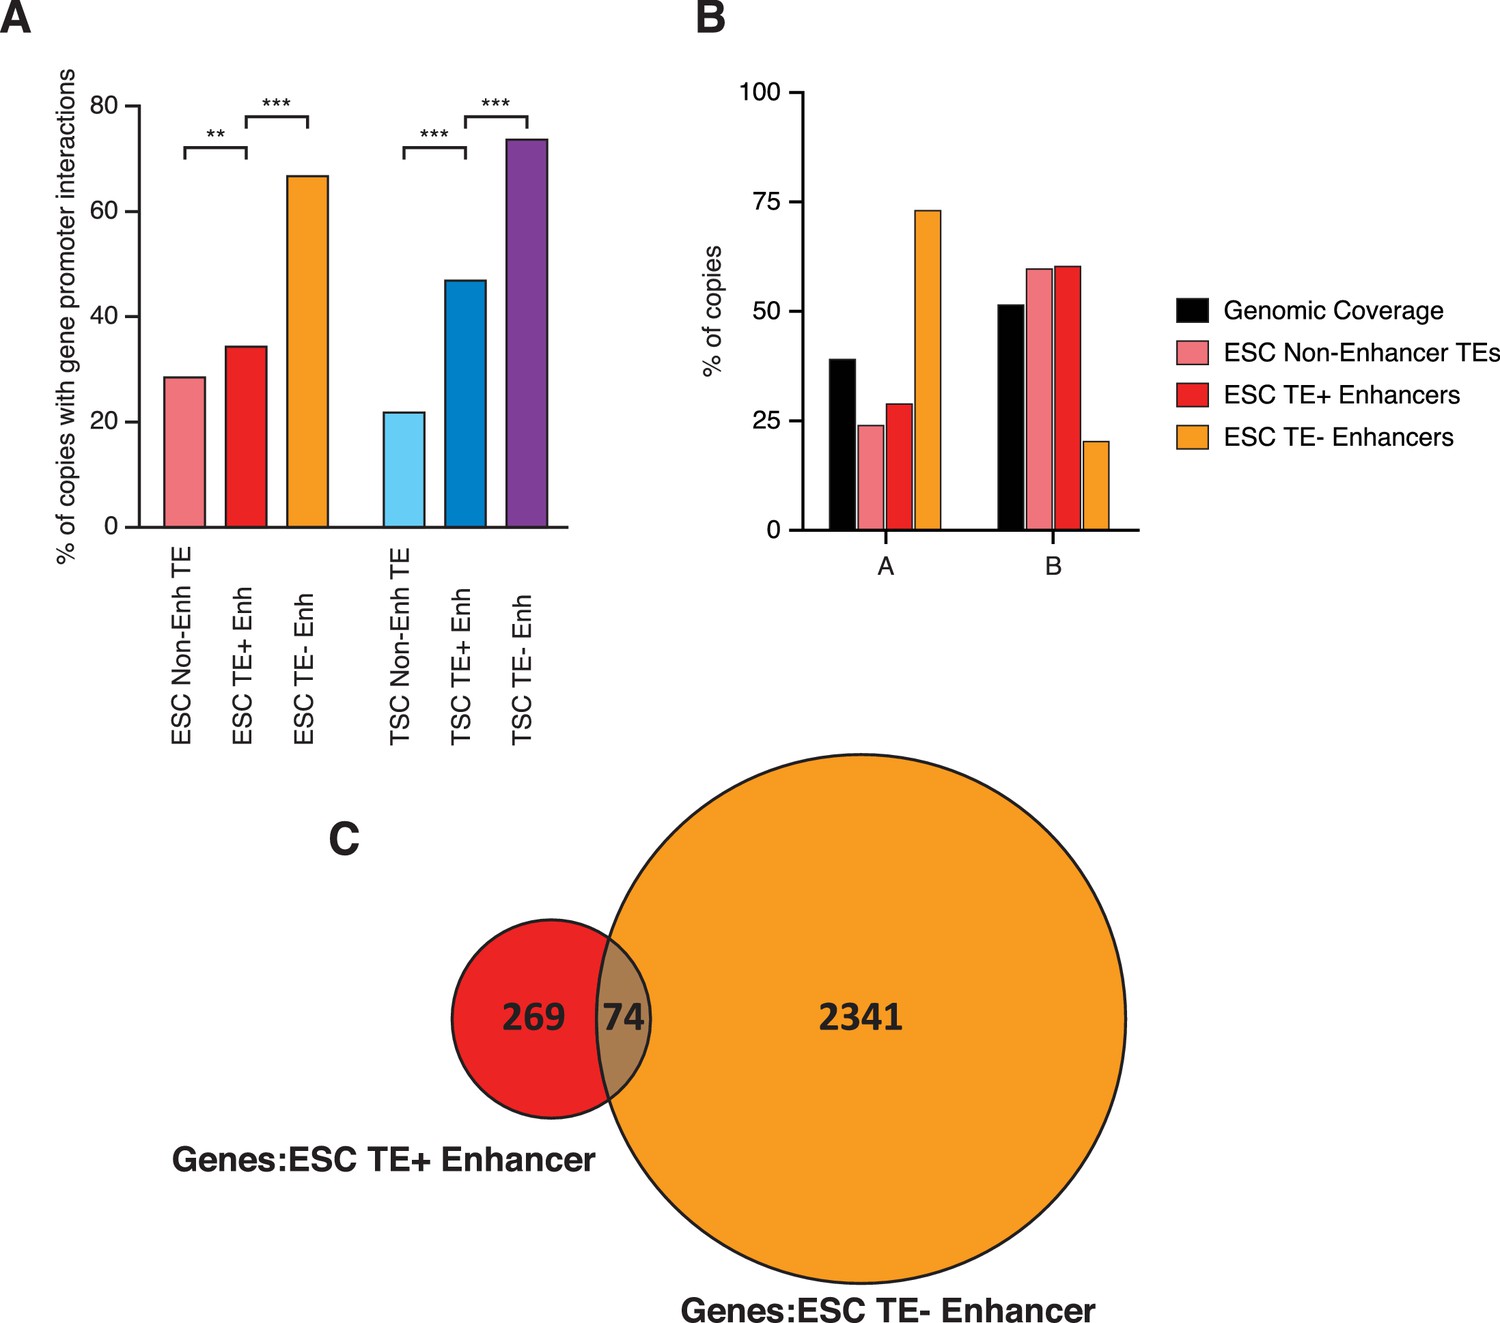
Spatial arrangement of TEs and enhancers.
(A) Proportion of elements interacting with at least one gene promoter in PCHi-C data from ESCs or TSCs (**p<0.01, ***p<0.001, proportions test with Benjamini-Hochberg correction). (B) Proportion of elements within A (gene-rich, active) or B (gene-poor, inactive) spatial compartments, with the overall genomic coverage of each compartment shown for comparison. ESC compartment data are from Bonev et al. (2017). (C) Venn diagram of genes contacted by TE+ or TE- enhancers in ESCs, showing only a small overlap between the two. Genes in common between the two groups were not considered for downstream analyses.
Figure 3—figure supplement 2
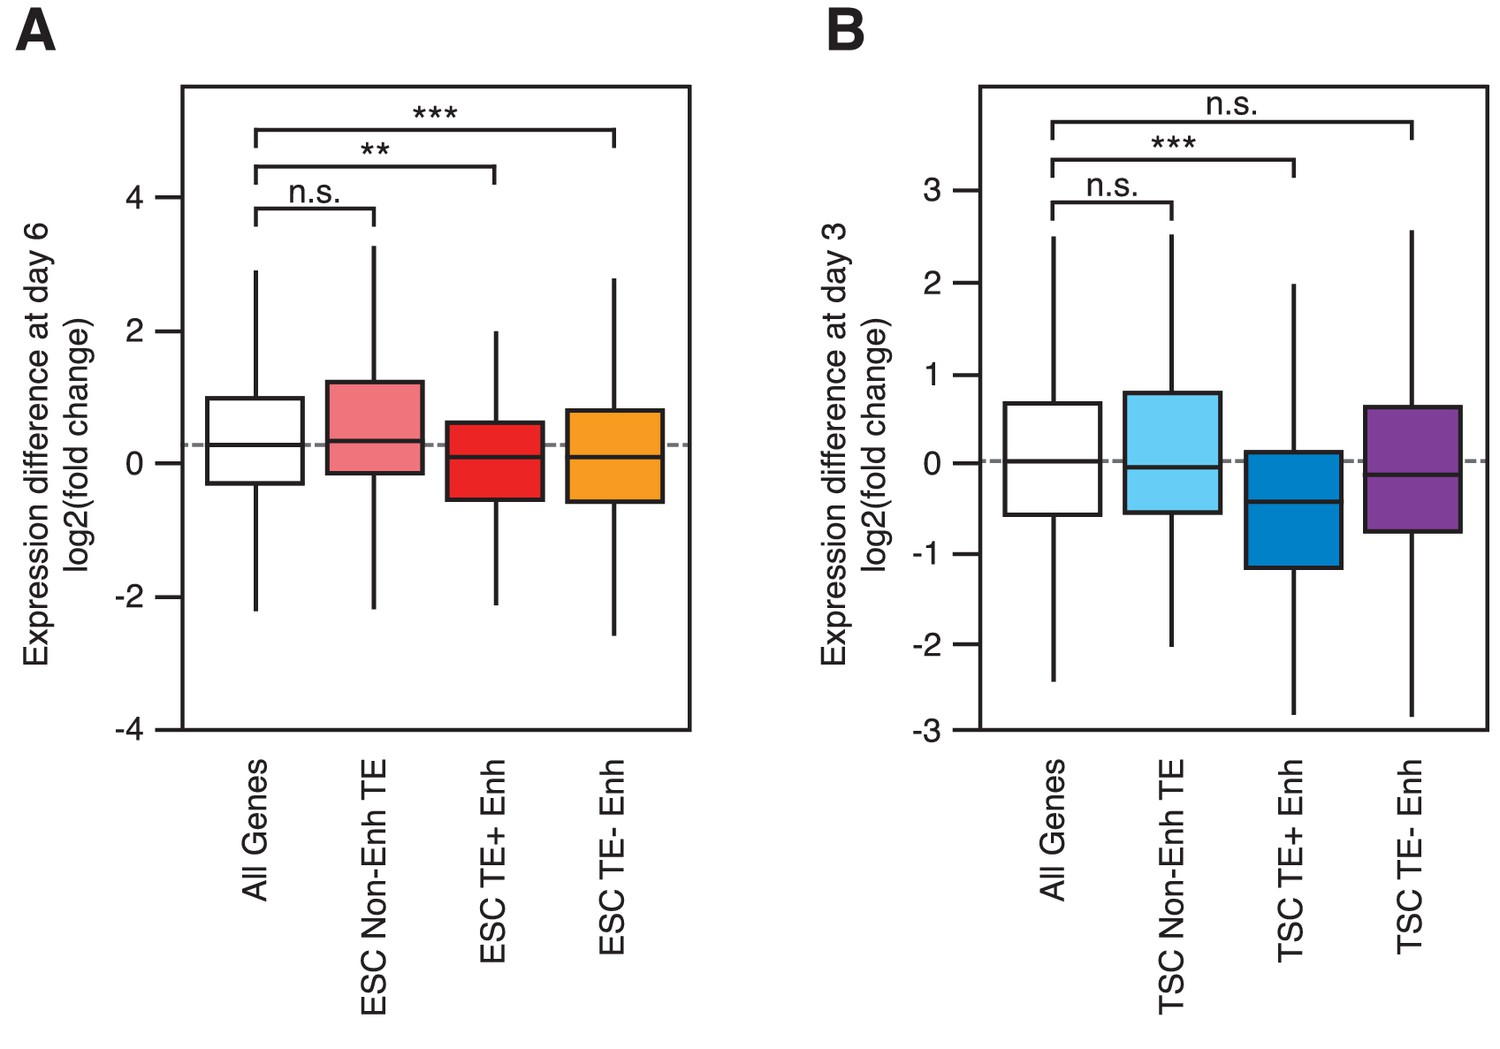
Gene expression changes during early differentiation.
RNA-seq data from differentiating ESCs (A) and TSCs (B), showing fold change in expression of genes interacting with each of the groups indicated in Figure 3A (**p<0.01, ***p<0.001, ANOVA with Holm-Sidak’s test).
Figure 4 with 3 supplements
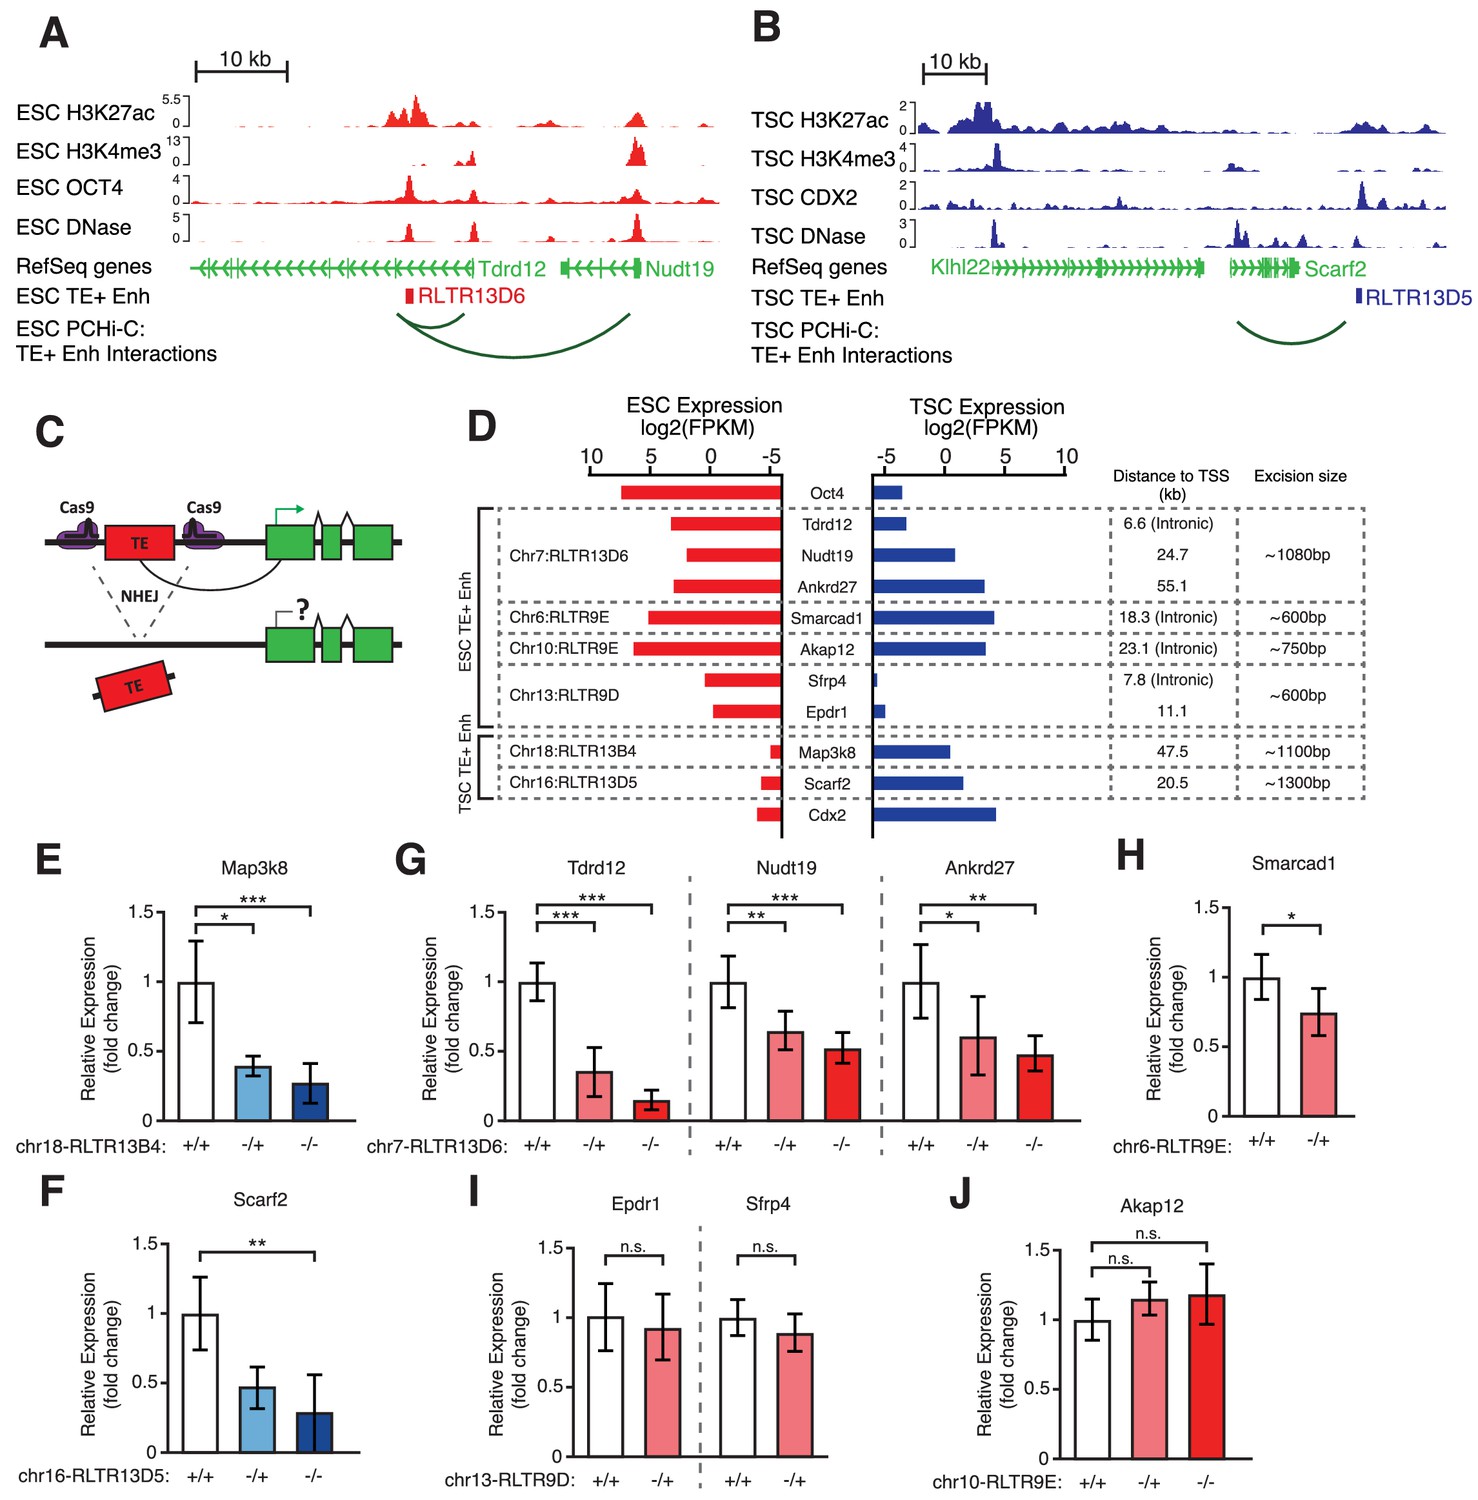
Genetic editing identifies regulatory TEs from candidate TE+ enhancers.
(A,B) Genome browser snapshots showing examples of candidate TE+ enhancers in ESCs (A) or TSCs (B). ChIP-seq and DNase-seq tracks are displayed, as well as PCHi-C-identified interactions between gene promoters and the respective TE+ enhancer. (C) Schematic of the CRISPR strategy for genetically excising TE+ enhancers. (D) Expression values from RNA-seq data for the genes interacting with TE+ enhancers that were genetically excised. The expression levels for Oct4 and Cdx2 are also displayed as a comparison term. Additional details about the relative location of the TE and the size of the excision are displayed. (E–J) RT-qPCR data from TSC (E–F) or ESC (G–J) clones isolated from CRISPR experiments targeted to the indicated TE+ enhancers. Values are mean ± s.d. from the following number of independent clones: 3 +/+, 2 -/+, 8 -/- (E); 3 +/+, 3 -/+, 6 -/- (F); 3 +/+, 3 -/+, 4 -/- (G); 2 +/+, 2 -/+ (H); 2 +/+, 2 -/+ (I); 2 +/+, 2 -/+, 2 -/- (J). For H-J, where clone numbers are low, expression values from three different passage numbers were included for each clone. *p<0.05, **p<0.01, ***p<0.001, ANOVA with Tukey post-hoc test.
Figure 4—figure supplement 1
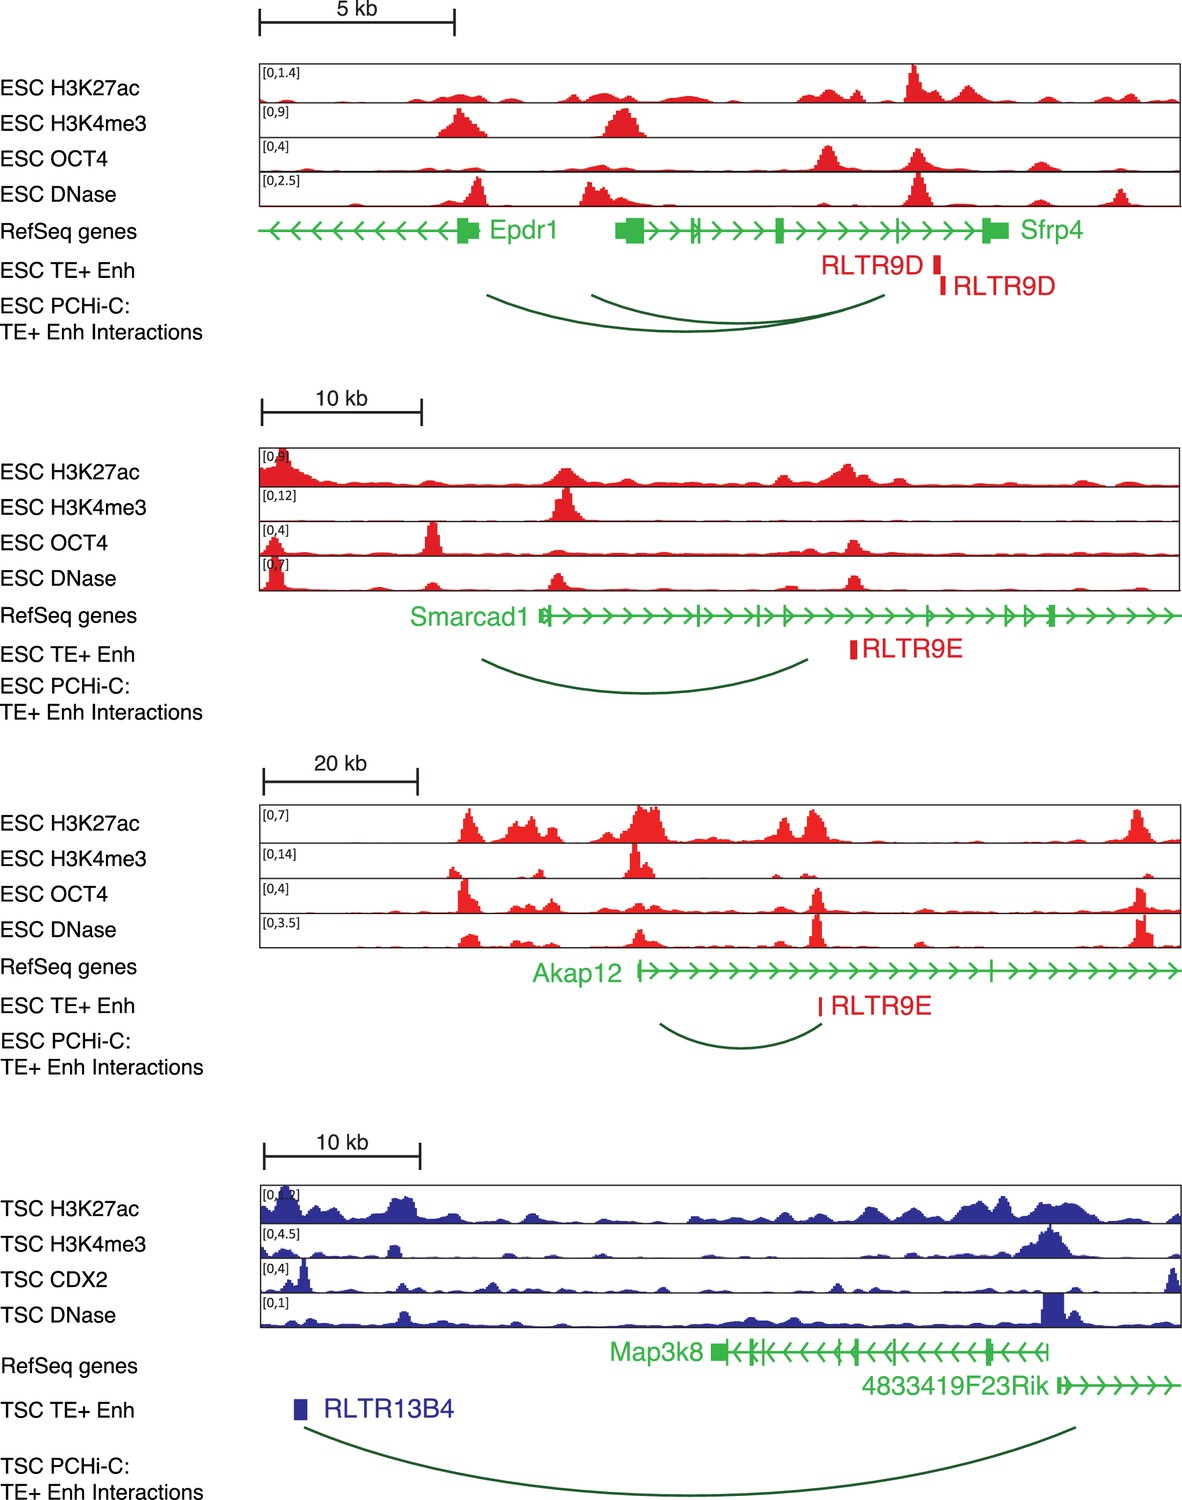
Additional profiles of candidate TE+ enhancers.
Genome browser snapshots of TEs selected for genetic editing in ESCs or TSCs.
Figure 4—figure supplement 2
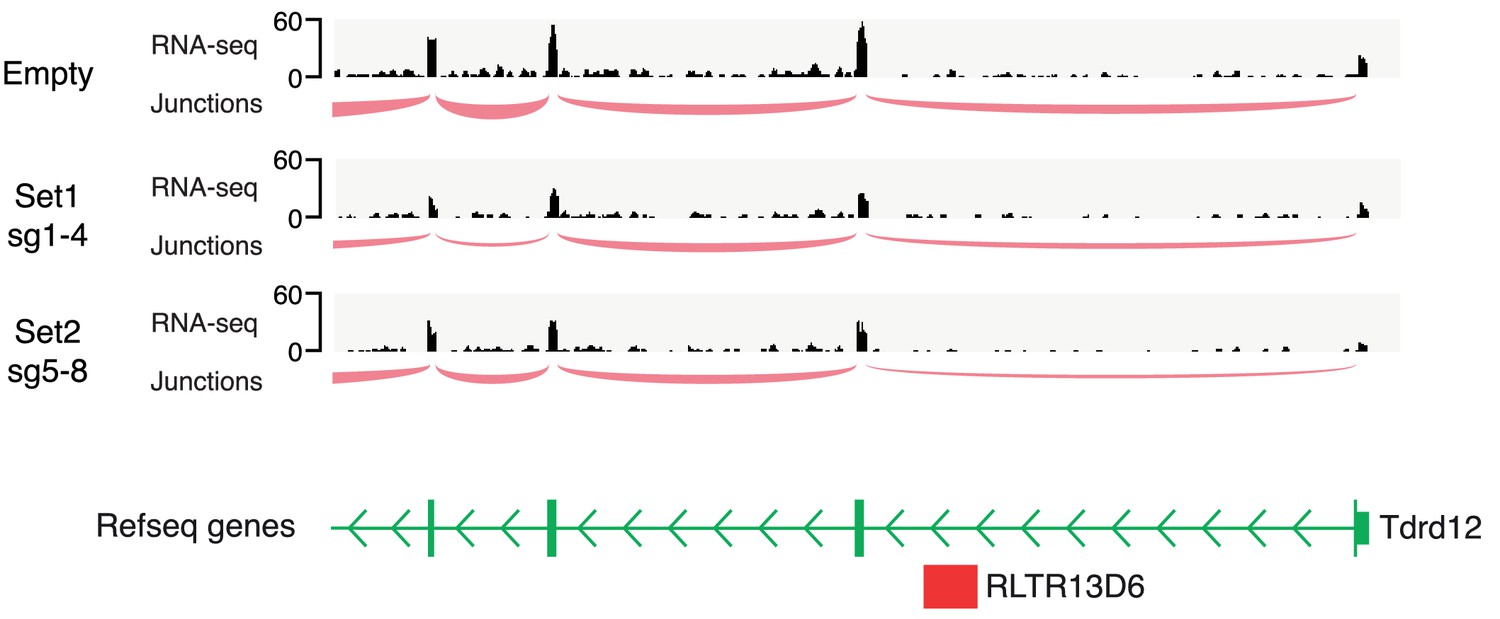
Tdrd12 transcriptional profile.
Genome browser snapshot of the Tdrd12 gene displaying RNA-seq data from our CRISPRi experiments in ESCs. Read coverage and splice junction information provide no evidence for use of the intronic RLTR13D6 element as an alternative promoter.
Figure 4—figure supplement 3
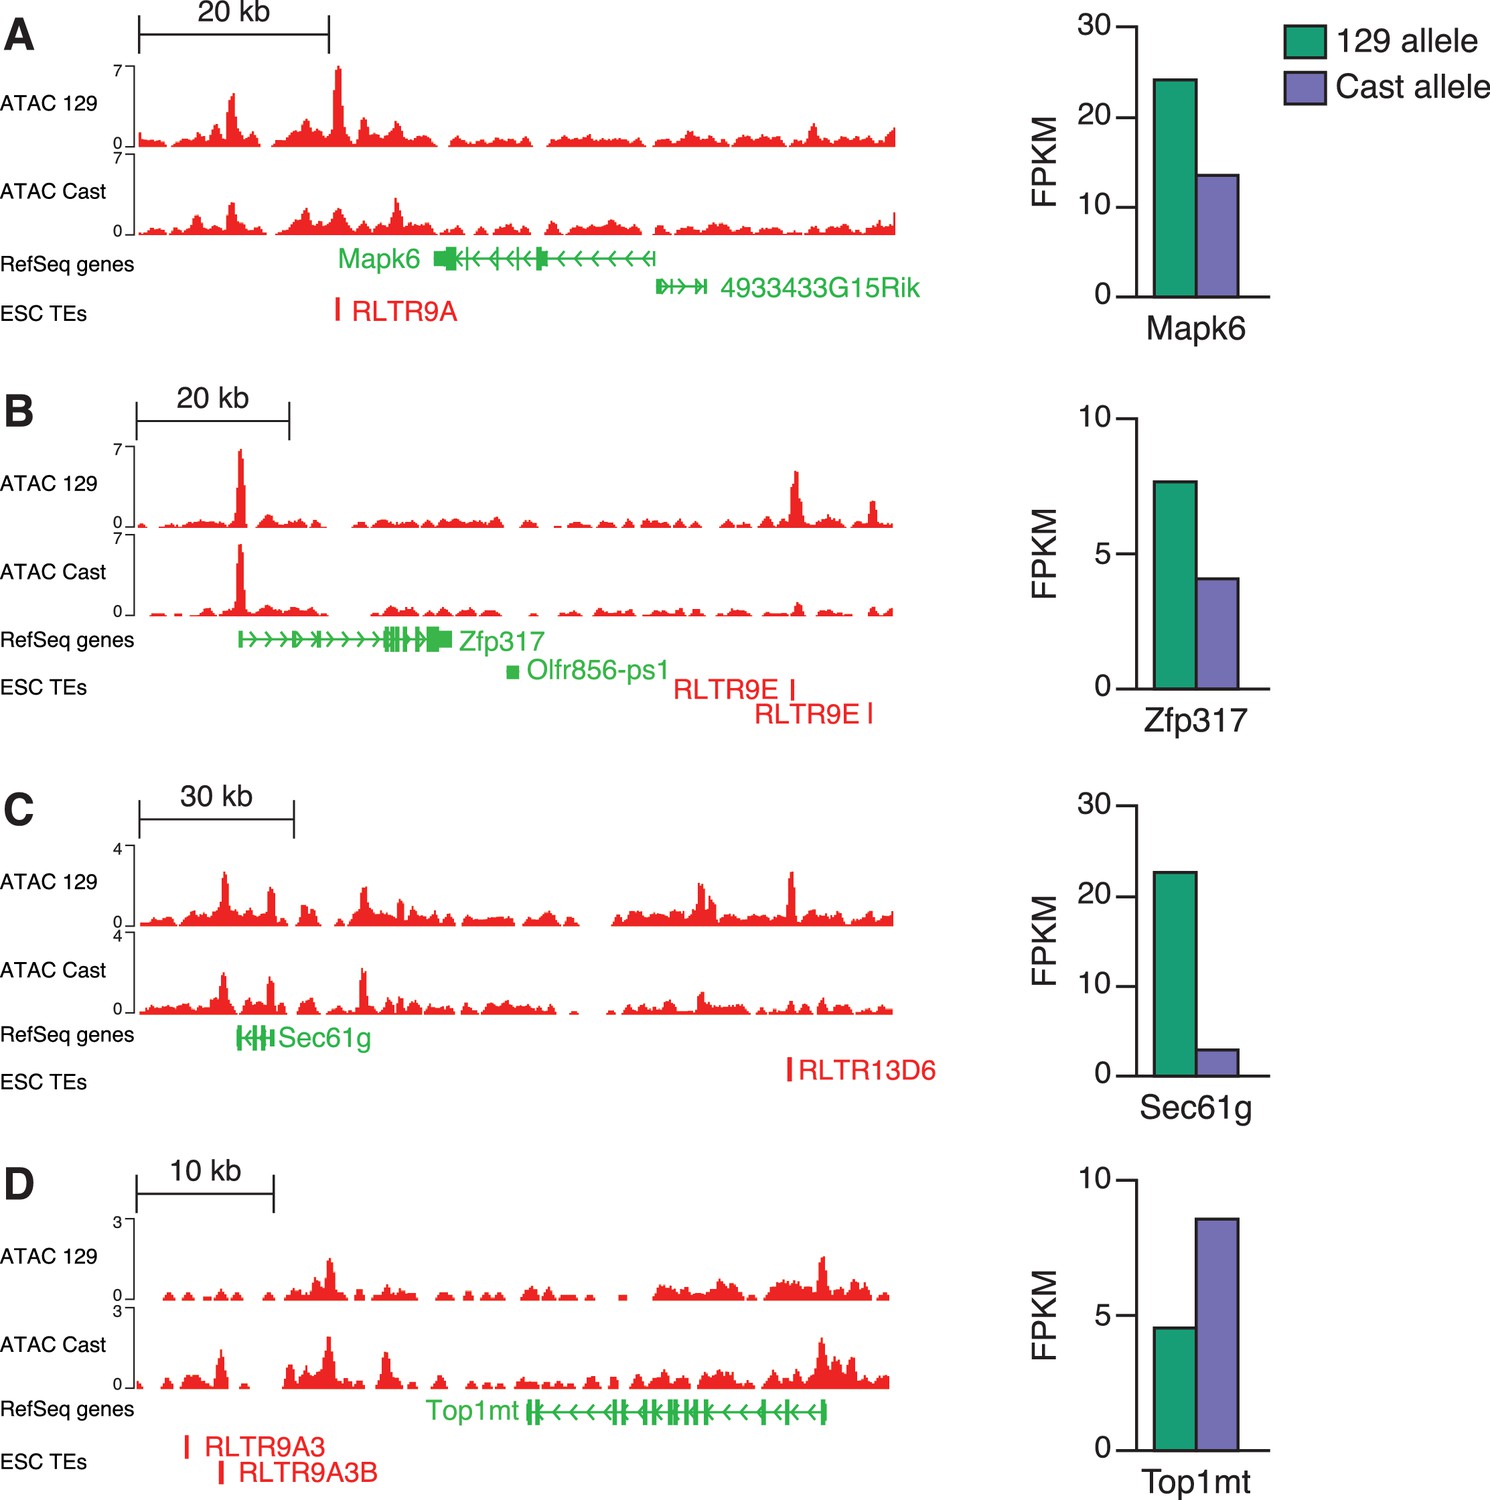
Identification of putative TE+ enhancers based on allele-specific data.
ATAC-seq data (left) from a 129 x Cast ESC line shows examples of RLTR13D6 or RLTR9 elements with allele-specific chromatin accessibility in either the 129 (A–C) or Cast (D) allele. Allele-specific RNA-seq data from the same cell line (right) suggest a association between chromatin accessibility and expression of nearby genes for these examples.
Figure 5 with 3 supplements
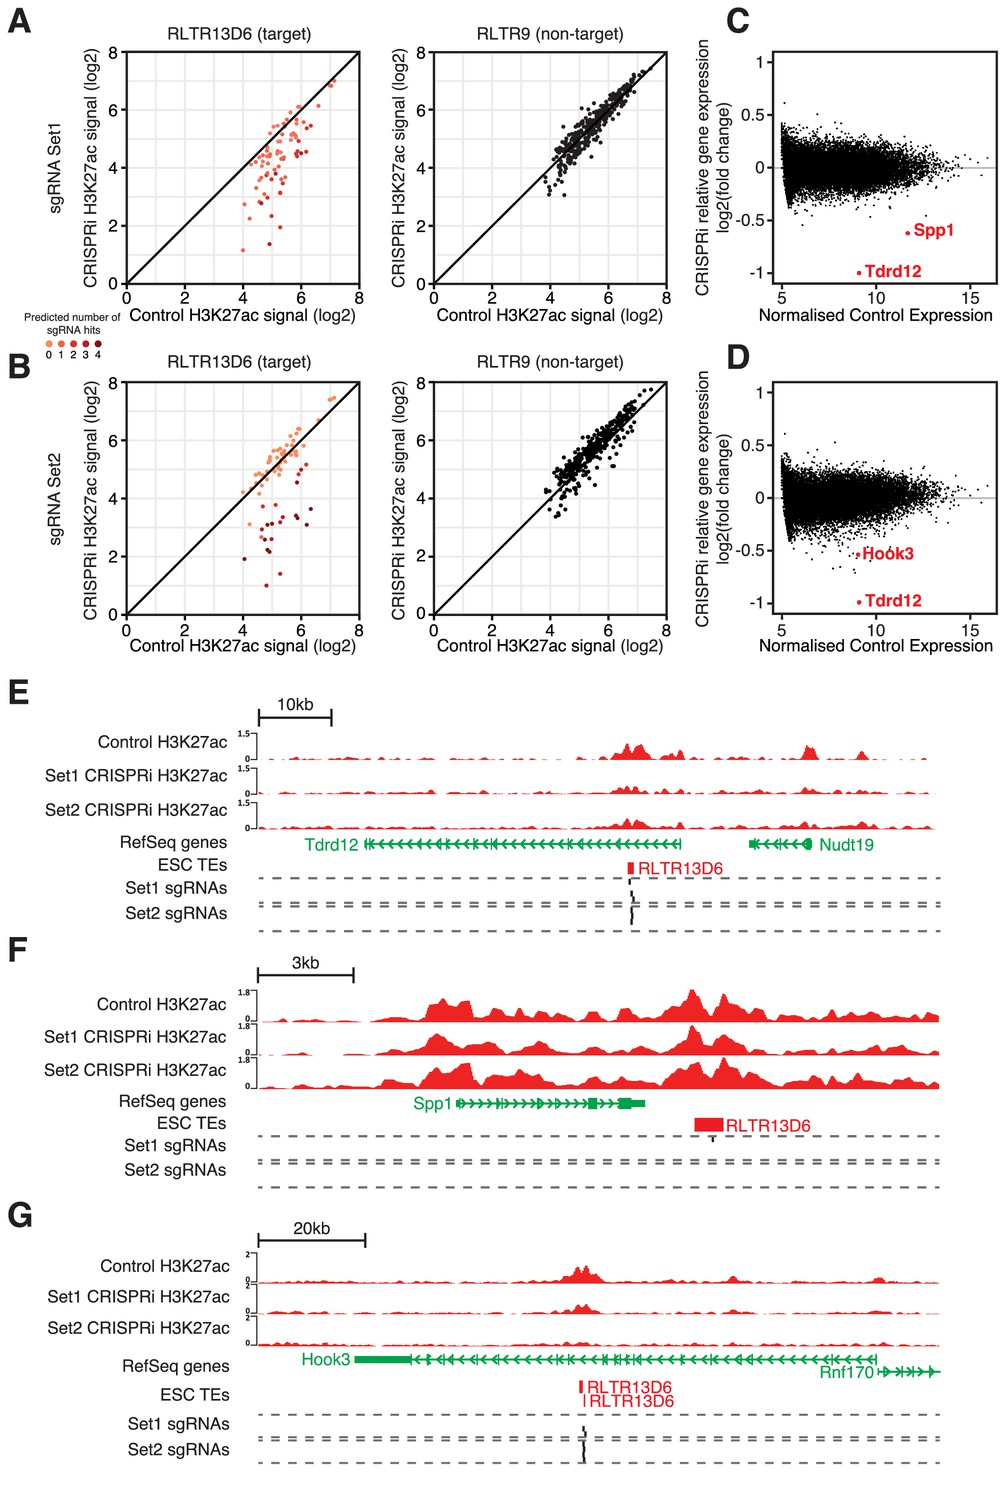
CRISPR interference reveals minor contribution of RLTR13D6 elements to ESC gene regulation.
(A,B) Normalised H3K27ac signal in dCas9-KRAB-expressing ESCs transduced with sgRNA set 1 (A) or set 2 (B) targeted to RLTR13D6 elements, or with empty vector. Data shown are for elements that overlap H3K27ac peaks in control cells. Colour code indicates the number of predicted sgRNA hits for each element. Data for RLTR9 are also shown as a control, non-targeted group. (C,D) MA plot for the RNA-seq data from triplicate CRISPRi experiments using sgRNA set 1 (C) or set 2 (D). Genes with statistically significant differential expression are highlighted in red. (E–F) Genome browser snapshots for the genes highlighted in C,D. H3K27ac ChIP-seq tracks for control or CRISPRi ESCs are shown, as well as predicted sgRNA hits from each set.
Figure 5—figure supplement 1
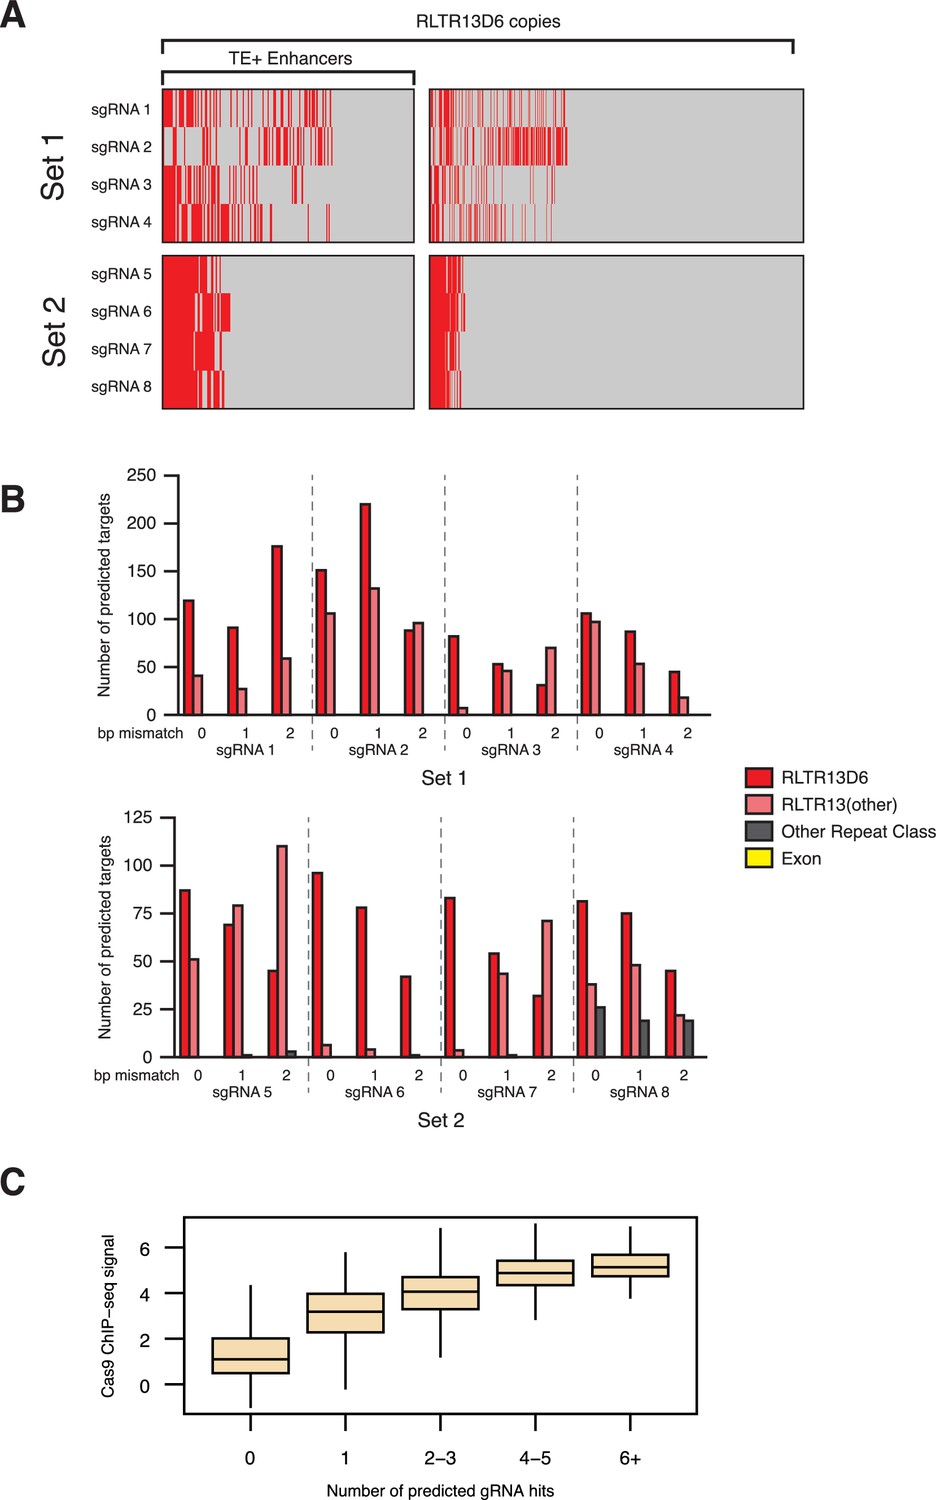
Target predictions for sgRNAs used for CRISPRi.
(A) RLTR13D6 copies predicted to be targeted (in red) by each of the sgRNAs in set 1 or set 2, with no mismatches. (B) Off-target predictions for each of the sgRNAs, with either 0, 1 or 2 bp mismatch. Most off-target loci are at related TE subfamilies, and no exons are predicted to be targeted by any of the sgRNAs. (C) Correlation between the number of sgRNAs predicted to bind human LTR5Hs elements and Cas9 ChIP-seq signal from a published CRISPRi experiment (Fuentes et al., 2018).
Figure 5—figure supplement 2
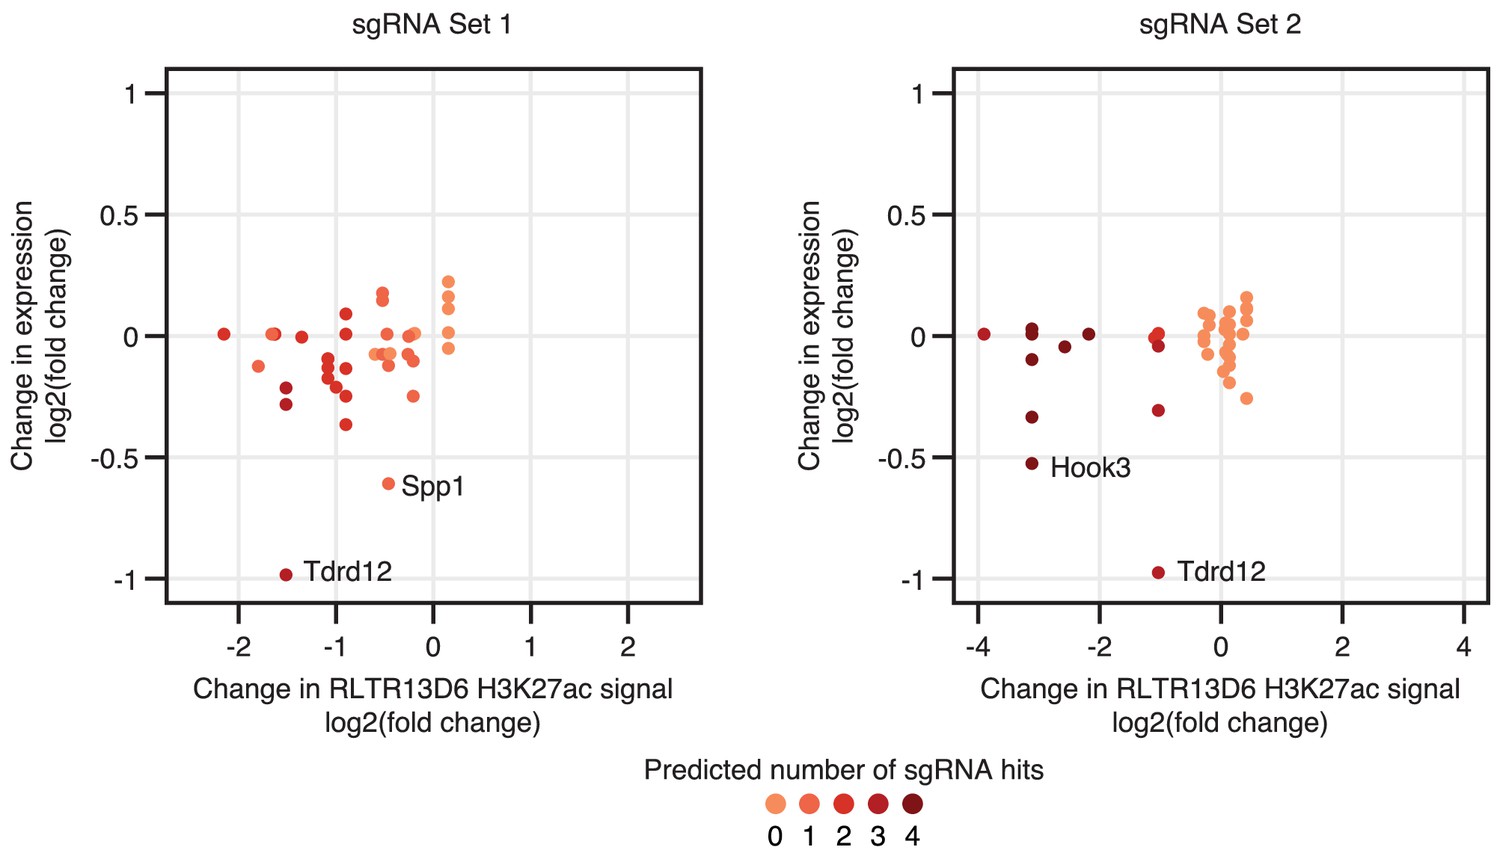
Effects of CRISPRi on H3K27ac levels and gene expression.
Gene expression changes of genes interacting with H3K27ac-enriched RLTR13D6 elements are shown relative to the changes in H3K27ac levels at these TEs. Tdrd12, Spp1 and Hook3 are highlighted as the only genes with significantly differential expression upon CRISPRi – note that other genes with similar changes in H3K27ac levels (at the interacting RLTR13D6 element) remain unchanged.
Figure 5—figure supplement 3
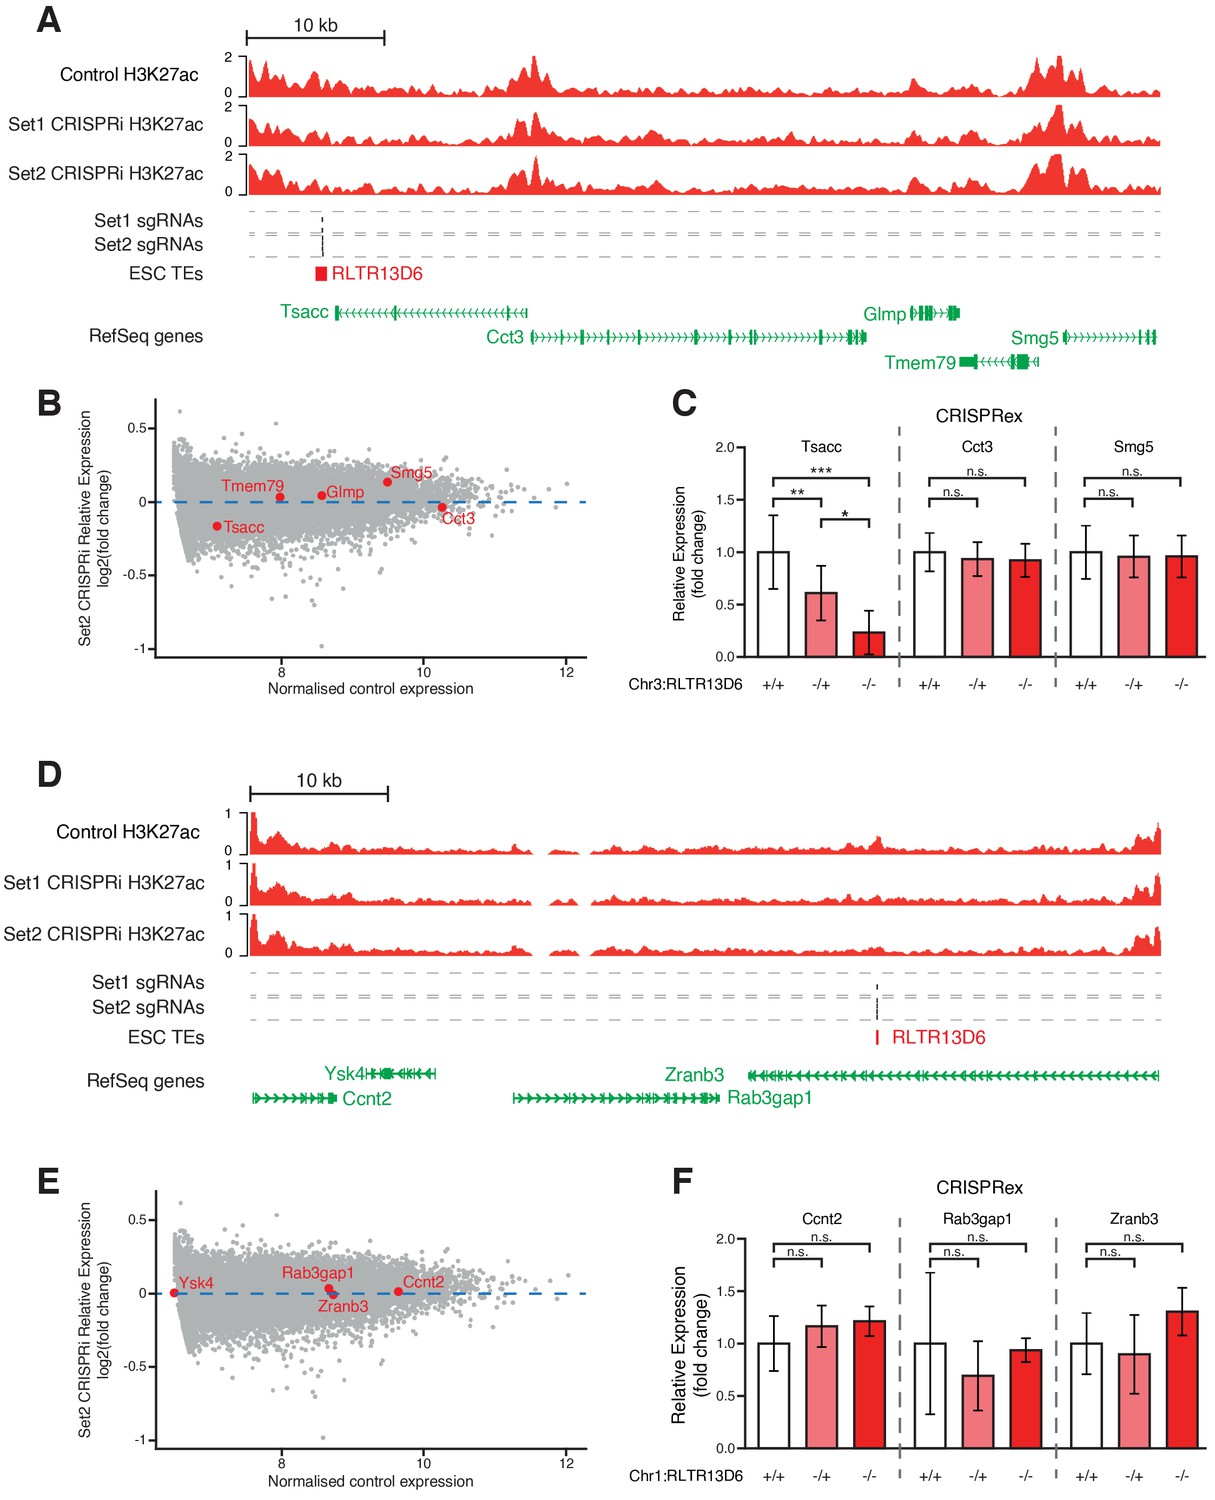
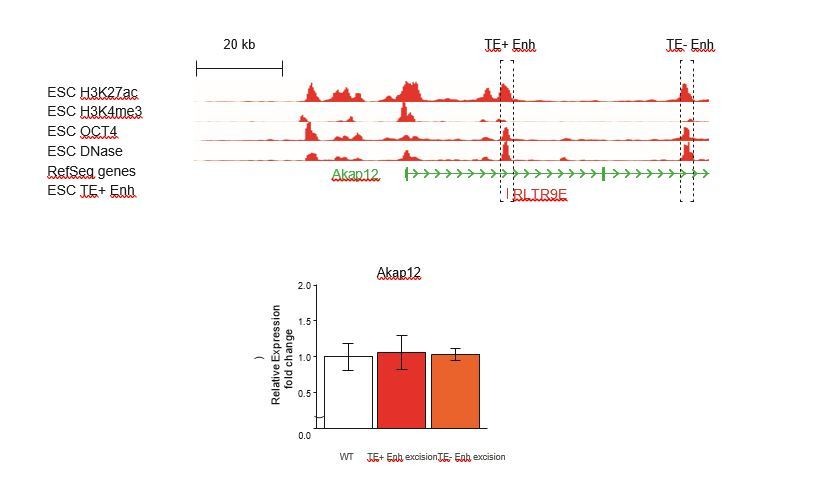
Genetic editing of TEs with little or no effect on gene expression upon CRISPRi.
(A,D) Genome browser snapshots for the TE+ enhancers selected for genetic excision. H3K27ac ChIP-seq tracks for control or CRISPRi ESCs are shown, as well as predicted sgRNA hits from each set. (B,E) MA plot for the RNA-seq data from CRISPRi experiments using sgRNA set 2, highlighting the expression levels of genes neighbouring the selected TEs. (C,F) RT-qPCR data from ESC clones isolated from CRISPR experiments targeted to the indicated TE+ enhancers. Ysk4 expression could not be detected. Values are mean ± s.d. from the following number of independent clones: 16 +/+, 7 -/+, 6 -/- (C); 6 +/+, 5 -/+, 1 -/- (F). Expression values from two different passage numbers were included for each clone.
Author response image 1
Additional files
-
Supplementary file 1
List of external datasets used.
- https://cdn.elifesciences.org/articles/44344/elife-44344-supp1-v3.xlsx
-
Supplementary file 2
List of primers and sgRNAs used.
- https://cdn.elifesciences.org/articles/44344/elife-44344-supp2-v3.xlsx
-
Transparent reporting form
- https://cdn.elifesciences.org/articles/44344/elife-44344-transrepform-v3.docx
Download links
A two-part list of links to download the article, or parts of the article, in various formats.
Downloads (link to download the article as PDF)
Open citations (links to open the citations from this article in various online reference manager services)
Cite this article (links to download the citations from this article in formats compatible with various reference manager tools)
Functional evaluation of transposable elements as enhancers in mouse embryonic and trophoblast stem cells
eLife 8:e44344.
https://doi.org/10.7554/eLife.44344


