Stem cell-derived cranial and spinal motor neurons reveal proteostatic differences between ALS resistant and sensitive motor neurons
- New York University, United States
- Boston Children’s Hospital, United States
- Harvard Medical School, United States
- Columbia University Medical Center, United States
- Brigham and Women’s Hospital, United States
- Broad Institute of MIT and Harvard, United States
- Howard Hughes Medical Institute, United States
- NYU Langone Medical Center, United States
Figures
Figure 1 with 1 supplement
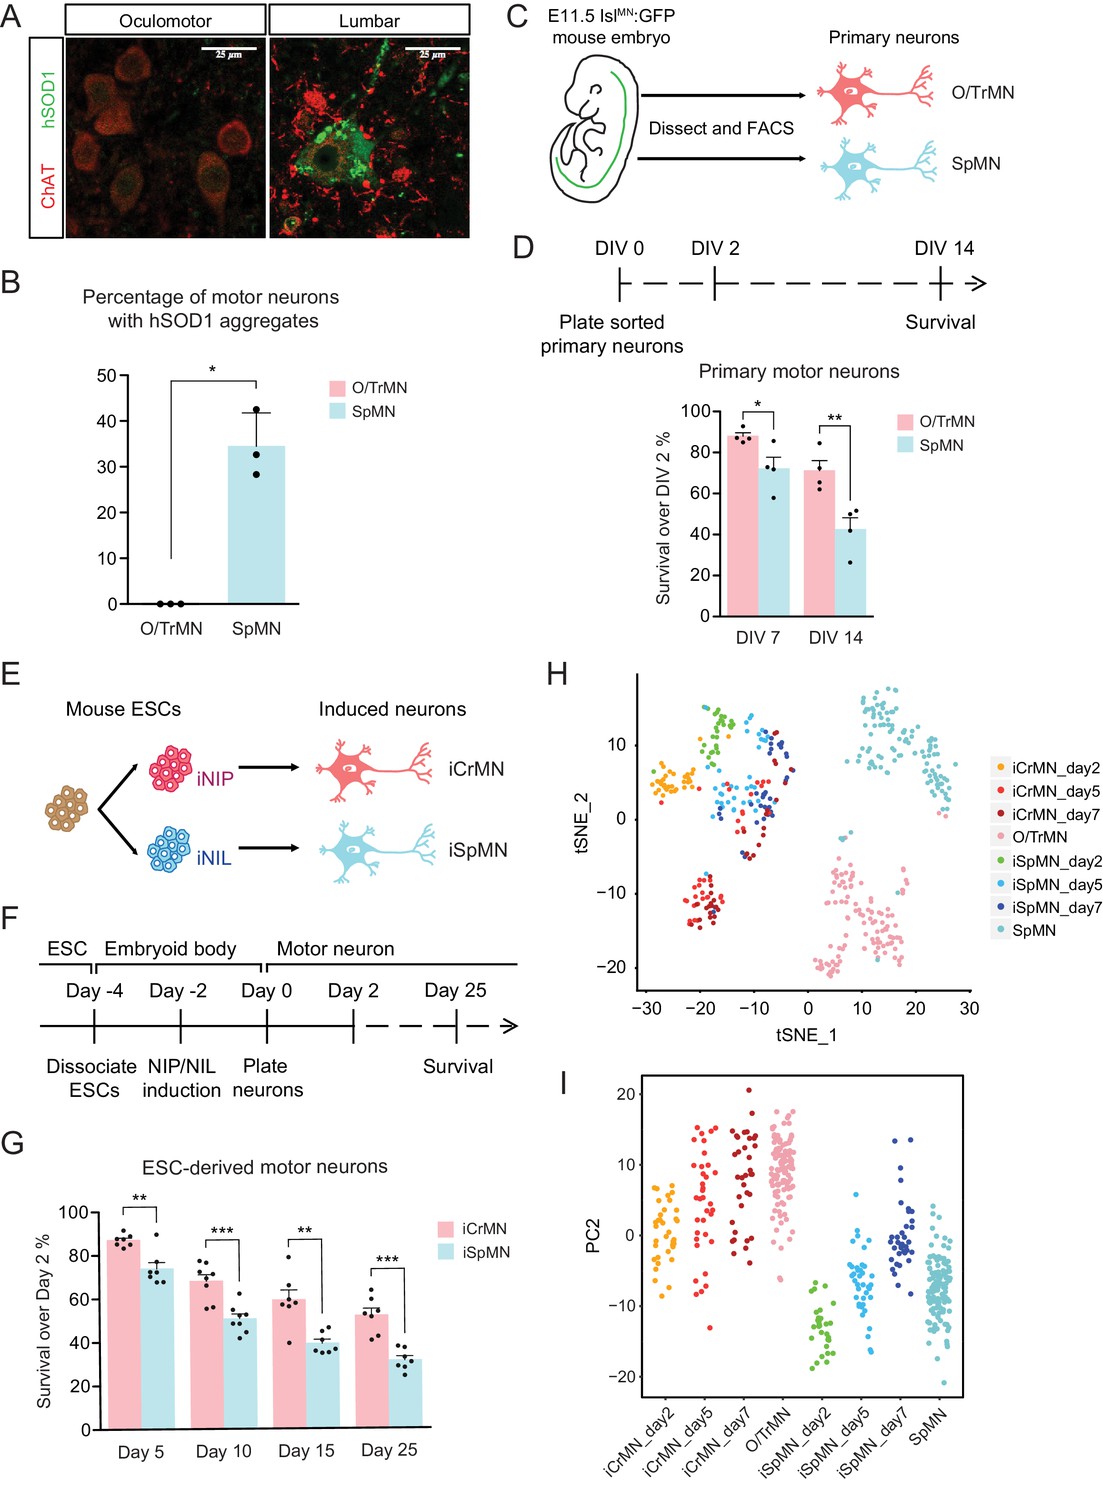
ESC-derived iCrMNs and iSpMNs resemble molecular and cellular features of primary O/TrMNs and SpMNs.
(A) Representative images of oculomotor neurons and lumber 4–5 SpMNs from P100 hSOD1 G93A mice. Motor neurons were stained by ChAT antibody in red. hSOD1 aggregates were present in SpMNs and stained by misfolded hSOD1 antibody in green. Confocal laser intensity used for imaging misfolded human SOD1 was 2% in oculomotor neurons and 0.2% in lumber SpMNs (laser intensity for ChAT imaging was same for both motor neuron types). hSOD1 staining in lumber SpMNs with 2% laser intensity is available in Figure 1—figure supplement 1 (A). (B) Quantification of percentage of cells containing hSOD1 aggregates in oculomotor neurons and SpMNs from hSOD1 G93A mice (n = 3 animals, m = 40 ~ 100, mean ± SD). (C) Schematic diagram of isolation of primary motor neurons from E11.5 IslMN:GFP-positive mouse embryos. Primary motor neurons were dissected, dissociated and isolated using fluorescence-activated cell sorting (FACS). (D) Experimental outline of primary motor neuron survival assay: the number of living cells was measured on days 2, 7 and 14 in vitro (DIV). Primary O/TrMNs survived better than primary SpMNs (n = 4, mean ± SEM). (E) Differentiation scheme of ESCs to motor neurons: isogenic iNIP and iNIL ESCs were differentiated into iCrMNs and iSpMNs, respectively, by direct programming. (F) Experimental outline of ESC to motor neuron differentiation followed by survival assay. (G) iCrMNs survived better than iSpMNs (n = 7–8, mean ± SEM). (H) tSNE plot of single cell RNA sequencing data of Day 2–7 ESC-derived motor neurons and DIV seven primary motor neurons. Same plot labeled by cluster is shown in Figure 1—figure supplement 1 (B). (I) All samples were plotted by PC2 that represents CrMN versus SpMN fates. n = biological replicates; m = number of cells quantified per replicate; statistical analysis was performed by student’s t-test, *p<0.05, **p<0.01, ***p<0.001.
Figure 1—figure supplement 1
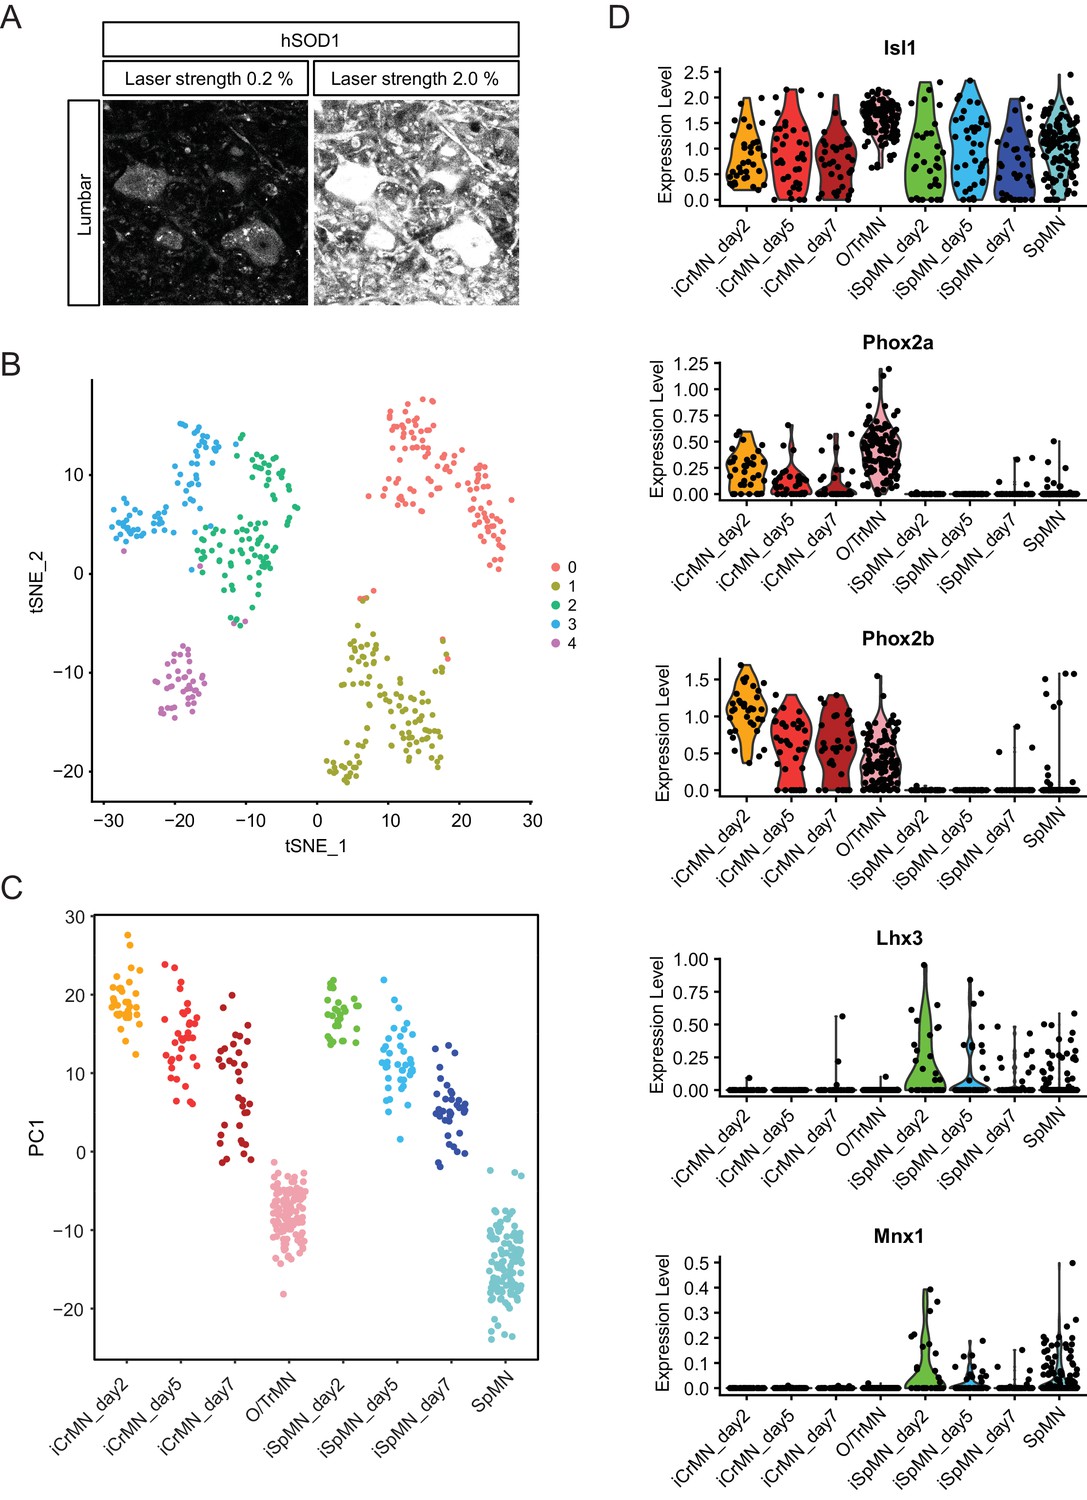
Comparative transcriptome analysis of ESC-derived and primary CrMNs and SpMNs by single cell RNA sequencing.
(A) Representative images of lumber 4–5 SpMNs from P100 hSOD1 G93A mice, stained by misfolded hSOD1 antibody and imaged with confocal laser strengths reflecting the 0.2% laser intensity used to image SpMNs and the same field at the 2.0% laser intensity used to image O/TrMNs. hSOD1 staining of SpMNs imaged with 2% laser strength was highly saturated. (B) Clustering of Day 2–7 ESC-derived motor neurons and DIV seven primary motor neurons by tSNE plot. (C) All samples were plotted by PC1 that represents in vitro versus in vivo origin. (D) CrMN and SpMN fate markers are respectively enriched in ESC-derived iCrMNs and iSpMNs. ESC-derived and primary CrMNs and SpMNs all express motor neuron marker Isl1. CrMN fate markers Phox2a and Phox2b are enriched in iCrMNs and primary O/TrMNs, while SpMN fate markers Lhx3 and Mnx1/Hb9 are enriched in iSpMNs and primary SpMNs.
Figure 2 with 1 supplement
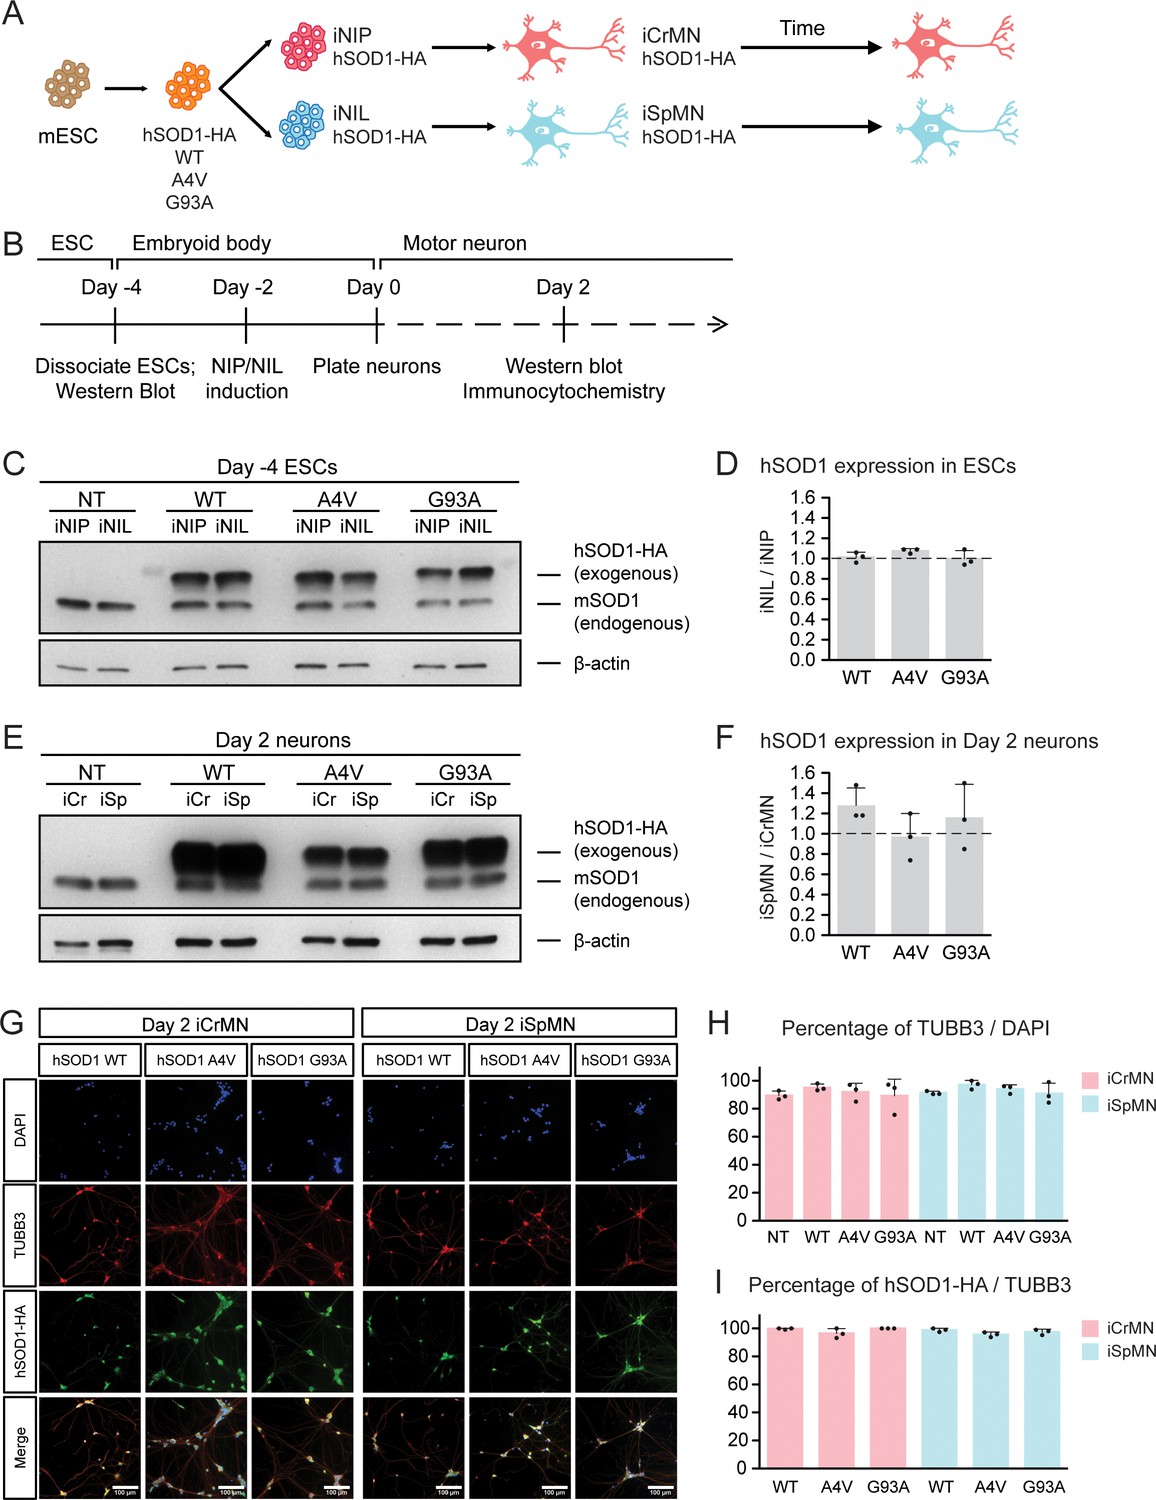
Generation of ESC-derived iCrMNs and iSpMNs expressing similar level of wild type or ALS mutant hSOD1 proteins.
(A) Schematic diagram of generation of ESC-derived motor neurons expressing hSOD1 transgenes: transgenic ESC lines expressing wild type (WT), A4V or G93A hSOD1 were first constructed; from these, isogenic iNIP and iNIL ESC lines were derived and then differentiated into motor neurons by direct programming. (B) Experimental outline: motor neurons were differentiated and quantified by immunocytochemistry on Day 2. Expression of hSOD1 was quantified by western blot in ESCs and Day two neurons. (C) Western blot analysis of ESCs using SOD1 antibody that recognizes both endogenous mouse SOD1 (mSOD1) and exogenous hSOD1 with HA tag. (D) Quantification of the hSOD1 expression between iNIL and iNIP ESCs (n = 3, mean ± SD). (E) Western blot analysis of Day two neurons using SOD1 antibody. iCr: iCrMN; iSp: iSpMN. (F) Quantification of the hSOD1 expression between iSpMNs and iCrMNs (n = 3, mean ± SD). Quantifications of the fold change between exogenous hSOD1 versus endogenous mSOD1 expression in ESCs and neurons are available in Figure 2—figure supplement 1. (G) Representative images of Day two neurons for quantification. All cells were stained by DAPI and neurons were stained by pan-neuronal marker TUBB3. hSOD1 proteins were stained by HA antibody. (H) Quantification of percentage of TUBB3+ cells on Day 2 (n = 3, m =~ 100, mean ± SD). (I) Quantification of percentage of hSOD1-HA+ cells in TUBB3+ neurons on Day 2 (n = 3, m =~ 100, mean ± SD). n = biological replicates; m = number of cells quantified per replicate. β-actin was used as a loading control for normalization in (D) and (F). The dash line represents y = 1. Statistical analysis was performed in log-transformed data by student’s t-test, *p<0.05, **p<0.01, ***p<0.001.
Figure 2—figure supplement 1
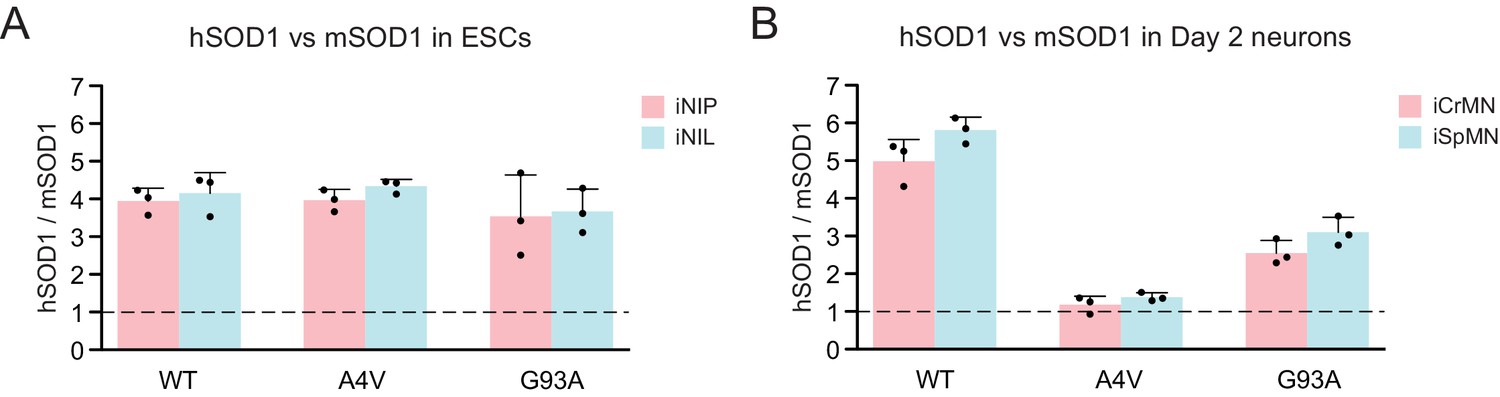
Overexpression of transgenic hSOD1 variants.
(A) Quantification of the fold change between exogenous hSOD1 versus endogenous mSOD1 expression by western blot using SOD1 antibody in iNIL and iNIP ESCs (n = 3, mean ± SD). (B) Quantification of the fold change between exogenous hSOD1 versus endogenous mSOD1 expression by western blot using SOD1 antibody in Day 2 iCrMNs and iSpMNs (n = 3, mean ± SD). n = biological replicates; statistical analysis was performed in log-transformed data by student’s t-test, *p<0.05, **p<0.01, ***p<0.001.
Figure 3 with 1 supplement
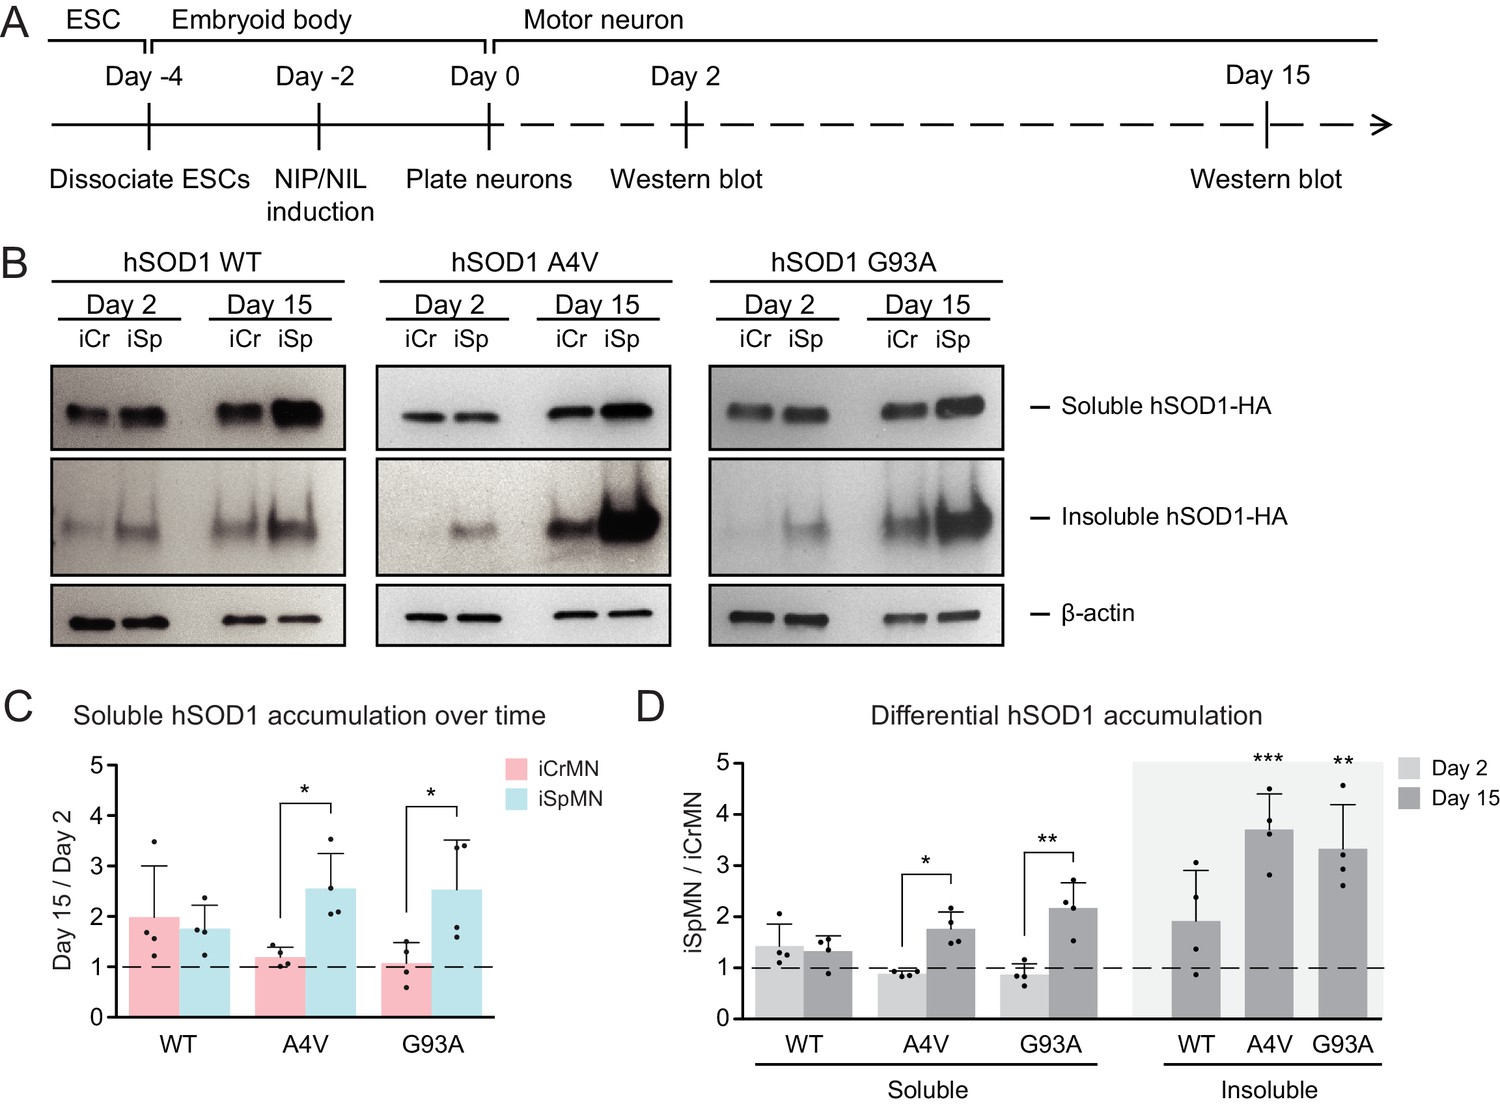
iCrMNs accumulate less mutant hSOD1 proteins than iSpMNs over time.
(A) Experimental outline: motor neurons were differentiated and the level of hSOD1 was quantified by western blot on Day two and Day 15. (B) Western blot analysis of Day two and Day 15 iCrMNs and iSpMNs using HA antibody. Accumulation of hSOD1 proteins is shown in the soluble (RIPA) and insoluble (urea) fractions. iCr: iCrMN; iSp: iSpMN. (C) Quantification of soluble hSOD1 level between Day 15 and Day two neurons (n = 4, mean ± SD). (D) Quantification of hSOD1 accumulation between iSpMNs and iCrMNs on Day two and Day 15 (n = 4, mean ± SD). β-actin in the soluble fraction was used as a loading control for normalization in (C) and (D). The dash line represents y = 1. n = biological replicates; statistical analysis was performed in log-transformed data by student’s t-test, *p<0.05, **p<0.01, ***p<0.001.
Figure 3—figure supplement 1
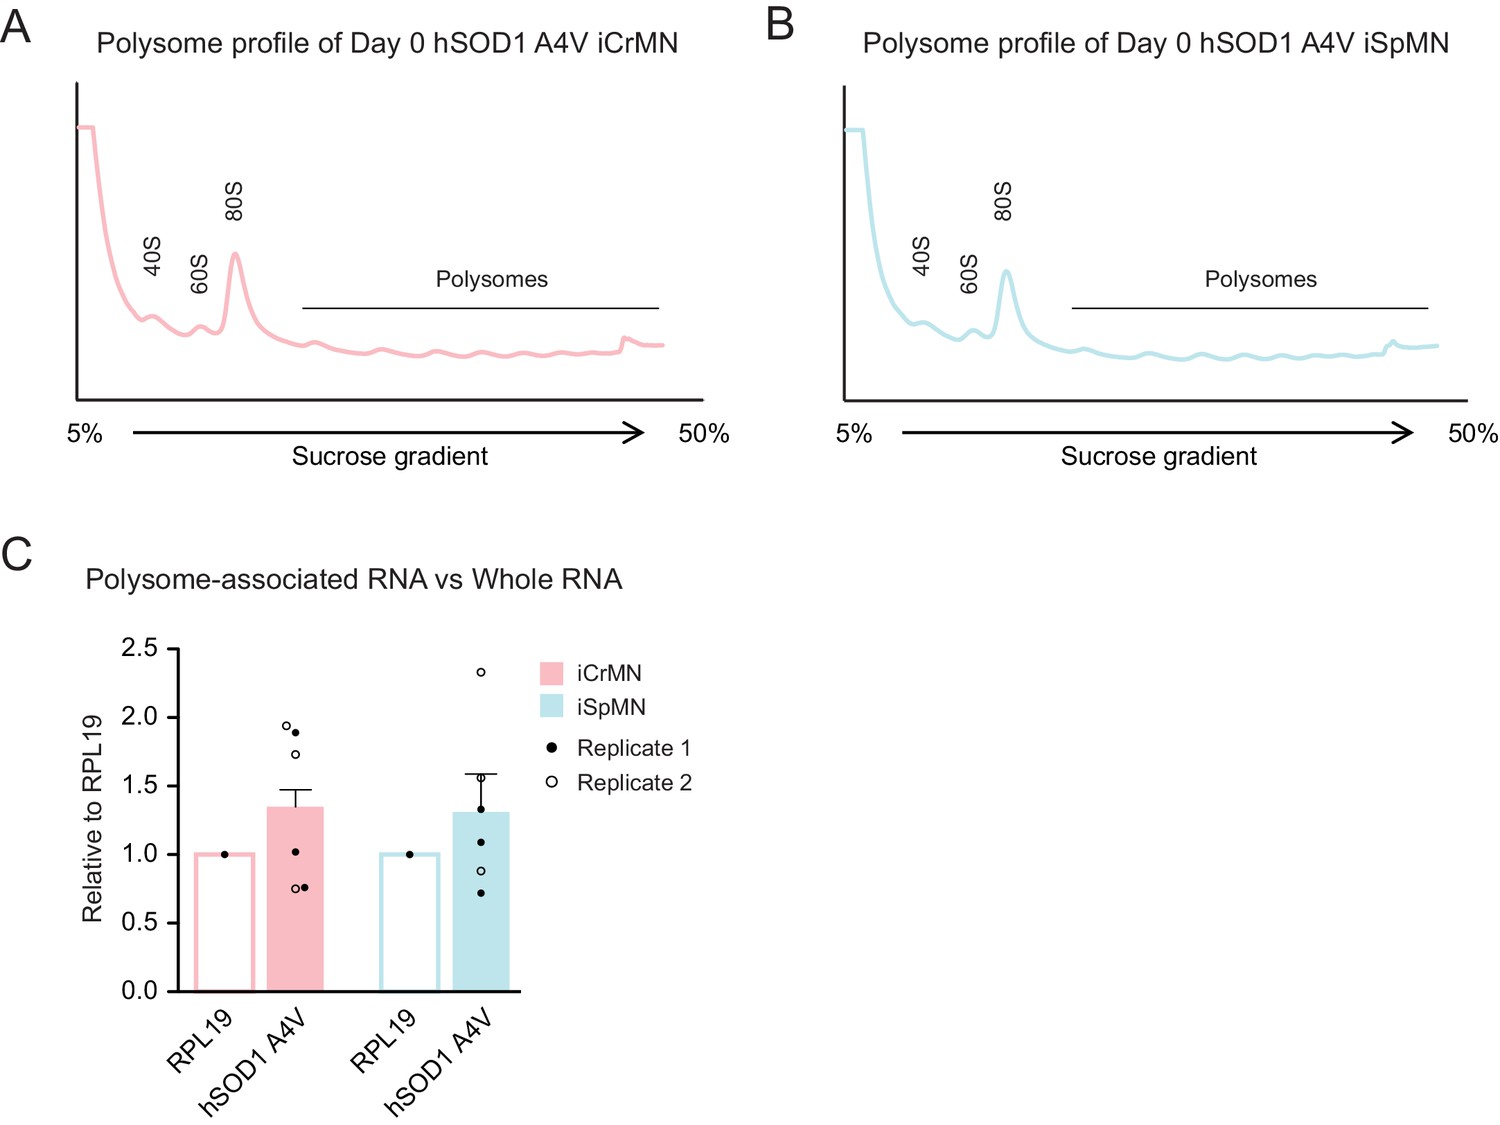
The translation efficiency of hSOD1 is similar between iCrMNs and iSpMNs.
(A–B) Polysome profiles of Day 0 hSOD1 A4V iCrMNs (A) and iSpMNs (B). (C) The ratios between polysome-associated hSOD1 A4V mRNA and whole hSOD1 A4V mRNA are similar between iCrMNs and iSpMNs, normalized by ribosomal protein RPL19. Two biological replicates are shown with three technical replicates each (mean ± SEM). Statistical analysis was performed in log-transformed data by student’s t-test, *p<0.05, **p<0.01, ***p<0.001.
Figure 4
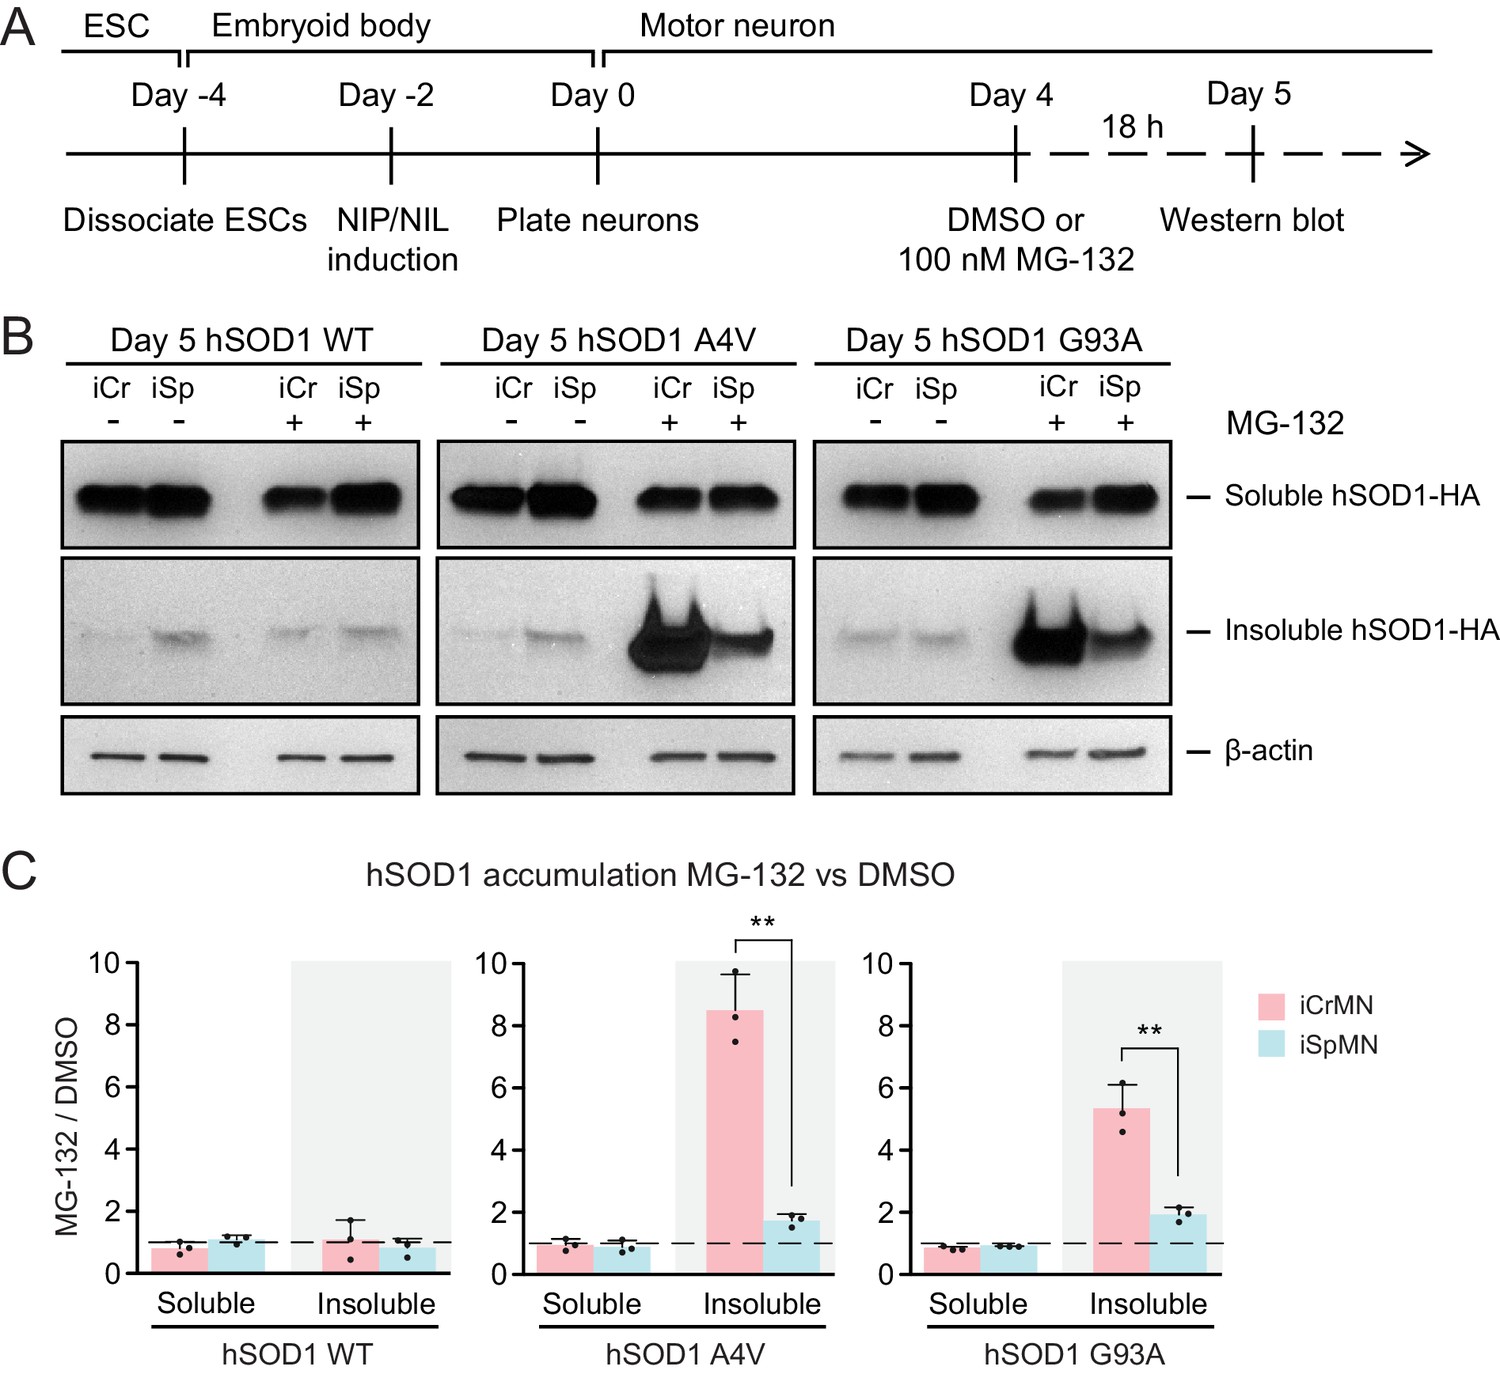
Proteasome dependent degradation reduces insoluble mutant hSOD1 accumulation in iCrMNs.
(A) Experimental outline: motor neurons were differentiated and treated with DMSO or 100 nM MG-132 for 18 hr on Day four followed by western blot analysis on Day 5. (B) Western blot analysis of Day 5 DMSO or MG-132 treated iCrMNs and iSpMNs using HA antibody. Accumulation of hSOD1 proteins is shown in the soluble (RIPA) and insoluble (urea) fractions. iCr, iCrMN; iSp, iSpMN. (C) Quantification of hSOD1 accumulation between MG-132 and DMSO treated neurons (n = 3, mean ± SD). β-actin in the soluble fraction was used as a loading control for normalization. The dashed line represents equal accumulation, y = 1. n = biological replicates; statistical analysis was performed in log-transformed data by Two-way ANOVA and student’s t-test, *p<0.05, **p<0.01, ***p<0.001.
Figure 5
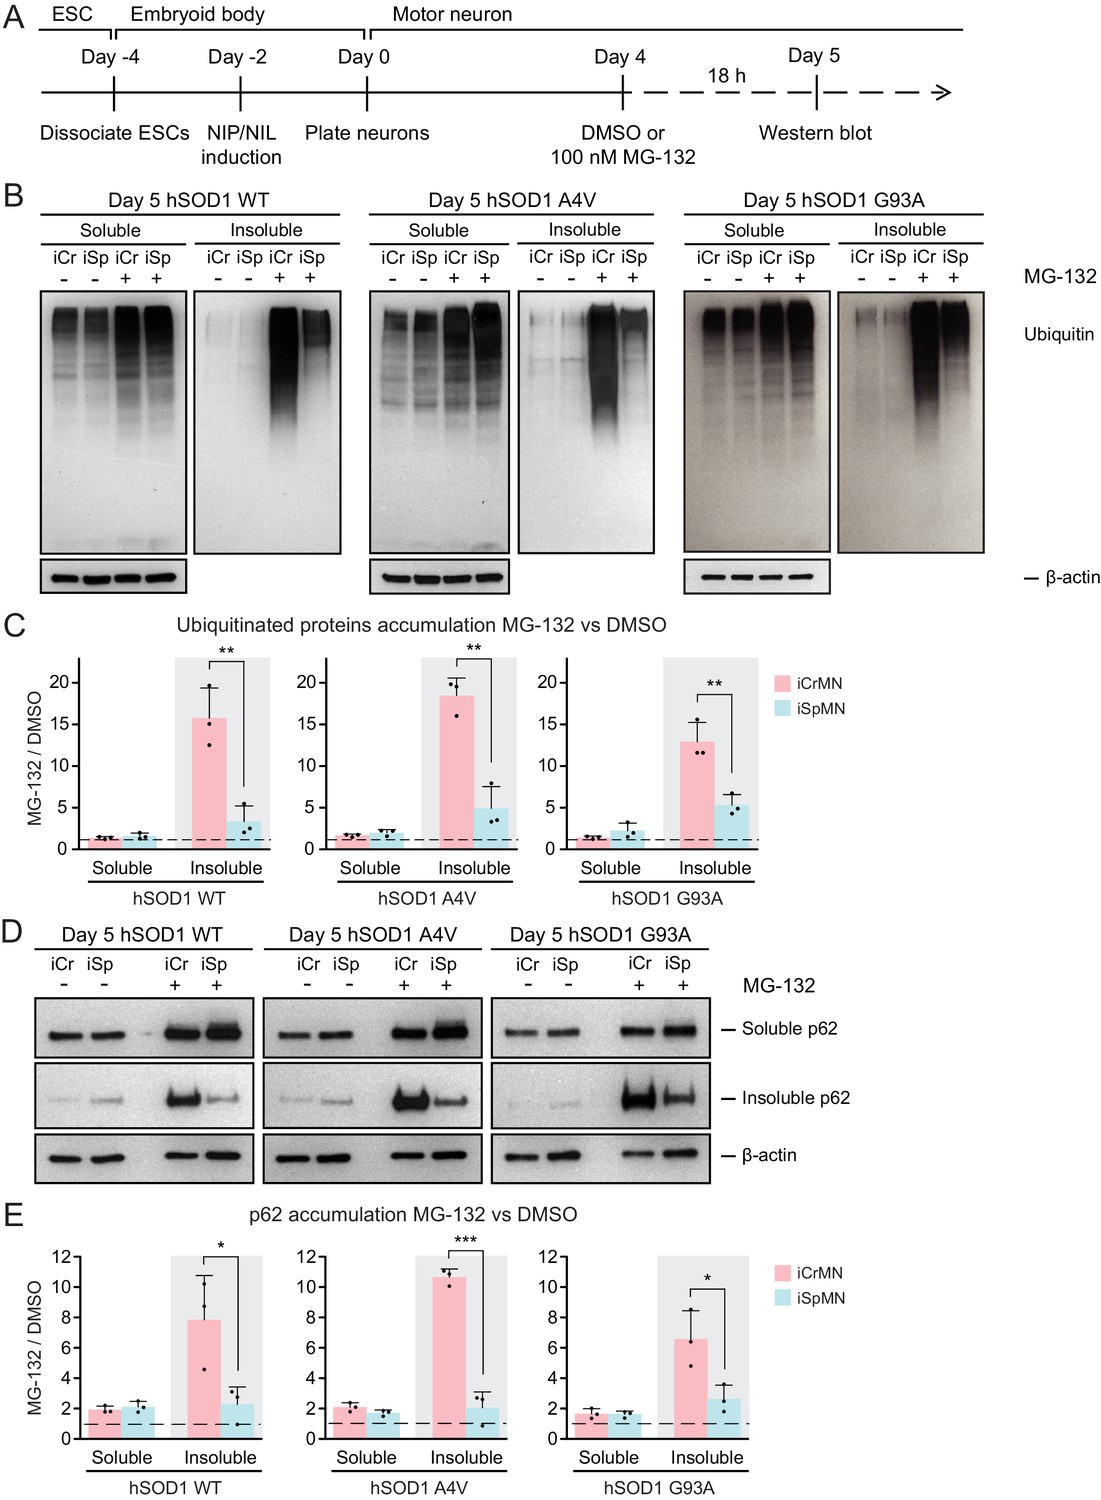
iCrMNs rely on proteasome function to reduce the accumulation of insoluble protein aggregates.
(A) Experimental outline: motor neurons were differentiated and treated with DMSO or 100 nM MG-132 for 18 hr on Day four followed by western blot analysis on Day 5. (B) Western blot analysis of Day 5 DMSO or MG-132 treated iCrMNs and iSpMNs using ubiquitin antibody revealed a smear of ubiquitinated proteins in the soluble (RIPA) and insoluble (urea) fractions. iCr, iCrMN; iSp, iSpMN. (C) Quantification of accumulation of ubiquitinated proteins between MG-132 and DMSO treated neurons (n = 3, mean ± SD). (D) Western blot analysis of Day 5 DMSO or MG-132 treated iCrMNs and iSpMNs using p62 antibody. Accumulation of p62 proteins is shown in soluble (RIPA) and insoluble (urea) fractions. iCr, iCrMN; iSp, iSpMN. (E) Quantification of p62 accumulation between MG-132 and DMSO treated neurons (n = 3, mean ± SD). β-actin in the soluble fraction was used as a loading control for normalization in (C) and (E). The dashed line represents equal accumulation, y = 1. n = biological replicates; statistical analysis was performed in log-transformed data by Two-way ANOVA and student’s t-test, *p<0.05, **p<0.01, ***p<0.001.
Figure 6
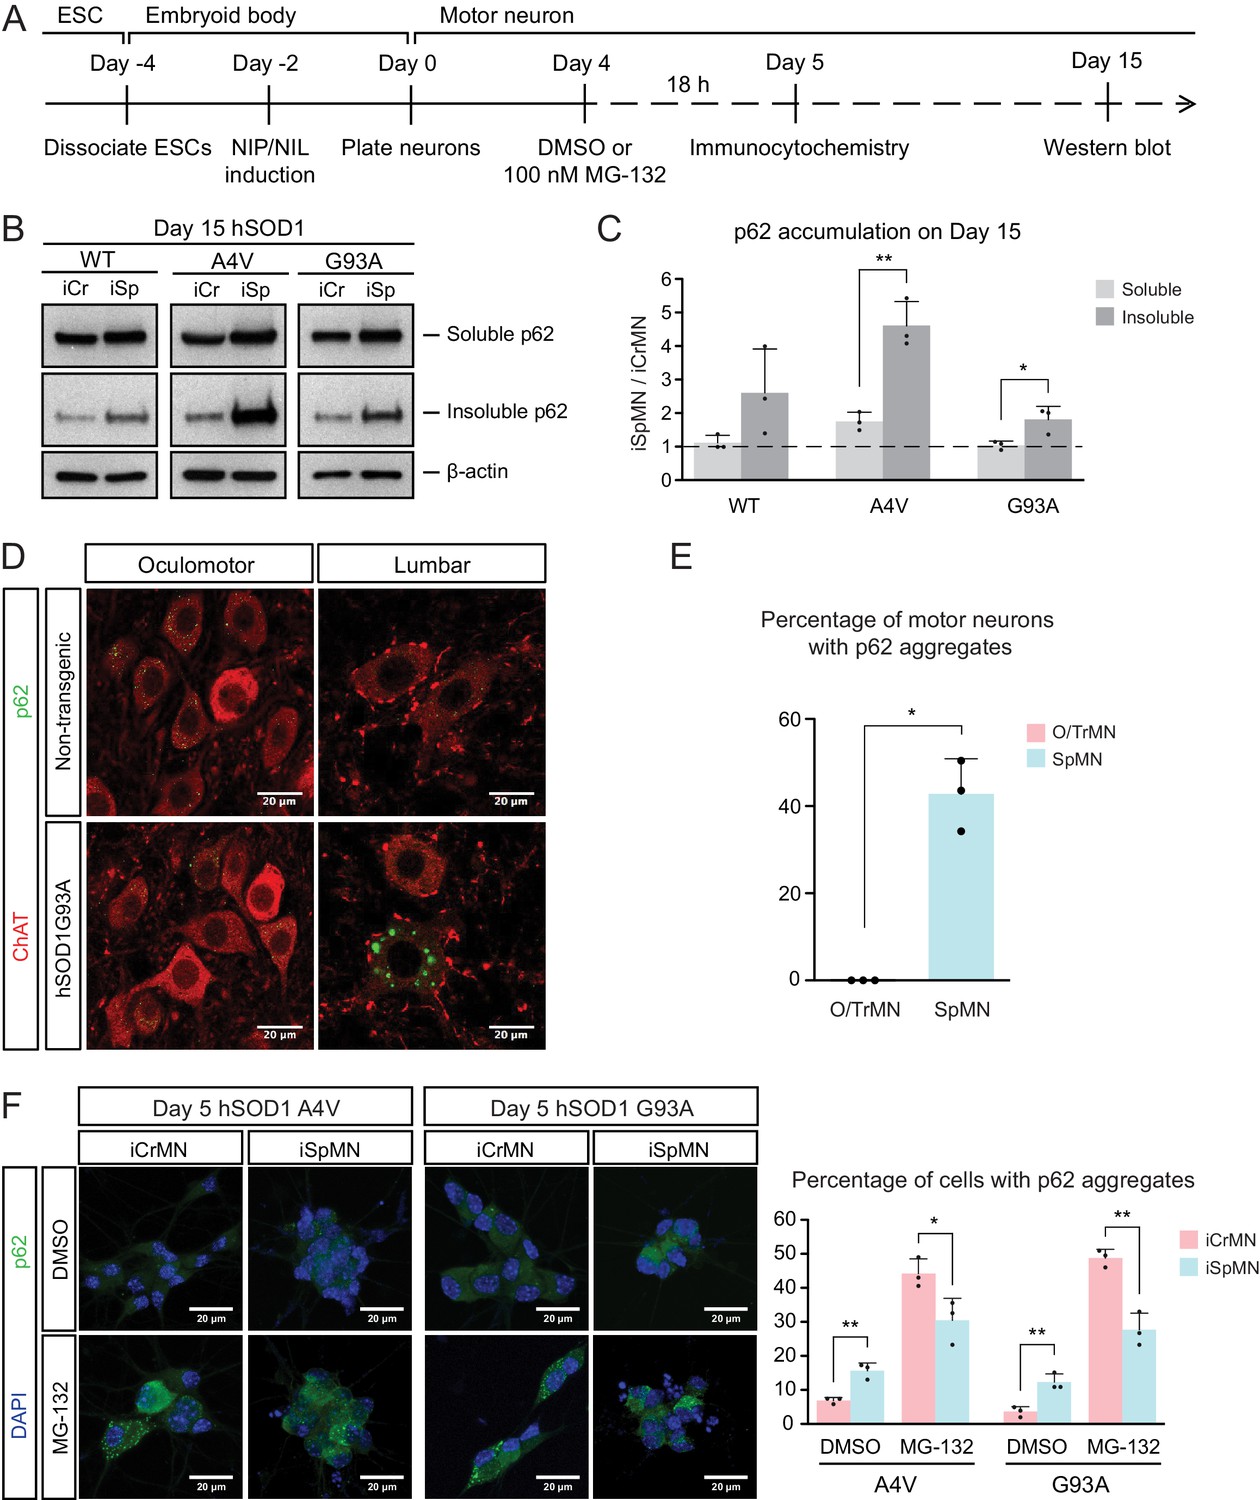
ESC- and embryonically-derived ALS-resistant CrMNs contain fewer p62-positive protein aggregates than SpMNs.
(A) Experimental outline: motor neurons were differentiated and treated with DMSO or 100 nM MG-132 for 18 hr on Day four followed by immunocytochemistry analysis on Day 5; neurons were collected on Day 15 for western blot analysis. (B) Western blot analysis of Day 15 neurons using p62 antibody. Accumulation of p62 proteins is shown in the soluble (RIPA) and insoluble (urea) fractions. iCr, iCrMN; iSp, iSpMN. (C) Quantification of p62 levels between Day 15 iCrMNs and iSpMNs (n = 3, mean ± SD). β-actin in the soluble fraction was used as a loading control for normalization. The dashed line represents y = 1. (D) Representative images of oculomotor neurons and lumber 4–5 SpMNs from littermates of non-transgenic (NT) and hSOD1 G93A mice at postnatal days 66, 66 and 97. ChAT antibody stained motor neurons in red. p62 antibody stained p62-containing inclusions in green. (E) Quantification of percentage of cells containing p62 inclusions in oculomotor neurons and SpMNs from hSOD1 G93A mice (n = 3, m =~ 100, mean ± SD). (F) Representative images of Day five neurons treated with DMSO or MG-132 stained by DAPI in blue and p62 antibody in green. Quantification of percentage of cells that contain p62 aggregates is shown on the right (n = 3, m =~ 100, mean ± SD). n = biological replicates or animals; m = number of cells quantified per replicate; statistical analysis was performed in log-transformed data by Two-way ANOVA and student’s t-test, *p<0.05, **p<0.01, ***p<0.001.
Figure 7 with 2 supplements
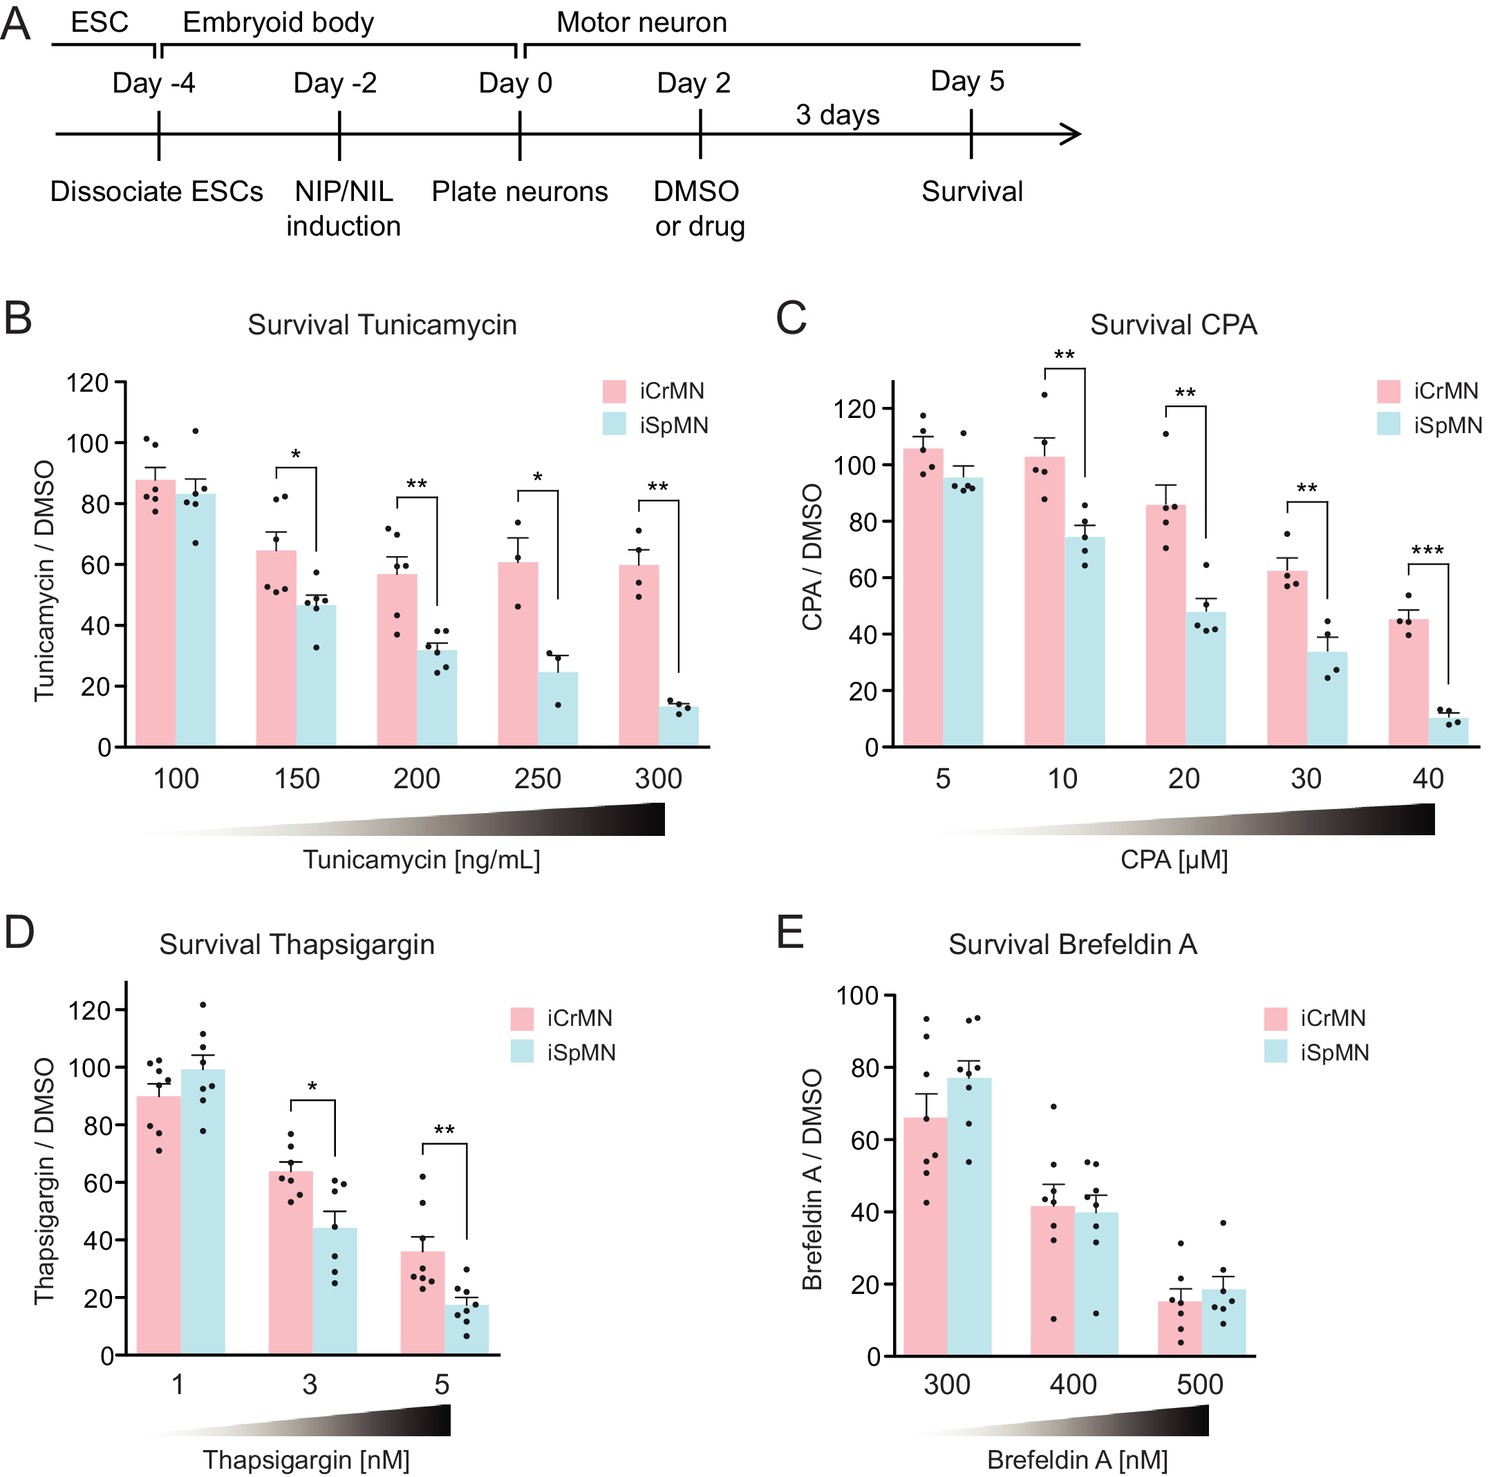
iCrMNs are more resistant than iSpMNs to proteostatic stress caused by misfolded proteins.
(A) Experimental outline: motor neurons were differentiated and treated with DMSO or drugs from Day two to Day five and the number of living cells were measured on Day five for survival assay. (B) iCrMNs were more resistant than iSpMNs to tunicamycin treatment (n = 3–6, mean ± SEM). (C) iCrMNs were more resistant than iSpMNs to CPA treatment (n = 4–5, mean ± SEM). The UPR response induced by CPA treatment is shown in Figure 7—figure supplement 1. (D) iCrMNs were more resistant than iSpMNs to thapsigargin treatment (n = 7–8, mean ± SEM). (E) iCrMNs and iSpMNs were equally sensitive to brefeldin A treatment (n = 7–8, mean ± SEM). n = biological replicates; statistical analysis was performed by student’s t-test, *p<0.05, **p<0.01, ***p<0.001.
Figure 7—figure supplement 1
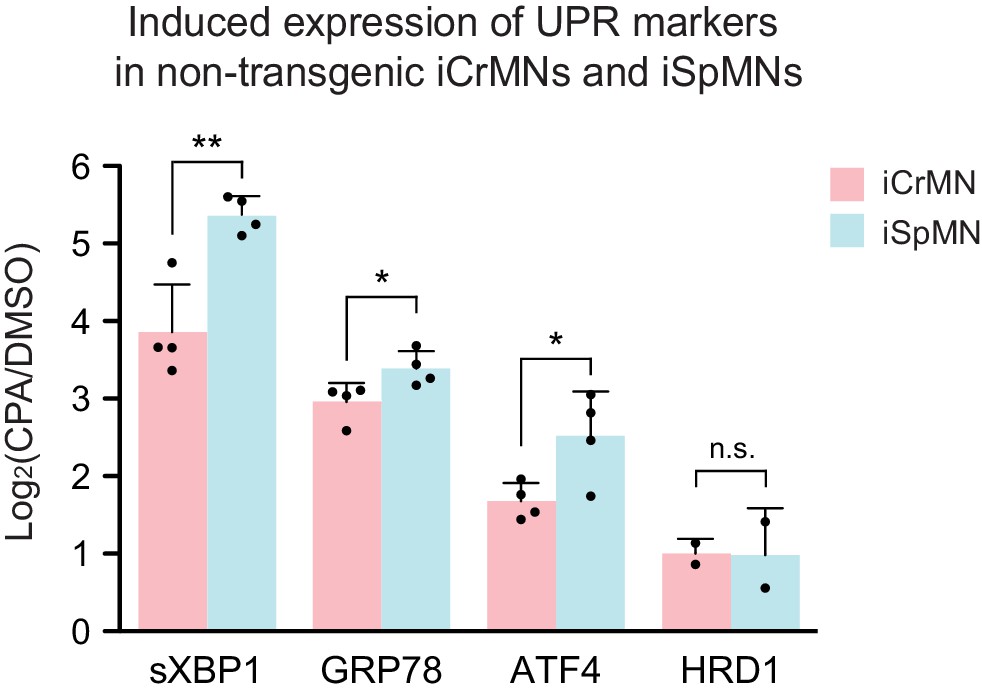
CPA treatment induced higher UPR level in iSpMNs than iCrMNs Non-transgenic iCrMNs and iSpMNs were treated with 20 μM CPA on Day 2; induction of UPR markers were quantified by RT-qPCR after 12 hr.
iSpMNs showed higher induction of sXbp1, Grp78 and ATF4 than iCrMNs. ERAD-associated gene Hrd1 was induced at similar level between iCrMNs and iSpMNs (n = 4, mean ± SD). n = biological replicates; statistical analysis was performed in log-transformed data by student’s t-test, *p<0.05, **p<0.01, ***p<0.001.
Figure 7—figure supplement 2
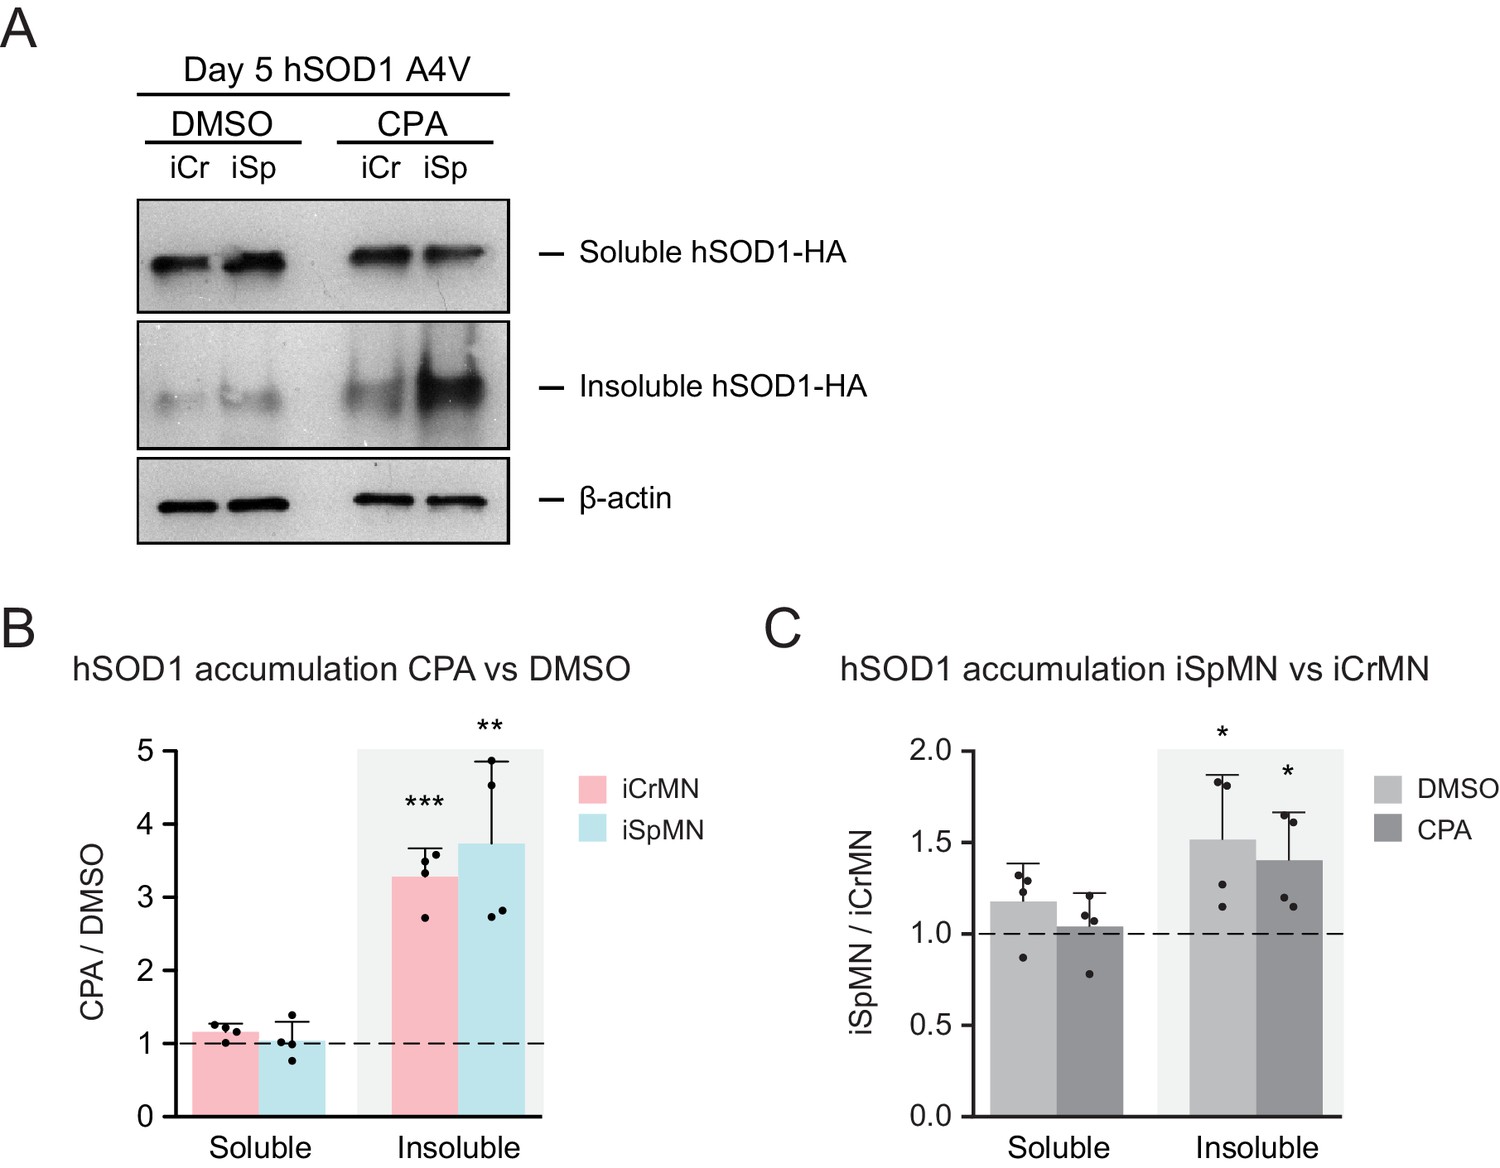
Additional proteostatic stress induced by CPA treatment significantly increased insoluble hSOD1 A4V accumulation in both iCrMNs and iSpMNs hSOD1 A4V expressing iCrMNs and iSpMNs were treated with 20 μM CPA from Day two to Day 5; accumulation of hSOD1 A4V proteins were quantified by western on Day 5.
(A) Western blot analysis of Day 5 DMSO or CPA treated iCrMNs and iSpMNs using HA antibody. Accumulation of hSOD1 A4V is shown in the soluble (RIPA) and insoluble (urea) fractions. iCr, iCrMN; iSp, iSpMN. (B) Quantification of hSOD1 accumulation between CPA and DMSO treated neurons. (C) Quantification of hSOD1 accumulation between iSpMNs and iCrMNs. n = 4, mean ± SD. β-actin in the soluble fraction was used as a loading control for normalization. The dashed line represents equal accumulation, y = 1. n = biological replicates; statistical analysis was performed in log-transformed data by student’s t-test, *p<0.05, **p<0.01, ***p<0.001.
Figure 8
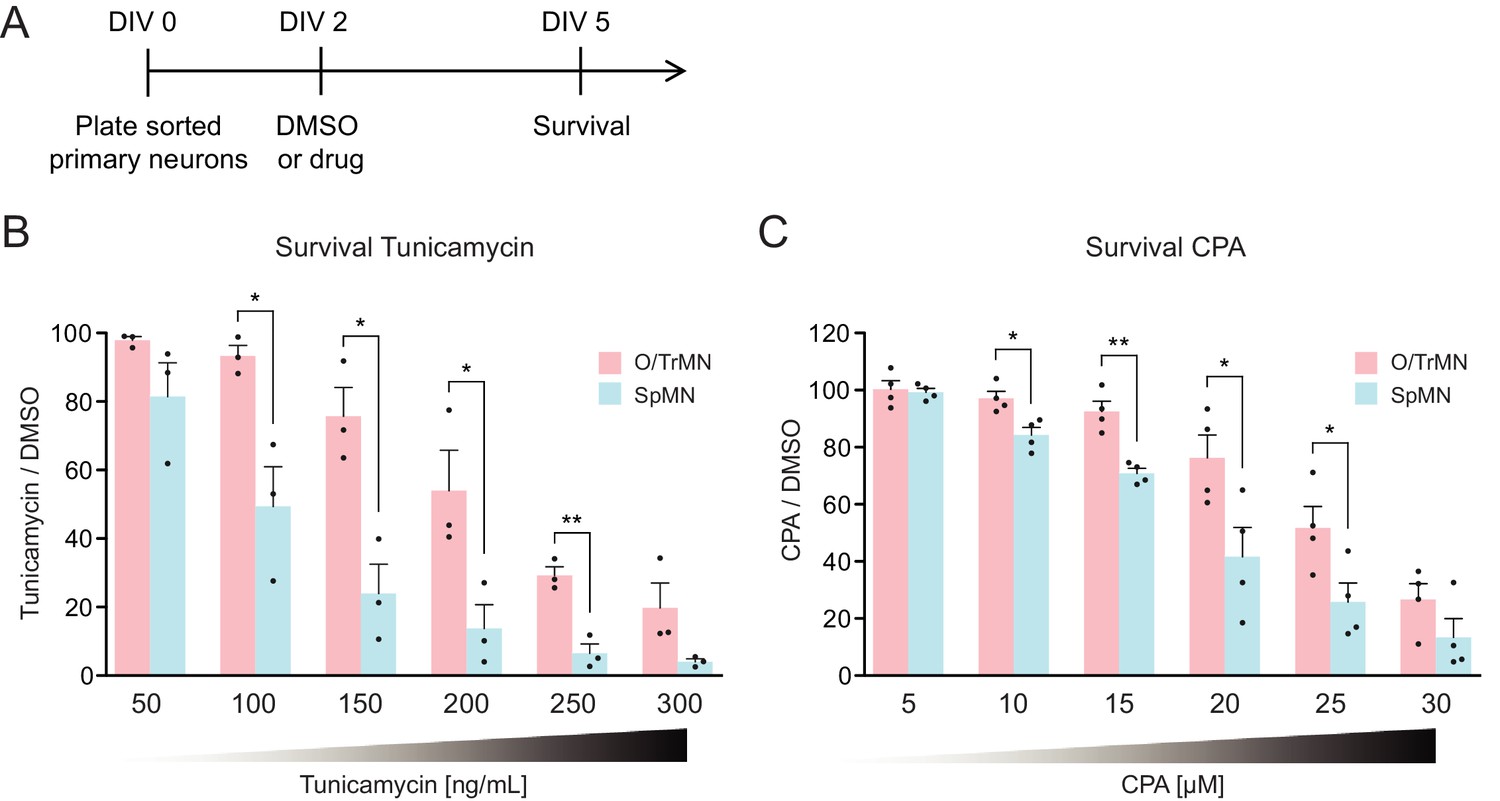
Primary ALS-resistant CrMNs are more resistant than primary SpMNs to proteostatic stress.
(A) Experimental outline: primary motor neurons were dissected, dissociated, sorted and plated on DIV 0 and treated with DMSO or drugs from DIV 2 to DIV 5. The number of living cells were measured on DIV five for survival assay. (B) Primary O/TrMNs were more resistant than primary SpMNs to tunicamycin treatment (n = 3, mean ± SEM). (C) Primary O/TrMNs were more resistant than primary SpMNs to CPA treatment (n = 4, mean ± SEM). n = biological replicates; statistical analysis was performed by student’s t-test, *p<0.05, **p<0.01, ***p<0.001.
Figure 9
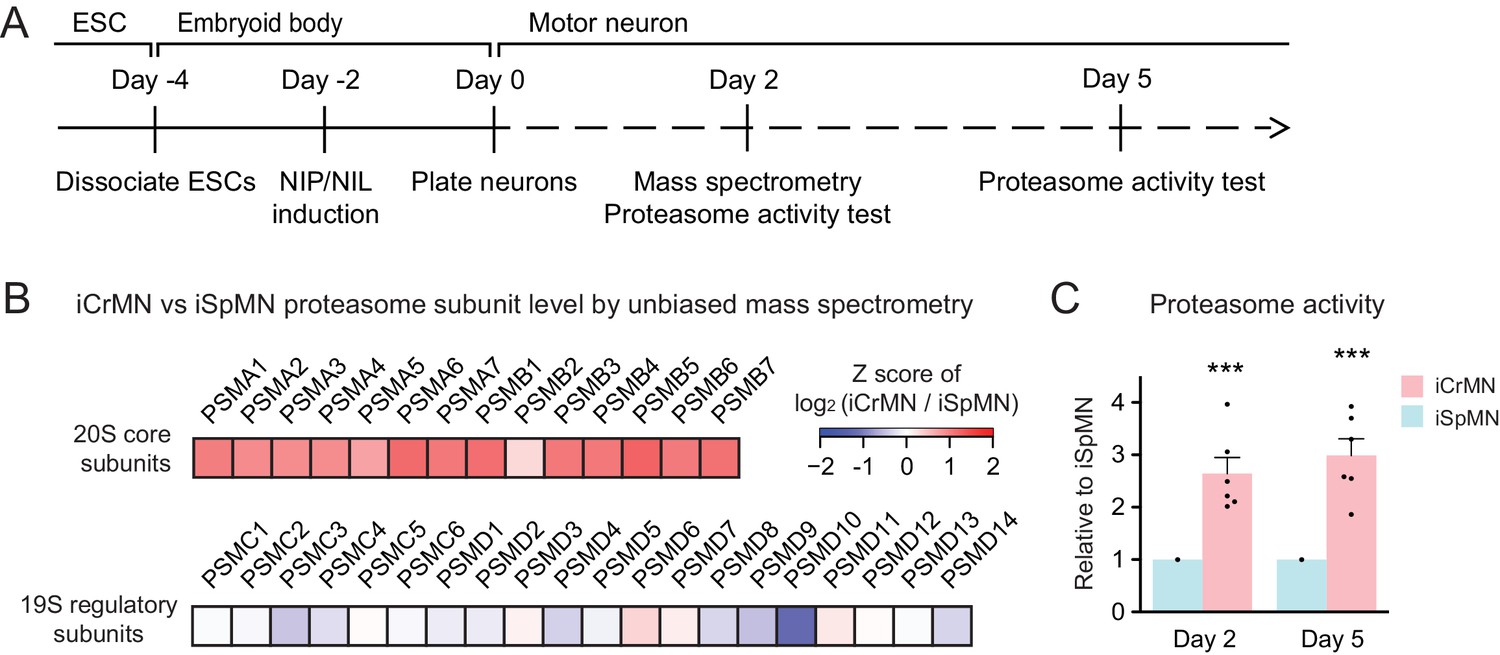
iCrMNs contain more proteasome 20S core subunits and have higher proteasome activity than iSpMNs.
(A) Experimental outline: mass spectrometry was performed in Day two neurons and proteasome activity tests were performed in Day two and Day five living neurons. (B) Unbiased mass spectrometry revealed that iCrMNs contain higher levels of all proteasome 20S core subunits but not 19S regulatory subunits (n = 2). Proteomic data are available in Figure 9—source data 1. (C) iCrMNs have a higher proteasome activity than iSpMNs measured by hydrolysis rate of Suc-LLVY-AMC in living cells (n = 6, mean ± SEM). n = biological replicates; statistical analysis was performed in log-transformed data by student’s t-test, *p<0.05, **p<0.01, ***p<0.001.
-
Figure 9—source data 1
Proteomic data of non-transgenic iCrMNs and iSpMNs by unbiased mass spectrometry.
- https://doi.org/10.7554/eLife.44423.016
Figure 10
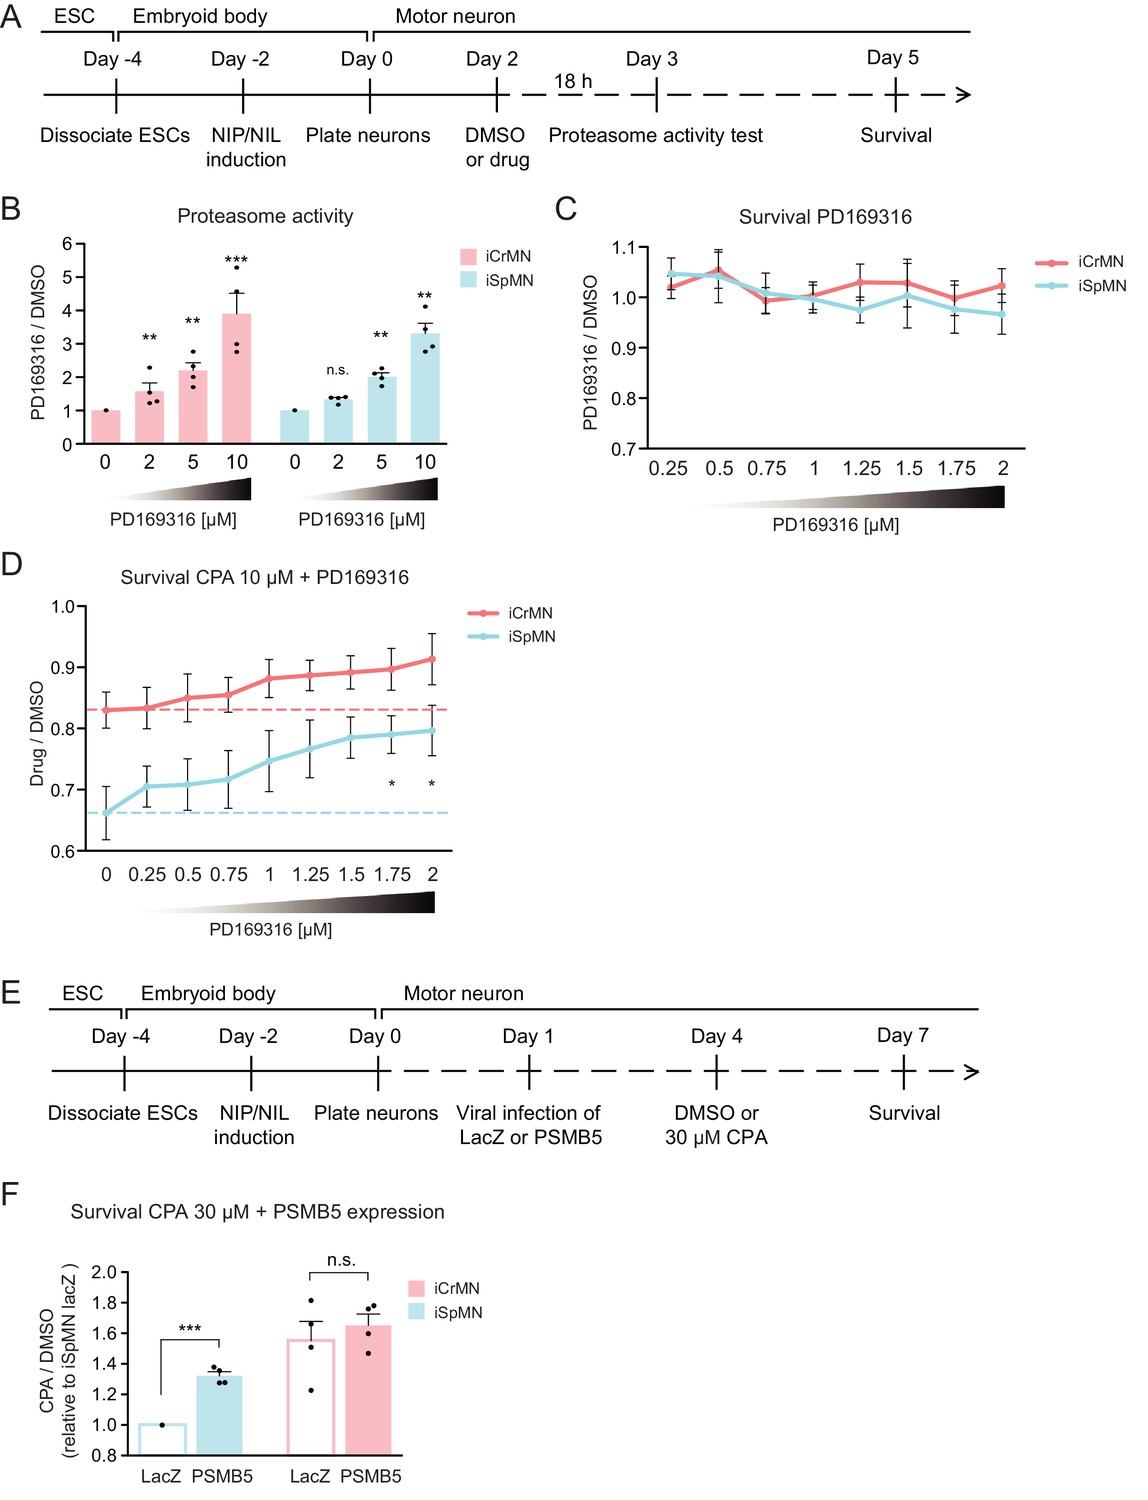
Chemical and genetic activation of the proteasome significantly increased iSpMN survival to proteostatic stress.
(A) Experimental outline: PD169316 effect on proteasome was measured by proteasome activity test after 18 hr treatment of 0–10 μM PD169316 in Day two neurons. Neurons for survival assay were co-treated with 10 μM CPA and DMSO or PD169316 from Day two to Day five and the number of living cells were measured on Day 5. (B) PD169316 increases proteasome activity in both iCrMNs and iSpMNs (n = 4, mean ± SEM). (C) Treatment of 0.25–2 μM PD169316 had no effect on iCrMN and iSpMN survival (n = 6, mean ± SEM). (D) Co-treatment of 1.75 or 2 μM PD169316 with 10 μM CPA significantly increased iSpMN survival compared to treatment of 10 μM CPA alone. There is no significant difference between iCrMN survival with 10 μM CPA alone and iSpMN survival with 10 μM CPA and 0.75–2 μM PD169316 (n = 6, mean ± SEM). (E) Experimental outline: Day 1 iSpMNs and iCrMNs were infected with lentiviruses expressing either LacZ control or PSMB5 and then treated with DMSO or 30 µM CPA on Day four and assessed survival three days later on Day 7. (F) Viral expression of PSMB5 significantly increased iSpMN survival to CPA treatment (n = 4, mean ± SEM). The CPA versus DMSO survival ratio of iSpMNs with LacZ expression was used for normalization for all samples. n = biological replicates; statistical analysis was performed by student’s t-test, *p<0.05, **p<0.01, ***p<0.001.
Figure 11
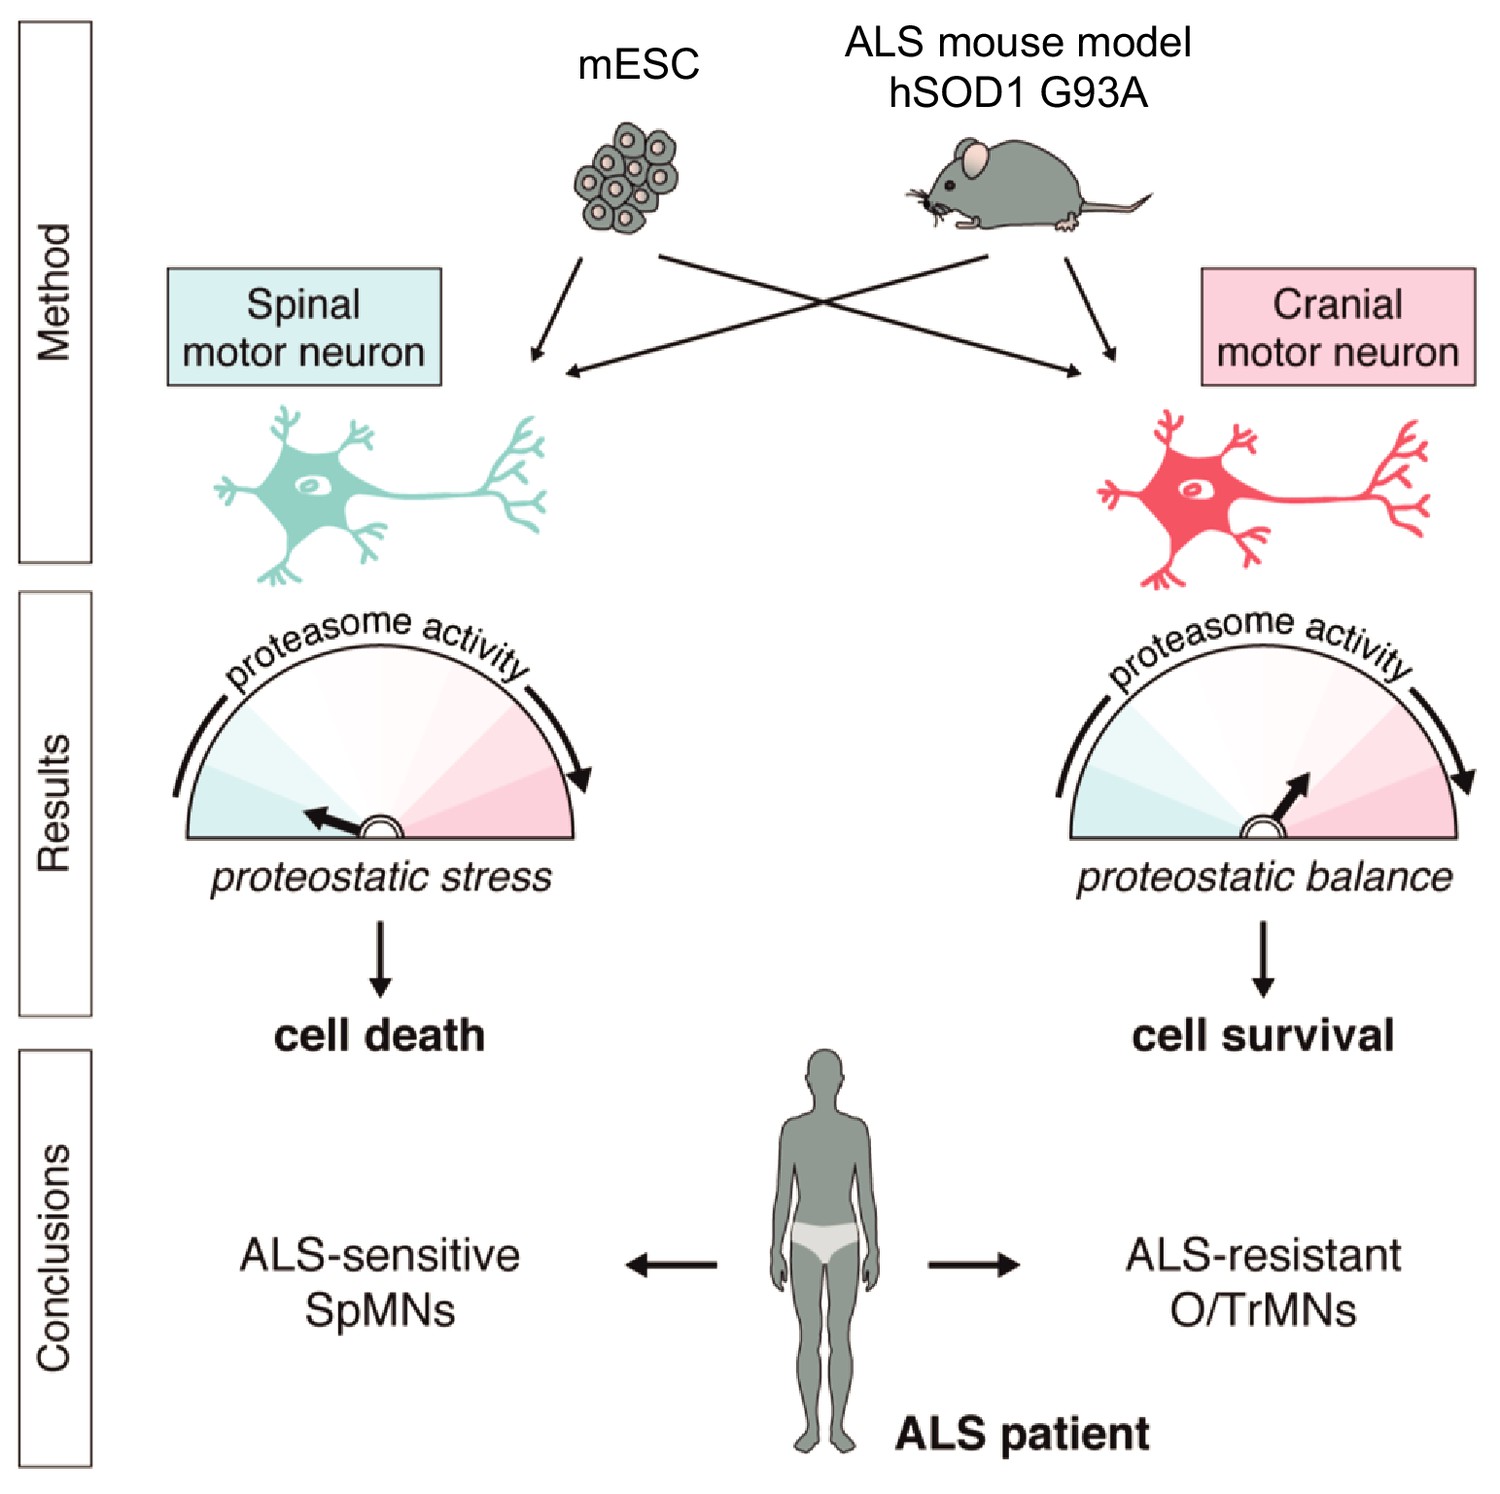
Summary.
Differential vulnerability study using this platform equipped with in vitro and in vivo derived CrMNs and SpMNs has identified a superior proteostatic capacity to maintain a healthy proteome as a possible mechanism to resist ALS-induced neurodegeneration.
Tables
Key resources table
| Reagent type (species) or resource | Designation | Source or reference | Identifiers | Additional information |
|---|---|---|---|---|
| Strain, strain background (Mus musculus) | 129S1/C57BL/6J IslMN:GFP | PMID: 18031680 | MGI: J:132726 | |
| Strain, strain background (Mus musculus) | C57BL/6J | The Jackson Laboratory | JAX: 000664 | |
| Strain, strain background (Mus musculus) | B6.Cg-Tg(SOD1*G93A)1Gur/J | The Jackson Laboratory | JAX: 004435 | |
| Cell line (Mus musculus) | iNIL ESC line | This paper; PMID: 23872598 | Cell line maintained in Mazzoni lab | |
| Cell line (Mus musculus) | iNIP ESC line | This paper; PMID: 23872598 | Cell line maintained in Mazzoni lab | |
| Cell line (Mus musculus) | hSOD1 WT #8 iNIL ESC line | This paper | Cell line maintained in Mazzoni lab | |
| Cell line (Mus musculus) | hSOD1 WT #8 iNIP ESC line | This paper | Cell line maintained in Mazzoni lab | |
| Cell line (Mus musculus) | hSOD1 A4V #15 iNIL ESC line | This paper | Cell line maintained in Mazzoni lab | |
| Cell line (Mus musculus) | hSOD1 A4V #15 iNIP ESC line | This paper | Cell line maintained in Mazzoni lab | |
| Cell line (Mus musculus) | hSOD1 G93A #14 iNIL ESC line | This paper | Cell line maintained in Mazzoni lab | |
| Cell line (Mus musculus) | hSOD1 G93A #14 iNIP ESC line | This paper | Cell line maintained in Mazzoni lab | |
| Antibody | anti-Tubb3 (mouse monoclonal) | BioLegend | Cat. #801201; RRID:AB_2313773 | (1:500) |
| Antibody | anti-Islet1 (rabbit monoclonal) | Abcam | Cat. #ab109517; RRID:AB_10866454 | (1:200) |
| Antibody | anti-HA (rabbit polyclonal) | Abcam | Cat. #ab9110; RRID:AB_307019 | (1:1000 for ICC; 1:5000 for WB) |
| Antibody | anti-SQSTM1/p62 (mouse monoclonal) | Abcam | Cat. #ab56416; RRID:AB_945626 | (1:500 for ICC; 1:5000 for WB) |
| Antibody | anti-ChAT (goat polyclonal) | Millipore | Cat. #AB144P; RRID:AB_2079751 | (1:100) |
| Antibody | anti-SOD1 (rabbit polyclonal) | Abcam | Cat. #ab16831; RRID:AB_302535 | (1:1000) |
| Antibody | anti-ubiquitin (mouse monoclonal) | Cell Signaling Technology | Cat. #3936; RRID:AB_331292 | (1:5000) |
| Antibody | anti-β-actin (mouse monoclonal) | Santa Cruz | Cat. #sc-47778; RRID:AB_2714189 | (1:5000) |
| Peptide, recombinant protein | LIF | Fisher | Cat. #ESG1107 | |
| Peptide, recombinant protein | GDNF | PeproTech | Cat. #450–10 | |
| Peptide, recombinant protein | BDNF | PeproTech | Cat. #450–02 | |
| Peptide, recombinant protein | CNTF | PeproTech | Cat. #450–13 | |
| Peptide, recombinant protein | Suc-LLVY-AMC | Enzo Lifesciences | Cat. #BML-P802 | |
| Commercial assay or kit | In-Fusion HD Cloning Kit | Clontech | Cat. #639647 | |
| Commercial assay or kit | Mouse ES Cell Nucleofector Kit | Lonza | Cat. #VVPH-1001 | |
| Commercial assay or kit | RNeasy Mini Kit | Qiagen | Cat. #74104 | |
| Chemical compound, drug | CHIR99021 | BioVision | Cat. #1991 | |
| Chemical compound, drug | PD0325901 | Sigma | Cat. #PZ0162 | |
| Chemical compound, drug | Forskolin | Fisher | Cat. #BP2520-5 | |
| Chemical compound, drug | Isobutylmethylxanthine (IBMX) | Tocris | Cat. #2845 | |
| Chemical compound, drug | 5-Fluoro-2′-deoxyuridine | Sigma | Cat. #F0503 | |
| Chemical compound, drug | Uridine | Sigma | Cat. #U3003 | |
| Chemical compound, drug | Doxycycline | Sigma | Cat. # D9891 | |
| Chemical compound, drug | Cyclopiazonic acid (CPA) | Sigma | Cat. #C1530 | |
| Chemical compound, drug | Tunicamycin | Sigma | Cat. #T7765 | |
| Chemical compound, drug | Thapsigargin | Sigma | Cat. #586005 | |
| Chemical compound, drug | Brefeldin A | Sigma | Cat. #B7651 | |
| Chemical compound, drug | MG-132 | Sigma | Cat. #474790 | |
| Chemical compound, drug | PD169316 | Sigma | Cat. #P9248 | |
| Software, algorithm | Seurat version 3.0 | PMID: 25867923; 29608179 | ||
| Software, algorithm | Proteome Discoverer 2.2 | Thermo Fisher Scientific | ||
| Other | Fluorescein diacetate | Sigma | Cat. #F7378 | Used as cell viability stain |
Additional files
-
Supplementary file 1
List of plasmids.
- https://doi.org/10.7554/eLife.44423.019
-
Supplementary file 2
List of qPCR primers.
- https://cdn.elifesciences.org/articles/44423/elife-44423-supp2-v2.xlsx
-
Transparent reporting form
- https://doi.org/10.7554/eLife.44423.021
Download links
A two-part list of links to download the article, or parts of the article, in various formats.
Downloads (link to download the article as PDF)
Open citations (links to open the citations from this article in various online reference manager services)
Cite this article (links to download the citations from this article in formats compatible with various reference manager tools)
Stem cell-derived cranial and spinal motor neurons reveal proteostatic differences between ALS resistant and sensitive motor neurons
eLife 8:e44423.
https://doi.org/10.7554/eLife.44423


