Differences across cyclophilin A orthologs contribute to the host range restriction of hepatitis C virus
- Princeton University, United States
Figures
Figure 1 with 2 supplements
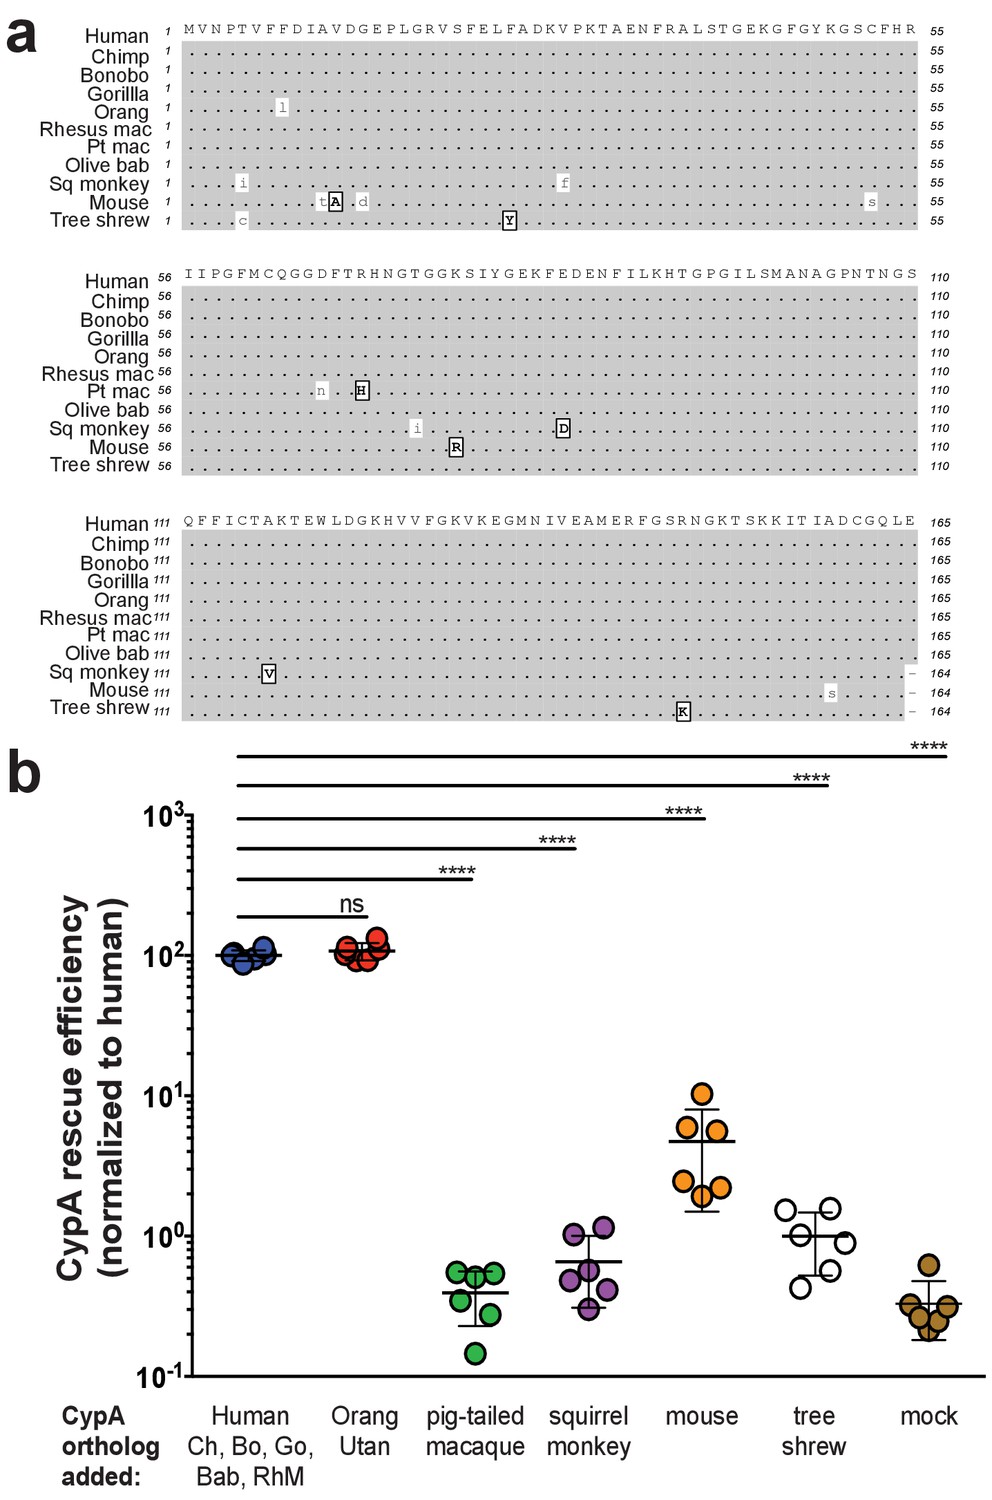
Murine CypA has a diminished ability to facilitate HCV replication.
(A) An amino acid sequence alignment of CypA from diverse species. Similar amino acids are indicated in boxed, bold capital letters while differences are lowercase. Species are arranged from top to bottom in increasing evolutionary distance from human. For pigtailed macaque, all experiments utilized a TRIM5-CypA fusion – only the residues of the CypA portion of the fusion are depicted here. (B) Huh7.5 cells expressing an shRNA against endogenous human CypA (Huh7.5-shRNA CypA) were transduced to express different CypA orthologs and then infected with a HCV reporter genome expressing secreted Gaussia luciferase (Jc1-Gluc, MOI = 0.1). At five dpi, the luciferase activity of the supernatants was assessed as a proxy for viral replication. CypA rescue efficiency is shown normalized to Huh7.5-shRNA CypA transduced with human CypA, which is 100% identical at the amino acid level to chimpanzee, bonobo, gorilla, olive baboon and rhesus macaque CypA. Results shown are from two representative experiments, each with triplicate samples. Lines and error bars represent the mean ± SD. Ordinary two-way ANOVA test performed followed by Dunnett’s multiple comparisons test with all means compared to that of the +human CypA line. Chimp/Ch, chimpanzee; Bo, bonobo; Go, gorilla; Orang, orangutan; Rhesus mac/RhM, rhesus macaque; Pt mac, pigtailed macaque; Olive bab/Bab, olive baboon; Sq monkey, squirrel monkey. ****, p<0.0001; ns, not significant.
Figure 1—figure supplement 1

Assessment of Huh7.5-shRNA CypA cells.
(A) Western blot demonstrating knockdown of human CypA in Huh7.5-shRNA CypA cells relative to the parental Huh7.5 cells and those expressing an shRNA against an irrelevant target (Huh7.5-shRNA irrel). Quantification of signal intensity was done using LI-COR Image Studio Software (version 4.0) with background detection set to ‘Median.’ CypA signal intensity was normalized based off that of β-actin and is expressed here relative to Huh7.5 cells (set at 100%). (B) HCV replication is specifically diminished in Huh7.5-shRNA CypA cells and not Huh7.5-shRNA irrel cells. Infection performed with Jc1-Gluc (MOI = 0.1). On even-numbered days, cells were washed with PBS and the media changed to assess de novo replication. Lines and error bars represent the mean ± SD.
Figure 1—figure supplement 2
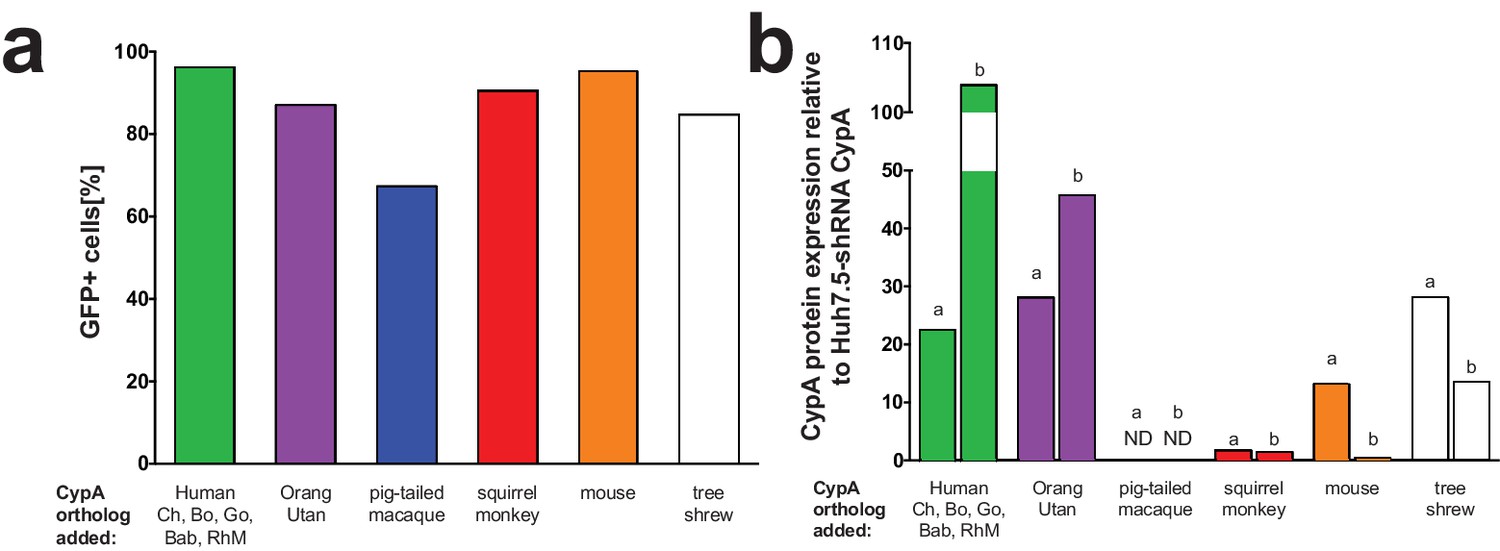
Transduction efficiency of CypA orthologs in Huh7.5-shRNA CypA cells.
Bicistronic constructs expressing the CypA orthologs of interest followed by an IRES-regulated eGFP-ubiquitin-neomycin fusion protein were used to transduce Huh7.5-shRNA CypA cells. Transduction efficiency assessed via flow cytometry and representative data are summarized here from one set of transductions (A). Cell lysates were collected from Huh7.5-shRNA CypA cells transduced with these various constructs and expression determined by western blot (please see Supplementary file 1). Quantification of CypA expression was determined by taking the signal from the CypA band divided by the signal from the β-actin band and then this value divided by that from the untransduced Huh7.5-shRNA CypA cells to give the relative expression (B). Signal intensity was determined using LI-COR Image Studio Software (version 4.0) with background detection set to ‘Lane.’ The ‘a’ and ‘b’ above each bar delineate the different pairs of antibodies used to assess CypA expression. For ‘a,’ the signal was quantified from rabbit anti-CypA and mouse anti-β-actin; for ‘b,’ the signal was quantified from mouse anti CypA and rabbit anti- β-actin. ND, non-detected; Mn, pigtailed macaque.
Figure 2 with 2 supplements
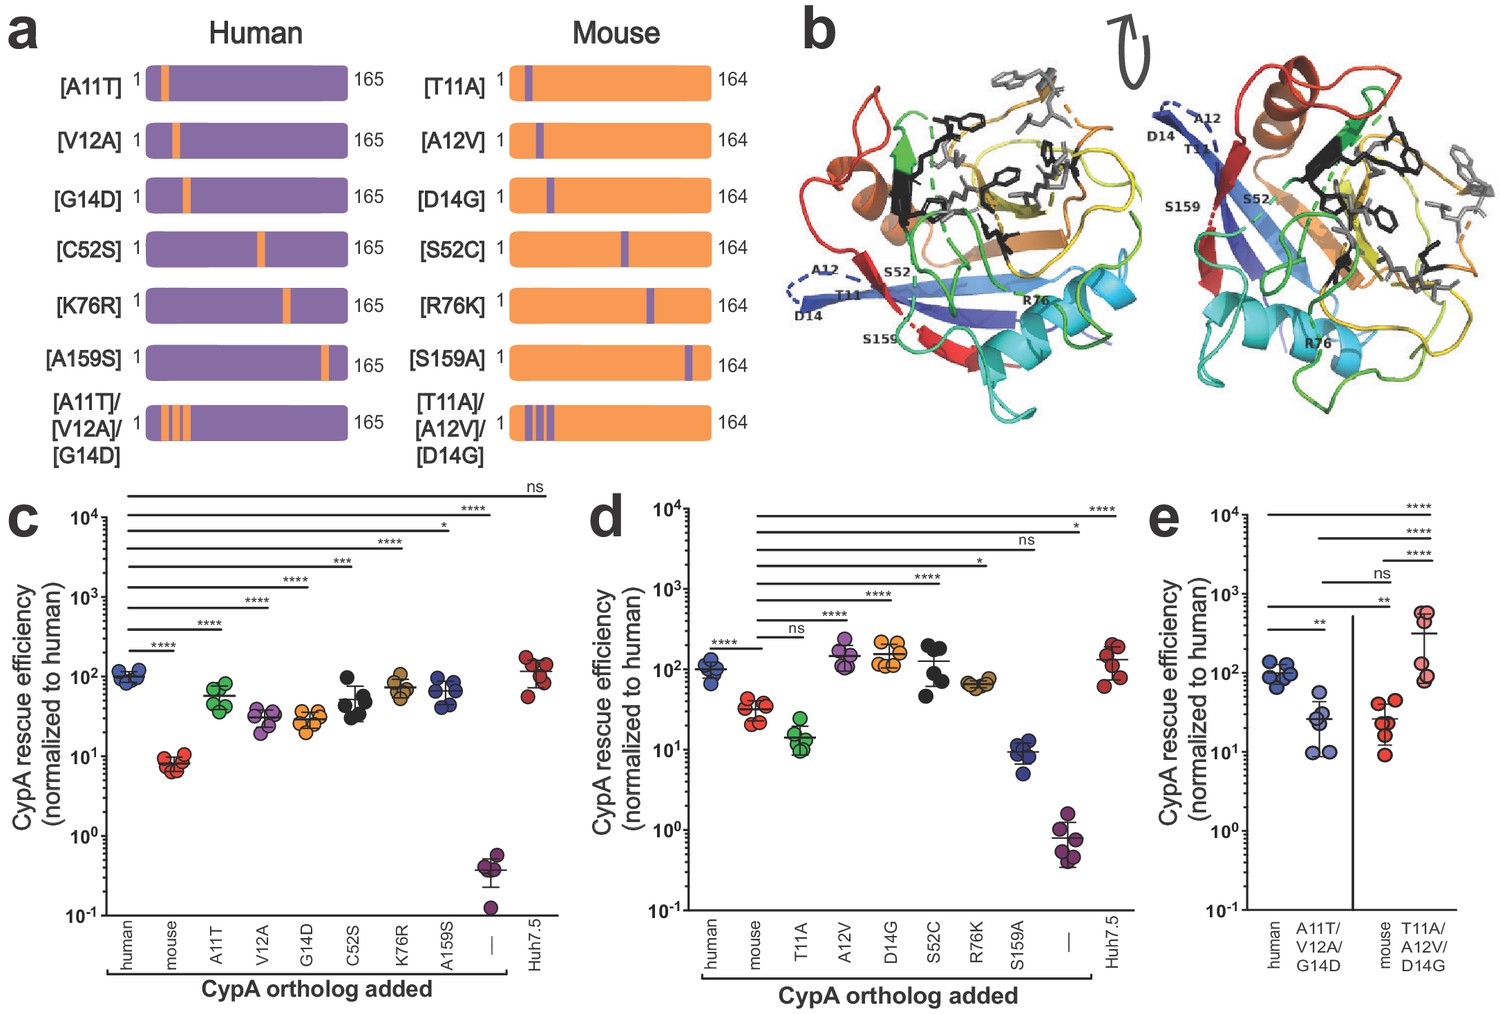
Characterizing the amino acid basis for the differing efficiencies of murine and human CypA in HCV replication.
(A) Schematic depicting the humanized murine CypA and murinized human CypA constructs tested. (B) Modeled structure of human CypA (PDB 1CWA) with the six residues differing between murine and human CypA altered to those of murine CypA and shown labeled. The residues that directly interact with cyclosporine A (CsA) (Arg55, Phe60, Met61, Gln63, Gly72, Ala101, Asn102, Ala103, Gln111, Phe113, Trp121, Leu122 and His126) (Ke et al., 1994) are depicted in gray as stick models. The six residues that comprise the active site (His54, Arg55, Phe60, Gln111, Phe113, and His126) (Zydowsky et al., 1992), five of which also interact with CsA, are shown in black as stick models. Huh7.5-shRNA CypA cells were transduced with the singly murinized human (C), the singly humanized murine (D) or the triply murinized/humanized (E) CypA mutants, infected with Jc1-Gluc at MOI = 0.1 and supernatants assessed for Gaussia luciferase activity as a proxy for HCV replication at five dpi. The rescue efficiency of each mutant was normalized to Huh7.5-shRNA CypA cells transduced with human CypA. Results shown are from two representative experiments, each with triplicate samples. Lines and error bars represent the mean ± SD. Ordinary two-way ANOVA test performed followed by Sidak’s multiple comparison test, with all means compared to that of the +human CypA line (C) or the +mouse CypA line (D). For (E), Tukey's multiple comparison test was used to compare all the means to one another. *, p<0.05; **, p<0.01; ***, p<0.001; ****, p<0.0001; ns, not significant.
Figure 2—figure supplement 1
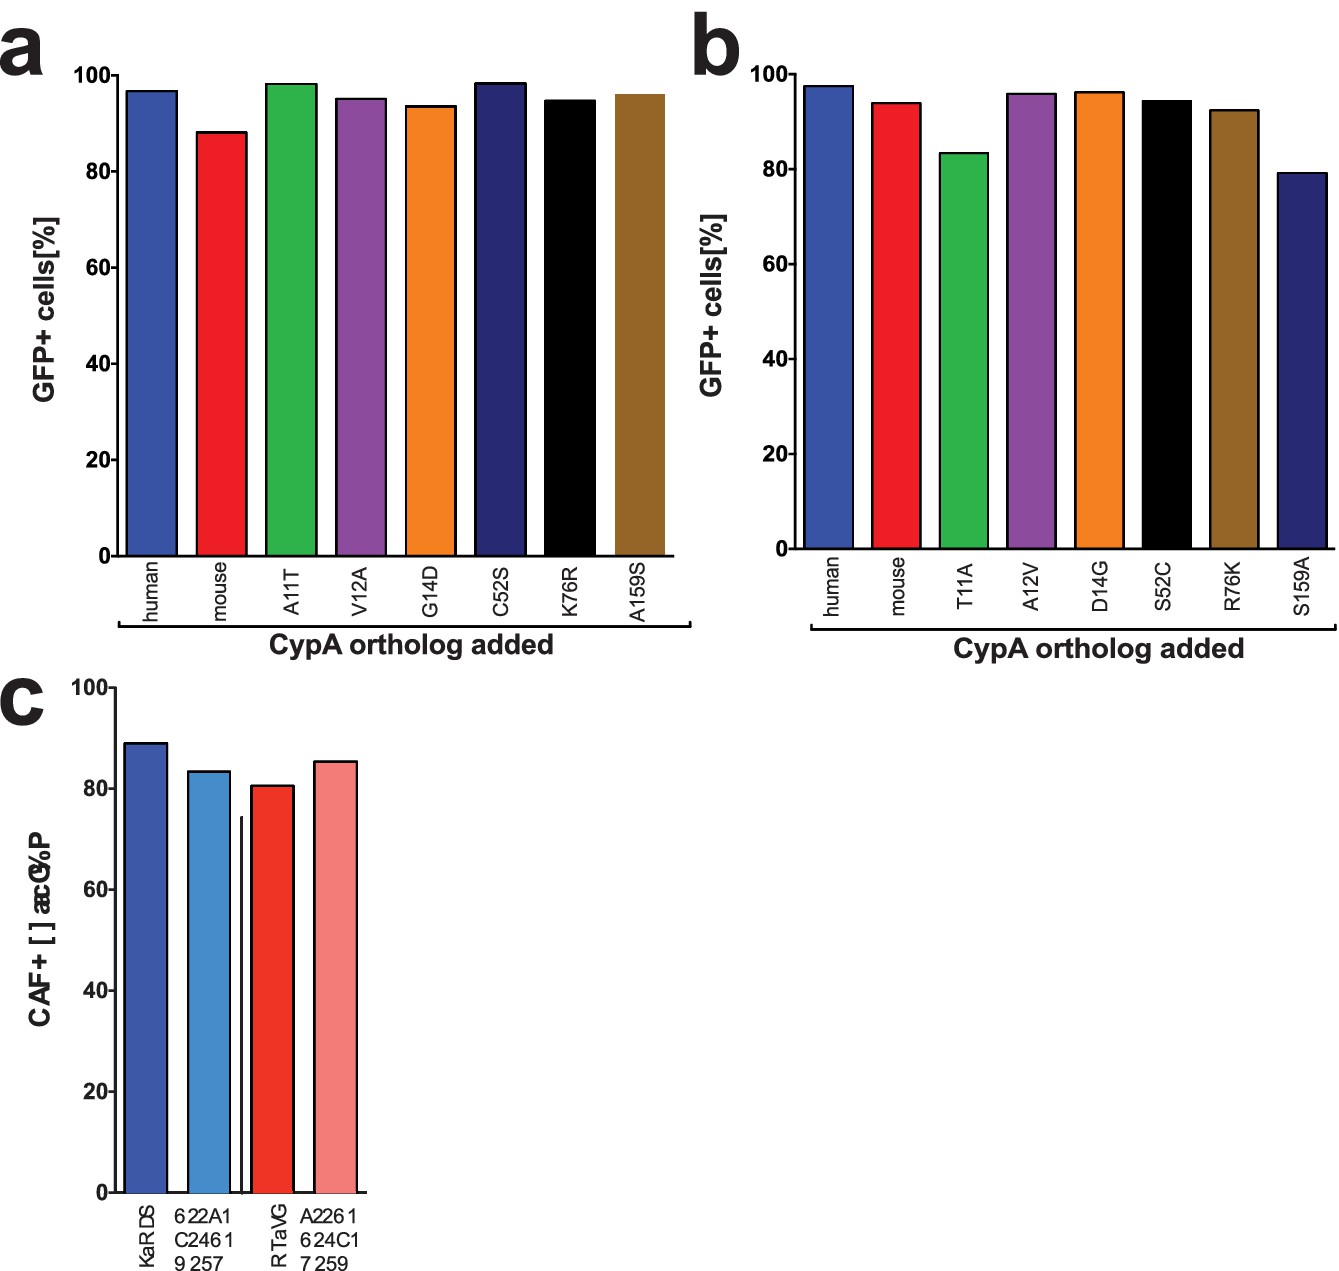
Transduction efficiency of CypA mutants in Huh7.5-shRNA CypA cells.
Bicistronic constructs expressing the CypA mutants shown in Figure 2A followed by an IRES-regulated eGFP-ubiquitin-neomycin fusion protein were used to transduce Huh7.5-shRNA CypA cells. Transduction efficiency assessed via flow cytometry and representative data are summarized here from one set of transductions for the murinized human CypA single mutants (A), humanized mouse CypA single mutants (B) and the triply humanized/triply murinized CypA mutants (C).
Figure 2—figure supplement 2

Expression of CypA mutants in Huh7.5-shRNA CypA cells.
Cell lysates were collected from the transduced Huh7.5-shRNA CypA cells shown in Figure 2 and Figure 2—figure supplement 1 and expression determined by western blot (please see Supplementary file 1) transductions for the murinized human CypA single mutants (A), humanized mouse CypA single mutants (B) and the triply humanized/triply murinized CypA mutants (C). Quantification of CypA expression was determined by taking the signal from the CypA band divided by the signal from the β-actin band and then this value divided by that from the untransduced Huh7.5-shRNA CypA cells to give the relative expression. Signal intensity was determined using LI-COR Image Studio Software (version 4.0) with background detection set to ‘Lane.’ The ‘a’ and ‘b’ above each bar delineate the different pairs of antibodies used to assess CypA expression. For ‘a,’ the signal was quantified from rabbit anti-CypA and mouse anti-β-actin; for ‘b,’ the signal was quantified from mouse anti CypA and rabbit anti- β-actin.
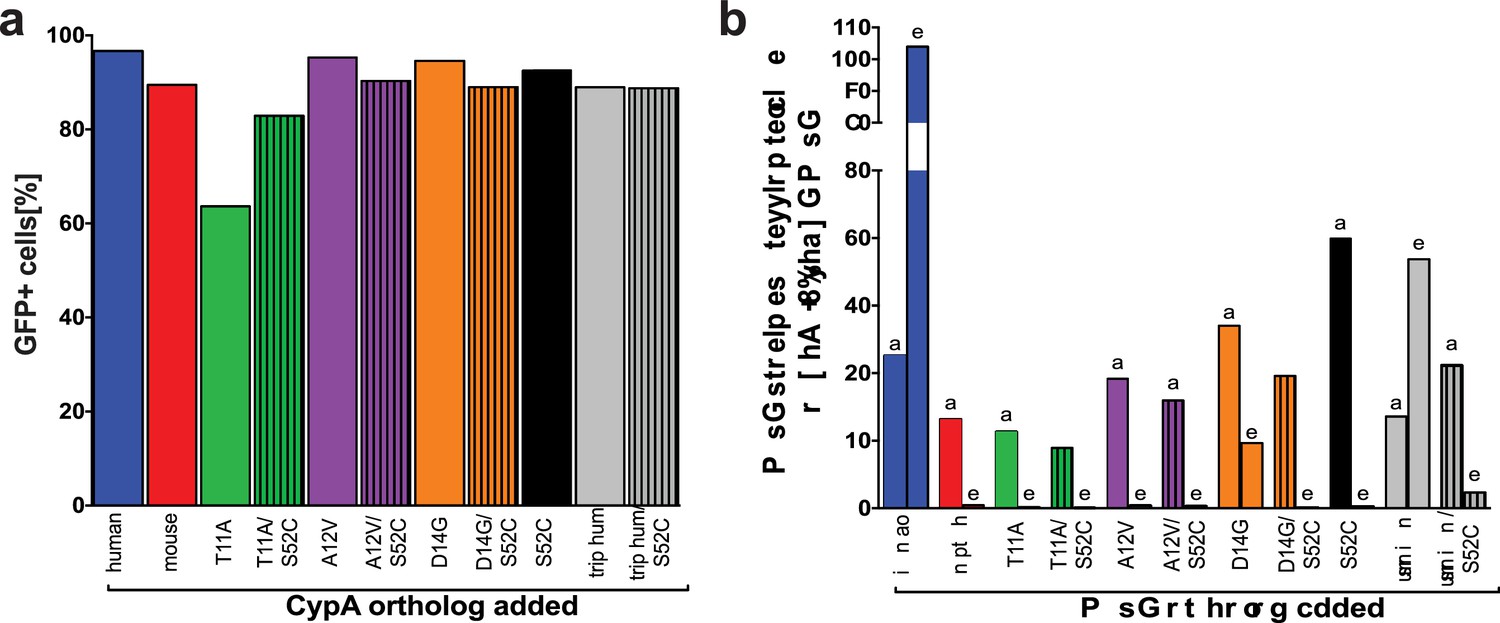
Figure 3 with 1 supplement

Humanizing residue 52 in the murine CypA mutant T11A/A12V/D14G does not further increase rescue efficiency.
(A) Schematic of the additional humanized mouse CypA mutants tested. (B) Huh7.5-shRNA CypA cells were transduced with the mutants shown in (A) and infected with Jc1-Gluc at MOI = 0.1. Supernatants were assessed for Gaussia luciferase activity as a proxy for HCV replication at five dpi, and the rescue efficiency of each mutant was normalized to Huh7.5-shRNA CypA transduced with human CypA. Results shown are from two representative experiments, each with triplicate samples. Lines and error bars represent the mean ± SD. Ordinary two-way ANOVA test performed followed by Sidak’s multiple comparison test, with all means compared to that of the +mouse CypA line. *, p<0.05; **, p<0.01; ***, p<0.001; ****, p<0.0001, ns, not significant.
Figure 3—figure supplement 1
Transduction efficiency of additional mouse-S52C CypA mutants in Huh7.5-shRNA CypA cells.
Bicistronic constructs expressing the CypA mutants shown in Figure 3A followed by an IRES-regulated eGFP-ubiquitin-neomycin fusion protein were used to transduce Huh7.5-shRNA CypA cells. Transduction efficiency assessed via flow cytometry and representative data are summarized here from one set of transductions (A). Cell lysates were collected from Huh7.5-shRNA CypA cells transduced with these various constructs and expression determined by western blot (please see Supplementary file 1). Quantification of CypA expression was determined by taking the signal from the CypA band divided by the signal from the β-actin band and then this value divided by that from the untransduced Huh7.5-shRNA CypA cells to give the relative expression (B). Signal intensity was determined using LI-COR Image Studio Software (version 4.0) with background detection set to ‘Lane.’ The ‘a’ and ‘b’ above each bar delineate the different pairs of antibodies used to assess CypA expression. For ‘a,’ the signal was quantified from rabbit anti-CypA and mouse anti-β-actin; for ‘b,’ the signal was quantified from mouse anti CypA and rabbit anti- β-actin.
Figure 4 with 1 supplement
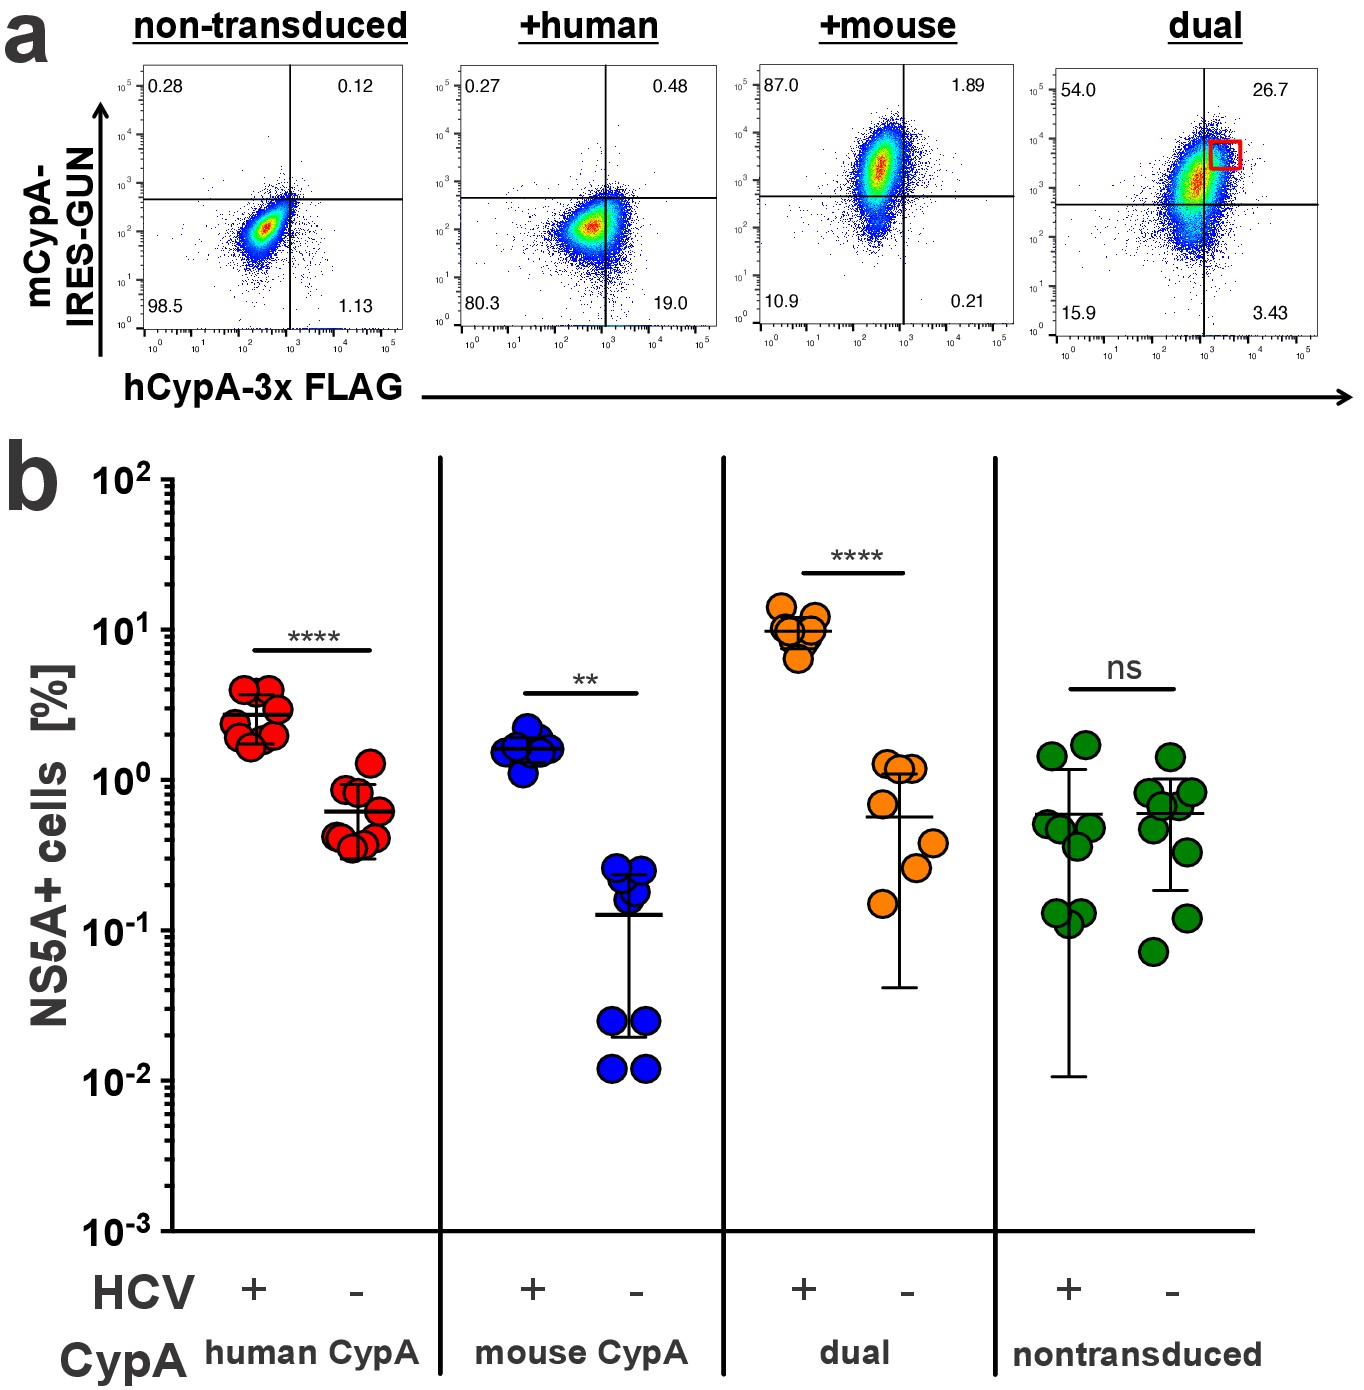
Mouse CypA does not have a dominant negative effect on human CypA in dually transduced cells.
Huh7.5-shRNA CypA cells non-transduced or transduced with a 3x-FLAG-tagged human CypA, mouse CypA (expressing eGFP), or both (A) were infected with Jc1-Gluc (MOI = 0.1). (B) At five dpi, cells were stained with antibodies against FLAG and NS5A for flow cytometry analysis. The percentage of NS5A+ cells was determined from the subset of cells that were FLAG+ for the samples singly transduced with the human CypA construct, eGFP +for the samples singly transduced with the mouse CypA construct or FLAG+/eGFP+ for the cells dually transduced with both the human and mouse CypA constructs. In the latter case, cells with high dual transduction were gated on as shown in (A) and the percentage of NS5A + cells determined from this subset. Data shown represent three independent experiments, each performed in triplicate. Two of the data points for the dually transduced, non-infected cells were zero and thus could not be plotted on a log axis. Lines and error bars represent the mean ± SD. Two-way ANOVA with Sidak multiple comparisons test used for statistical analysis. **, p<0.01; ****, p<0.0001; ns, not significant.
Figure 4—figure supplement 1

Transduction efficiency of mouse CypA-IRES-GUN and human CypA-3x FLAG in Huh7.5-shRNA CypA cells.
Cells were transduced with either mouse CypA-IRES-eGFP alone, human CypA-3x FLAG, both human and mouse, or nothing for the competition experiment shown in Figure 4. Transduction efficiency of both GFP and FLAG were assessed in these lines via flow cytometry and representative data are summarized here from one set of transductions (A). Cell lysates were collected from Huh7.5-shRNA CypA cells transduced with these various constructs and expression determined by western blot (please see Supplementary file 1). Quantification of CypA expression was determined by taking the signal from the CypA band divided by the signal from the β-actin band and then this value divided by that from the untransduced Huh7.5-shRNA CypA cells to give the relative expression (B). Signal intensity was determined using LI-COR Image Studio Software (version 4.0) with background detection set to ‘Lane.’ The ‘a’ and ‘b’ above each bar delineate the different pairs of antibodies used to assess CypA expression. For ‘a,’ the signal was quantified from rabbit anti-CypA and mouse anti-β-actin; for ‘b,’ the signal was quantified from mouse anti CypA and rabbit anti- β-actin.
Figure 5
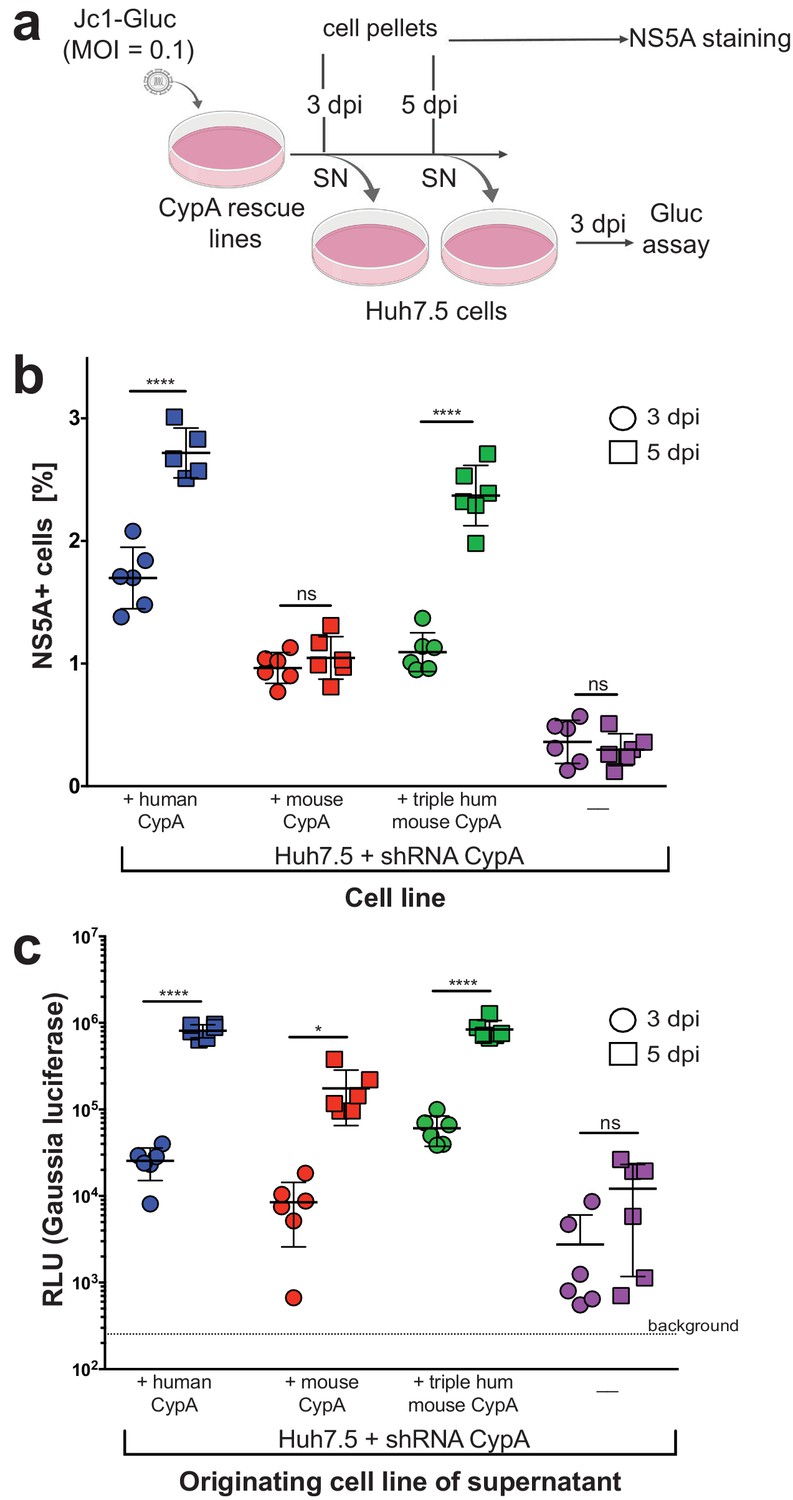
Viral spread and infectious particle production observed over time in HCV-infected rescue lines.
(A) Schematic of experimental workflow. SN, supernatant; Gluc, Gaussia luciferase. Image created with BioRender. (B) Huh7.5-shRNA CypA cells non-transduced or transduced with human, mouse or triply humanized mouse CypA were infected with Jc1-Gluc (MOI = 0.1). At three and five dpi, as represented by circles and squares, respectively, the percentage of NS5A cells compared to naïve cells was assessed by flow cytometry. Note that one human sample had too few cells, so the NS5A staining is shown for only five, instead of six, samples. (C) Supernatants were collected from the infected and naïve cultures at three and five dpi and used to infect naïve Huh7.5 cells. From these infected Huh7.5 cells, supernatants were then collected at three dpi and luciferase activity once more assessed. Circles and squares indicate, respectively, the supernatants collected at 3 and 5 dpi following the infection for which NS5A staining is shown in (B). Results shown are from two representative experiments, each with triplicate samples. Lines and error bars represent the mean ± SD. Ordinary two-way ANOVA test performed followed by Sidak’s multiple comparison test, with the mean value for each cell line at three dpi compared to its mean at five dpi. *, p<0.05; ****, p<0.0001, ns, not significant.
Figure 6

Clone 8 cells express multiple factors important for the HCV life cycle.
(A) Schematic of the engineered murine hepatoma cell line, Clone 8 + murine ApoE (mApoE) derived from Hep56.1D cells. (B) SEC14L2 expression verified by western blot. Mouse anti-human SEC14L2 shown in green (~45 kDa) and rabbit anti-β actin shown in red (~42 kDa). (C) miR-122 expression was assessed by RT-qPCR. Results are normalized to U6 and shown as fold change relative to Huh7.5 cells (set at 100). (D) Clone 8 ± ApoE express human CD81, Venus YFP-human OCLN, Cerulean-human CLDN1, mKate2-human SRBI and murine ApoE-tagRFP as assessed by flow cytometry. (E) The kinetics of HCV replication were assessed in Clone 8 ± ApoE, the parental Hep56.1D cells and the highly permissive human hepatoma cell line Huh7. Cells were infected with Jc1-Gluc at an MOI of 0.1 and supernatants collected daily for six days. On even-numbered days as indicated by the labeled arrows, cells were washed with PBS and the media changed to assess de novo replication. Lines and error bars represent the mean ± SD.
Figure 7
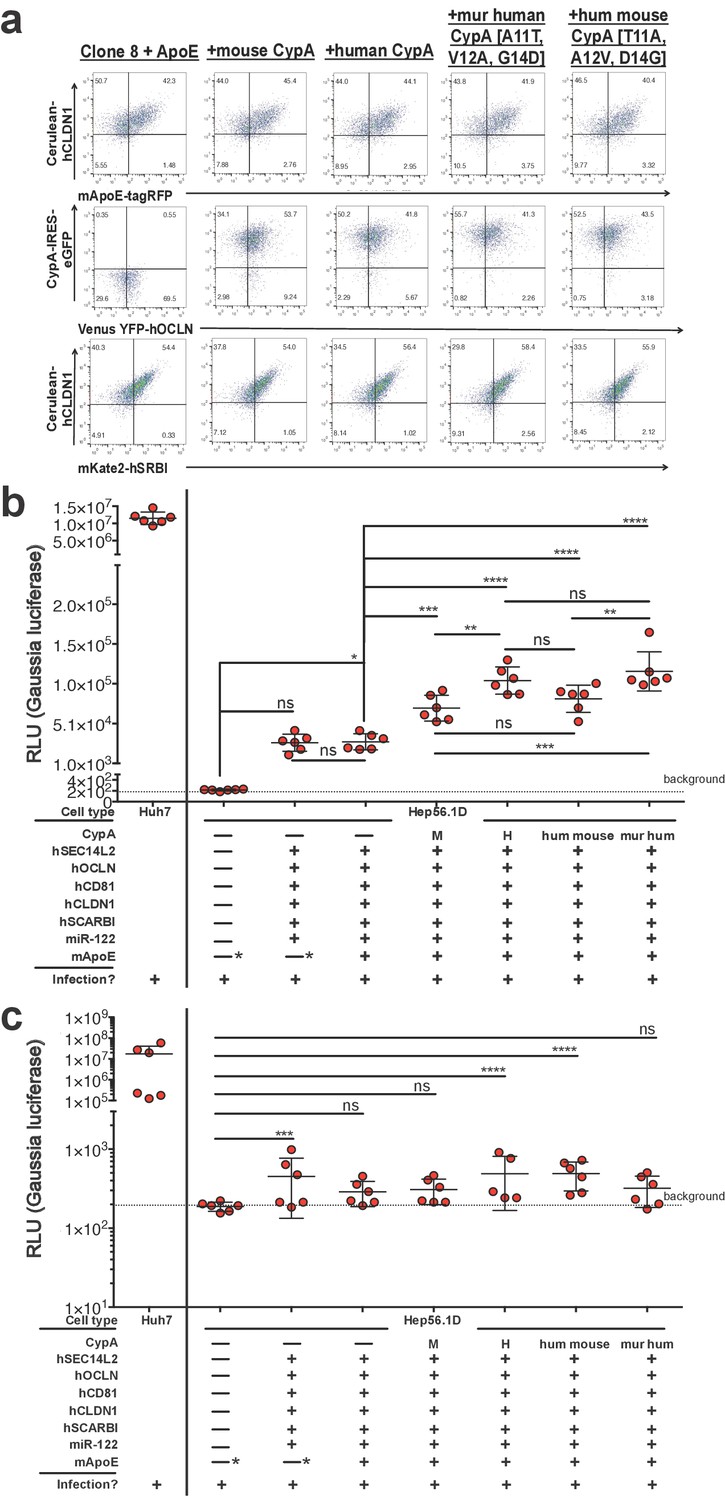
Expressing CypA variants in Clone 8 ± ApoE cells increases HCV replication.
(A) Clone 8 + ApoE cells were transduced with mouse, human, triply murinized human, or triply humanized mouse CypA in bicistronic lentiviral constructs expressing eGFP. Transduction efficiency assessed by flow cytometry. (B) The transduced Clone 8 cells were infected with Jc1-Gluc (MOI = 0.1) and the media changed daily. The different factors transduced into the Hep56.1D cells are specified below the graph. Note that the "—*” for mApoE indicates that these cells were not transduced to express exogenous mApoE; their endogenous expression was not disrupted. Results shown are from two representative experiments, each with triplicate samples. Gaussia luciferase activity was assessed in these supernatants as a proxy for HCV replication and is expressed as relative luminescence units (RLU). Ordinary one-way ANOVA test performed on the Hep56.1D and derivative lines followed by Tukey’s multiple comparisons test with a single pooled variance. The dashed line labeled ‘background’ is the average signal from supernatants of naïve cells. (C) As in (B), Huh7 cells, Hep56.1D and derivative lines as shown on the x-axis were infected with Jc1-Gluc (MOI = 0.1) and supernatants collected at six dpi to infect naïve Huh7.5 cells. Following infection of these Huh7.5 cells with the supernatants, the media was changed daily. Shown is the Gaussia luciferase activity of the Huh7.5 supernatants three dpi with the origin of the supernatants used for the original infection indicated on the X axis. Lines and error bars represent the mean ± SD. The dashed line labeled ‘background’ is the average signal from supernatants of naïve cells. Ordinary two-way ANOVA test performed on the Hep56.1D and derivative lines followed by Dunnett’s multiple comparison test, with all means compared to that of Hep56.1D. Lines and error bars represent the mean ± SD. *, p<0.05; **, p<0.01; ***, p<0.001; ****, p<0.0001.
Tables
Key resources table
| Reagent type (species) or resource | Designation | Source or reference | Identifiers | Additional information |
|---|---|---|---|---|
| antibody | mouse monoclonal anti-B-actin | Cell Signaling Technology | Cell Signaling Technology:3700 | used at 1:1000 for western blot |
| antibody | rabbit polyclonal anti-CypA | Cell Signaling Technology | Cell Signaling Technology:2175S | used at 1:1000 for western blot |
| antibody | rabbit monoclonal anti-GFP (D5.1) XP | Cell Signaling Technology | Cell Signaling Technology:2956S | used at 1:1000 for western blot |
| antibody | goat anti-mouse IgG (H + L) secondary, Dylight 680 | Thermo Fisher Scientific | Thermo Fisher Scientific:35568 | used at 1:10,000 for western blot |
| antibody | goat anti-mouse IgG (H + L) secondary, Dylight 800 | Thermo Fisher Scientific | Thermo Fisher Scientific:SA535521 | used at 1:10,000 for western blot |
| antibody | goat anti-rabbit IgG (H + L) cross-adsorbed secondary, Alexa 700 | Invitrogen | Invitrogen:A-21038 | used at 1:250 for flow cytometry |
| antibody | goat anti-mouse IgG (H + L) cross-adsorbed secondary, Alexa 647 | Invitrogen | Invitrogen:A-21235 | used at 1:250 for flow cytometry |
| antibody | rabbit anti-β actin | Cell Signaling Technology | Cell Signaling Technology:4970S | used at 1:2000 for western blot |
| antibody | mouse monoclonal anti-human CypA | AbCam | AbCam:58144 | used at 1:1000 (from 1 mg/mL stock) for western blot |
| antibody | monoclonal, human CD81 conjugated to PE | BD Biosciences, Inc. | BD Biosciences, Inc:BDB555676 | used at 1:200 for flow cytometry |
| antibody | mouse monoclonal anti-human SEC14L2 | LifeSpan BioSciences, Inc. | LifeSpan BioSciences, Inc:LS-B11733 | used at 1:1000 for western blot |
| antibody | rabbit monoclonal anti-FLAG | Cell Signaling Technology | Cell Signaling Technology:14793S | used at 1:1500 for flow cytometry |
| antibody | mouse monoclonal 9E10 | Charles Rice (Rockefeller University) | antibody against HCV NS5A; published in Lindenbach et al., 2005 | |
| cell line (Homo sapiens) | Huh7.5.1 | Frank Chisari (The Scripps Research Institute) | RRID:CVCL_E049 | Human hepatoma cell line |
| cell line (Mus musculus) | Hep56.1D | CLS Cell Lines Service GmbH (Eppelheim, Germany) | RRID:CVCL_5769 | Murine hepatoma cell line |
| cell line (Mus musculus) | Clone 8 | this paper | Please see methods section in manuscript for detailed information concerning the generation of this line from Hep56.1D cells and the plasmids used | |
| cell line (Homo sapiens) | 293T | Charles Rice (Rockefeller University) | RRID:CVCL_0063 | Human embryonic kidney cell line |
| cell line (Homo sapiens) | Huh7.5 | Charles Rice (Rockefeller University) | RRID:CVCL_7927 | Human hepatoma cell line |
| cell line (Homo sapiens) | Huh7.5-shRNA-irrel | von Hahn et al., 2012 | Human hepatoma cell line Huh7.5 expressing an shRNA against an irrelevant target | |
| cell line (Homo sapiens) | Huh7.5-shRNA-CypA | von Hahn et al., 2012 | Human hepatoma cell line Huh7.5 expressing an shRNA against human CypA | |
| cell line (Homo sapiens) | Huh7 | Charles Rice (Rockefeller University) | RRID:CVCL_0336 | Human hepatoma cell line |
| commercial assay or kit | Gibson Assembly kit | New England Biolabs | NEB:E5510s | |
| commercial assay or kit | In-Fusion HD Cloning | Clontech | Clontech:639647 | |
| commercial assay or kit | QuikChange XL Site-Directed Mutagenesis kit | Agilent | Agilent:200517 | |
| commercial assay or kit | QuikChange Multi Site-Directed Mutagenesis kit | Agilent | Agilent:200514 | |
| commercial assay or kit | Luc-Pair Renilla Luciferase HS Assay Kit | GeneCopoeia | GeneCopoeia:LF012 | |
| commercial assay or kit | T7 RiboMAX Express Large Scale RNA Production kit | Promega | Promega:PRP1320 | |
| recombinant DNA reagent (plasmid) | Jc1(p7nsGluc2a) | Marukian et al., 2008 | ||
| recombinant DNA reagent (plasmid) | pWPI-human CypA-IRES-GUN | von Hahn et al., 2012 | plasmid expressing human CypA open reading frame followed by IRES-regulated green fluorescent protein (GFP)-ubiquitin-neomycin (GUN) fusion protein | |
| recombinant DNA reagent (plasmid) | pWPI-orangutan CypA-IRES-GUN | this paper | plasmid expressing orangutan CypA open reading frame followed by IRES-GUN | |
| recombinant DNA reagent (plasmid) | pWPI-tree shrew CypA-IRES-GUN | this paper | plasmid expressing tree shrew CypA open reading frame followed by IRES-GUN | |
| recombinant DNA reagent (plasmid) | pWPI-squirrel monkey CypA-IRES-GUN | this paper | plasmid expressing squirrel monkey CypA open reading frame followed by IRES-GUN | |
| recombinant DNA reagent (plasmid) | pWPI-mouse CypA-IRES-GUN | this paper | plasmid expressing pigtailed macaque TRIM-CypA open reading frame followed by IRES-GUN | |
| recombinant DNA reagent (plasmid) | pWPI-humanized mouse CypA-IRES-GUN mutants | this paper | The six amino acid residues that differ between human and mouse CypA were changed one at a time or in varying combinations in mouse CypA to make it ‘humanized.’ Please see Materials and methods section for the generation of all these plasmids | |
| recombinant DNA reagent (plasmid) | pWPI-murinized human CypA-IRES-GUN mutants | this paper | The six amino acid residues that differ between human and mouse CypA were changed one at a time or in varying combinations in human CypA to make it ‘murinized.’ Please see Materials and methods section for the generation of all these plasmids | |
| recombinant DNA reagent (plasmid) | pWPI-pigtailed macaque TRIM-CypA-IRES-GUN | this paper | ||
| recombinant DNA reagent (plasmid) | pLVX-IRES-puro | Clontech | Clontech:632183 | |
| sequence-based reagent | all primers beginning with PU-O- | Integrated DNA Technologies | please see Table 1 in the Materials and methods section for all primer sequences and their use | |
| software, algorithm | GraphPad Prism | GraphPad Software, Inc | Version 6.0e | |
| software, algorithm | FlowJo | FlowJo, LLC | Version 10.4.2 | |
| software, algorithm | MacVector | MacVector, Inc | Version 12.7.4 |
Table 1
Oligonucleotides utilized in constructing the described plasmids.
https://doi.org/10.7554/eLife.44436.016| Primer ID | Nucleotide sequence (5’−3’) |
|---|---|
| PU-O-3432 | TGCAGCCCGTAGTTTACTAGTTTATTCGAGTTGTCCACAGTCAG |
| PU-O-3428 | ACCTGCAGGCGCGCCGGATCCATGGTCAACCCTACCGTGTTCTTGGACATT |
| PU-O-3853 | TTCTTCGACATTACGGTCGACGGCGAGCCC |
| PU-O-3854 | GGGCTCGCCGTCGACCGTAATGTCGAAGAA |
| PU-O-3855 | TTCGACATTGCCGCCGACGGCGAGCCC |
| PU-O-3856 | GGGCTCGCCGTCGGCGGCAATGTCGAA |
| PU-O-3857 | ATTGCCGTCGACGACGAGCCCTTGGGC |
| PU-O-3858 | GCCCAAGGGCTCGTCGTCGACGGCAAT |
| PU-O-3859 | TATAAGGGTTCCTCCTTTCACAGAATTATTCC |
| PU-O-3860 | GGAATAATTCTGTGAAAGGAGGAACCCTTATA |
| PU-O-3861 | GGCACTGGTGGCAGGTCCATCTATGGG |
| PU-O-3862 | CCCATAGATGGACCTGCCACCAGTGCC |
| PU-O-3863 | AAGATCACCATTTCCGACTGTGGACAACTC |
| PU-O-3864 | GAGTTGTCCACAGTCGGAAATGGTGATCTT |
| PU-O-3871 | TTCTTCGACATCGCCGCCGATGACGAG |
| PU-O-3872 | CTCGTCATCGGCGGCGATGTCGAAGAA |
| PU-O-3873 | TTCGACATCACGGTCGATGACGAGCCC |
| PU-O-3874 | GGGCTCGTCATCGACCGTGATGTCGAA |
| PU-O-3875 | ATCACGGCCGATGGCGAGCCCTTGGGC |
| PU-O-3876 | GCCCAAGGGCTCGCCATCGGCCGTGAT |
| PU-O-3877 | TATAAGGGTTCCTGCTTTCACAGAATTATTCC |
| PU-O-3878 | GGAATAATTCTGTGAAAGCAGGAACCCTTATA |
| PU-O-3879 | GGCACTGGCGGCAAGTCCATCTACGGAGAG |
| PU-O-3880 | CTCTCCGTAGATGGACTTGCCGCCAGTGCC |
| PU-O-3881 | AAGATCACCATTGCTGACTGTGGACAG |
| PU-O-3882 | CTGTCCACAGTCAGCAATGGTGATCTT |
| PU-O-1755 | ATGAGCGGCAGAGTCGGCGATCTGA |
| PU-O-1756 | TTATTTCGGGGTGCCTGCCCCCAGC |
| PU-O-1943 | TATTTCCGGTGAATTCCTCGAGATGAGCGGCAGAG |
| PU-O-1944 | GGGAGGGAGAGGGGCGGGATCCTTATTTCGGGGTG |
| PU-O-3851 | CTTGCATGCCTGCAGGTCGACATGGTCAACCCCACC |
| PU-O-3852 | CGGCCAGTGAATTCGAGCTCGGTACCTTATTCGAGTTGTCC |
| PU-O-4211 | CGGCCAGTGAATTCGAGCTCGGTACCTTAGAGCTGTCCACAGTC |
| PU-O-3424 | ACCTGCAGGCGCGCCGGATCCATGGTCAACCCCACCGTGTT |
| PU-O-3429 | TGCAGCCCGTAGTTTACTAGTTTAGAGCTGTCCACAGTCGGAAA |
| PU-O-3432 | TGCAGCCCGTAGTTTACTAGTTTATTCGAGTTGTCCACAGTCAG |
Additional files
-
Supplementary file 1
Detection of CypA expression by western blotting.
All the constructs utilized in this paper were analyzed by western blot across two membranes. Shown here are the membranes after exposure to different combinations of antibodies, with the column on the left all images of one membrane and the column on the right images of the second. Whether the bands observed in a given set of membranes originated from the goat, mouse or both secondary antibodies is delineated at the left of each row. The proteins represented by the bands are also labeled, with ‘(M)’ and ‘(R)’ indicating signal from anti-mouse or anti-rabbit secondary, respectively. The blots shown in (A) were incubated with the following primary antibodies: rabbit anti-GFP (1:1000, Cell Signaling Technologies #2956S), mouse anti-β-actin (1:1000, Cell Signaling Technologies, #3700), and rabbit anti-CypA (1:1000, Cell Signaling Technologies #2175S). These blots were stripped and re-probed in (B) with the following primary antibodies: rabbit anti-GFP (1:1000, Cell Signaling Technolgoies #2956S), rabbit anti-β-actin (1:1000, 4970S), and mouse anti-CypA (1:1000, AbCam, Ab58144). Note that for more accurate quantification, the β-actin and CypA antibodies used in (B) were raised in different host species from those in (A) so that the residual signal left on the membrane from the first probing could be distinguished. For (A), the signal from the anti-rabbit secondary was used to quantify the CypA bands and that from the anti-mouse secondary for β-actin. For (B), the signal from the anti-mouse secondary was used to quantify the CypA bands and that from the anti-rabbit secondary for β-actin. The quantifications for these bands are shown in the respective Figure Supplements for the experiments where each construct was used. The source of the protein lysate run in each lane and size of the expected bands is listed in (C) in accordance with the numbers listed at the top of each membrane.
- https://doi.org/10.7554/eLife.44436.017
-
Supplementary file 2
Protein sequence similarity and identity matrices of PI4KA from select species.
- https://doi.org/10.7554/eLife.44436.018
-
Transparent reporting form
- https://doi.org/10.7554/eLife.44436.019
Download links
A two-part list of links to download the article, or parts of the article, in various formats.
Downloads (link to download the article as PDF)
Open citations (links to open the citations from this article in various online reference manager services)
Cite this article (links to download the citations from this article in formats compatible with various reference manager tools)
Differences across cyclophilin A orthologs contribute to the host range restriction of hepatitis C virus
eLife 8:e44436.
https://doi.org/10.7554/eLife.44436


