Elastic instability during branchial ectoderm development causes folding of the Chlamydosaurus erectile frill
- University of Geneva, Switzerland
- SIB Swiss Institute of Bioinformatics, Switzerland
Figures
Figure 1
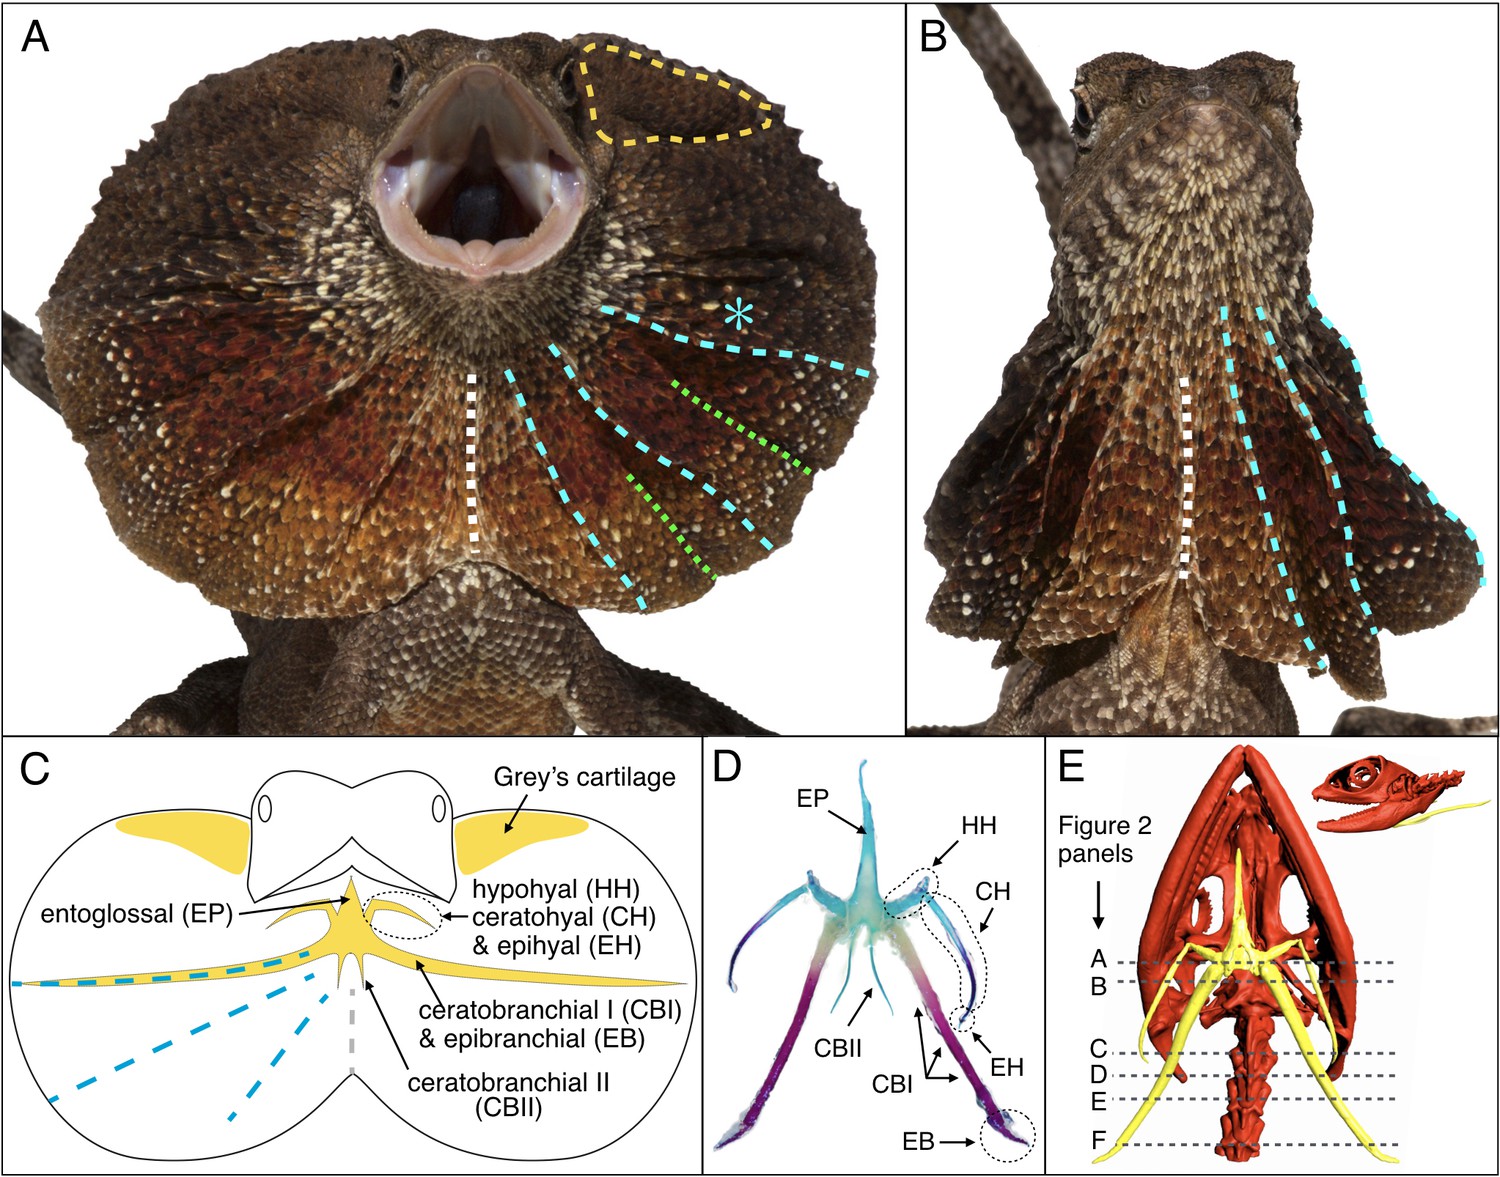
Morphology of the Chlamydosaurus frill and associated hyoid apparatus.
(A) Erected and (B) folded frill of a juvenile (11 months old) frilled dragon. The left and right lobes of the frill each presents 3 pairs of convex ridges (cyan lines), two pairs of valley folds (green lines); the two lobes are joined at a central crease (white line). (C) The CBI + EB and ‘Grey’s cartilage’ (yellow line in A) are embedded in the third convex ridge (cyan star in A) and the dorsal side of the frill, respectively. (D) Adult hyoid apparatus treated with alcian blue (staining cartilage) and alizarin red (staining bone). ‘EP’: entoglossal process, ‘HH’: hypohyal, ‘CH’: ceratohyal, ‘EH’: epihyal, ‘CBI’: ceratobranchial I, ‘EB’: epibranchial, ‘CBII’: ceratobranchial II. The central and anterior parts of the hyoid apparatus and first pair of horns (HH +CH + EH) originate from the second branchial arch (BA2), whereas the second (CBI + EB) and third (CBII) horns originate from the BA3 and BA4, respectively. (E) CT scan of an adult female (yellow, hyoid apparatus; red, skull and vertebrae); dashed lines indicate the approximate position of histological sections in Figure 2.
Figure 2
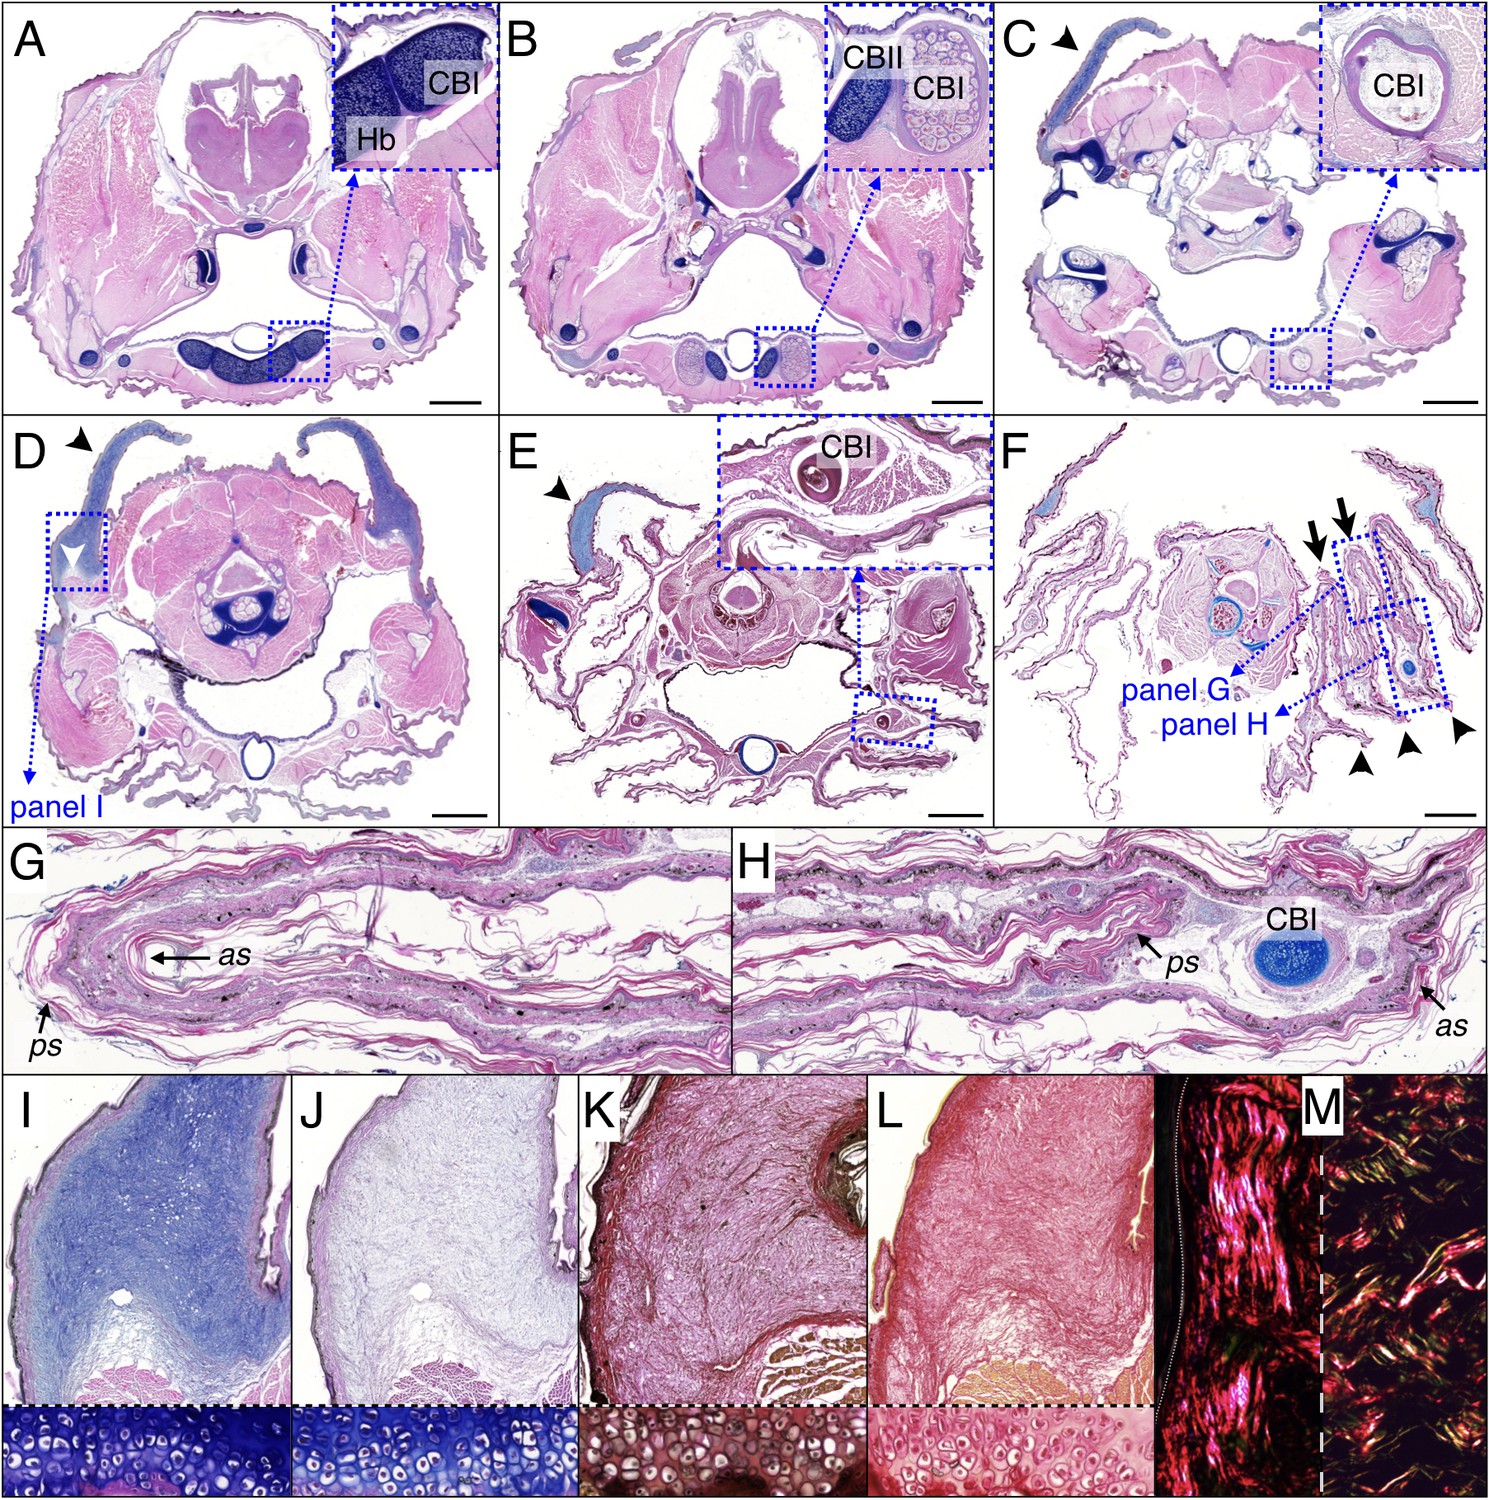
Histology of frill tissues and characterisation of the ‘Grey’s cartilage’ in a 9 month-old Chlamydosaurus.
Approximate positions of the transverse sections are indicated in Figure 1E. (A) The ceratobranchials I (CBI) are attached to the cartilaginous hyoid body (Hb) and (B) become ossified when they detached from the hyoid body, while the CBII remain cartilaginous. (C,D) The ‘Grey’s cartilage’ (black arrowheads) is situated close to the tympanic membrane and its proximal end is attached to muscles (white arrowhead in D). (E) The CBI incorporates within the 3rd ridge. (F) The frill detaches from the throat and forms three convex ridges (arrowheads) and two concave folds (arrows). (G,H) Close-ups of anterior (as) and posterior (ps) skin sheets of panel F: as and ps have similar lengths in the two concave folds (G) whereas as is longer than ps in the three convex ridges (H). (I,J) Root of the Grey’s cartilage (close-up of D): stained deep blue by alcian blue, hematoxylin and eosin (I), but dull-blue by alcian blue and MgCl2 (J), which indicates the presence of weakly-sulphated GAGs. (K,L) The Grey's cartilage does not contain elastic fibres (otherwise it would be stained blue-black in K by the ‘elastic stain kit’), but is rich in collagen fibres that are stained red by the ‘elastic stain kit’ (K) and by Sirius Red (L). Lower panels in I-L show cell-resolution closeups of intervertebral fibrocartilage. (M) Under polarised light, Sirius Red staining reveals a majority of thick fibres at the vicinity of the epidermis (left panel) and a mix of thin and thick fibres deeper in the tissue (right panel). Scale bars = 2 mm.
Figure 3
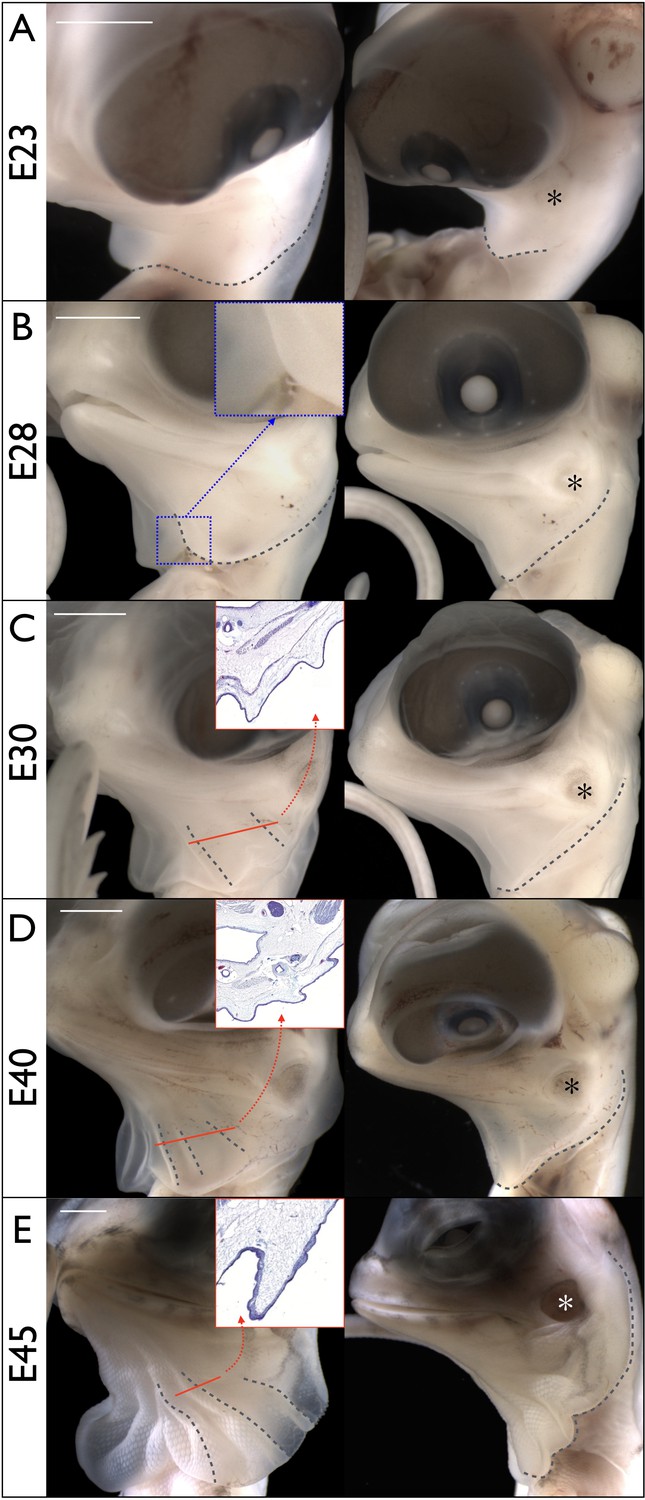
Morphogenesis of the Chlamydosaurus frill.
Left and right columns are frontal and lateral views of the same embryo; E = days post-oviposition; grey dotted lines: frill outline and convex ridges. (A) At about E23, the developing frill is visible as a smooth skin outgrowth. (B) At E28, the central crease (inset) is clearly visible and the dorsal side of the frill extends to the tympanic membrane (asterisks in all right panels). (C) At E30, two convex pleats are visible on each lobe of the frill and the dorsal side extends beyond the tympanic membrane. (D) At E40, three pleats are visible. (E) At E45 the morphogenesis of the frill is mostly achieved. Although no pleat is visible in simple bright field microscopy at E28, episcopic microscopy indicates that low amplitude folding has already started at that stage. The insets in C, D, and E show the folding of the anterior surface of the frill at the position of the corresponding red line. Scale bars: 2 mm.
Figure 4
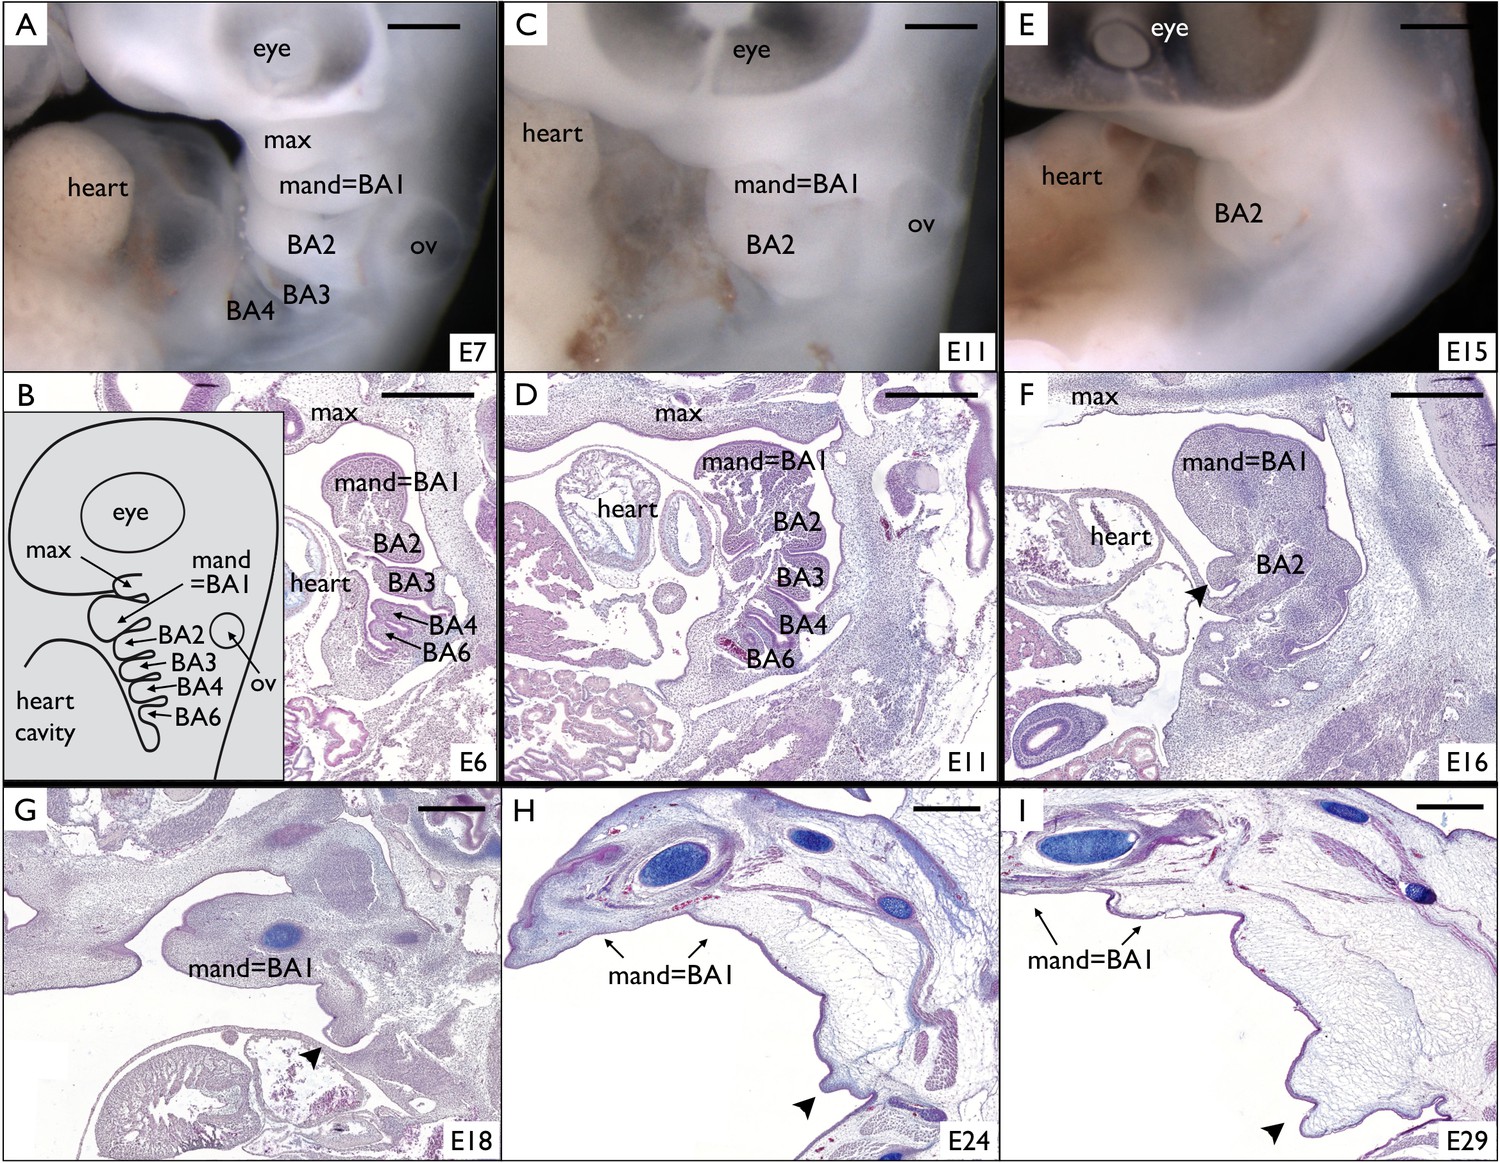
Incomplete fusion of BA2 allows the development of a frill in Chlamydosaurus.
(A) At developmental stage 30 (based on Wise et al., 2009, that is E6-7 in Chlamydosaurus) the BA2, BA3, and BA4 are situated behind the hearth cavity and (B) the BA6 is only visible on parasagittal sections. Inset of B: schematic diagram of branchial arches organisation in land vertebrate embryos. (C,D) At stages 30–31 (about E11), the BA2 is still externally visible while the more posterior branchial arches are internalised. (E,F) At stage 32, (i.e., about E15-16), a portion of BA2 (arrowhead) does not fuse with the cardiac eminence. (G,H,I) At later developmental stages (stages 32–33, 34, and 36, that is about E18, E24, and E29, respectively), the unfused portion of BA2 (arrowheads) intensively grows and generates the frill. ‘BA1’ to ‘BA6'=branchial arches 1 to 6; ‘heart’=heart cavity; 'max'=maxillary process; ‘ov’=otic vesicle. Note that the first branchial arch (BA1) generates the mandibular process (‘mand’). Scale bars = 500 μm.
Figure 5 with 1 supplement
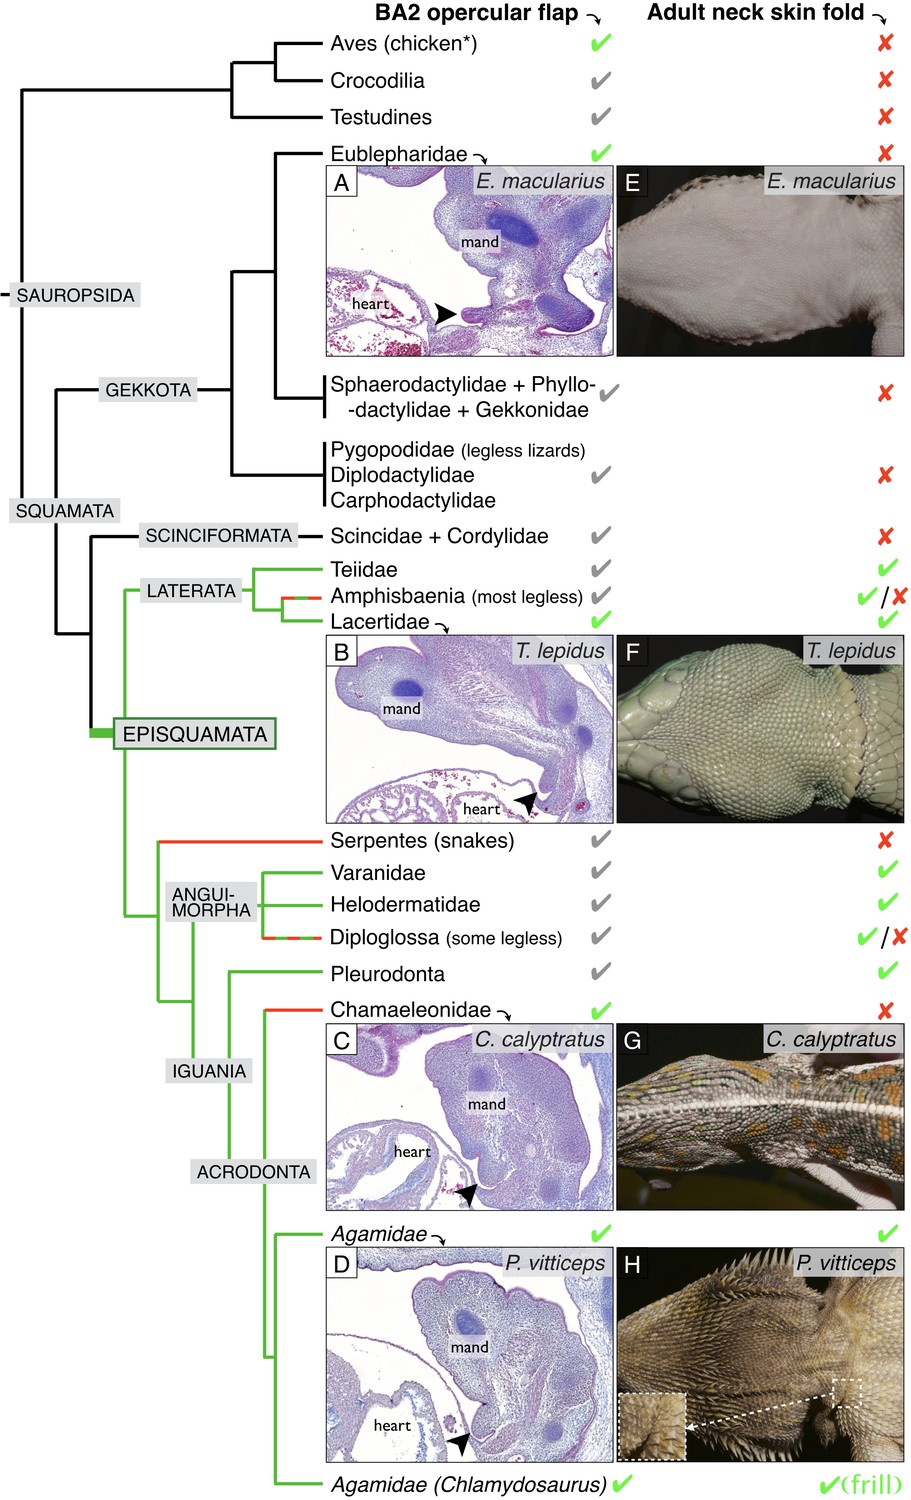
Incomplete fusion of BA2 occurred in the ancestor of Episquamata.
Phylogenetic tree (based on Zheng and Wiens, 2016) of Sauropsida and sagittal sections revealing the presence of an embryonic opercular flap (arrowheads) in (A) Eublepharis macularius, leopard gecko (stage 32), (B) Timon lepidus, ocellated lizard (stage 33), (C) Chamaeleo calyptratus, veiled chameleon (stage 32), and (D) Pogona vitticeps, bearded dragon (E10). In adults, a neck skin fold is (E) absent in the leopard gecko, (F) present in the ocellated lizard, (G) absent in the veiled chameleon, and (H) present in the bearded dragon. As, to our knowledge, no species of Gekkota and Scinciformata exhibit a neck fold, the most parsimonious phylogenetic mapping is that the neck fold evolved in the ancestor of Episquamata (thick green branch) and was subsequently lost (red branches) in the morphologically highly-derived snakes (Serpentes), Chameleonidae, and various legless lizards. The green check marks indicate presence of a character confirmed by our direct observations, whereas grey marks indicate expectation on the basis of the parsimony argument. Red crosses indicate the absence of a character. 'Mand’=mandibular arch, ‘heart’=heart cavity.
Figure 5—figure supplement 1
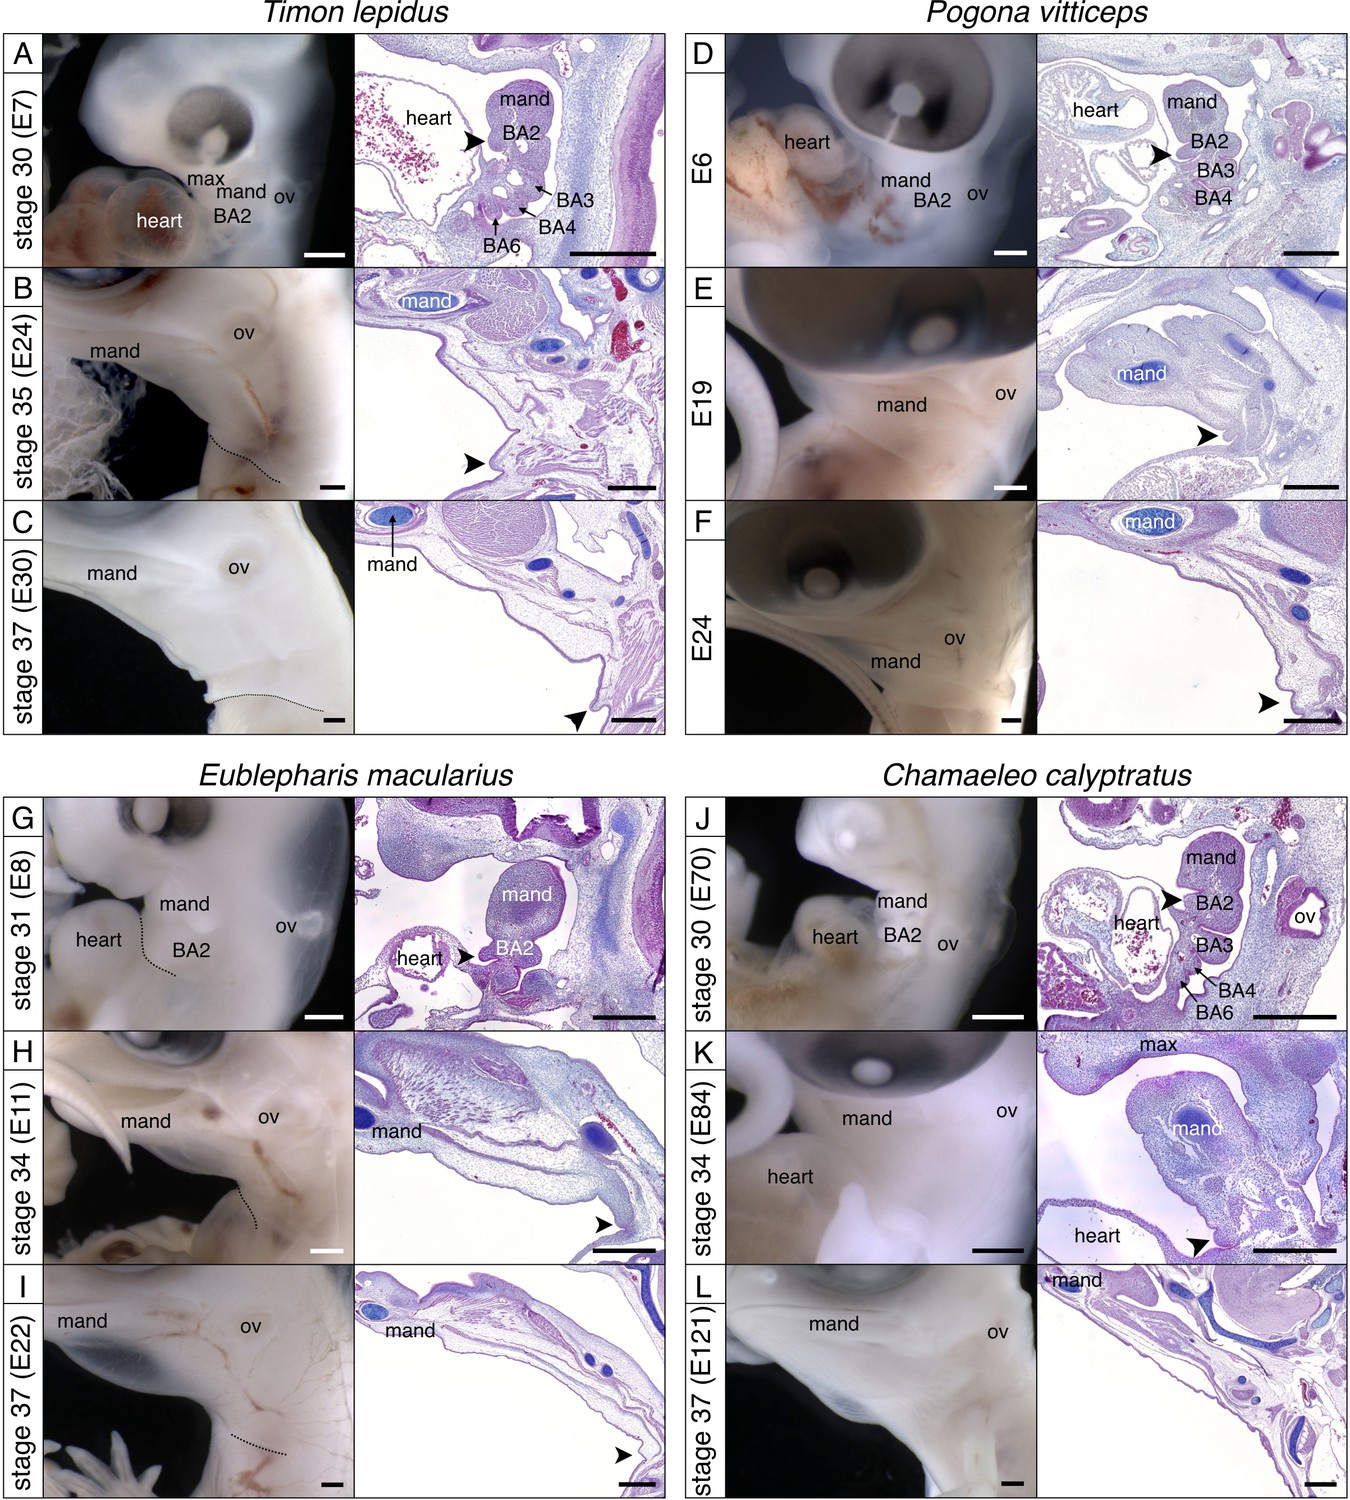
Development of the BA2 in various lineages of squamates.
Lateral views (left panels) and sagittal sections (right panels) of (A–C) Ocellated lizard (Timon lepidus), (D–F) Bearded dragon (Pogona vitticeps), (G–I) Leopard gecko (Eublepharis macularius), and (J–L) Veiled chameleon (Chamaeleo calyptratus). Scale bars = 500 µm, ‘mand'=mandibular arch, ‘BA2’=hyoid arch, ‘BA3’ to ‘BA6’=third to sixth branchial arches, arrowhead = embryonic opercular flap.
Figure 6
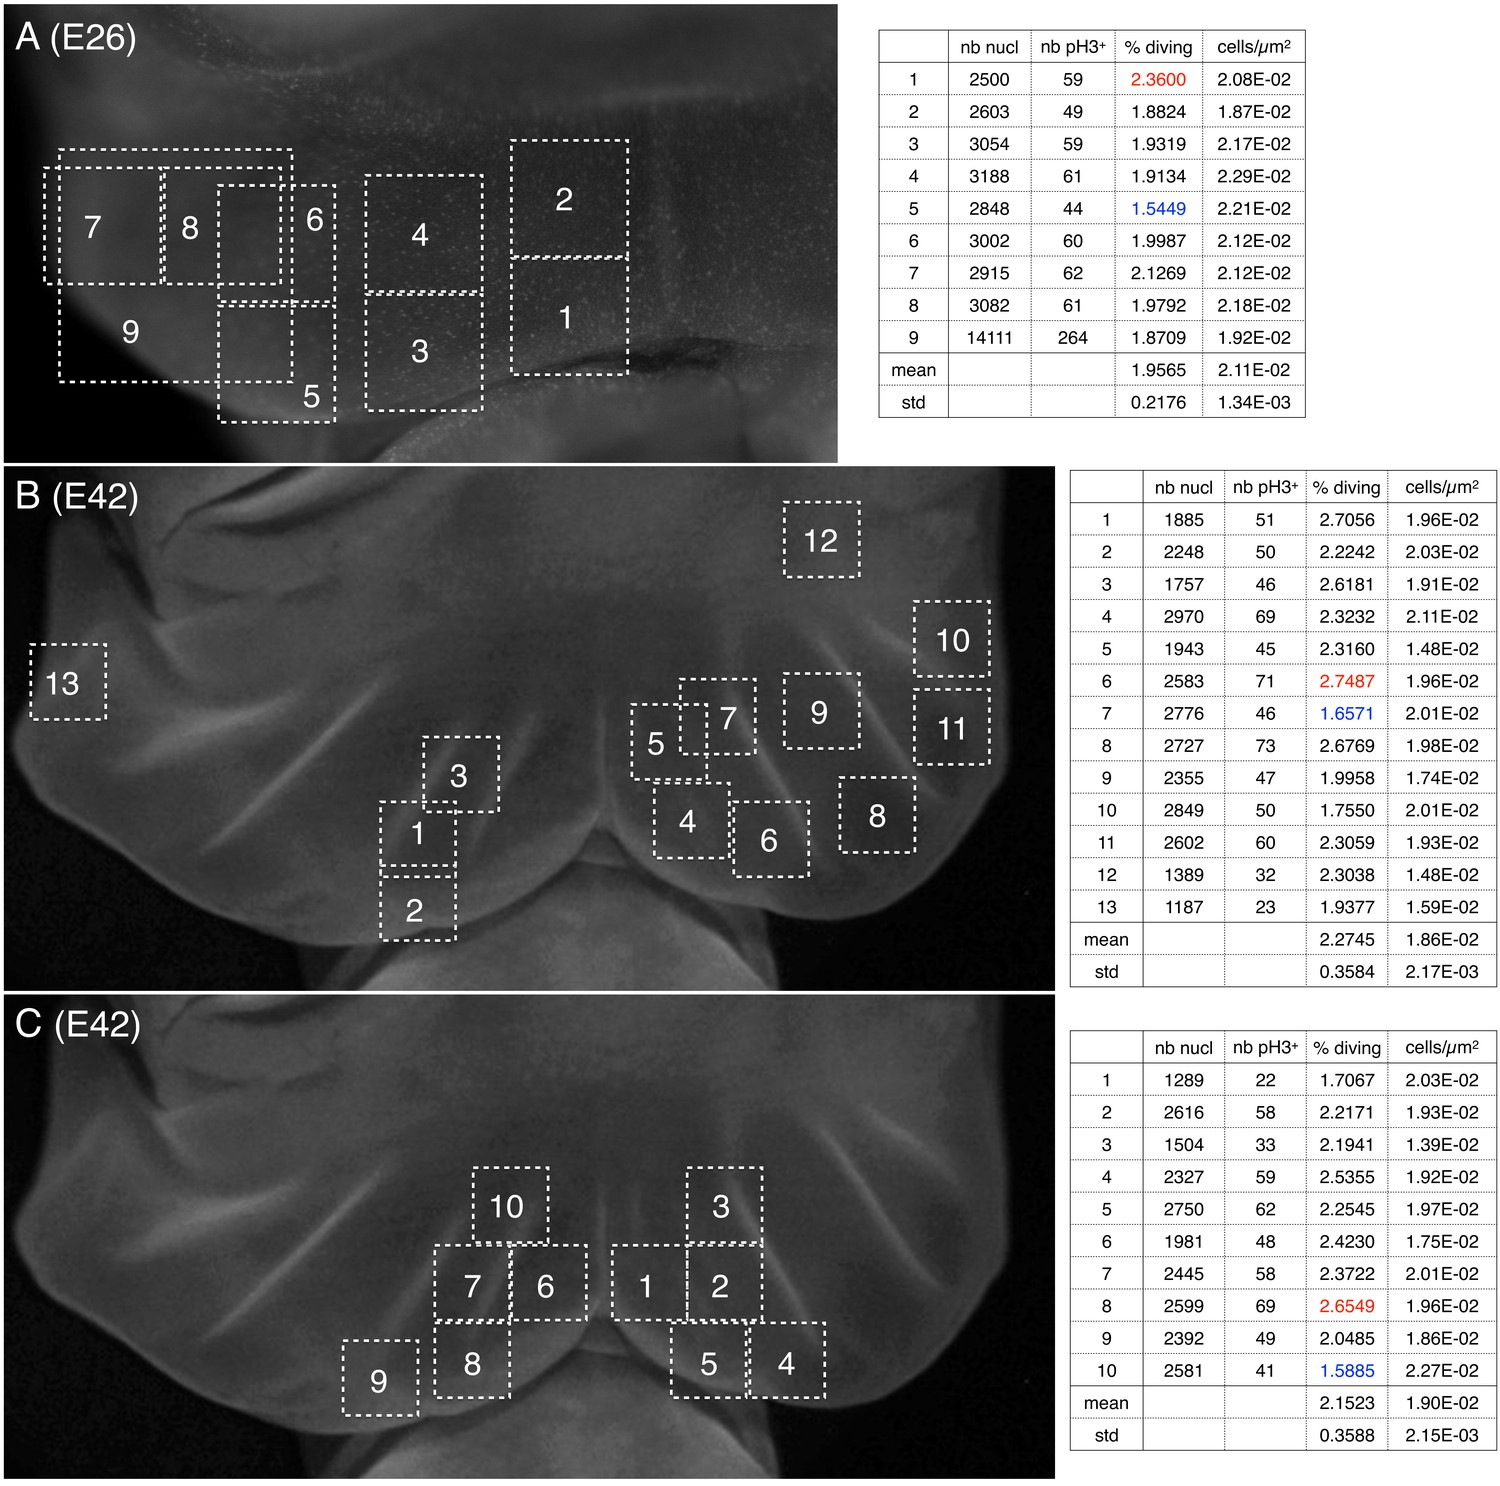
Cell density and proportion of dividing cells.
Quantification of nuclei and of pH3-labelled cells (phospho-histone H3, a mitotic marker) (A) before and (B,C) during the formation of ridges on the Chalmydosaurus embryonic frill. White squares: positions of the surface of tissue investigated by confocal microscopy; z-stacks were generated and the number of nuclei and of pH3-labelled nuclei were counted (values are indicated in the tables on the right; numbers in red and blue are highest and lowest values, respectively).
Figure 7
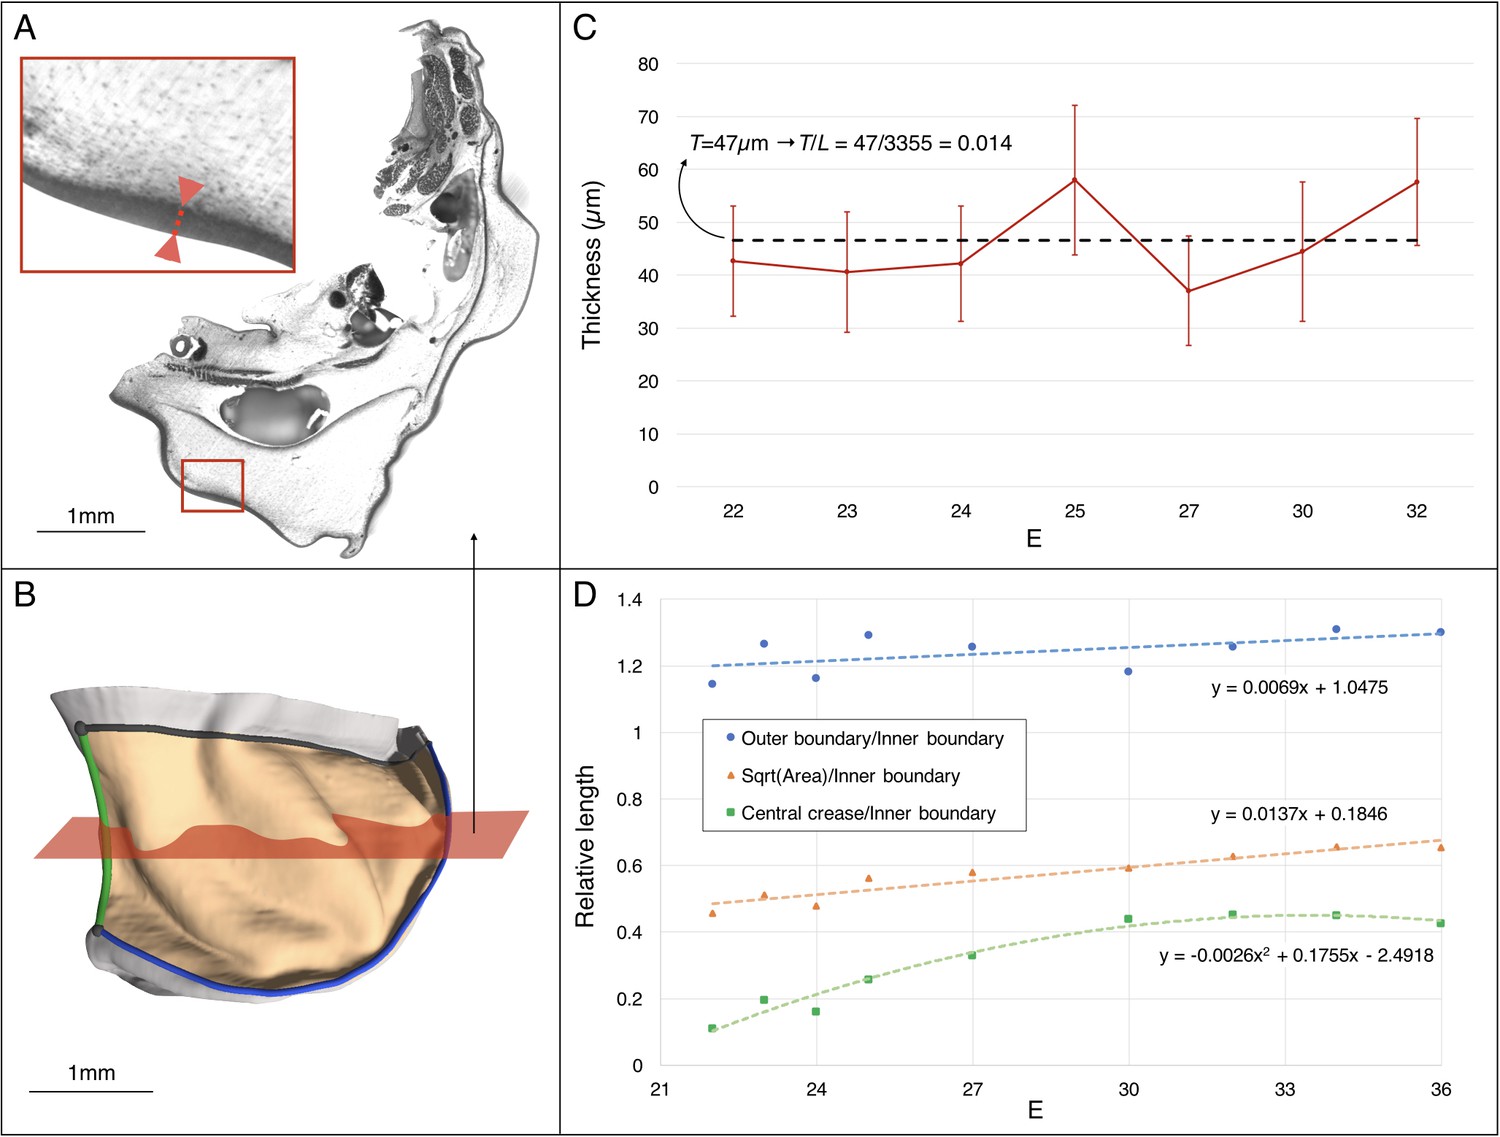
Estimating the changes in thickness and boundary conditions during Chalmydosaurus embryonic frill development.
(A) Eosin staining of an HREM slice at E36 shows the sharp difference in contrast between the frill's skin (red double arrow in inset) and the underlying loose connective tissue. (B) 3D reconstruction of the frill obtained by stacking HREM slices. The central crease is marked in green, the outer boundary in blue, the inner boundary (attached to the neck) in black, and the area of the frill in light orange. The approximate position of the slice in panel A is indicated by the red plane. (C) Average skin thickness measured at different developmental stages (horizontal axis: E = days post-oviposition); error bars represent one standard deviation intervals (skin thickness varies at different places of the frill) for the embryo at the corresponding stage. The thickness value used in our simulations is represented by the average (dashed line) among the seven measurements. (D) Three-dimensional measurements among different parts of the frill between E22 and E36 (one embryo per stage) indicate a linear surface growth g(s)≈1.3, a central crease growth g(c)≈2.2, and an outer free edge growth g(o)≈1.0 during the developmental period when the ridges form (E23-32). Note that the growth values used at different developmental stages during our quasi-static simulations (Figure 10C) are derived from the linear fit to the linear surface data and the quadratic fit to the central crease data shown here.
Figure 8 with 1 supplement
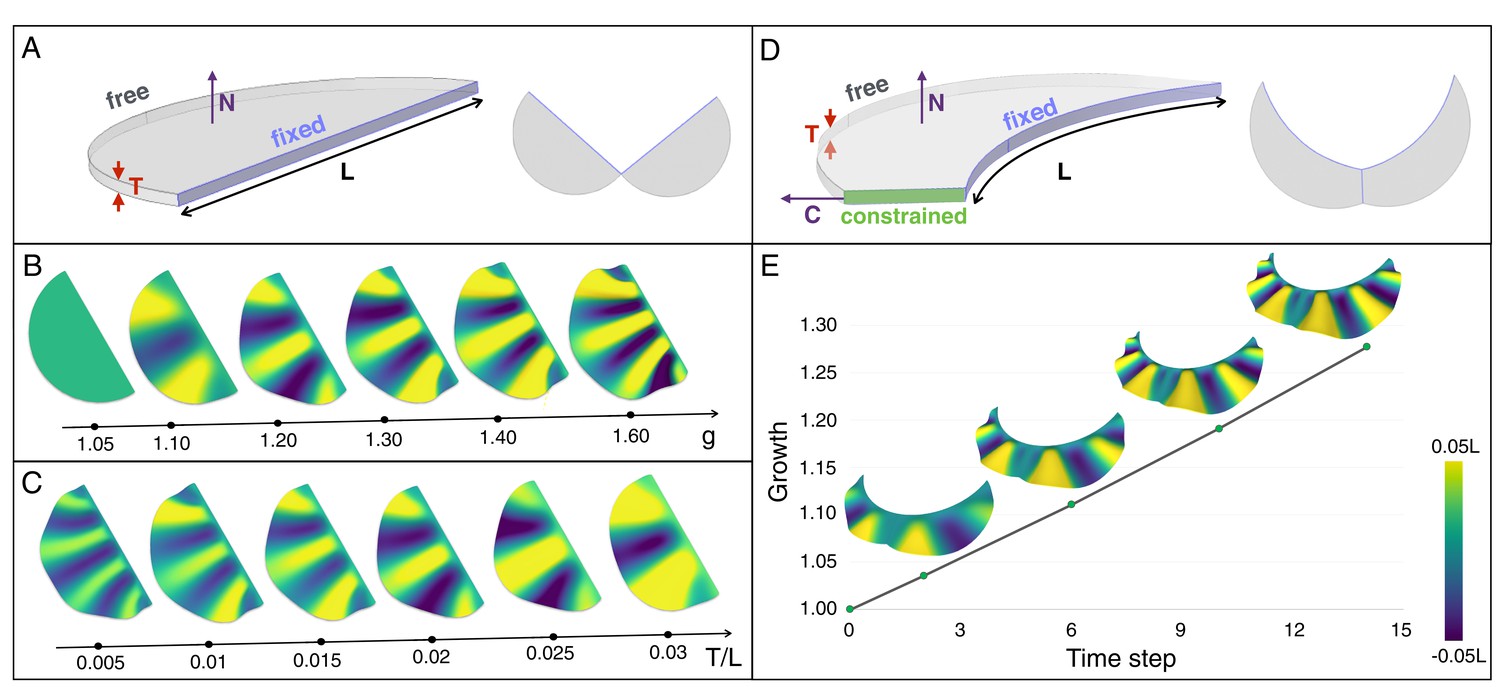
An elastic instability generates ridges during homogeneous growth of a thin sheet computational model.
(A) Semi-cylindrical model of diameter L and thickness T with fixed inner boundary and free outer boundary. (B) For a constant ratio T/L (=0.02), the number of ridges generated by uniform growth (g) increases with increasing value of g; (C) For a constant amount of growth (here, g = 1.2), the number of ridges is negatively correlated with the ratio T/L. (D) A more realistic geometry of the frill with a fixed circular inner boundary (representing the attachment to the neck) and a central crease. (E) Assuming that the central crease and the linear surface grow at the same rate, a quasi-static approach to homogeneous growth of the model shown in D generates two then three ridges; T/L = 0.014 and Poisson's ratio ν = 0.45.
Figure 8—figure supplement 1

Influence of growth and of sheet thickness on the number of ridges.
(A) Geometry of the frill model before (red lines) and after (coloured model) growth. (B) Height distribution of the frill along a virtual circular slice (at the position of the free boundary in the initial configuration, that is the dashed semi-circle in panel A projected in 2D as a function of φ. The number of ridges (here, 2.5) is computed by averaging the number of local maxima (here, 3) and local minima (here, 2), whose distance to the centre of the frill (dashed yellow line) exceeds 75% of the frill thickness T. (C) For different values of uniform linear surface growth g, the number of ridges decreases linearly with an increasing sheet thickness (T). L = fixed boundary.
Figure 9
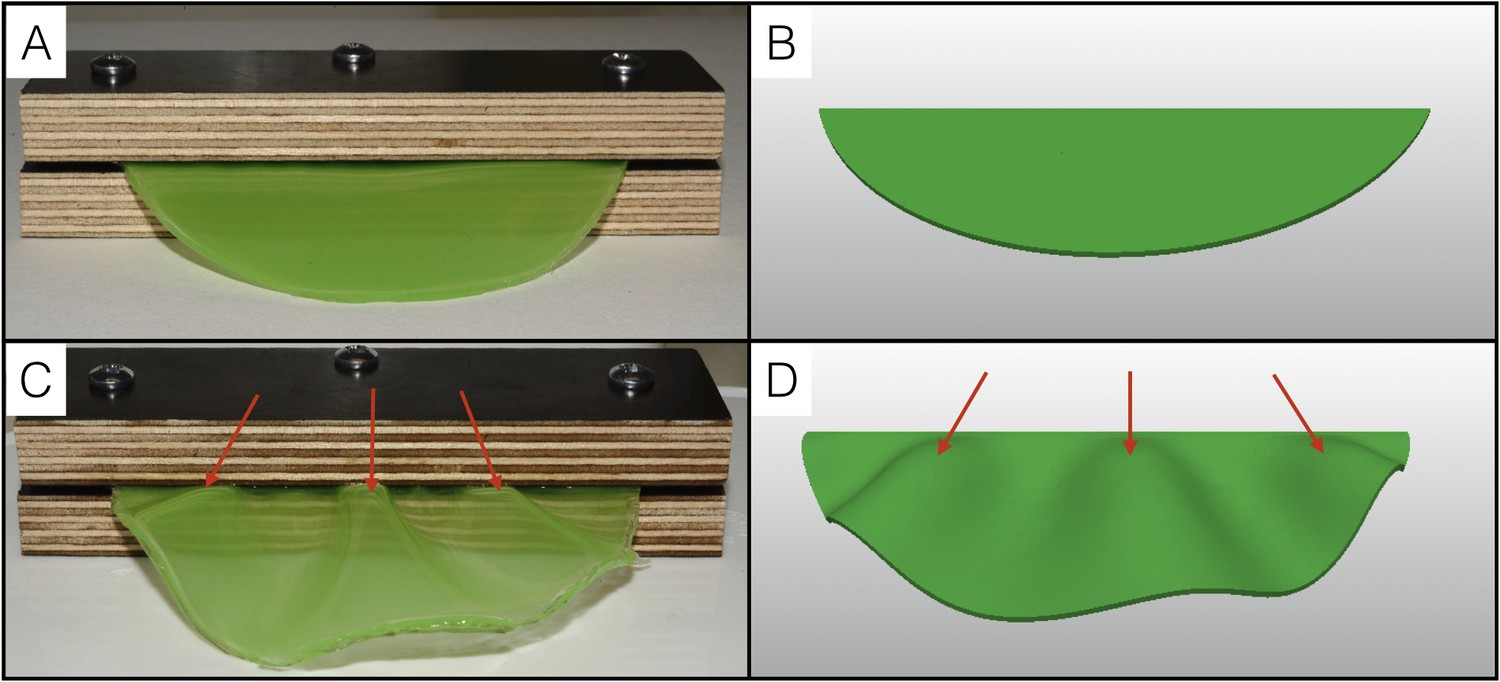
Physical analog experiment confirms numerical simulations.
(A) A PDMS sheet of thickness T = 0.94 mm (measured at 10 positions, standard deviation = 0.05 mm) and inner boundary length L = 84.62 mm is fixed between two pieces of wood to mimic the neck boundary of the frill. (B) Tetrahedral mesh model with a T/L ratio (0.01) and a Poisson's ratio (ν = 0.45) similar to those of the PDMS analog shown in A. (C) After immersion in hexane (causing the swelling of the gel by a factor of 30%), the PDMS sheet forms three pleats as in (D) where the simulation mesh is grown a similar amount (g = 1.3) in all directions.
Figure 10
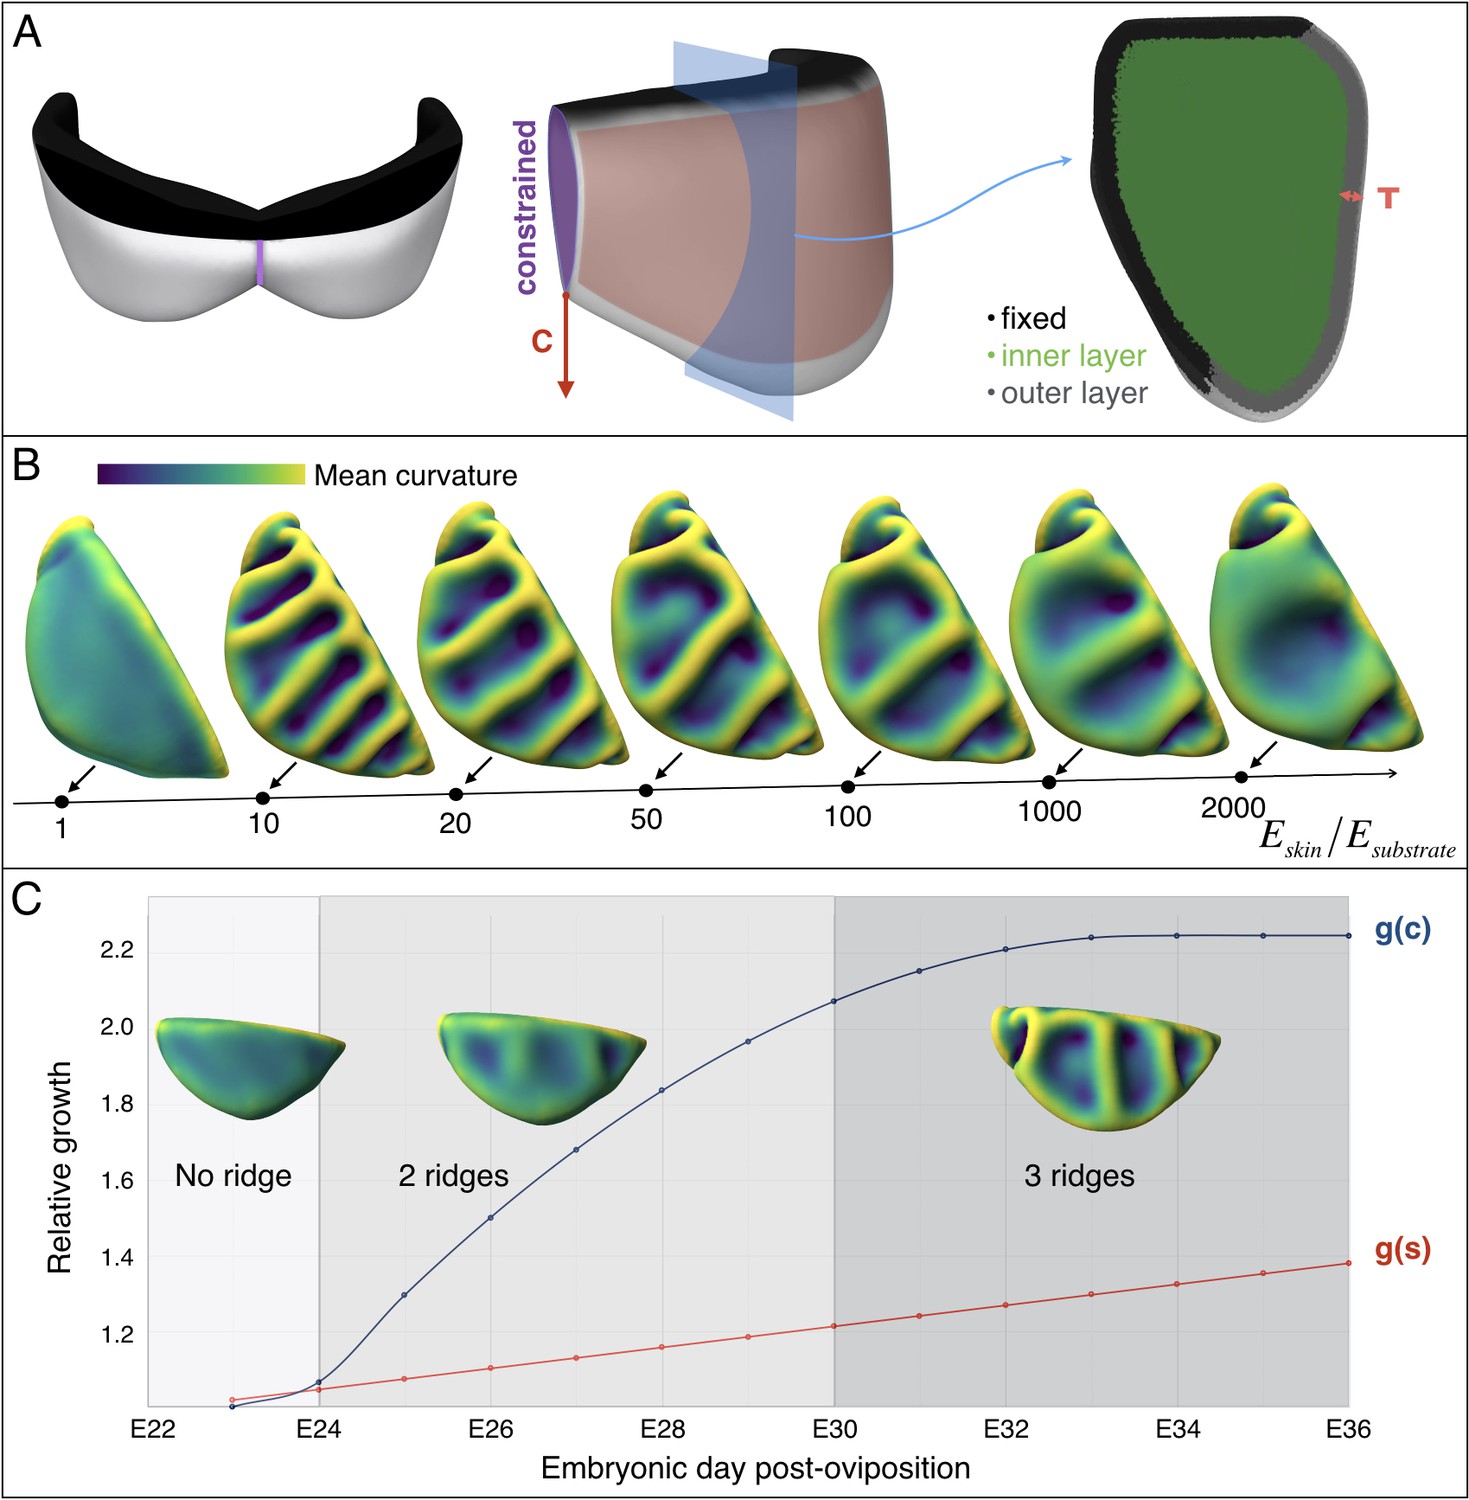
Multi-layer computational simulations of ridges formation using realistic embryonic frill geometry.
(A) Computational model of the embryonic frill derived from measurements on a HREM 3D reconstruction of a E23 embryo's frill. The left, central and right panels show the model in dorsal, lateral and section views, respectively. The fixed inner boundary (attachment to the neck), central crease, and underlying loose connective tissue are indicated in black, purple, and green, respectively. Tangential growth is applied on the surface of the frill (anterior layer of skin indicated in pink and of thickness T = 47 µm) whereas the central crease is constrained to a plane and grows in the direction C. (B). Using this geometry and fixed relative growth (linear surface outer sheet growth g(s)=1.3 and central crease growth g(c)=2.2, both relative to the length of the neck boundary), we show that the number of ridges is inversely correlated with the skin-to-substrate stiffness ratio. Other simulation parameters are νskin = νsubstrate = 0.45. (C) Using a stiffness ratio Eskin/Esubstrate=100, with dynamics of frill surface growth (g(s), red curve) and of central crease growth (g(c), blue curve) derived from the actual morphogenesis of the frill in Chlamydosaurus embryos (Figure 7D), simulations recapitulate the transition from two to three ridges observed in real embryos. Because of their low amplitude, the two ridges present in embryos at stages E24-E28 are difficult to identify in bright field microscopy (Figure 3) but are easily detected by episcopic microscopy.
Figure 11
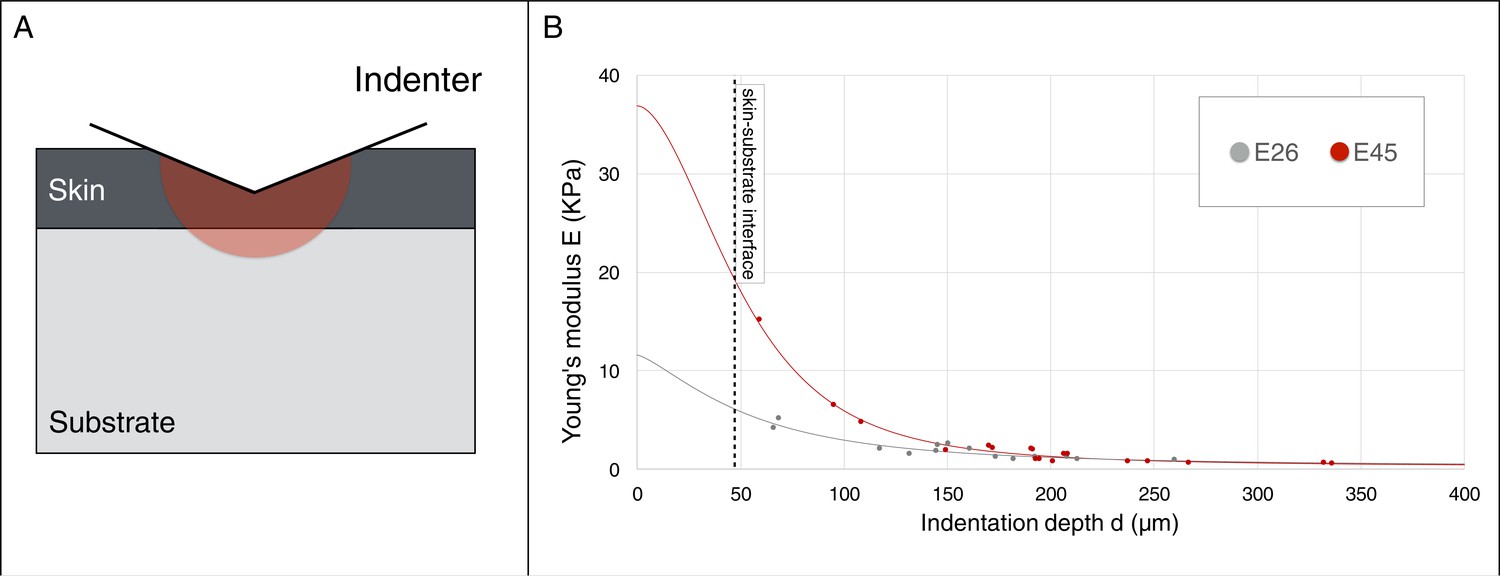
Young’s modulus estimation using a micro-indenter.
(A) Schematic representation of the hemisphere of influence of the micro-indenter. (B) Estimated Young’s modulus E for skin thickness T = 47 μm, at two developmental stages E26 and E45 (one embryo each), as a function of indentation depth d. The values of Eskin and Esubstrate were estimated using an approach described in the Material and methods.
Videos
Video 1
Quasi-static linear growth of a thin sheet simulation model of uniform thickness T with a curved inner boundary of length L (see Figure 8D) produces first two and then three ridges.
Here we assume that the growth (g = 1.28 at the end of the simulation) experienced by the central crease and the surface are identical. Other model parameters are: T/L = 0.014 and Poisson's ratio ν = 0.45.
Video 2
Quasi-static growth of a realistic HREM-derived frill geometry (see Figure 10A), incorporating the frill’s skin and the underlying softer connective tissue (Eskin/Esubstrate = 100), generates the transition from two to three ridges.
Growth values g(s) and g(c) (indicated in the movie) are derived from the linear fit to the surface data and the quadratic fit to the central crease data, respectively (Figure 7D).
Additional files
-
Transparent reporting form
- https://doi.org/10.7554/eLife.44455.018
Download links
A two-part list of links to download the article, or parts of the article, in various formats.
Downloads (link to download the article as PDF)
Open citations (links to open the citations from this article in various online reference manager services)
Cite this article (links to download the citations from this article in formats compatible with various reference manager tools)
Elastic instability during branchial ectoderm development causes folding of the Chlamydosaurus erectile frill
eLife 8:e44455.
https://doi.org/10.7554/eLife.44455


