A 3D culture model of innervated human skeletal muscle enables studies of the adult neuromuscular junction
- University of Toronto, Canada
- University of Wisconsin-Madison, United States
- Lunenfeld-Tanenbaum Research Institute, Mount Sinai Hospital, Canada
- University of Toronto Mississauga, Canada
- Utrecht University, Netherlands
- Sorbonne Universite, France
- University of Padova, Italy
- St. Michael's Hospital, Canada
Figures
Figure 1 with 3 supplements
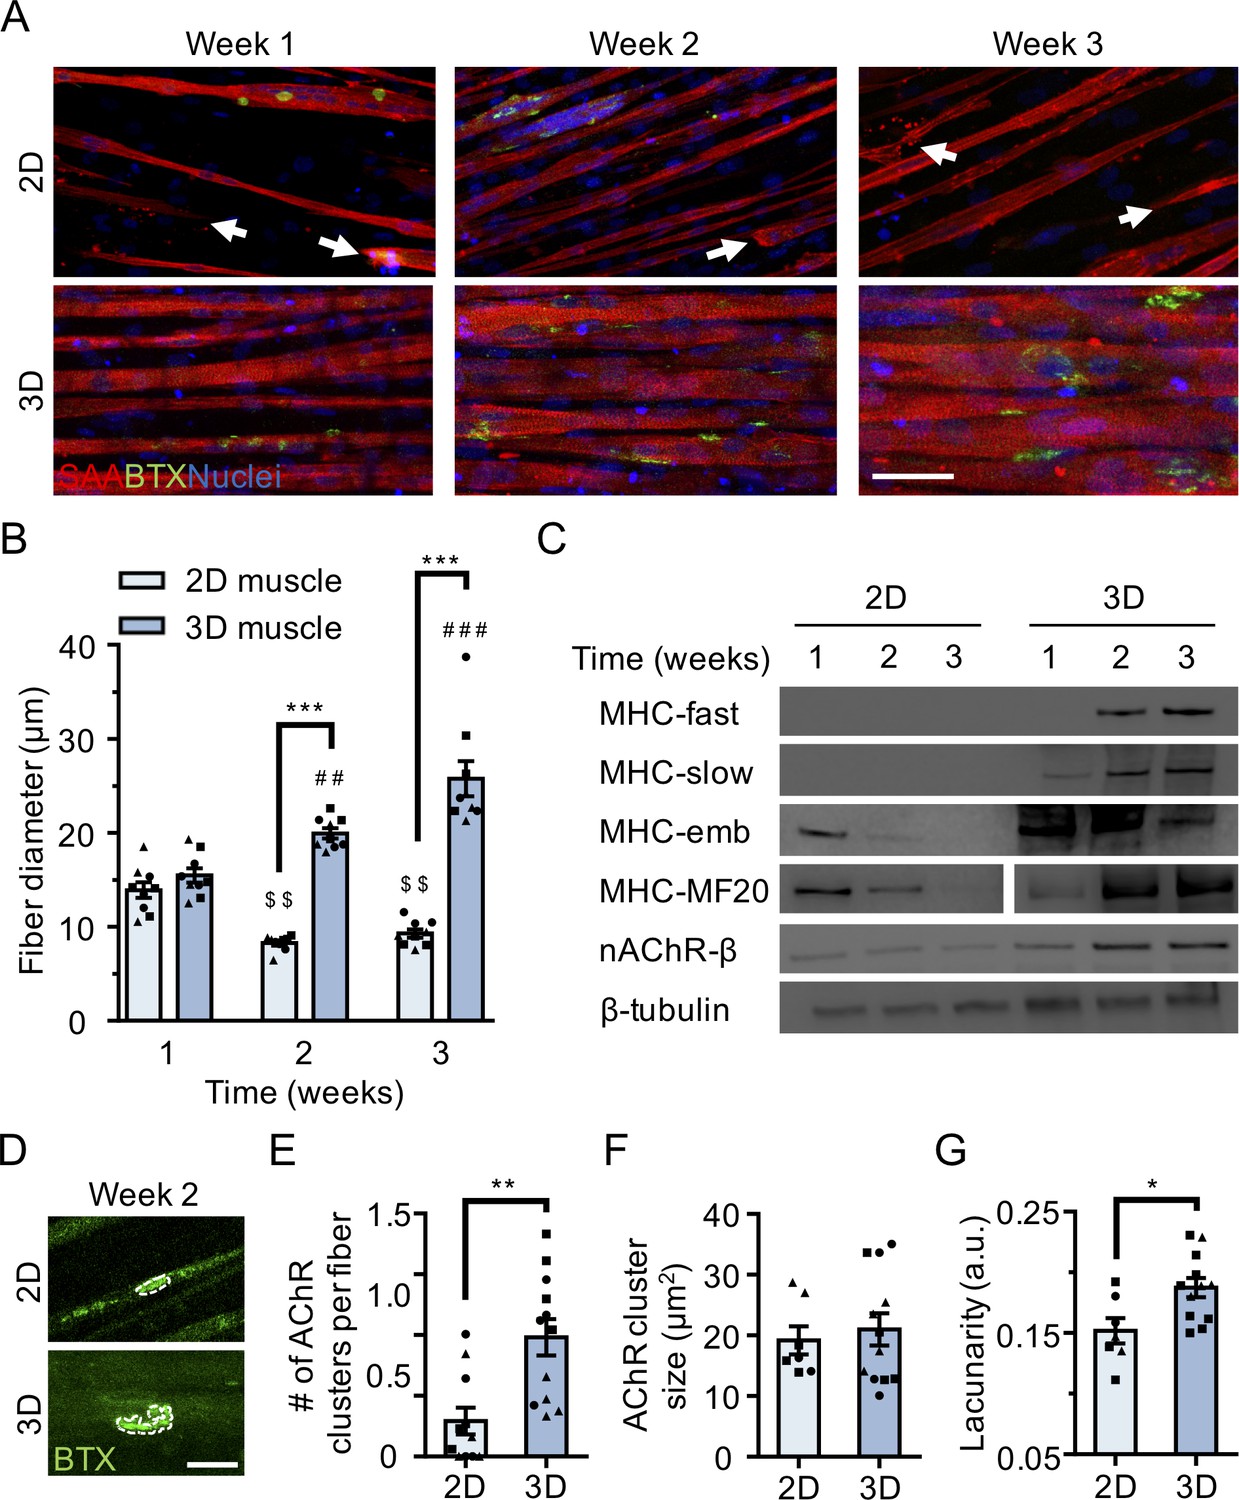
3D culture enhances skeletal muscle fiber maturation over 2D culture.
(A) Representative confocal images of muscle fibers established in 2D (top row) and 3D conditions and immunostained for sarcomeric α-actinin (SAA; red), α-bungarotoxin (BTX; green), and Hoechst 33342 (blue) after 1, 2, and 3 weeks of culture. Scale bar, 50 μm. White arrowheads indicate broken fibers. (B) Bar graph of muscle fiber diameter quantified in 2D (light blue) and 3D (blue) cultures over time. n = 9 independent samples from three muscle patient donors. A minimum of 50 myotubes per time point per patient sample were analyzed. ##p<0.01 and ###p<0.001 compared with 3D cultures at week 1. $$p<0.01 compared with 2D culture at week 1. (C) Representative western blot images of myosin heavy chain (MHC) isoforms (fast, slow, embryonic (emb), and pan (MF-20)) nicotinic AChR-β (nAChR-β), and β-tubulin in 2D compared with 3D cultures over time. (D) Representative confocal images of muscle fibers cultured in 2D or 3D for two weeks and then labeled with α-bungarotoxin (green). AChR clusters are outlined with white dashed lines. Scale bar, 25 μm. (E–G) Bar graphs indicating average (E) number of AChR clusters per fiber, (F) AChR cluster size, and (G) AChR cluster lacunarity in 2D (light blue) and 3D (blue) muscle fiber cultures at week 2. n = minimum of 9 independent samples from three muscle patient donors. A minimum of 30 microscopic images per culture condition were analyzed. In (B), (C), and (E–G) each symbol represents data from one muscle patient donor. Values in (B), (E), (F), and (G) are mean ±SEM. *p<0.05, **p<0.01, ***p<0.001.
Figure 1—figure supplement 1

Two- and three-dimensional methods to culture human muscle fibers.
(A) Schematic overview of human muscle cell isolation and downstream culture methods. (B) (left panel) Representative fluorescence activated cell sorted (FACS) dot plot of primary human myoblasts (CD56+) and fibroblasts (CD56—). (middle panel) Representative confocal image of a 2D muscle fiber culture established from the CD56+ population and immunostained for desmin (green) and DRAQ5 (white). (right panel) Representative confocal image of the CD56— population in 2D culture immunostained for vimentin (green) and DRAQ5 (blue). Scale bars, 100 μm middle and 200 μm bottom right. (C) (top panel) Stitched phase contrast tiled image of a representative well immediately after seeding the cell/extracellular matrix scaffold mix into the PDMS channel and (bottom panel) after two weeks of differentiation. PDMS channel is outlined with yellow dashed lines. Velcro attachments are outlined with red dotted lines. Remodeled muscle tissue is outlined with green dotted lines. Scale bar, 2 mm. (D) (left panel) 2D muscle fiber culture at two weeks of differentiation immunostained for sarcomeric α-actinin (green) and DRAQ5 (blue). Scale bar, 1 mm. (right panel) Magnified confocal image of a 2D muscle culture at two weeks of differentiation immunostained for sarcomeric α-actinin (red). White arrowheads indicate broken fibers. Scale bar, 100 μm. (E) Confocal tiled and stitched immunofluorescence image of a representative 3D skeletal muscle tissue immunostained for sarcomeric α-actinin (green) and DRAQ5 (blue). Scale bar, 1 mm.
Figure 1—figure supplement 2
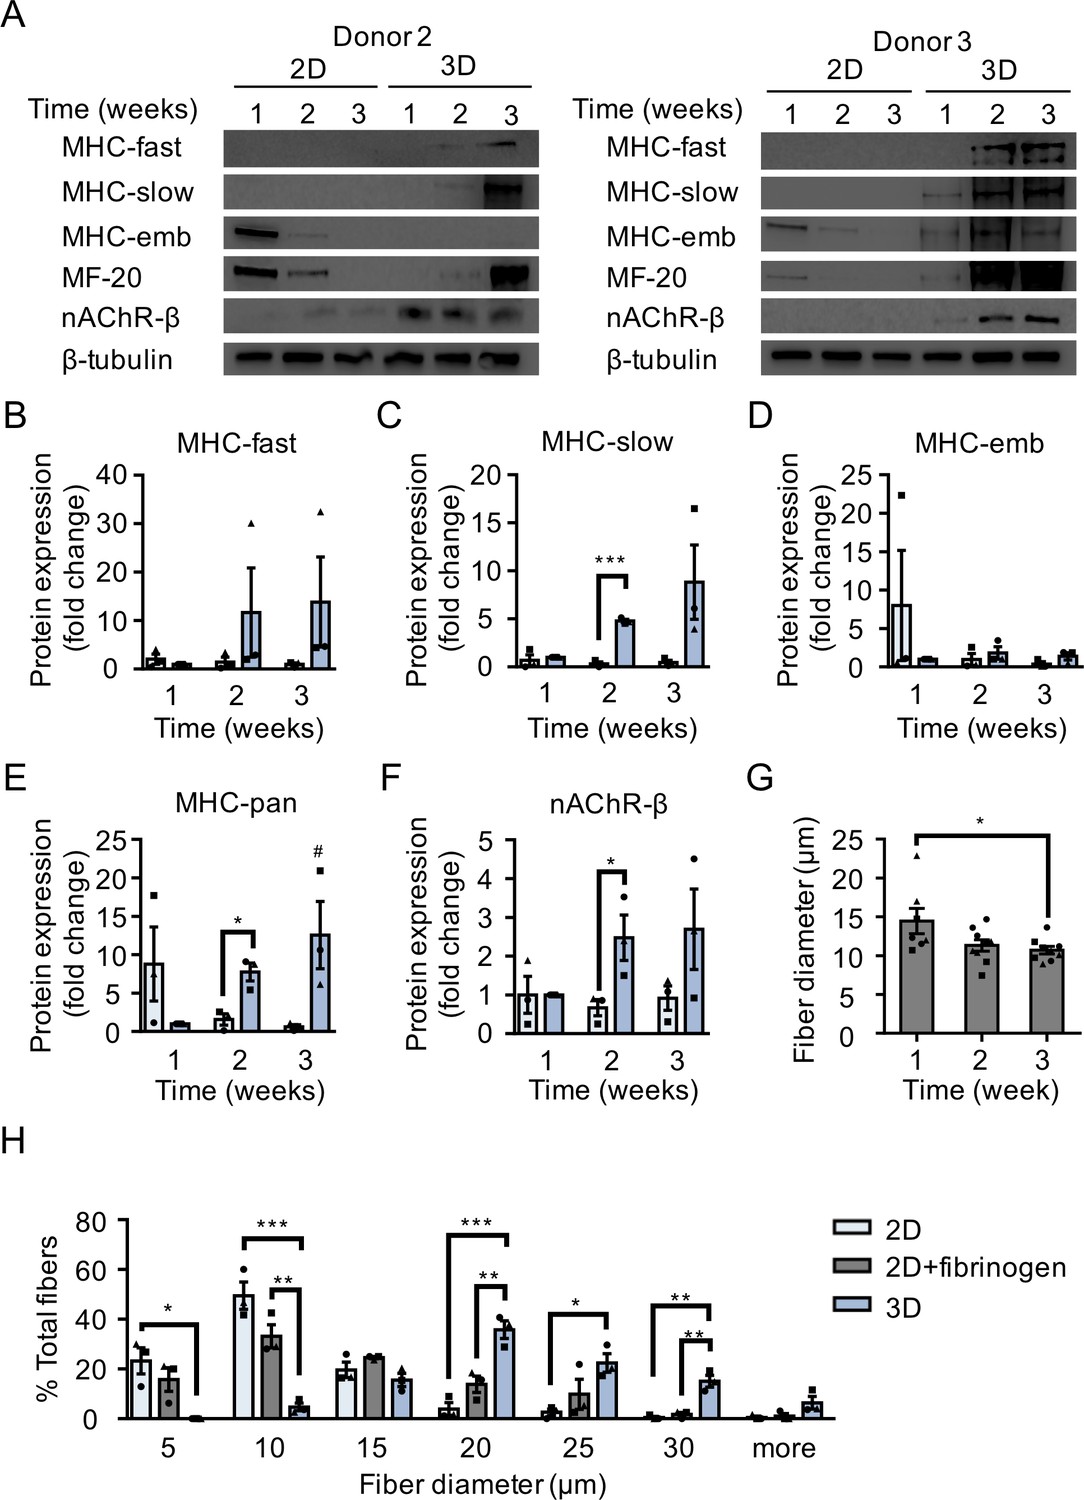
Comparison of muscle fiber maturation in 2D and 3D cultures.
(A) Western blot images of myosin heavy chain (MHC) isoforms (fast, slow, embryonic (emb), and pan (MF-20)), nicotinic AChR-β (nAChR-β), and β−tubulin protein expression in 2D compared with 3D cultures over time. Data obtained from cultures established from two separate muscle patient donors is shown. (B–F) Bar graphs quantifying the fold-change in MHC (B) fast, (C) slow, (D) embryonic and (E) pan isoforms, as well as (F) nAChR-β protein expression in 2D (light blue) and 3D (blue) cultures over time relative to 3D culture at week 1. n = 9 samples from three muscle patient donors. *p<0.05, ***p<0.001, and #p<0.05 compared with 3D culture at week 1. (G) Bar graph indicating average muscle fiber diameter quantified from 2D fibrinogen/Geltrex muscle fiber cultures over time. n = 7 (week 1) and n = 9 (weeks 2 and 3) samples from three muscle patient donors. A minimum of 50 muscle fibers were analyzed per time point. *p<0.05 using one-way ANOVA followed by Tukey’s multiple comparison test (H) Histogram displaying muscle fiber diameter quantified from 2D Geltrex (black bars), 2D fibrinogen/Geltrex (green bars), and 3D fibrin/Geltrex (gray bars) muscle fiber culture conditions. n = 9 samples from three muscle patient donors. A minimum of 50 muscle fibers were analyzed per culture condition at week 2. In (B–H) each symbol represents data from one muscle patient donor. Values reported in (B–H) are mean ±SEM. *p<0.05, **p<0.01, and ***p<0.001.
Figure 1—figure supplement 3
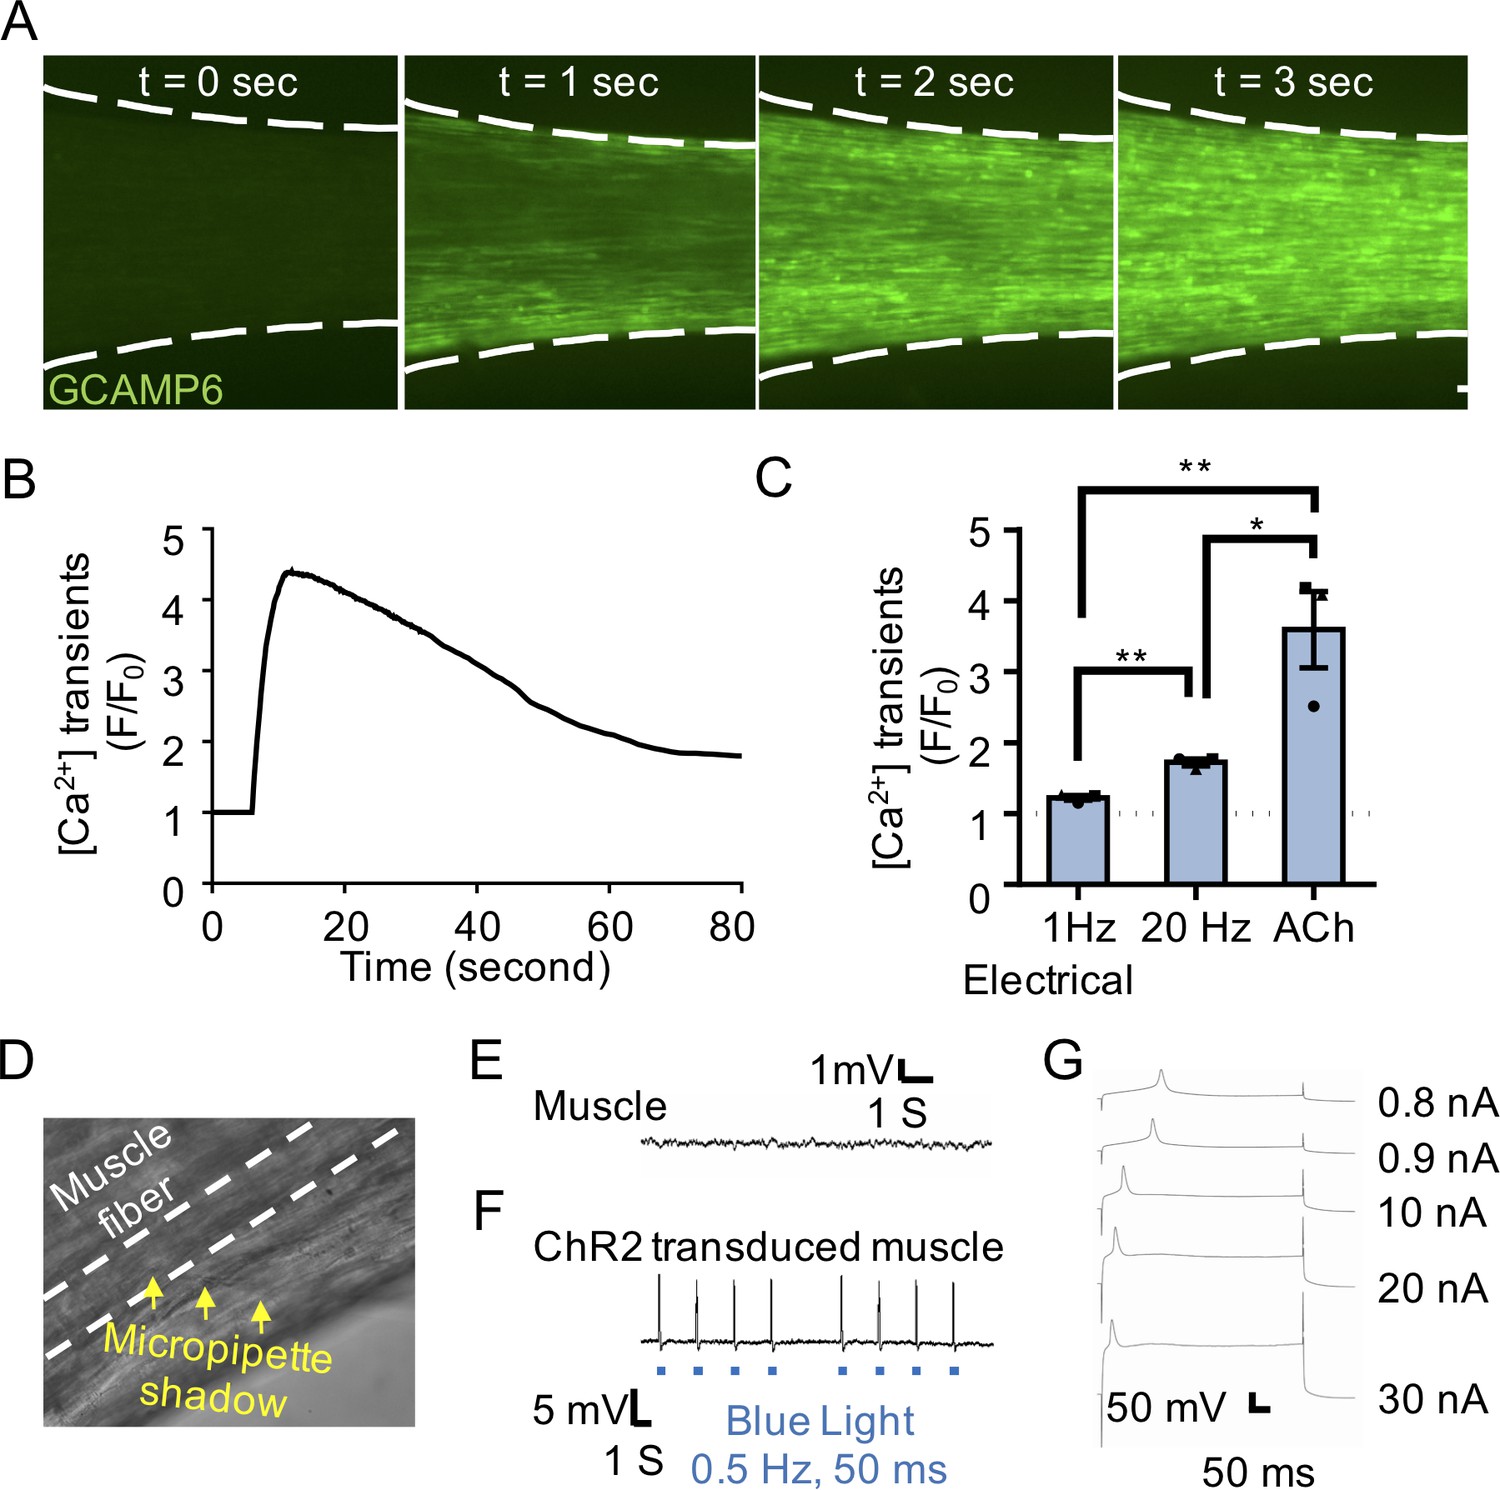
Functional characterization of 3D skeletal muscle tissues.
(A) Representative epifluorescence images of a GCaMP6 transduced 3D muscle tissue to visualize muscle fiber calcium transients at time-points before (t = 0 s) and after (t = 1, 2, and 3 s) ACh stimulation. Scale bars, 250 μm. (B) Graph quantifying a time course of GCaMP6 reporter fluorescence following ACh-induced stimulation of a representative 3D muscle tissue. (C) Bar graph showing quantification of GCaMP6 signal after 3D skeletal muscle tissue low (1 Hz) or high (20 Hz) electrical stimulation, or ACh biochemical stimulation, and relative to phosphate buffered saline treated control tissues (dotted line). Values are reported as mean ±SEM. *p<0.05, and **p<0.01. n = 3 samples from three muscle patient donors. Each symbol represents data from one muscle patient donor (D) Representative bright-field image of the sharp microelectrode recording a muscle fiber within a 3D human skeletal muscle tissue. Micropipette shadow is highlighted by yellow arrowheads and the pierced muscle fiber is outlined with white dashed lines. (E) Representative sharp microelectrode recording of a 3D muscle-alone culture showing an absence of miniature end plate potentials. (F) Representative sharp microelectrode recording of a ChR2 transduced 3D muscle. Blue light stimulation points are indicated by blue squares under the trace for the transduced muscle. (G) Representative traces of muscle cell excitability within a 3D tissue responding to a series of increasing step currents (0.8 nA - 30 nA, 400 ms). (E–G) 3D muscle tissues assessed at week 2 of culture.
Figure 2 with 2 supplements

3D neuromuscular co-culture augments AChR clustering and maturation.
(A) Stitched phase contrast image of a representative 3D skeletal muscle-motor neuron (MN) co-culture at two weeks of culture. Neuromuscular tissue outlined with red dashed line in left panel. Region outlined in green box is magnified in the image to the immediate right. Red dashed lines in right panel outline motor neuron clusters. Scale bars, 2 mm (left panel) and 200 μm (right panel). (B) Representative confocal image of a two-week old neuromuscular co-culture immunostained for sarcomeric α-actinin (SAA; green), α-bungarotoxin (BTX; magenta), and neurofilament heavy SMI-32 (red). AChR clusters co-localized with neurites are outlined with yellow boxes. Scale bar, 200 μm. (C) Representative confocal image indicating co-localization of a SMI-32 (red) labeled neurite terminal and a BTX (white) labeled AChR cluster on a striated muscle fiber as seen by SAA (green) staining. Scale bar, 50 μm. (D) Representative confocal image of a neuromuscular co-culture immunostained on Day 10 of differentiation for Rapsyn (red), bungarotoxin (BTX, white), and counter stained with Hoechst 33342 to visualize the nuclei (blue). Motor neurons (green) were derived from GFP expressing human iPSCs. Scale bar 25 μm. (E,I) Representative confocal images of AChR clusters formed on muscle fibers cultured in 3D (E) with (+) or without (-) motor neurons (MN) or (I) supplemented with agrin and labeled with α-bungarotoxin after two weeks of culture. Scale bars, 25 μm (E) and 50 μm (I). AChR clusters are outlined with white dashed lines in (E). (F–H, J–K) Bar graphs indicating average (F,J) number of AChR clusters per fiber, (G,K) AChR cluster size, and (H) AChR cluster lacunarity in 3D cultures (F–H) with (+; purple) or without (-; blue) MN or (J–K) with or without agrin supplementation at week 2. In (F–H), values are normalized to 3D muscle cultures without MNs. In (J–K) values are normalized to untreated control. (L) Representative confocal image of a neuromuscular co-culture immunostained for laminin-β2 (red), bungarotoxin (BTX, white), and SMI-32 (green). Scale bars, 10 μm. For (F–H) and (J–K), n = minimum of 9 independent samples from three muscle patient donors. For agrin treated samples in (J–K), 6 samples from three muscle donors were analyzed. A minimum of 30 (F–H) or 6 (J–K) microscopic images per culture condition were analyzed. In (F–H) and (J–K) each symbol represents data from one muscle patient donor. Values in (F–H) and (J–K) are mean ±SEM. *p<0.05, **p<0.01, and ***p<0.001.
Figure 2—figure supplement 1
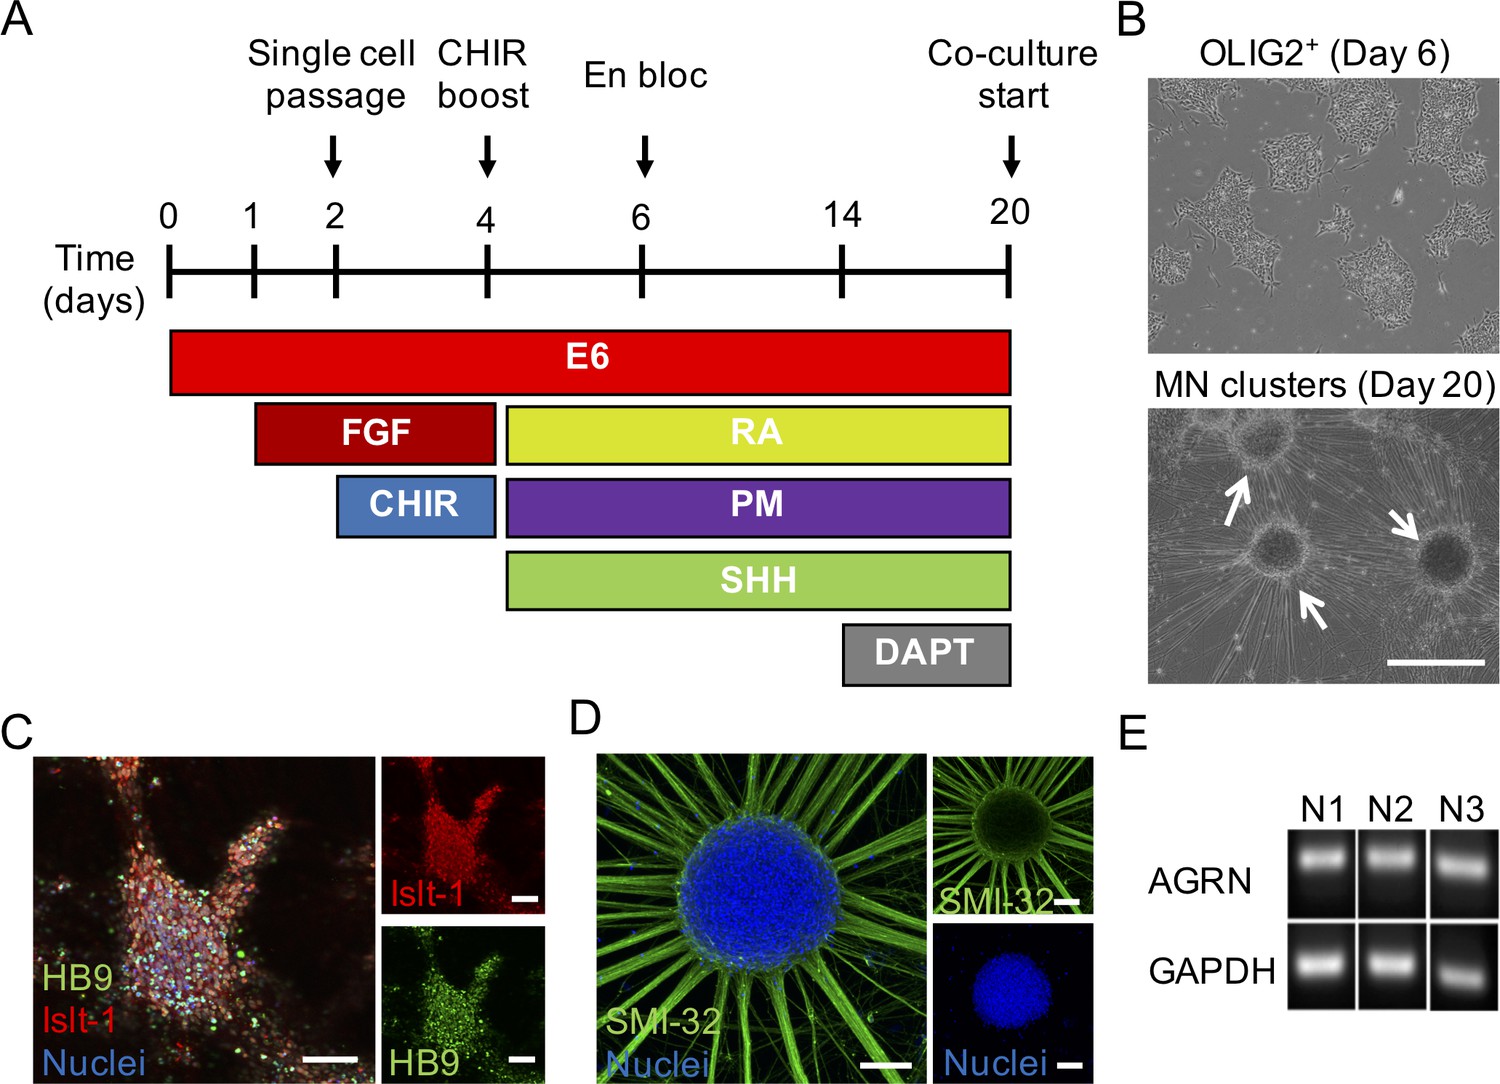
Generation and basic characterization of ESC-derived motor neurons.
(A) Schematic diagram of the protocol and timeline for differentiating embryonic stem cells (ESCs) to a post-mitotic motor neuron (MN) fate. (B) Representative bright field images of the OLIG2+ (left panel) progenitors after 6 days of differentiation and post-mitotic MN clusters (right panel) after 20 days of differentiation. White arrows point to motor neuron clusters. Scale bar, 500 μm. (C–D) Merged (left panels) and split (right panels) representative confocal images of a day 20 MN cluster immunostained for (C) the ISL1 (red) and HB9 (green) transcription factors and Hoechst 33342 (blue) or for (D) neurofilament heavy SMI-32 (green) and Hoechst 33342 (blue). Scale bars, 100 μm. (E) PCR agarose gel images depicting agrin (AGRN) and GAPDH gene expression bands for three-independent (N1, N2, and N3) ESC-derived MN differentiations.
Figure 2—figure supplement 2
2D and 3D neuromuscular co-culture characterization.
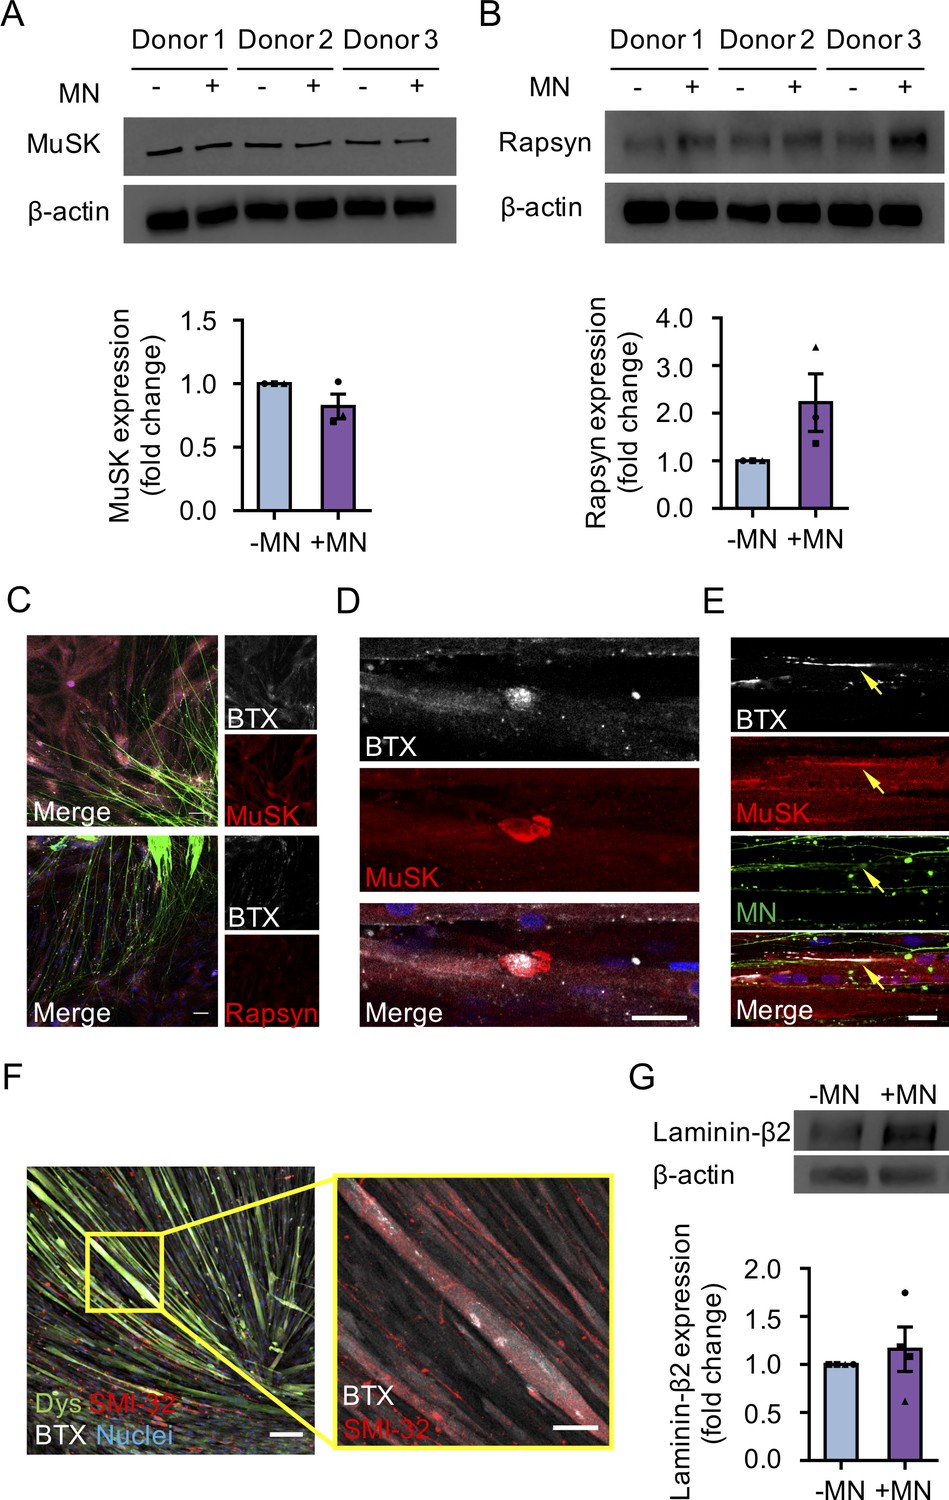
(A–B) Western blot images (top) and corresponding bar graphs (bottom) showing quantification of (A) muscle specific kinase (MuSK) and (B) rapsyn protein expression in 3D muscle (-MN) and neuromuscular co-cultures (+MN) at week 2 of culture. n = 9 samples from three muscle patient donors. (C) Representative confocal images of 2D neuromuscular co-cultures immunostained for MuSK (red, top panels) and rapsyn (red, bottom panels) and α-bungarotoxin (BTX, white). Nuclei are counter stained with Hoechst 33342 (blue) and motor neurons are (green). Scale bar 100 μm. (D) Representative confocal image of a 3D muscle culture immunostained on Day 10 differentiation for MuSK (red), bungarotoxin (BTX, white), and counter stained with Hoechst 33342 to visualize the nuclei (blue). Scale bar 25 μm. (E) Representative confocal image of a neuromuscular co-culture immunostained on Day 10 differentiation for MuSK (red), bungarotoxin (BTX, white). Nuclei are counter stained with Hoechst 33342 to visualize the nuclei (blue) and motor neurons are (green). Yellow arrows indicate the location of the AChR clusters co-localizing with the MuSK protein at the formed NMJ. Scale bar 25 μm. In (C,E), motor neurons (green) were derived from GFP expressing human iPSCs. (F) Representative confocal image (left) and corresponding zoom in (right, yellow outlined region and image) of a 2D neuromuscular co-culture immunostained for dystrophin (dys, green), neurofilament heavy SMI-32 (SMI-32, red), α-bungarotoxin (BTX, white), and Hoechst 33342 (Nuclei, blue) at week 2 of culture. Scale bar, 100 μm. Inset scale bar, 50 μm. (G) Representative western blot image (left) and corresponding bar graph (right) showing quantification of laminin-β2 in 3D muscle-alone and neuromuscular co-cultures at week 2 of culture. n = 9 samples from three muscle patient donors. In (A–B) and (G) each symbol represents data from one muscle patient donor. Values in (A), (B) and (G) are mean ±SEM and were deemed non-significant by statistical test.
Figure 3 with 2 supplements
3D neuromuscular co-cultures are functionally innervated.
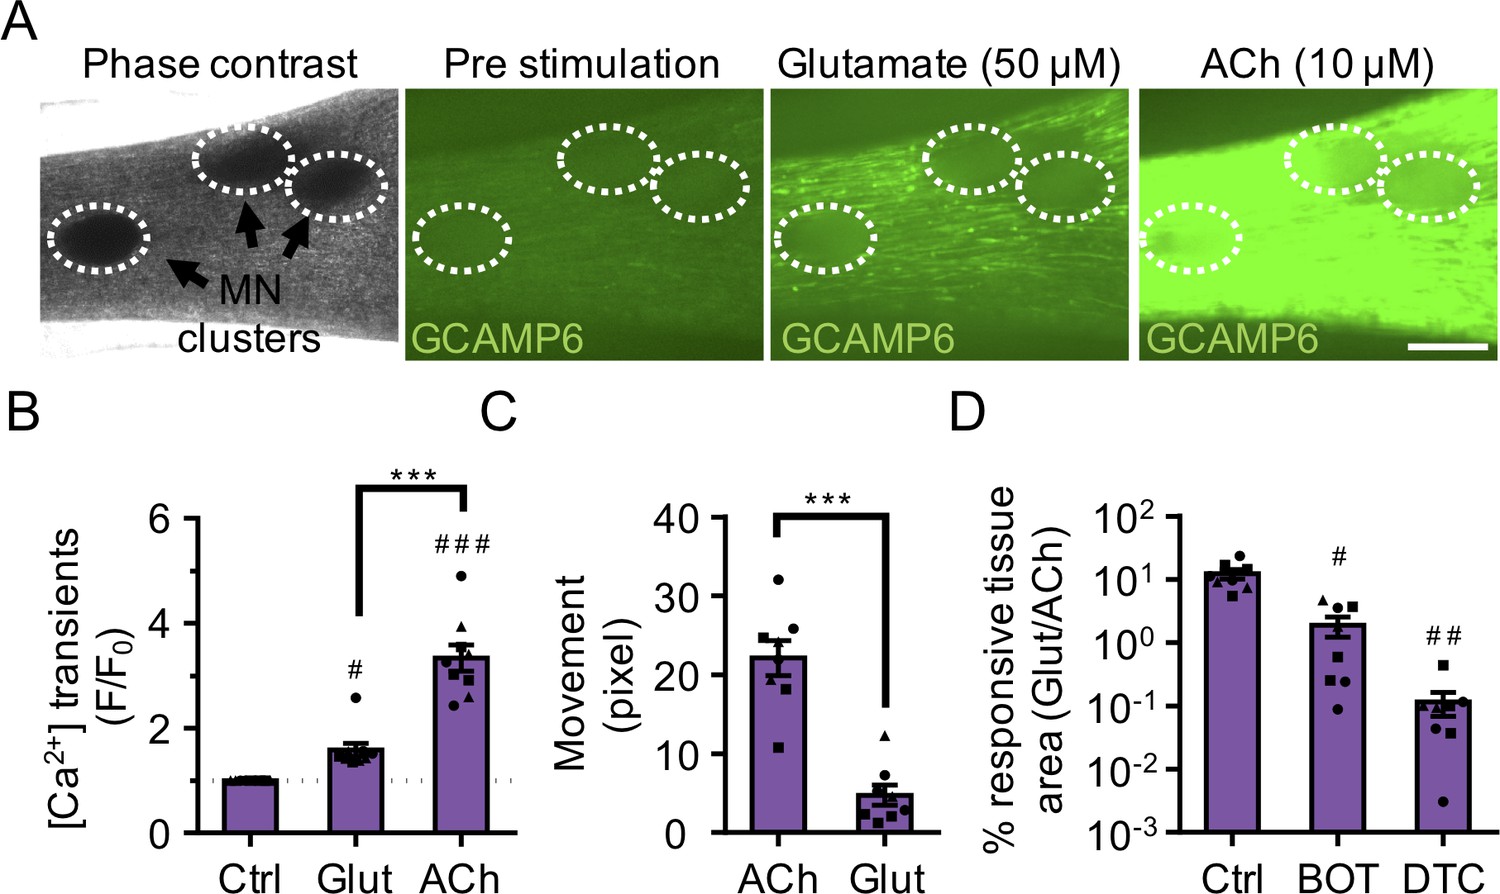
(A) Phase contrast (far left panel) and GCaMP6 epifluorescence images (right panels) of a 3D neuromuscular co-culture after treatment with phosphate buffered saline (middle left panel), glutamate (middle right panel), or ACh (far right panel). Motor neuron clusters are outlined with white dashed lines. Scale bar, 250 μm. (B) Bar graph indicating quantification of fluorescence signal from neuromuscular co-cultures following glutamate (Glut) and Acetylcholine (ACh) stimulations relative to treatment with phosphate buffered saline (Ctrl). n = 9 neuromuscular co-culture samples from three separate muscle patient donors. #p<0.05 and ###p<0.001 compared with saline stimulation (Ctrl). (C) Quantification of neuromuscular co-culture tissue contraction in response to ACh (10 μM) and glutamate (50 μM). (D) Bar graph quantification of the percent tissue area occupied by glutamate (glut, 50 μM) responsive (GCaMP6+) fibers in saline (Ctrl), BOTOX (BOT, 1 U/ml), and d-tubocurarine (DTC, 25 μM) treated 3D neuromuscular co-cultures. #p<0.05 and ###p<0.001 compared with saline treated sample. In (C, D) n = 8 independent neuromuscular samples from three separate muscle patient donors. In (B–D) each symbol represents data from one muscle patient donor. Values in (B–D) are mean ±SEM. ***p<0.001.
Figure 3—figure supplement 1
2D motor neuron and 3D neuromuscular co-culture functional characterization.
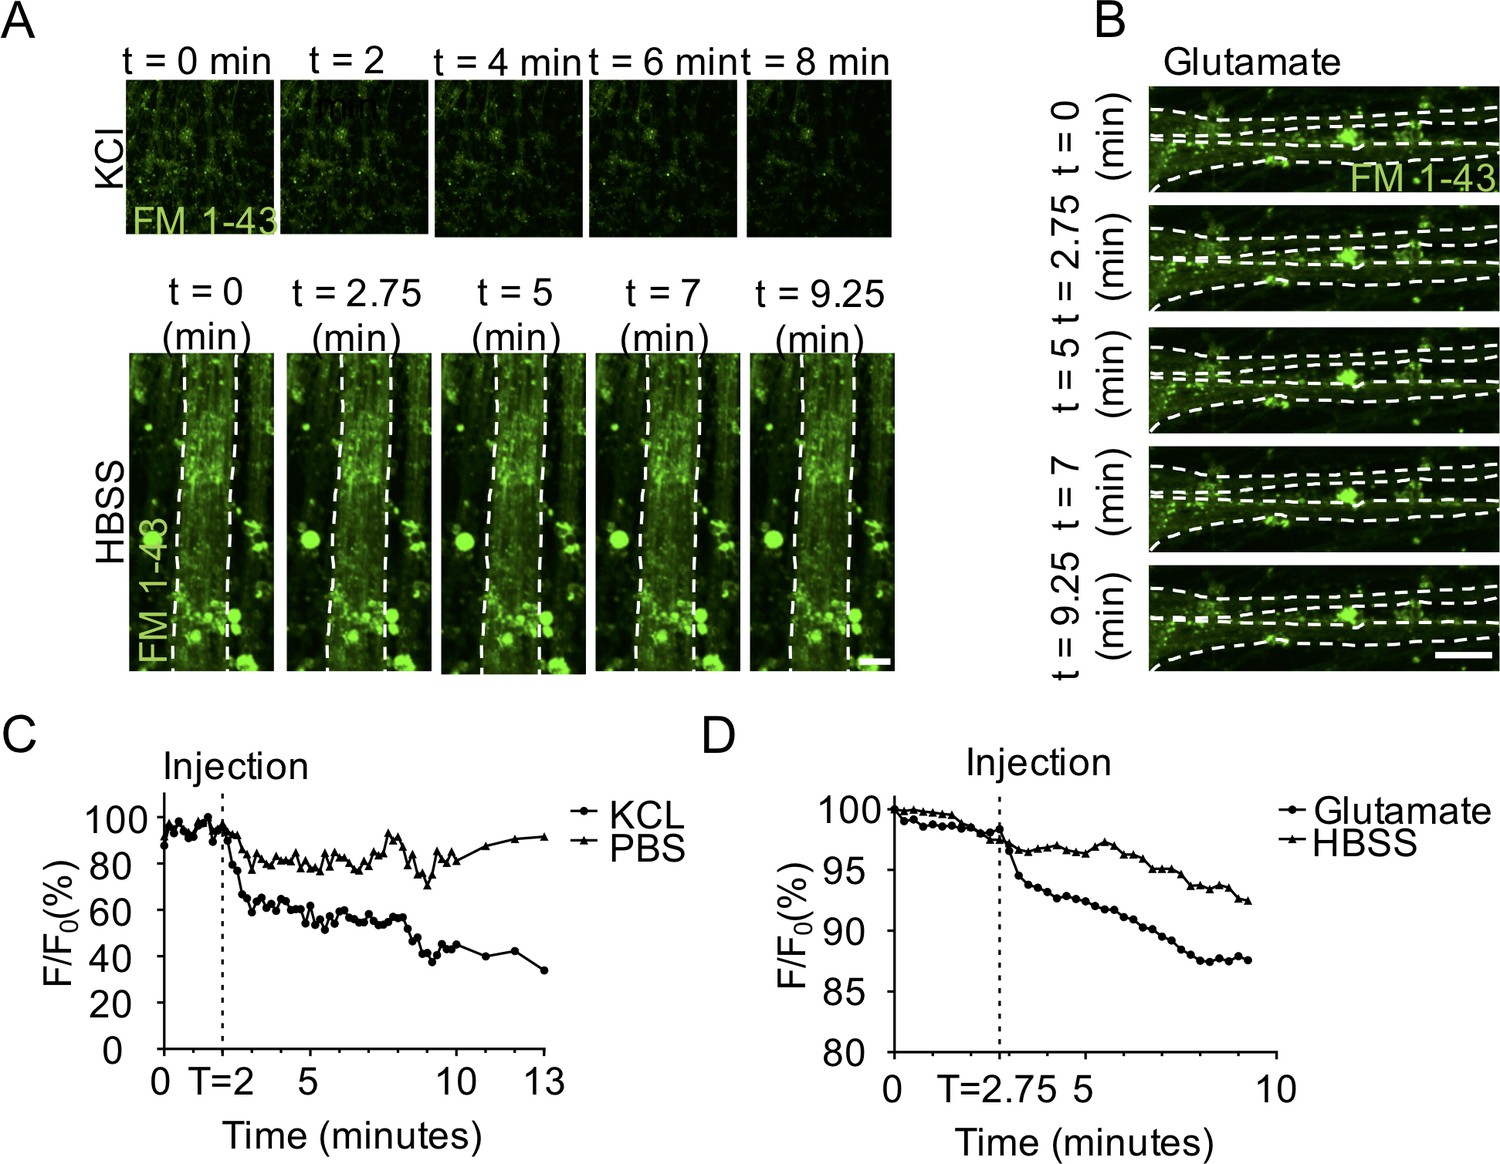
(A–B) Representative epifluorescence still images and (C–D) corresponding graphs quantifying a time course of fluorescence intensity during a potassium chloride (A and C), glutamate (B and D), or HBSS saline solution (A and D) stimulation of differentiated motor neuron (MN) cultures loaded with styryl dye FM 1–43 (green). Scale bars 50 μm for KCL panels and 25 μm for HBSS and glutamate panels.
Figure 3—figure supplement 2
Evaluating functional NMJ connectivity in 2D and 3D neuromuscular co-cultures.
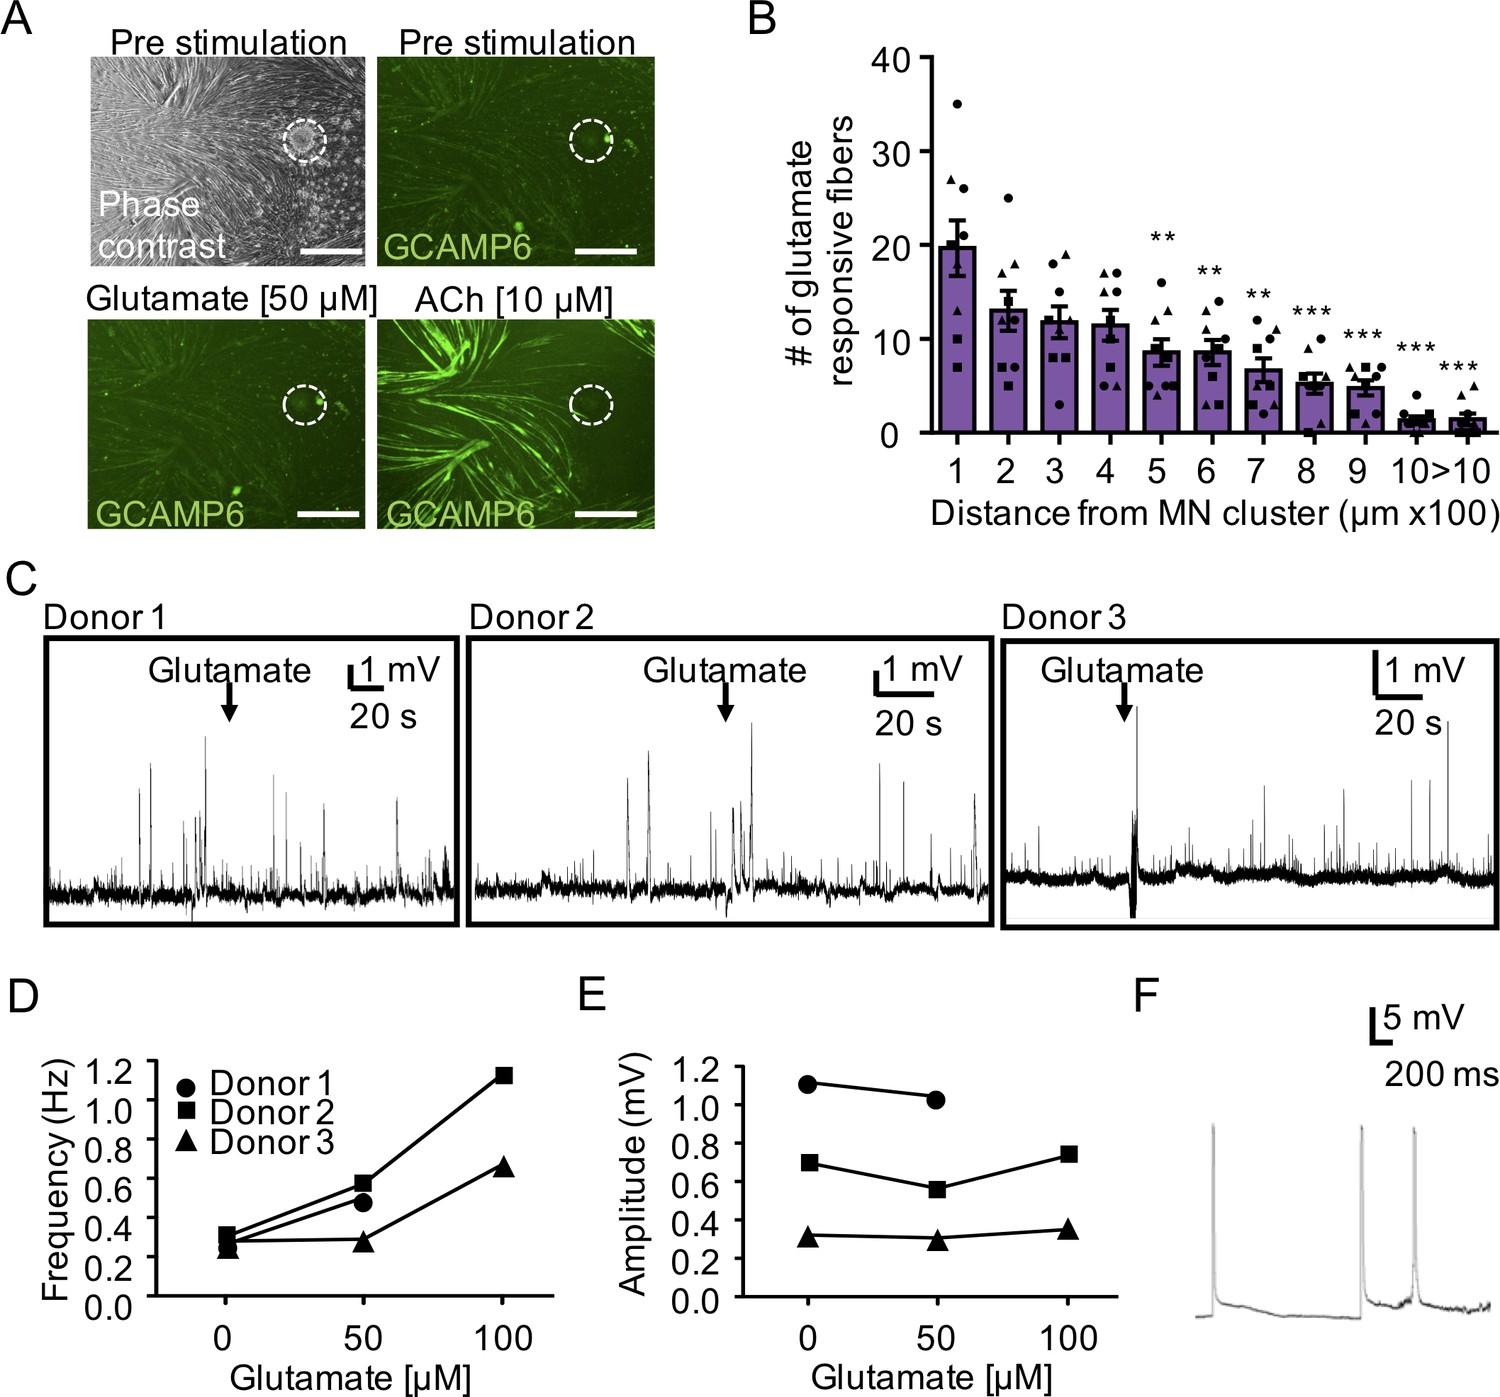
(A) Representative phase contrast (top left) and GCaMP6 epifluorescence images of a 2D neuromuscular co-culture after treatment with phosphate buffered saline (top right, pre-stimulation), glutamate (bottom left), and ACh (bottom right). Motor neuron cluster location is outlined with white dashed lines. Scale bars, 250 μm. (B) Histogram indicating the average number of glutamate responsive fibers (y-axis) at each given distance from the motor neuron cluster (x-axis) at two weeks of co-culture. n = 9 samples from three muscle patient donors. A minimum of 50 GCaMP+ muscle fibers per co-culture were analyzed in each experiment. Statistical analysis was performed using one-way ANOVA followed by multiple comparisons to compare differences between groups using Tukey multiple comparisons test. (*) indicates statistical differences relative to the first column (i.e. 0–100 μm distance). **p<0.01, and ***p<0.001. Values shown are mean ±SEM. (C) Representative traces of sharp microelectrode recordings showing endogenous EPPs recorded in single fibers recorded in three separate neuromuscular co-cultures before and after addition of glutamate (arrow; 50 μM) to the bath media. (D) Line graph indicating the frequency of endogenous EPPs recorded in 3D neuromuscular co-cultures in response to increasing glutamate concentration. (E) Line graph indicating the amplitude of endogenous EPPs recorded in 3D neuromuscular co-cultures in response to increasing glutamate concentration. Each line in D and E corresponds to data obtained from a co-culture constructed using myoblasts from a separate muscle donor (Donor 1–3), where each symbol represents data from one muscle patient donor. (F) Representative action potential-like events recorded from a 3D neuromuscular co-culture following glutamate stimulation.
Figure 4 with 1 supplement
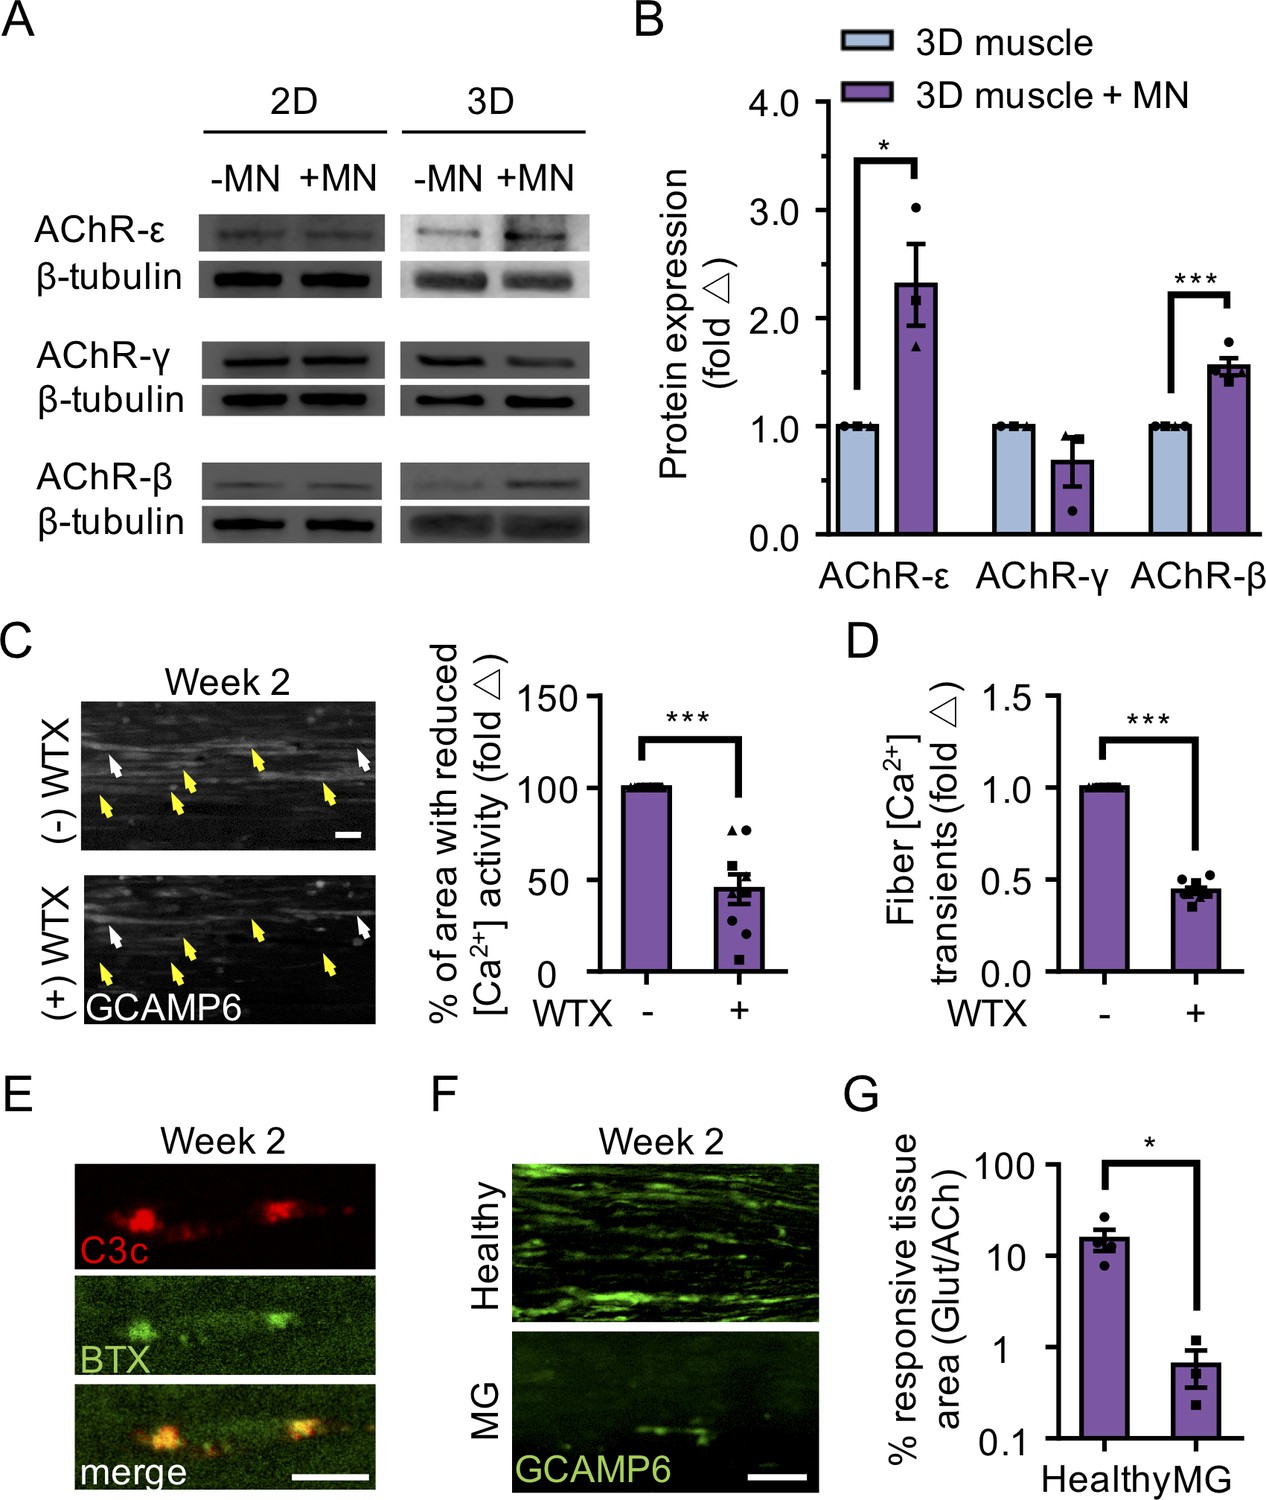
3D neuromuscular co-cultures enable disease modeling of adult NMJ in vitro.
(A) Representative western blot images of nicotinic acetylcholine receptor subunit epsilon (nAChR-ε), gamma (nAChR-γ), and beta (nAChR-β) proteins in 2D and 3D muscle-alone (-MN) and neuromuscular co-cultures (+MN) at two weeks of culture. (B) Bar graph quantification of nACHR subunit ε, γ, and β protein expression in 3D muscle (blue) and 3D neuromuscular (purple) cultures. Values are normalized to 3D muscle cultures. (C) (left panel) Representative epifluorescence images of GCAMP6 signals in response to glutamate (glut) stimulation before (top panel) and after (bottom panel) 3D neuromuscular co-culture treatment with Waglerin 1 (WTX-1). Yellow arrowheads point out fibers with dampened GCAMP6 fluorescence signal following WTX-1 treatment. White arrowheads indicate fibers that did not dampen calcium handling after WTX-1 treatment. Scale bar, 50 μm. (right panel) Bar graph indicating the percentage of 3D neuromuscular co-culture tissue area occupied by glutamate responsive fibers (GCaMP6+) before (-) and after (+) WTX (1 μM) treatment. (D) Bar graph quantifying glutamate-induced GCAMP6 signals from individual fibers before (-) and after (+) WTX-1 treatment. In (C–D), data is normalized to (-) WTX condition. For (B–D), n = 9 independent muscle or neuromuscular samples from three muscle patient donors. A minimum of 50 fibers were analyzed for data presented in (D). (E) Representative confocal images of a 3D muscle culture co-treated with Myasthenia gravis (MG) patient IgG and human complement and then immunostained for human complement component C3c (red, top) and α-bungarotoxin (BTX, green, middle). Bottom panel is a merged image of the top and middle panels. Scale bars, 10 μm. (F) Representative epifluorescence images of GCaMP6 signals from a glutamate stimulated 3D neuromuscular co-culture following a 72 hr treatment with 300 nM of healthy (top panel) or MG (bottom panel) patient IgG and human complement. Scale bars, 100 μm. (G) Bar graph indicating the percent tissue area occupied by glutamate (glut, 50 μM) responsive (GCaMP6+) fibers in healthy and MG patient IgG treated 3D neuromuscular co-cultures. Data normalized to the total area of ACh responsive (GCaMP6+) tissue in each co-culture. n = 4 independent neuromuscular tissues treated with healthy IgG and three neuromuscular tissues each treated with serum IgG from one of three separate MG patient donors. In (B–D) and (G) each symbol represents data from one patient donor. Values in (B–D) and (G) are mean ±SEM. *p<0.05 ***p<0.001.
Figure 4—figure supplement 1
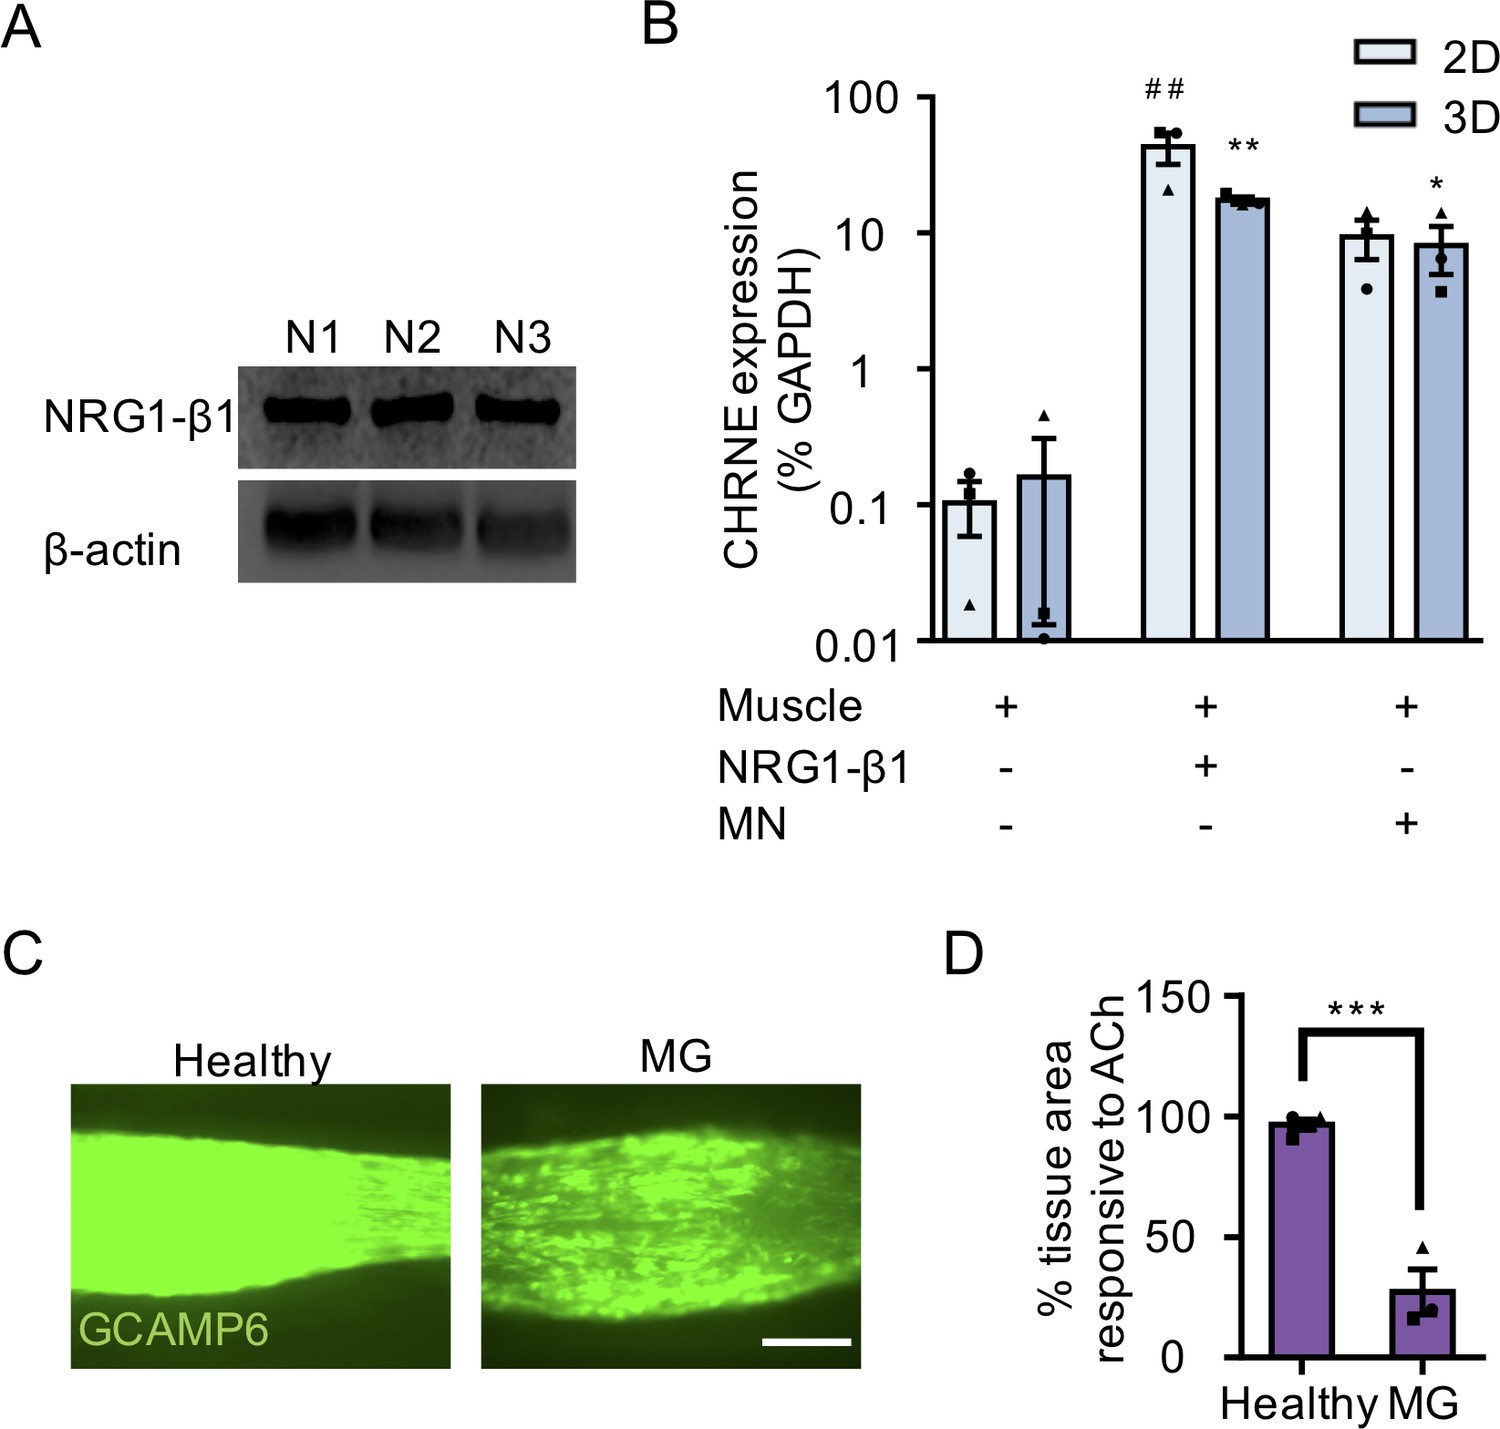
NMJ development and disease modeling studies using 3D neuromuscular co-cultures.
(A) Western blot images of neuregulin 1-β1 (NRG1- β1; top) and β-actin (bottom) protein expression in three-independent ESC-derived MN cultures (N1 – N3). (B) Bar graph quantifying qRT-PCR results for epsilon subunit of AChR (CHRNE) gene expression in 2D (light blue) and 3D (blue bars) muscle alone, NRG1- β1 treated muscle cultures, and neuromuscular co-cultures. N = 3 muscle patient donors for data presented in (B). In (B) each symbol represents data from one muscle patient donor. Values in (B) are mean ±SEM. *p<0.05 and **p<0.01 compared to 3D muscle alone, and ##p<0.01 compared to 2D muscle culture. (C) Representative GCaMP6 epifluorescence images of 3D neuromuscular co-cultures pre-treated for 3 days with healthy (top) or myasthenia gravis (MG, bottom) patient IgG, together with human complement, and then stimulated with ACh (100 μM). Scale bars, 250 μm. (D) Bar graph indicating the percent total 3D tissue area occupied by muscle fibers responding to acetylcholine (ACh) stimulation in healthy and MG patient IgG treated neuromuscular co-cultures. n = 4 neuromuscular tissues treated with healthy IgG and three neuromuscular tissues each treated with serum IgG from one of three separate MG patient donors. Values in (D) are mean ±SEM. ***p<0.001.
Videos
Video 1
Three-dimensional human skeletal muscle tissue contraction in response to chemical and electrical stimulation.
A series of four representative bright-field real-time videos of three-dimensional human muscle tissues after 10–12 days of culture exhibiting spontaneous contractions, or contracting in response to electrical (1 Hz, 20 Hz) or acetylcholine (10 μM) stimulation.
Video 2
Two-dimensional human skeletal muscle fiber contraction in response to acetylcholine stimulation.
Epifluorescence real-time video of a two-dimensional GCaMP6 transduced human muscle fiber culture contracting in response to 10 μM acetylcholine stimulation after 2 weeks of culture. Black arrow heads indicate a muscle fiber that breaks post acetylcholine stimulation.
Video 3
Three-dimensional human skeletal muscle tissue calcium handling in response to chemical stimulation.
A series of two representative epifluorescence time-lapse videos of three-dimensional human skeletal muscle tissues after 10–12 days of culture stimulated with acetylcholine (10 μM) and then with L-glutamate (50 μM). Muscle fiber calcium transients are visualized in green by following a GCaMP6 calcium reporter that was transduced into the human muscle cells.
Video 4
Optogenetically transduced three-dimensional human skeletal muscle tissue response to blue light (470 nm).
A real-time bright field video of a 3D human skeletal muscle tissue transduced with ChR2 (H134R) and stimulated by blue light. Red circles indicate the time and period of light pulses.
Video 5
Pluripotent stem cell derived motor neurons exocytose in response to physiological stimuli.
Representative time-lapse microscope videos of FM 1–43 loaded PSC-derived motor neurons response to various stimuli (KCl (60 mM), HBSS and L-Glutamate (50 µM)). Videos illustrate loss of fluorescent intensity from the neurites post glutamate and potassium chloride stimuli indicative of exocytosis. White lines outline the neurites in HBSS and L-Glutamate stimulation videos.
Video 6
Neuromuscular co-cultures are functionally innervated.
A representative epifluorescence time-lapse video in which GCaMP6 transduced muscle cells co-cultured with pluripotent stem cell-derived motor neurons for 14 days in three-dimensions are first treated with HBSS saline solution, followed by L-glutamate (50 μM), and then acetylcholine (10 μM). White dashed lines outline the muscle tissue and yellow dotted circles outline motor neuron clusters.
Video 7
Synchronous muscle fiber contractions in response to neuromuscular co-culture L-glutamate stimulation.
A representative epifluorescence time-lapse video in which GCaMP6 transduced muscle cells co-cultured with GFP-expressing induced pluripotent stem cell-derived motor neurons in three-dimensions demonstrate synchronous contraction in response to treatment with L-glutamate (50 μM) at Day 14 of culture. BOTOX (1 U/ml) and d-tubocurarine (25 μM) treatments blocked the glutamate induced muscle fiber contractions. White circles outline the location of motor neuron clusters.
Video 8
2D neuromuscular co-culture innervation and AChR development is limited.
A representative epifluorescence time-lapse video in which GCaMP6 transduced muscle cells co-cultured with pluripotent stem cell-derived motor neurons for two-weeks in 2D culture are first treated with L-glutamate (50 μM) on Day 14. On Day 15 the co-culture is pre-treated with Waglerin-1 (WTX-1) and then stimulated with L-glutamate, followed by acetylcholine (10 μM). Muscle fiber calcium transients are visualized in green by following the GCaMP6 calcium reporter.
Video 9
3D neuromuscular co-cultures enable studies of the AChR epsilon subunit.
A representative epifluorescence time-lapse video in which GCaMP6 transduced muscle cells co-cultured with pluripotent stem cell-derived motor neurons for two-weeks in 3D culture are treated with L-glutamate (50 μM) on Day 14, and then with Waglerin-1 (WTX) followed by L-glutamate (50 μM) on Day 15. Muscle fiber calcium transients are visualized in green by following the GCaMP6 calcium reporter. A yellow dotted line outlines the location of the motor neuron cluster.
Video 10
Waglerin-1 treatment does not dampen ACh induced muscle fiber calcium transients in 3D muscle alone cultures.
A representative epifluorescence time-lapse video in which GCaMP6 transduced muscle cells cultured two-weeks in 3D culture are first treated with ACh (10 μM) on Day 14, and then pre-treated with Waglerin-1 (WTX, 1 μM) followed by another ACh (10 μM) stimulation. Muscle fiber calcium transients are visualized in green by following the GCaMP6 calcium reporter.
Video 11
The influence of Myasthenia gravis autoantibodies on NMJ activity is easily studied in 3D neuromuscular co-cultures.
A representative epifluorescence time-lapse video in which GCaMP6 transduced muscle cells co-cultured with pluripotent stem cell-derived motor neurons for 14 days in three-dimensions are first stimulated with L-glutamate (50 μM) to assess neuromuscular junction transmission, and then with acetylcholine (100 μM) to visualize all fibers in the culture. These cultures were treated for 3 days (Day 11 to Day 14) with Myasthenia gravis patient IgG (300 nM) and 2% human serum. A yellow dotted line outlines the location of the motor neuron cluster.
Video 12
3D neuromuscular co-cultures treated with healthy patient IgG and complement display normal calcium transients in response to glutamate stimulation.
A representative epifluorescence time-lapse video in which GCaMP6 transduced muscle cells co-cultured with pluripotent stem cell-derived motor neurons for 14 days in three-dimensions are stimulated first with L-glutamate (50 μM) to assess neuromuscular junction transmission, and then with acetylcholine (100 μM) to visualize all fibers in the culture. These cultures were treated for 3 days (Day 11 to Day 14) with healthy patient IgG (300 nM) and 2% human serum. A yellow dotted line outlines the location of the motor neuron cluster.
Tables
Table 1
Myasthenia Gravis patient information.
https://doi.org/10.7554/eLife.44530.024| Patient ID | Sex | Anti-AChR titer (nM) |
|---|---|---|
| MG#1 | Male | >10 |
| MG#2 | Female | 8.6 |
| MG#3 | Female | >10 |
Table 2
Cell Culture Media and Solutions
https://doi.org/10.7554/eLife.44530.027| # | Name | Details |
|---|---|---|
| 1 | Blocking solution | 20% goat serum, 0.3% Triton-X 100 in PBS |
| 2 | Fibrinogen stock solution | 10 mg / mL fibrinogen in 0.9% (wt/v) NaCl solution in water |
| 3 | Human fibroblast growth media | Dulbecco’s Modified Eagle’s medium (DMEM), 10% fetal bovine serum, 1% penicillin-streptomycin |
| 4 | Human myoblast differentiation media | Dulbecco’s Modified Eagle’s medium (DMEM), 2% horse serum, 10 μg / mL insulin, 1% penicillin-streptomycin |
| 5 | Human myoblast growth media | Ham’s F-10 nutrient mix, 20% fetal bovine serum, 5 ng / mL basic fibroblast growth factor, 1% penicillin-streptomycin |
| 6 | Hydrogel mixture | Dulbecco’s Modified Eagle’s medium (DMEM), 4 mg / mL bovine fibrinogen, Geltrex (20% v / v), thrombin (0.2 unit/mg fibrinogen) |
| 7 | Milk based blocking solution | 5% (wt/v) skim milk (BioShop) in TBST |
| 8 | Red blood cell lysis buffer | 15.5 mM NH4Cl, 1 mM KHCO3, 10 μM EDTA |
| 9 | Tris-buffered saline Tween (TBST) | 50 mM Tris (BioShop), 150 mM NaCl (Sigma), 0.1% (v/v) Tween 20 (BioShop) |
Table 3
List of primary antibodies.
https://doi.org/10.7554/eLife.44530.028| # | Antibody | Species | Dilution | Source |
|---|---|---|---|---|
| 1 | Alexa Fluor 647 mouse anti-human CD56 | Mouse | 1:20 | BD Pharmingen |
| 2 | Anti-200 kD neurofilament heavy (SMI-32) | Rabbit | 1:200 | Abcam |
| 3 | Anti-C3c (FITC) | Rabbit | 1:200 | Abcam |
| 4 | Anti-HB9/HLXB9 | Rabbit | 1:100 | Abcam |
| 5 | Anti-vimentin | Rabbit | 1:100 | Abcam |
| 6 | Anti- β -tubulin | Rabbit | 1:5000 | Cell Signaling |
| 7 | DRAQ5 | - | 1:1000 | ThermoFisher |
| 8 | Hoechst 33342 | - | 1:1000 | ThermoFisher |
| 9 | Islet-1 | Goat | 5 μg/ml | R and D systems |
| 10 | NRG1- β1 | Mouse | 1:500 | R and D Systems |
| 11 | Monoclonal anti-β-actin-peroxidase | Mouse | 1:50000 | Sigma |
| 12 | Monoclonal mouse anti-human desmin | Mouse | 1:100 | Dako |
| 13 | MuSK (PA5-14703) [WB] | Rabbit | 1:1000 | Invitrogen |
| MuSK (PA1-1741) [IF] | Rabbit | 1:50 | Invitrogen | |
| 14 | Myosin heavy chain - embryonic | Mouse | 1:50 | DSHB |
| 15 | Myosin heavy chain - fast | Mouse | 1:50 | DSHB |
| 16 | Myosin heavy chain - slow | Mouse | 1:50 | DSHB |
| 17 | Myosin heavy chain - pan | Mouse | 1:50 | DSHB |
| 18 | Nicotinic acetylcholine receptor β | Rabbit | 1:2000 | Novus |
| 19 | Nicotinic acetylcholine receptor epsilon | Rabbit | 1:1000 | Novus |
| 20 | Rapsyn | Mouse | 1:1000 | Abcam |
| 21 | Sarcomeric alpha-actinin | Mouse | 1:200 | Sigma |
| 22 | α-Bungarotoxin, Alexa Fluor 647 conjugate | - | 1:500 | ThermoFisher |
Table 4
Real-time PCR primer sequences.
https://doi.org/10.7554/eLife.44530.029| GENE | Species | Forward 5’−3’ | Reverse 3’−5’ |
|---|---|---|---|
| AGRN | human | CCTGACCCTCAGCTGGCCCT | AGATACCCAGGCAGGCGGCA |
| GAPDH | human | GTGAAGGTCGGAGTCAACG | TGAGGTCAATGAAGGGGTC |
Additional files
-
Transparent reporting form
- https://doi.org/10.7554/eLife.44530.030
Download links
A two-part list of links to download the article, or parts of the article, in various formats.
Downloads (link to download the article as PDF)
Open citations (links to open the citations from this article in various online reference manager services)
Cite this article (links to download the citations from this article in formats compatible with various reference manager tools)
A 3D culture model of innervated human skeletal muscle enables studies of the adult neuromuscular junction
eLife 8:e44530.
https://doi.org/10.7554/eLife.44530


