Aurora A depletion reveals centrosome-independent polarization mechanism in Caenorhabditis elegans
- Swiss Institute for Experimental Cancer Research (ISREC), School of Life Sciences, Swiss Federal Institute of Technology Lausanne (EPFL), Switzerland
- University of Geneva, Switzerland
- TU Dresden, Germany
- Max Planck Institute of Molecular Cell Biology and Genetics, Germany
- National Center of Competence in Research Chemical Biology, University of Geneva, Switzerland
Figures
Figure 1 with 2 supplements
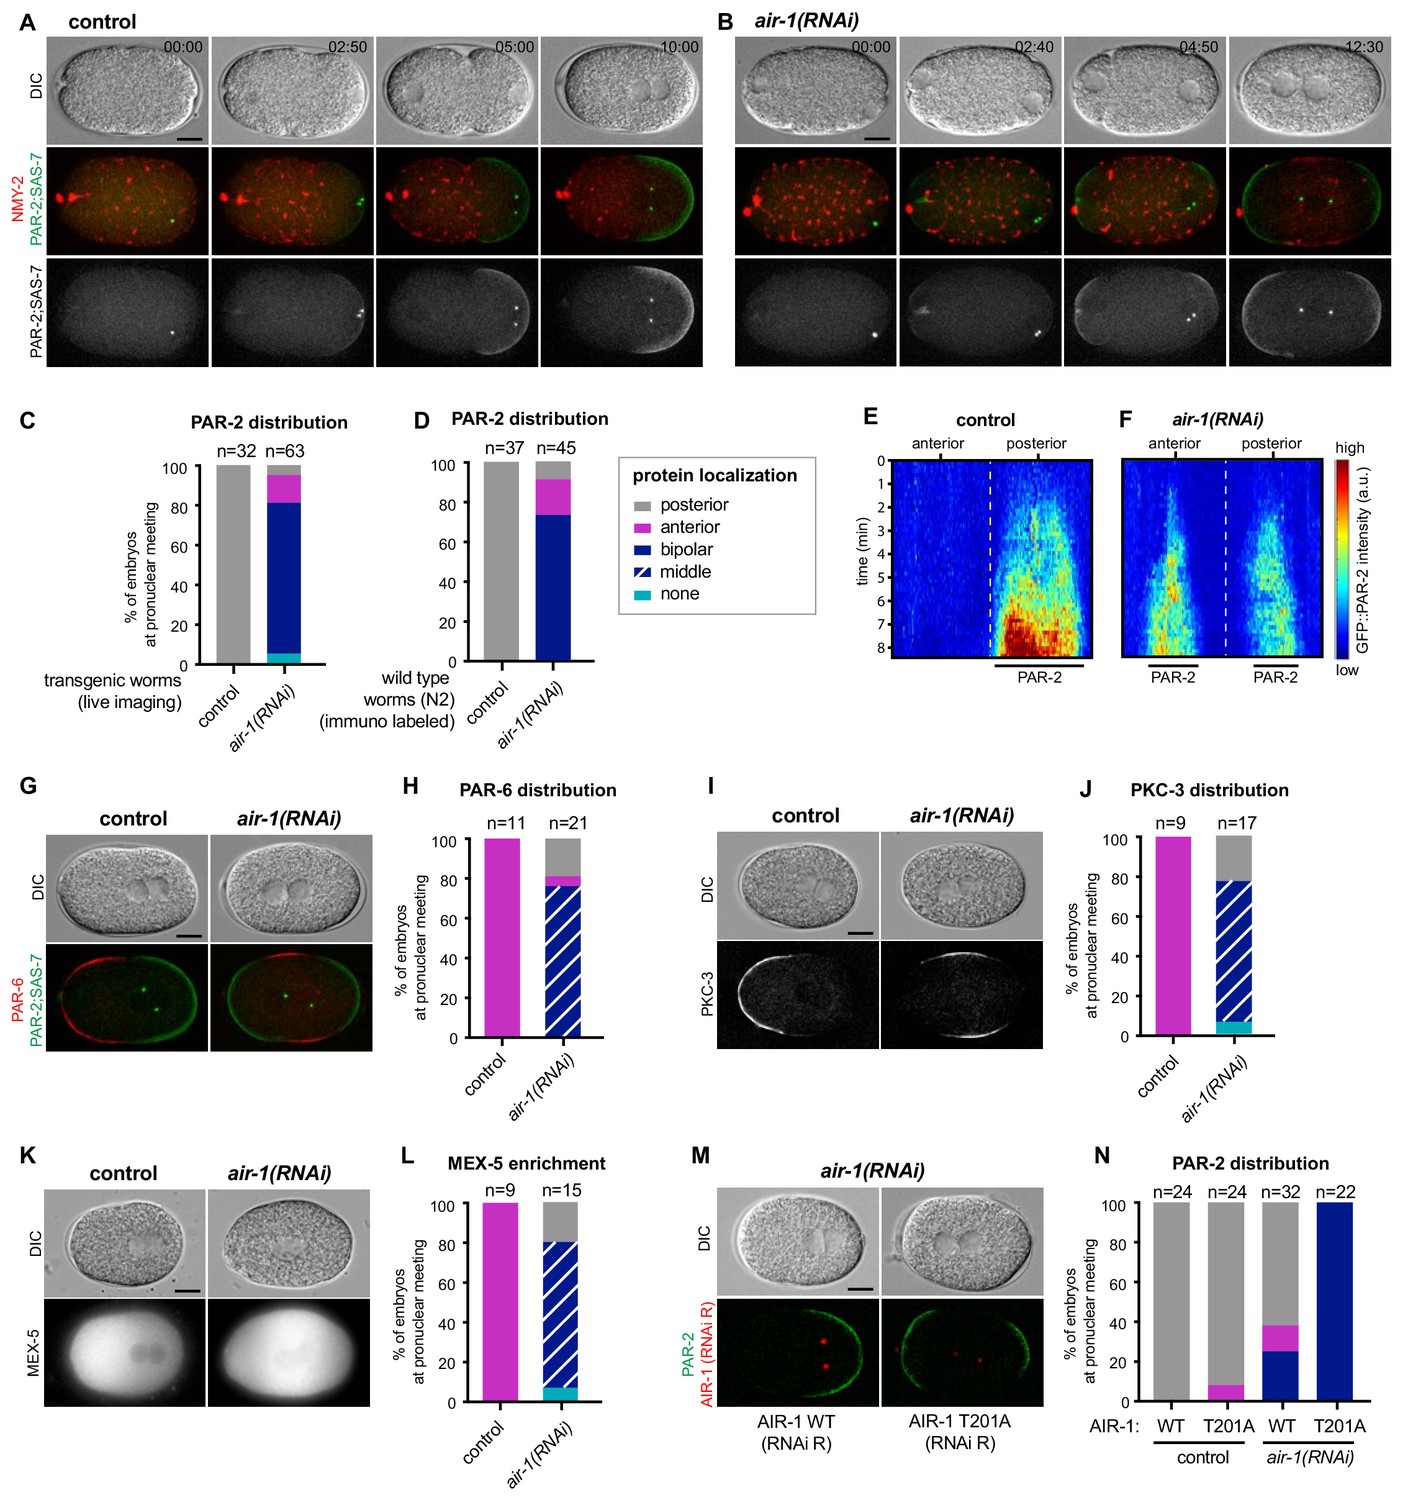
AIR-1 ensures uniqueness of symmetry breaking in C.elegans zygotes.
(A,B) Time lapse microscopy of control (A) and air-1(RNAi) (B) embryos expressing RFP::NMY-2 (red), GFP::PAR-2 and GFP::SAS-7 (both green). Upper panels: DIC, middle panels: merge, lower panels: grey scale of GFP::PAR-2 and GFP::SAS-7 signals. In this and all other panels, scale bar is 10 µM and time is shown in min:s. (C) Quantification of GFP::PAR-2 distributions at pronuclear meeting, which is the stage used in all subsequent panels. See Supplementary file 2 for all statistical analyses (Fischer’s exact test). (D) Quantification of endogenous PAR-2 distributions in wild type (N2) embryos. (E,F) Heat map of GFP::PAR-2 fluorescence over time along the circumference of control (F, n = 12) and air-1(RNAi) (G, n = 14; bipolar only) embryos. Tick marks above the panels indicate anterior-most and posterior-most positions, respectively. t = 0 corresponds to the onset of cortical flows (G) Control and air-1(RNAi) embryos expressing mCherry::PAR-2 (green), together with GFP::SAS-7 and GFP::PAR-6 (both red). Upper panels: DIC, lower panels: merge. (H) Quantification of GFP::PAR-2 distributions corresponding to G. (I,K) Control and air-1(RNAi) embryos expressing GFP::PKC-3 (I), mCherry::MEX-5 (K). Upper panels: DIC, lower panels: grey scale. (J,L) Quantification of GFP::PAR-2 distributions corresponding to I and K. (M) Images of embryos depleted of endogenous AIR-1 and expressing mCh::PAR-2 and RFP::SAS-7 (both red), together with GFP::AIR-1 WT(RNAi resistant, denoted RNAi R) (left) or GFP::AIR-1 T201A(RNAi R) (right) (both green). Upper panels: DIC, lower panels: merge. (N) Quantification of GFP::PAR-2 distributions in embryos expressing GFP::AIR-1 WT(RNAi R) or GFP::AIR-1 T201(RNAi R) without or with endogenous AIR-1 depletion, as indicated.
Figure 1—figure supplement 1
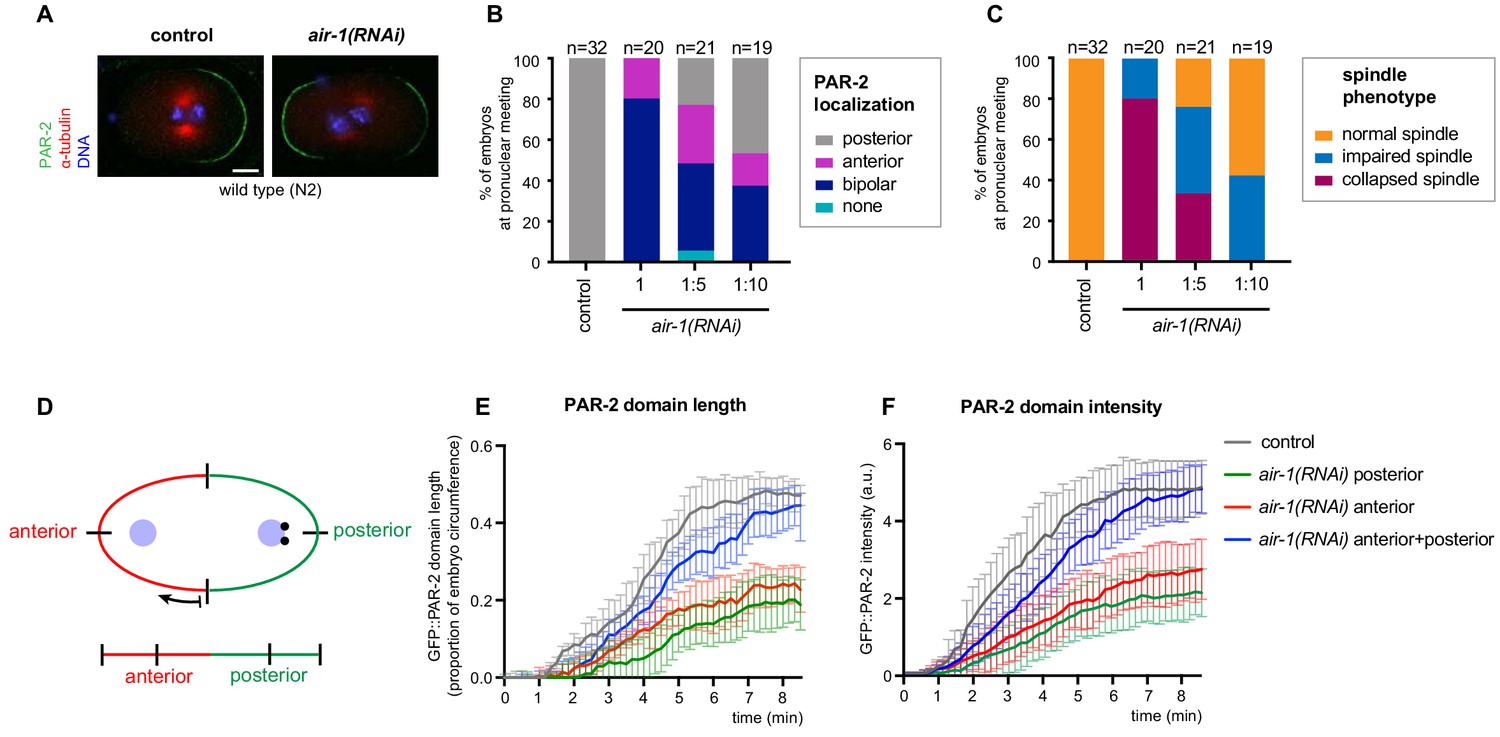
Aspects of polarity in AIR-1-depleted embryos.
(A) Control and air-1(RNAi) embryos at pronuclear meeting, fixed and stained with antibodies against α-tubulin (red), PAR-2 (green); DNA is shown in blue. Here and in all other panels of the Supplementary Figures, scale bar: 10 µM. (B) Quantification of PAR-2 distributions in control and air-1(RNAi) embryos. air-1(RNAi) was diluted 1:5 or 1:10 with bacteria expressing an empty vector (L4440), as indicated. (C) Quantification of spindle phenotypes based on mCh::TBA-2 distribution in the same embryos as in (B). (D) Schematic illustrating how the embryo’s circumference was straightened for Figure 1E,F and Figure 3H,J beginning of arrow indicates left-most part of the panels. (L,N) (E, F) Length (E) and intensity (F) of GFP::PAR-2 domains over time in control and air-1(RNAi) embryos.
Figure 1—figure supplement 2
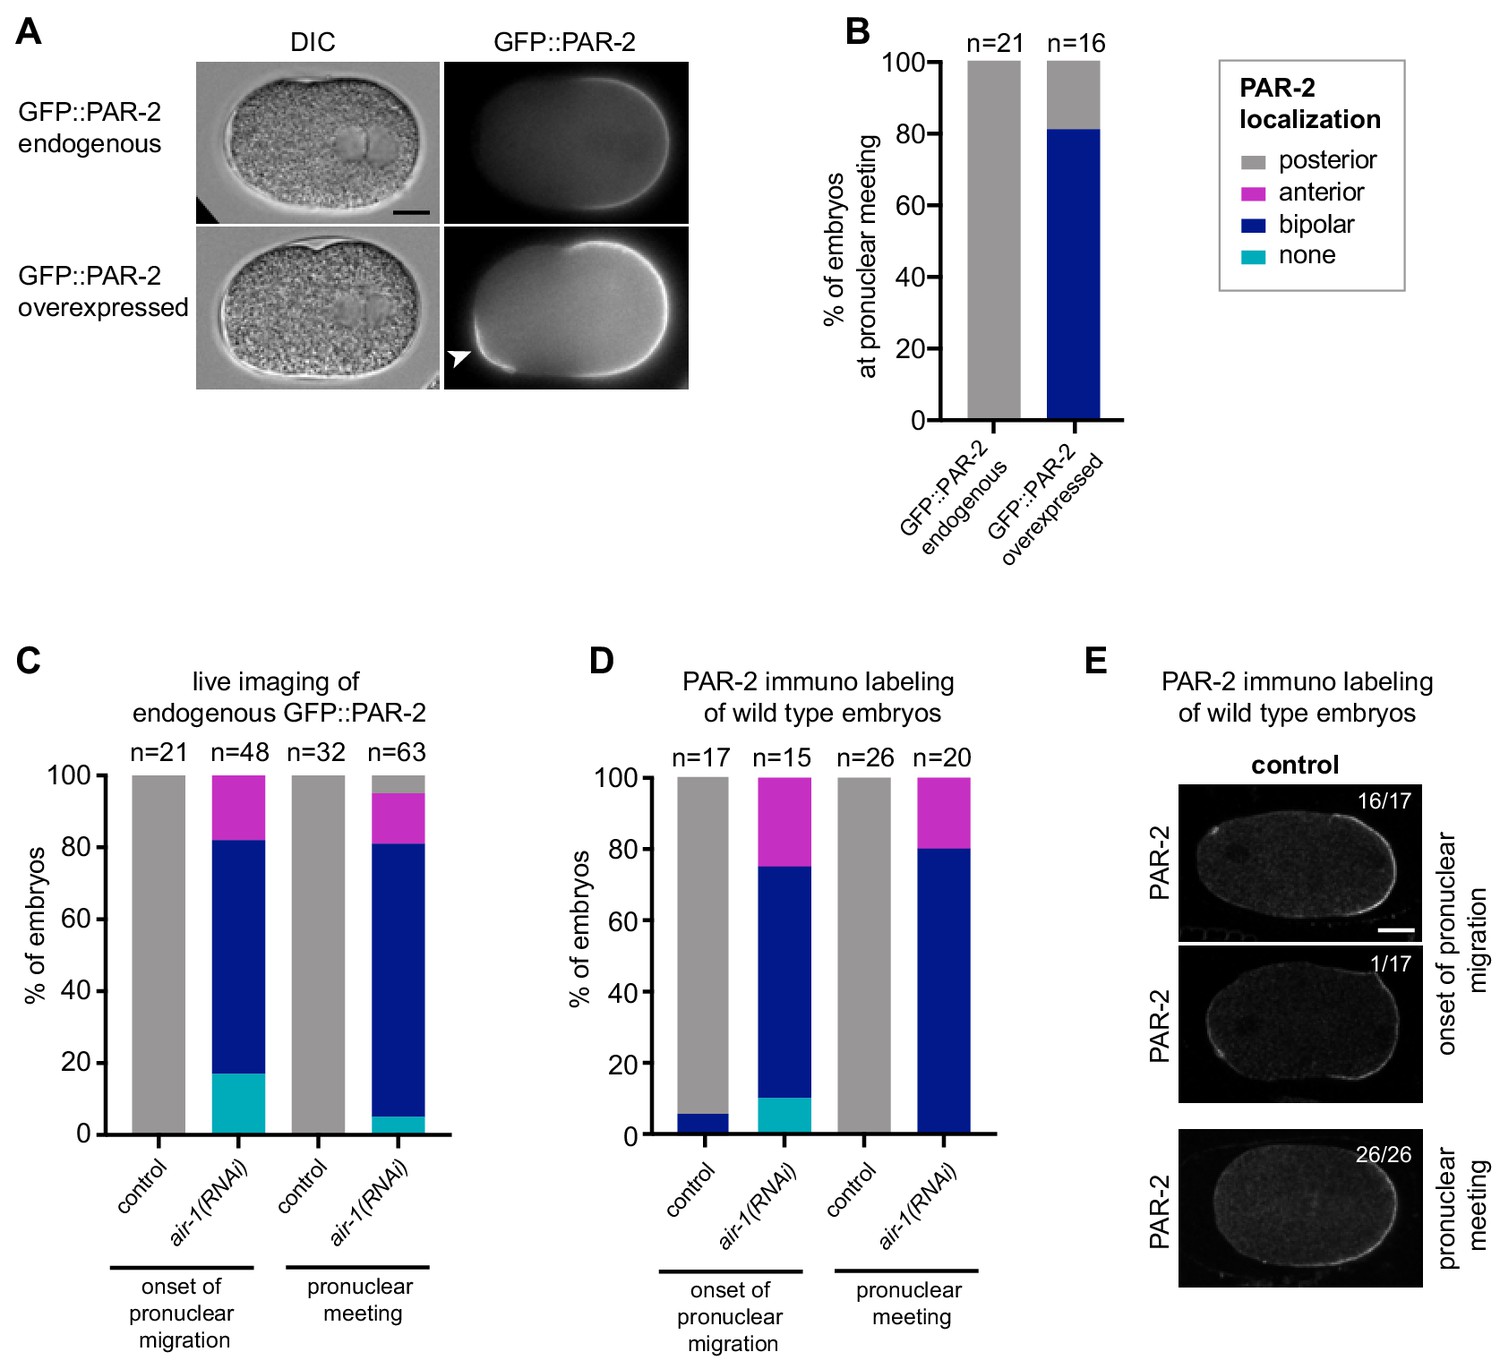
PAR-2 domain distributions in different strains and conditions.
(A) Time lapse microscopy of embryos expressing endogenously tagged GFP::PAR-2 (upper row, strain KK1273) or a codon adapted GFP::PAR-2 transgene in a PAR-2 null background (lower row, strain TH415). Left panels: DIC, right panels: grey scale of GFP::PAR-2 signal. Arrowhead indicates the appearance of an anterior PAR-2 domain upon PAR-2 overexpression; note that this domain is less extensive than the bona fide posterior domain, but was nevertheless scored as being present in panel (B). (B) Corresponding GFP::PAR-2 distributions at pronuclear meeting. (C) Quantification of GFP::PAR-2 distributions in control and air-1(RNAi) embryos at the onset of pronuclear migration and at pronuclear meeting, as indicated. (D) Quantification of PAR-2 distributions in immunolabeled wild-type control and air-1(RNAi) embryos at the onset of pronuclear migration or at pronuclear meeting, as indicated. (E) Images corresponding to the distributions reported in (D). Upper image: representative image of a control embryo at pronuclear migration onset. Lower image: sole embryo with bipolar PAR-2 distribution at pronuclear migration onset. Note that a similar distribution for endogenous PAR-2 was reported previously in a larger fraction of embryos at an early stage (Boyd et al., 1996). Importantly, all experiments here relied on scoring endogenous GFP::PAR-2 or PAR-2 at pronuclear meeting, when no control embryo exhibited bipolarity.
Figure 2 with 1 supplement

Bipolarity of embryos depleted of AIR-1 is established through PAR-2.
(A,B) Kymographs of control (A) and air-1(RNAi) (B) embryos expressing RFP::NMY-2 (red), GFP::PAR-2 and GFP::SAS-7 (both green). Straight red vertical lines correspond to immobile polar bodies. (C,D) Kymograph of RFP::NMY-2 cortical flow velocities quantified by particle imaging velocimetry (PIV) in control (C) and air-1(RNAi) (D) embryos. Values indicate average peak velocities at the anterior (red) and posterior (blue). N = 10 for both conditions. (E,G) rga-3(RNAi) and rga-3(RNAi) air-1(RNAi) embryos (E) or nmy-2(ne3409) and nmy-2(ne3409) air-1(RNAi) (G) embryos expressing RFP::NMY-2 (red), GFP::PAR-2 and GFP::SAS-7 (both green). Upper panels: DIC, lower panel: merge. The black triangle in the lower left corner of the control embryo in (G) results from rotating the image. (F,H) Quantification of GFP::PAR-2 distributions corresponding to E and G. Note that GFP::PAR-2 domains were less robust in nmy-2(ne3409) air-1(RNAi) embryos than in the control condition (see G). (I) Embryos expressing GFP::PAR-2 R163A (RNAi-resistant, denoted RNAi R) depleted of endogenous PAR-2, together with ect-2(RNAi) or air-1(RNAi), as indicated. Upper panels: DIC, lower panels: grey scale. (J,K) Quantification of GFP::PAR-2 distributions in embryos expressing RNAi-resistant GFP::PAR-2 WT or GFP::PAR-2 R163A and depleted of endogenous PAR-2 in combination with ect-2(RNAi) or air-1(RNAi), as indicated.
Figure 2—figure supplement 1
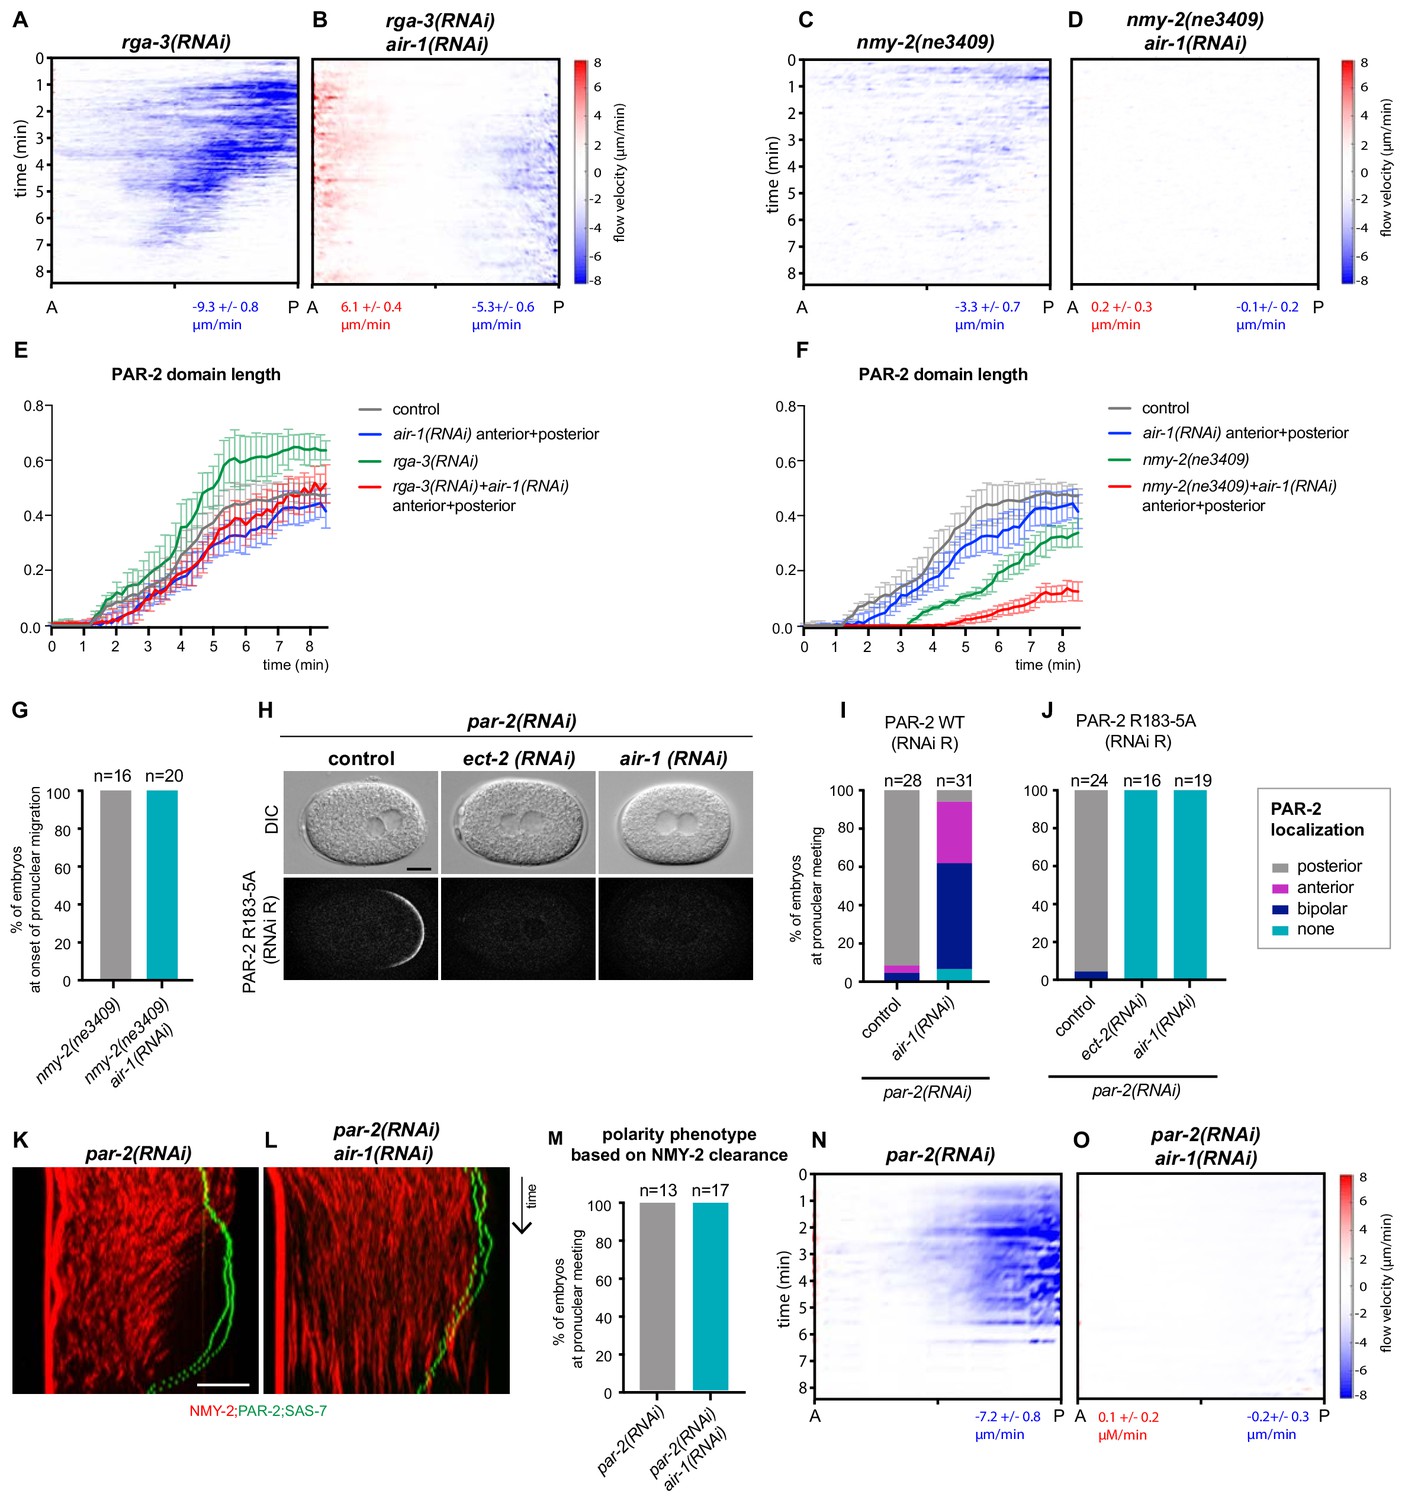
Cortical flows in AIR-1 depleted embryos are PAR-2-dependent.
(A–D) Kymographs of cortical flow velocities quantified by particle imaging velocimetry (PIV) of embryos of indicated genotypes expressing GFP::Moesin. Values indicate average peak velocities at the anterior (red) and posterior (blue). N = 5 for all conditions, except for rga-3(RNAi), where N = 4. (E) Length of GFP::PAR-2 domains over time in control, air-1(RNAi), nmy-2(ne3409) and nmy-2(ne3409) +air-1(RNAi) embryos. (F) Length of GFP::PAR-2 domains over time in control, air-1(RNAi) (both same as in E) rga-3(RNAi) and rga-3(RNAi) air-1(RNAi) embryos. (G) Quantification of PAR-2 distributions in nmy-2(ne3409) and nmy-2(ne3409) air-1(RNAi) embryos at the onset of pronuclear migration. (H) Embryos expressing GFP::PAR-2 R163A depleted of endogenous PAR-2 either alone or together with ect 2(RNAi) or air-1(RNAi), as indicated. (I,J) Corresponding quantification of GFP::PAR-2 distributions. (K,L) Kymographs of par-2(RNAi) alone or in combination with air-1(RNAi). Embryos express RFP::NMY-2 (red), GFP::PAR-2 and GFP::SAS-7 (both green). (M) Quantification of RFP::NMY-2 clearance as an indicator of polarity, corresponding to (K,L). (N,O) Kymographs of cortical flow velocities quantified by PIV of embryos reported in M. Values indicate average peak velocities at the anterior (red) and posterior (blue) N = 5 for both conditions.
Figure 3 with 1 supplement
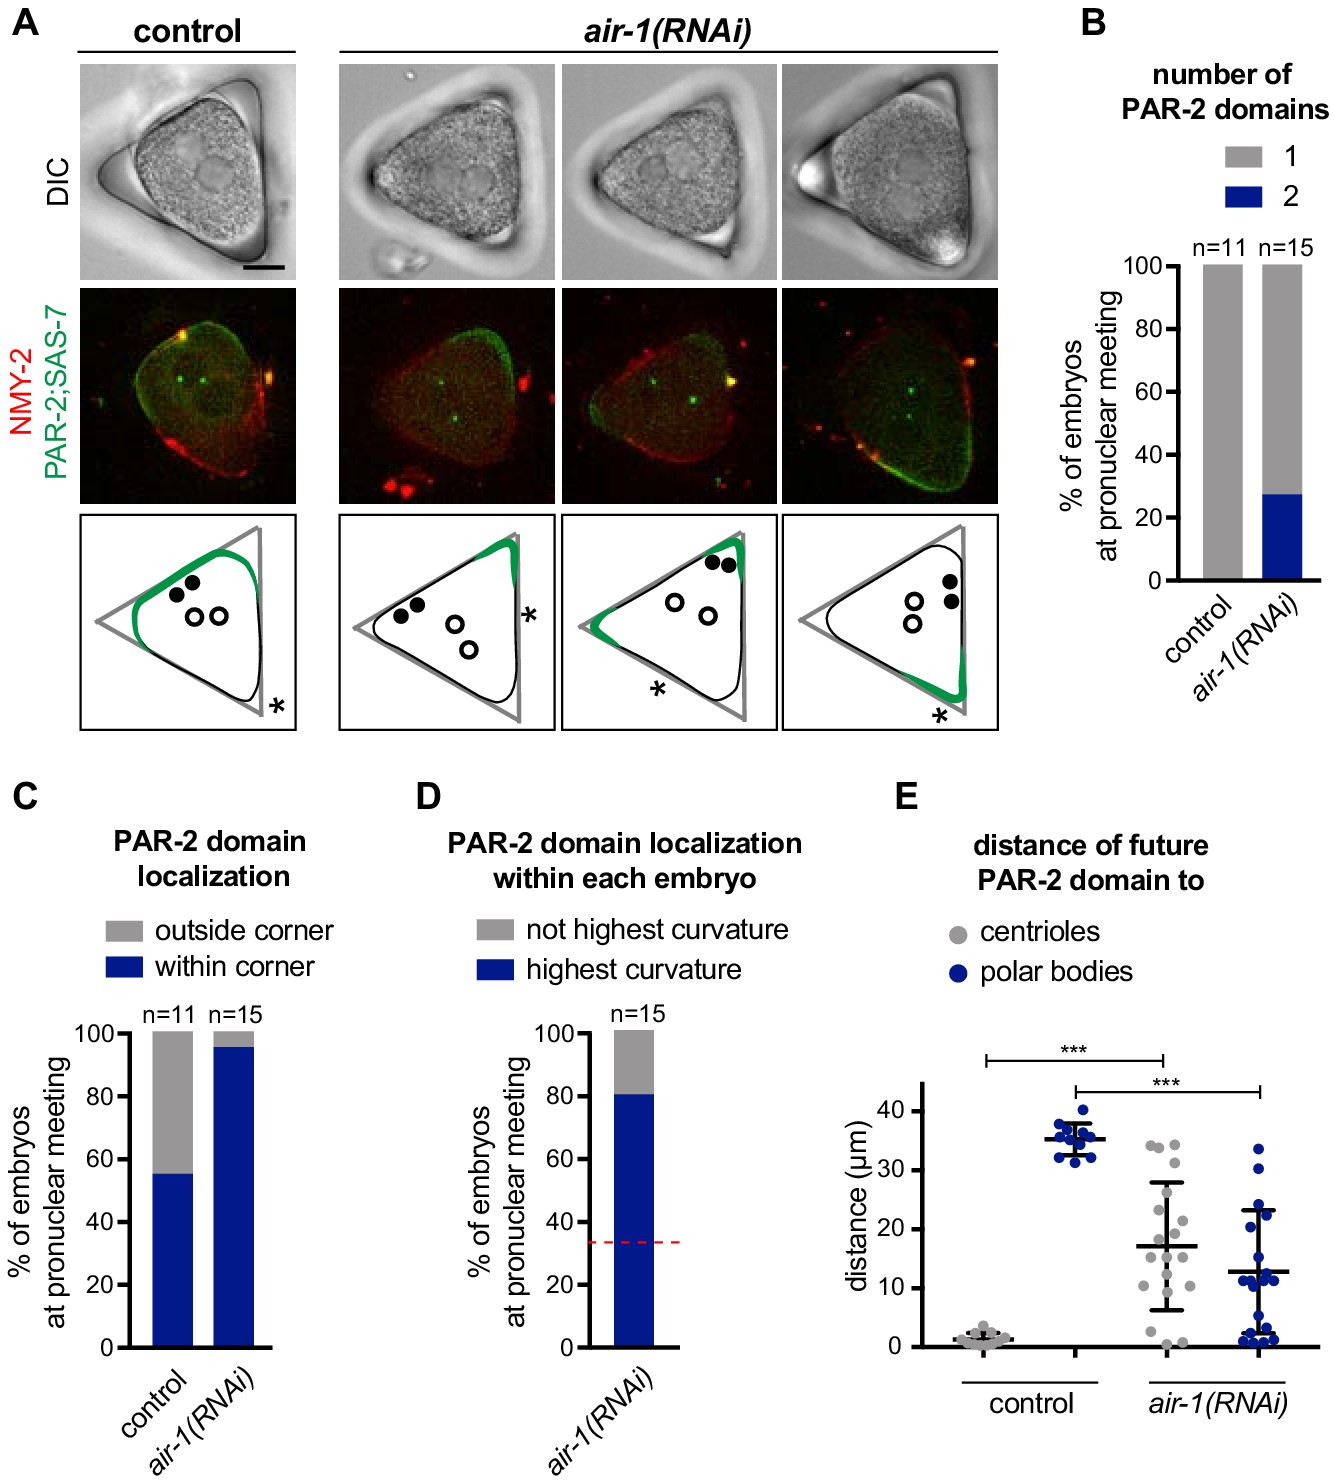
PAR-2 domains form in regions of high membrane curvature.
(A) One control and three air-1(RNAi) embryos expressing RFP::NMY-2 (red), GFP::PAR-2 and GFP::SAS-7 (both green) placed in triangular PDMS chambers ~40 µM in side length. Lower panels illustrate the localization of PAR-2 domains at pronuclear meeting (green), of centrioles (filled discs: before symmetry breaking; empty circles: at pronuclear meeting) and of polar bodies (asterisks, before symmetry breaking). (B–E) GFP::PAR-2 distribution in control and air-1(RNAi) embryos in triangular chambers. (B): number of domains; (C): localization outside (no GFP::PAR-2 within any corner) or within a corner; (D): localization within the corner with the highest curvature or not; red dashed line indicates chance occurrence. The extent of curvature of the embryo per se was scored before symmetry breaking; (E): localization with respect to the position of centrioles and polar bodies before symmetry breaking.
Figure 3—figure supplement 1
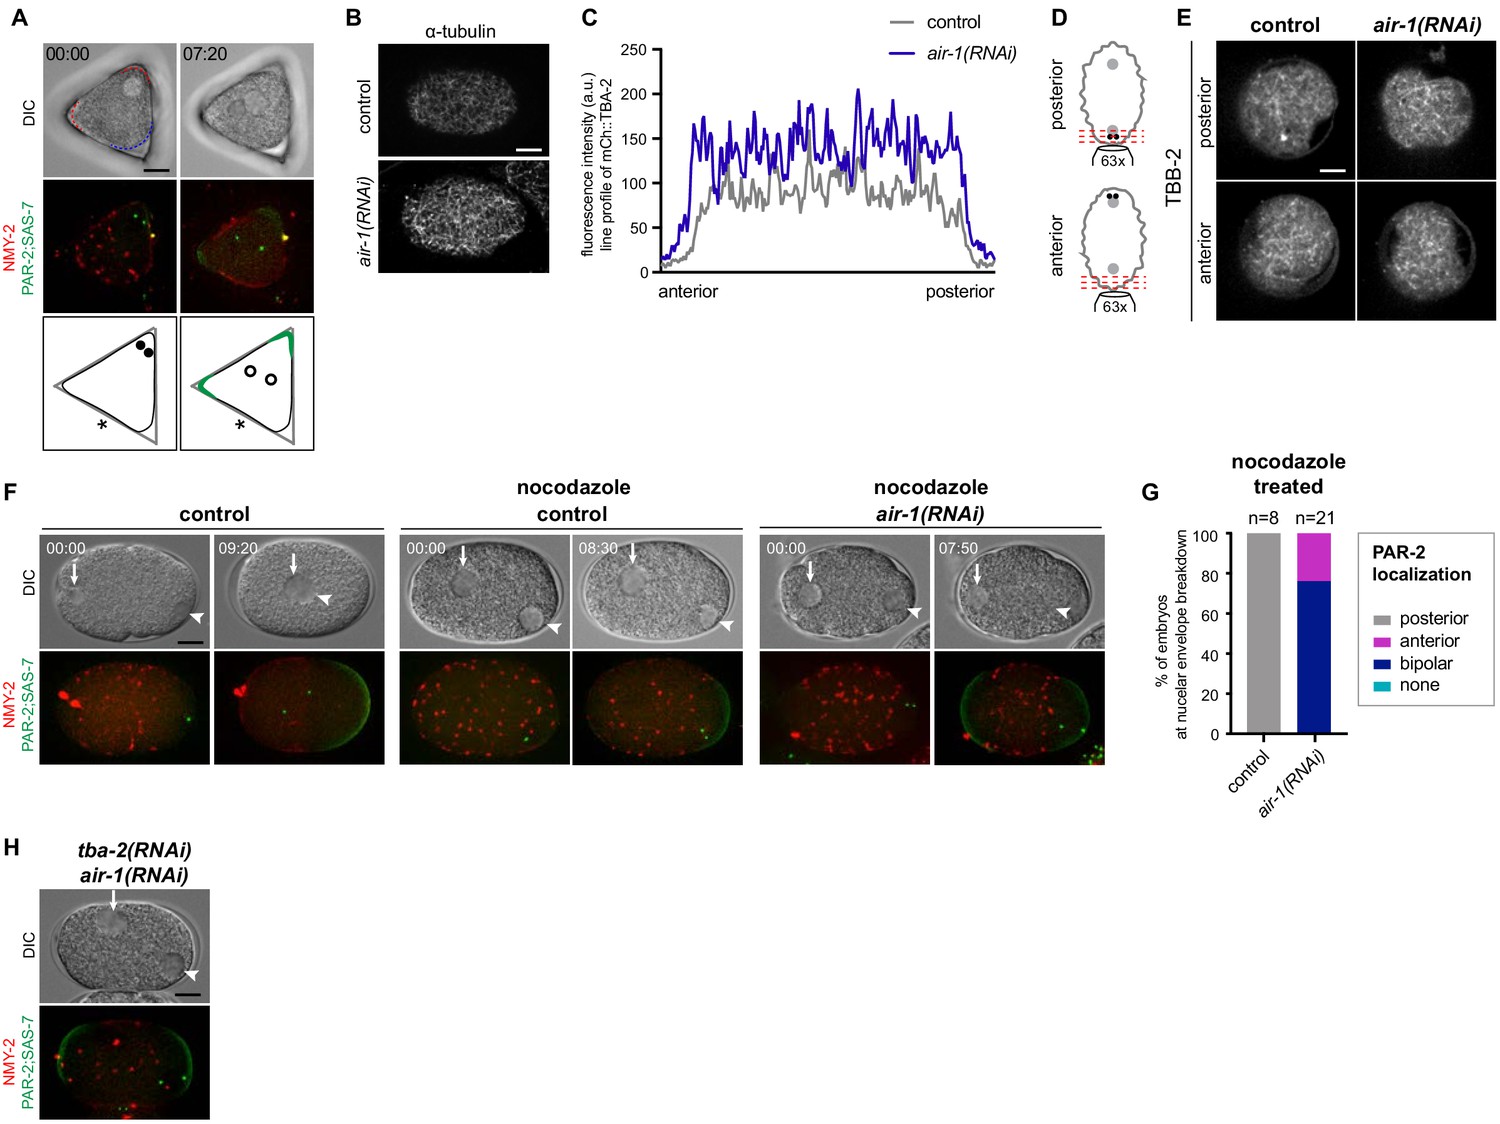
PAR-2 domains form independently of microtubules.
(A) air-1(RNAi) embryo expressing RFP::NMY-2 (red), GFP::PAR-2 and GFP::SAS-7 (both green) placed in triangular PDMS chambers ~40 µM in side length before symmetry breaking (t = 00:00) and at pronuclear meeting (t = 07:20); same specimen as the middle air-1(RNAi) embryo shown in Figure 3A. Red and blue dashed lines indicate the actual curvature of the embryo early on, with red denoting the two corners with highest curvature. Filled black discs indicate the position of the centrosomes before symmetry breaking, empty discs their position at pronuclear meeting, whereas green lines indicate the localization of the PAR-2 domains. Asterisks: position of polar bodies. (B) Wild type and air-1(RNAi) embryos fixed and stained with antibodies against α-tubulin. (C) Line profile showing the fluorescence intensity of the α-tubulin signal in the embryos shown in (B). These line profiles are representative of other control and air-1(RNAi) embryos. N = 14. (D) Schematic illustrating the upright imaging of the anterior or posterior pole of the embryo. (E) Upright imaging as illustrated in (D) of control or air-1(RNAi) embryos expressing GFP::TBA-2. (F) Embryos expressing RFP::NMY-2 (red), as well as GFP::PAR-2 and GFP::SAS-7 (both green) before pronuclear migration (t = 00:00) and prior to nuclear envelope breakdown (second time point). Female pronucleus: arrow; male pronucleus: arrowhead. Control embryo: note migration of pronuclei; control and air-1(RNAi) embryos treated with nocodazole; note larger female pronucleus and lack of pronuclear migration. (G) Quantification of GFP::PAR-2 distribution corresponding to (F). (H) Embryo expressing RFP::NMY-2 (red), as well as GFP::PAR-2 and GFP::SAS-7 (both green) depleted of AIR-1 and TBA-2 using RNAi. N = 3.
Figure 4 with 1 supplement

Physical description of spontaneous symmetry breaking.
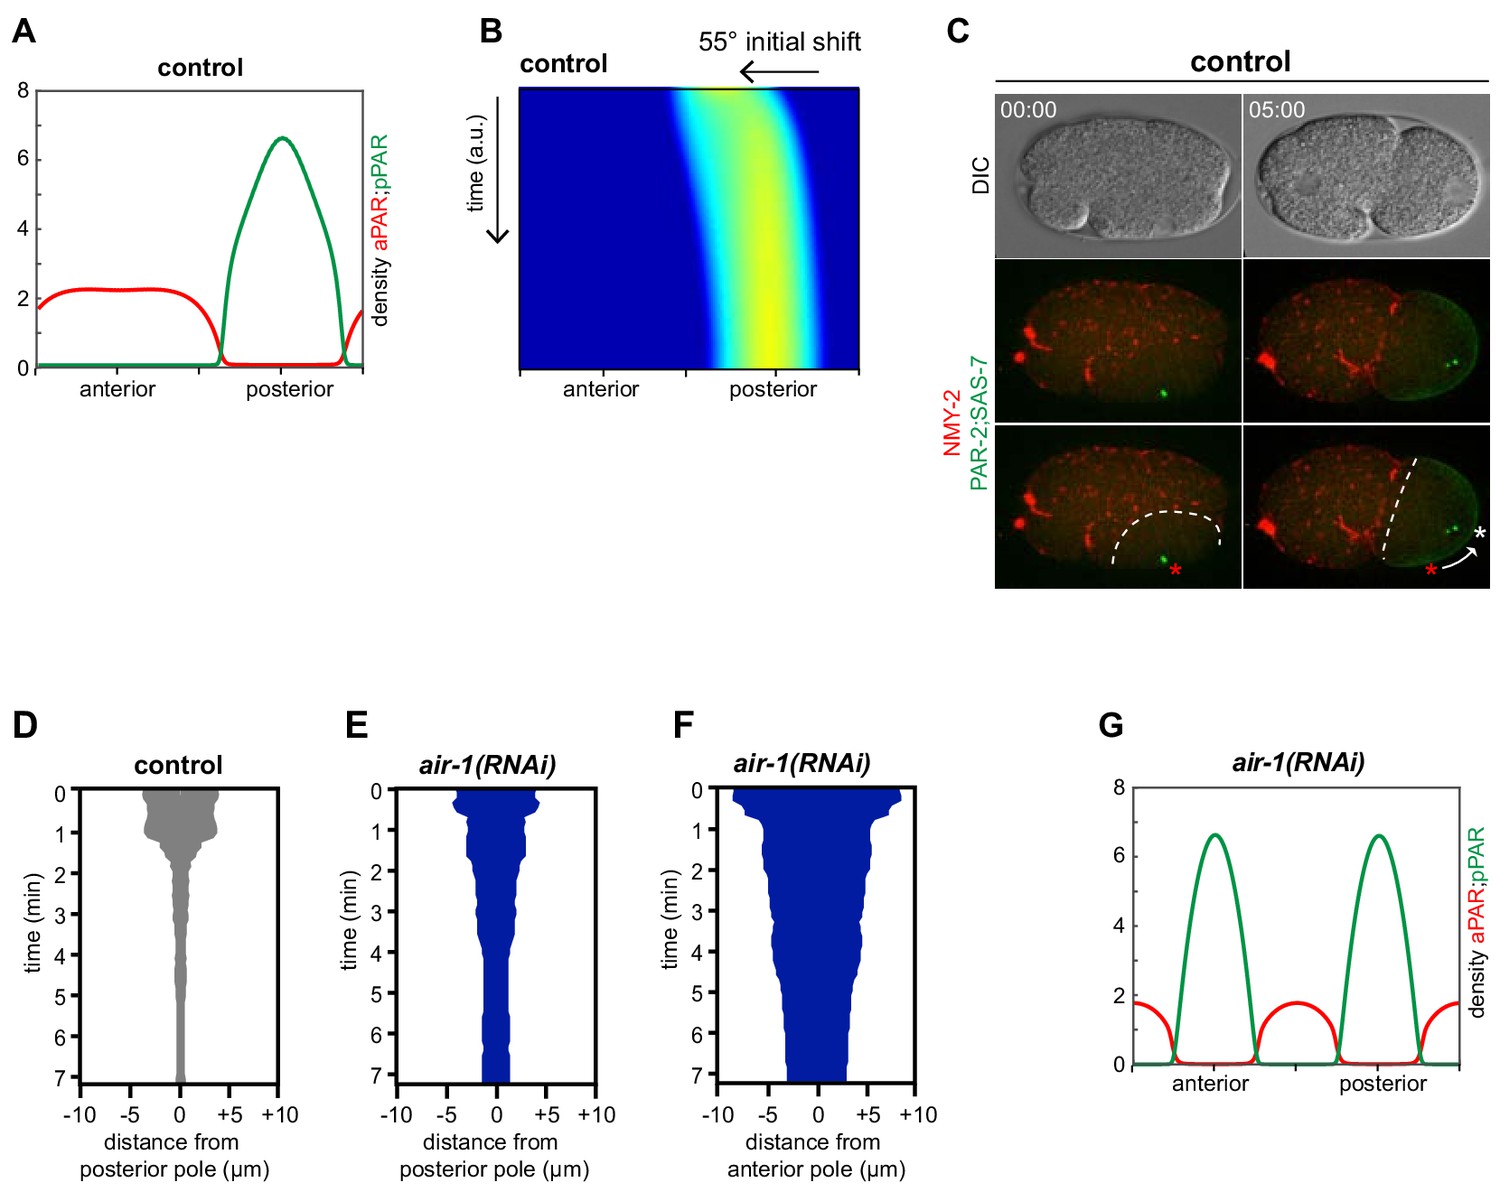
(A) Principal tenets of physical description of spontaneous symmetry breaking mechanism; see Appendix for details. (B, D, F, H) Phase diagrams showing the development of 0, 1 or 2 PAR-2 domains, as indicated, as a function of the preferential PAR-2 attachment rate and the induced decrease of cortical contractility in control (B) or air-1(RNAi) (D) embryos, as well as in control or air-1(RNAi) embryos in triangular chambers (F and H, respectively). (C, E, G, I) Simulation kymographs of PAR-2 distribution corresponding to the juxtaposed phase diagrams. Moderate values for and , away from the extremes, were chosen for the numerical simulation: =1.2 100.
Figure 4—figure supplement 1
Simulations of symmetry breaking and relaxation to the poles.
(A) Numerical simulation of cortical distributions of anterior (red) and posterior (green) PAR proteins distribution dynamics in control embryos. (B) Simulation kymograph of PAR-2 distribution in control embryos, mimicking an experiment in which all densities are shifted 55°C away from the posterior pole after polarity establishment (Mittasch et al., 2018). Note correction of the PAR-2 domain over time towards the posterior pole. Parameters: α/l = 1.2 and β τ⁄(ρP0)=100. (C) Control embryo expressing RFP::NMY-2 (red), as well as GFP::PAR-2 and GFP::SAS-7 (both green) exemplifying a symmetry breaking event away from the posterior pole (t = 00:00), as evidenced by NMY-2 clearing, followed by correction of the PAR-2 domain to the posterior pole (t = 05:00, arrow indicates centrosome trajectory). (D–F) Standard deviation of the distance from the pole (0 on the X axis) to the center of the PAR-2 domain (posterior or anterior, as indicated) over time (t = 0 corresponds to the initiation of the PAR-2 domain) in randomly selected control and air-1(RNAi) embryos (N = 15 each). Note that the offset of the PAR-2 initiation site did not differ in control and air-1(RNAi) embryos on the posterior side, whereas it arose with a larger offset on the anterior side, possibly because of invaginations resulting from the polar body extrusion that give rise to pronounced membrane curvatures. (G) Numerical simulation of cortical distributions of anterior (red) and posterior (green) PAR proteins distribution dynamics in air-1(RNAi) embryos.
Figure 5 with 1 supplement
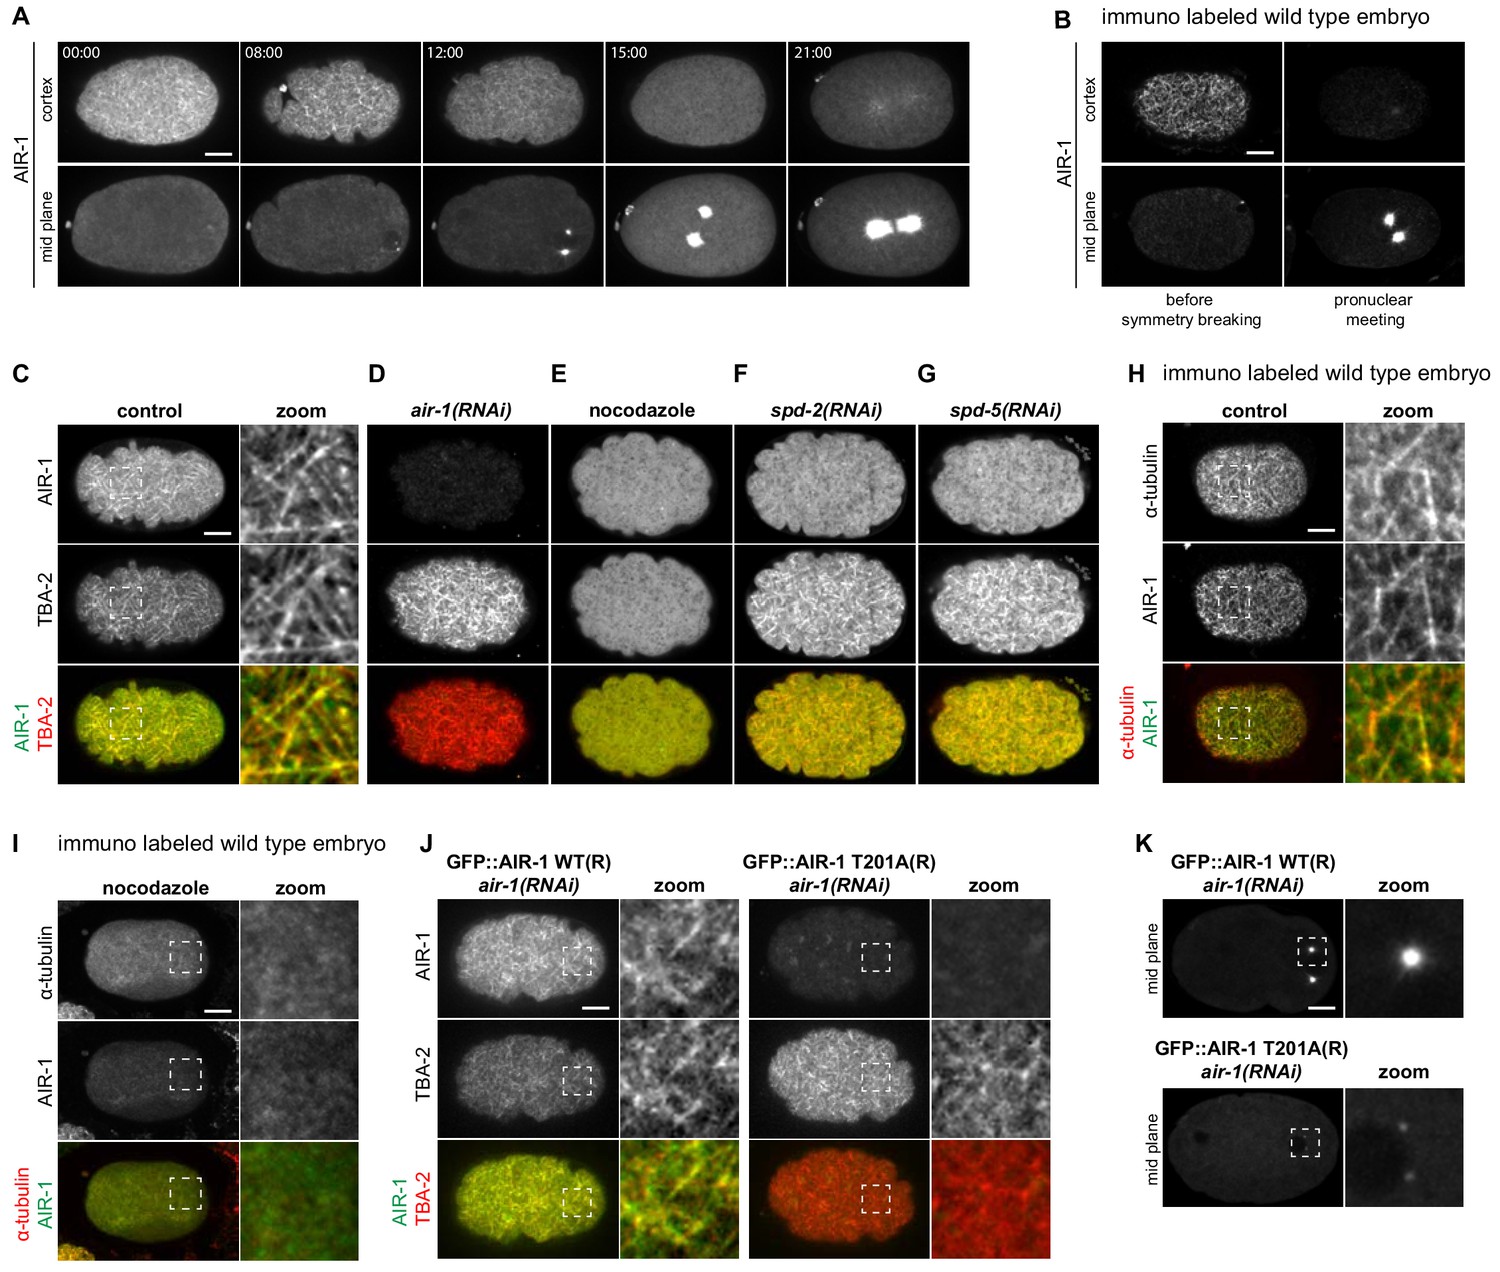
AIR-1 localizes to cortical microtubules.
(A) Time lapse microscopy of an embryo expressing endogenously tagged GFP::AIR-1. Upper panels: maximum z-projection of 1.5 µm of the cortical planes. Lower panels: maximum z-projection of 7.5 µm of the middle planes of the same embryo. A representative embryo out of 9 that were imaged is shown. (B) Wild-type embryos fixed and stained for endogenous AIR-1 before symmetry breaking (left panels) and at pronuclear meeting (right panels). Upper panels: cortical plane; lower panels: middle plane of the same embryo. (C–F) Cortical images of embryos expressing endogenously tagged GFP::AIR-1 (green) and mCh::TBA-2 (red) prior to symmetry breaking; embryos were depleted by RNAi of AIR-1 (D), SPD-2 (F) or SPD-5 (G), or else treated with nocodazole to depolymarize microtubules (E). Depletion of AIR-1 (D), SPD-2 (F) or SPD-5 (G) by RNAi, and depletion of microtubules by nocodazole (E). The zoom highlights co-localization of GFP::AIR-1 with mCh::TBA-2 in the control condition. (H,I) Cortical images of wild-type (H) or nocodazole-treated (I) embryo fixed and stained for α-tubulin and AIR-1. The zoomed regions highlight co-localization of endogenous AIR-1 with microtubules in the control condition. (J) Embryos prior to symmetry breaking expressing GFP::AIR-1 WT or GFP::AIR-1 T201A (RNAi-resistant, denoted R) (green) and mCh::TBA-2 (red) and depleted of endogenous AIR-1 using RNAi. The zoomed regions highlight co-localization of α-tubulin and AIR-1 solely in the case of the wild type transgenic construct. Only the cortical plane is shown. (K) Cortical images of embryos expressing GFP::AIR-1 WT or GFP::AIR-1 T201A (RNAi resistant, denoted R) (green) and mCh::TBA-2 (red) at the onset of pronuclear migration. air-1(RNAi) is directed against endogenous AIR-1. (C–K) Representative images are shown out of >10 embryos analyzed for each condition.
Figure 5—figure supplement 1
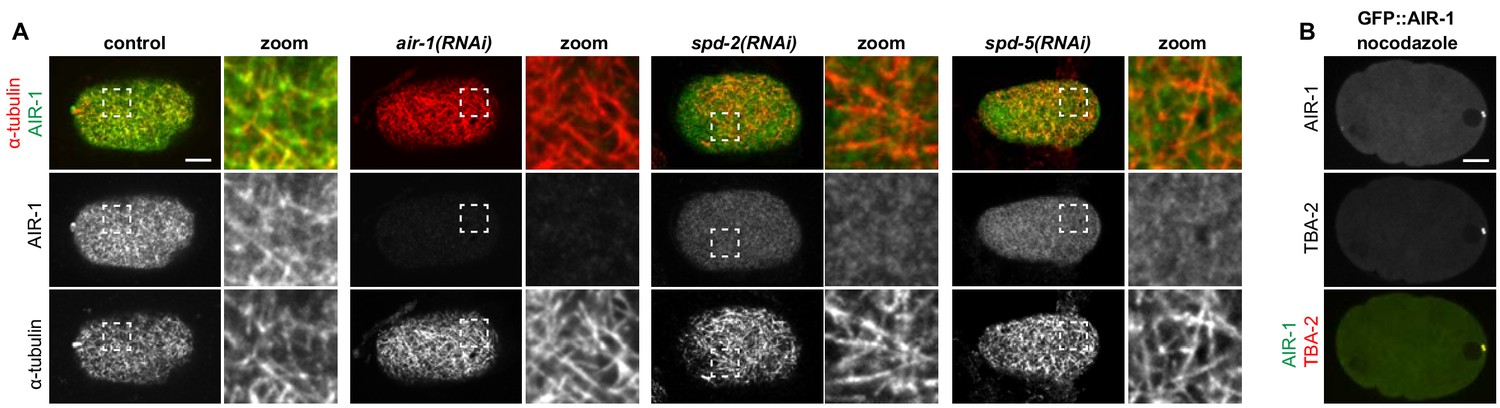
Cortical AIR-1 co-localizes with cortical microtubules.
(A) Wildtype, air-1(RNAi), spd-2(RNAi) or spd-5(RNAi) embryos, as indicated, fixed and stained with antibodies against α-tubulin and AIR-1. The zoomed regions highlight the co-localization of α-tubulin and AIR-1 in the wild-type (top row). Note also that cortical AIR-1 is impaired in spd-2(RNAi) and spd-5(RNAi) embryos; moreover, the cortical microtubule network is increased in air-1(RNAi), spd-2(RNAi) and spd-5(RNAi) embryos. Only the cortical plane is shown. (B) Middle plane of a nocodazole-treated embryo expressing endogenously tagged GFP::AIR-1 (green) and mCh::TBA-2 (red).
Figure 6 with 1 supplement
Cortical AIR-1 can act as a negative regulator of symmetry breaking.
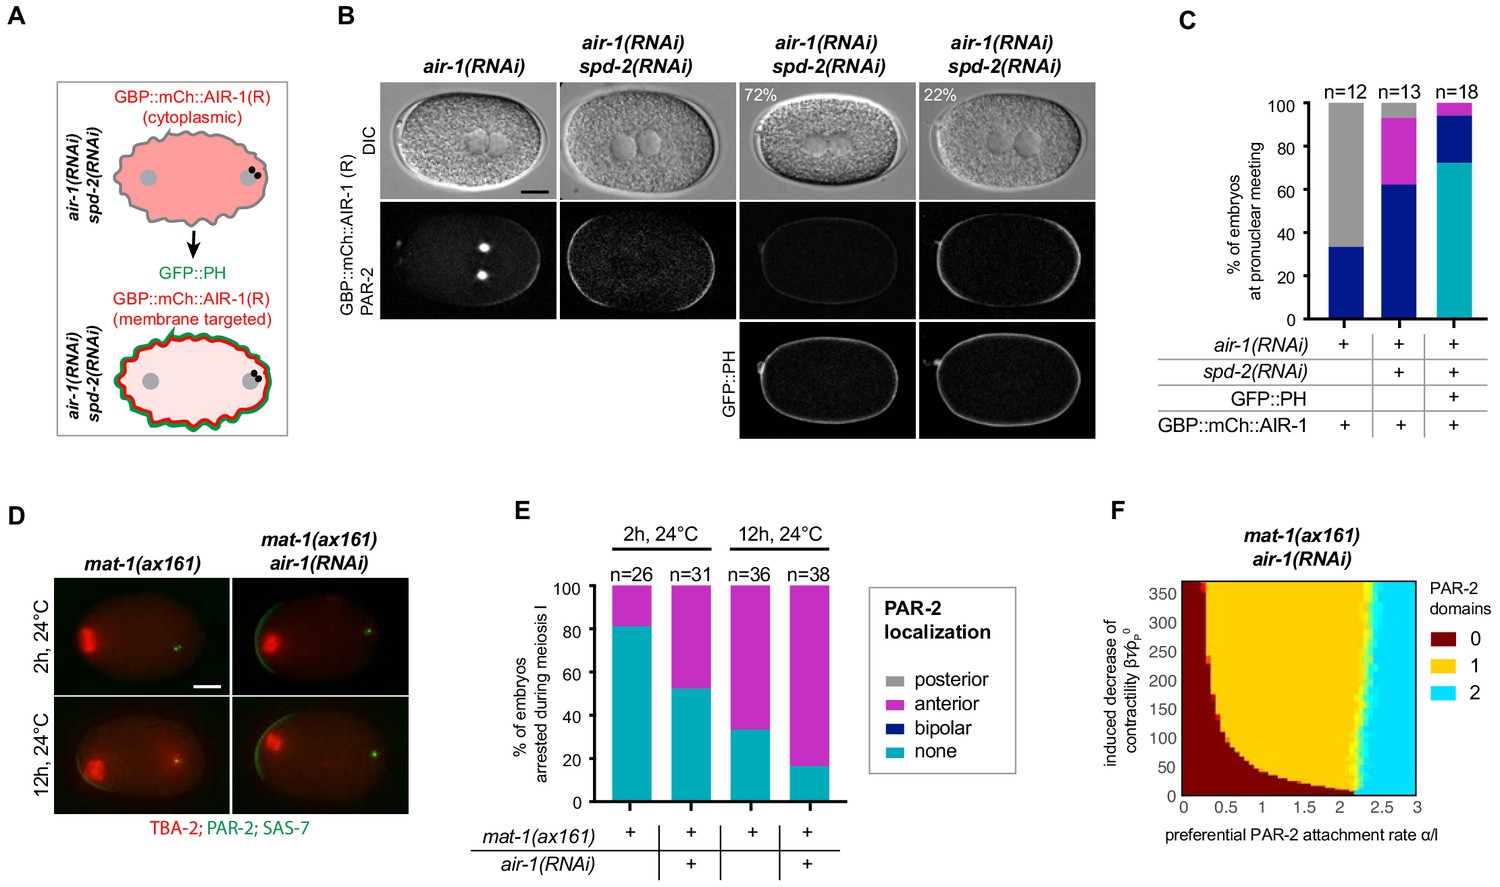
(A) Schematic illustrating the experimental set up to re-localize GBP::mCh::AIR-1 to the plasma membrane through binding to GFP::PH. Note that GBP::mCh::AIR-1(R) is not cortical in embryos depleted of SPD-2. (B) Embryos expressing GBP::mCh::AIR-1(RNAi resistant, denoted R), mCh::PAR-2 and GFP::PH depleted of endogenous AIR-1 and SPD-2. Note that the fluorescent intensity of mCh::PAR-2 is much stronger than that of membrane-targeted GBP::mCh::AIR-1(R), allowing us to unambiguously score polarity using the mCh::PAR-2 signal. (C) Quantification of mCh::PAR-2 distributions corresponding to (B). (D) mat-1(ax161) control and mat-1(ax161) air-1(RNAi) embryos expressing GFP::TBA-2 (red), mCh::PAR-2 and RFP::SAS-7 (both green) shifted to the restrictive temperature (24°C) for 2 hr or 12 hr to block them in metaphase of meiosis I. (E) Quantification of mCh::PAR-2 distributions corresponding to (D). (F) Phase diagram stemming from the physical description and showing the development of 0, 1 or 2 PAR-2 domains, as indicated, as a function of the preferential PAR-2 attachment rate and the induced decrease of cortical contractility in mat-1(ax161) air-1(RNAi) embryos.
Figure 6—figure supplement 1
Cortical AIR-1 can negatively regulate symmetry breaking.
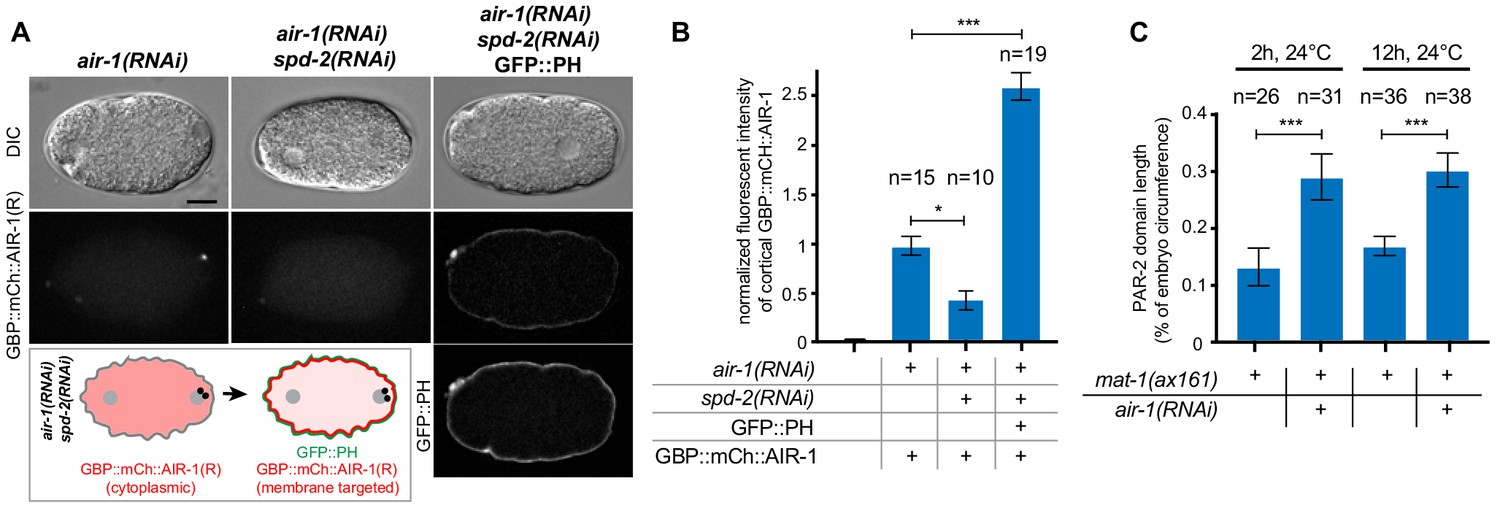
(A) Embryos expressing GBP::mCh::AIR-1 (RNAi resistant, denoted R) depleted of endogenous AIR-1 alone (left panel) or in combination with SPD-2 (middle panel). Right panel: embryo depleted of endogenous AIR-1 and SPD-2 expressing GBP::mCh::AIR-1 together with GFP::PH to target GBP::mCh::AIR-1(R) to the plasma membrane. Note increased cortical GBP::mCh::AIR-1(R) signal when GFP::PH is co-expressed.(B) Quantification of cortical GBP::mCh::AIR-1(R) levels corresponding to A. *p<0.05; ***p<0.001; Mann-Whitney-U test. Error bars = SD. (C) Quantification of PAR-2 domain length in mat-1(ax161) control and mat-1(ax161) air-1(RNAi) embryos expressing GFP::TBA-2, mCh::PAR-2 and RFP::SAS-7 shifted to the restrictive temperature (24°C) for 2 hr or 12 hr to block them in metaphase of meiosis I, corresponding to Figure 6E. Embryos without cortical mCh::PAR-2 were not considered in the analysis. ***p<0.001; Mann-Whitney-U test. Error bars = SD.
Figure 7 with 1 supplement
Centrosomes ensure uniqueness of symmetry breaking in C.elegans zygotes.
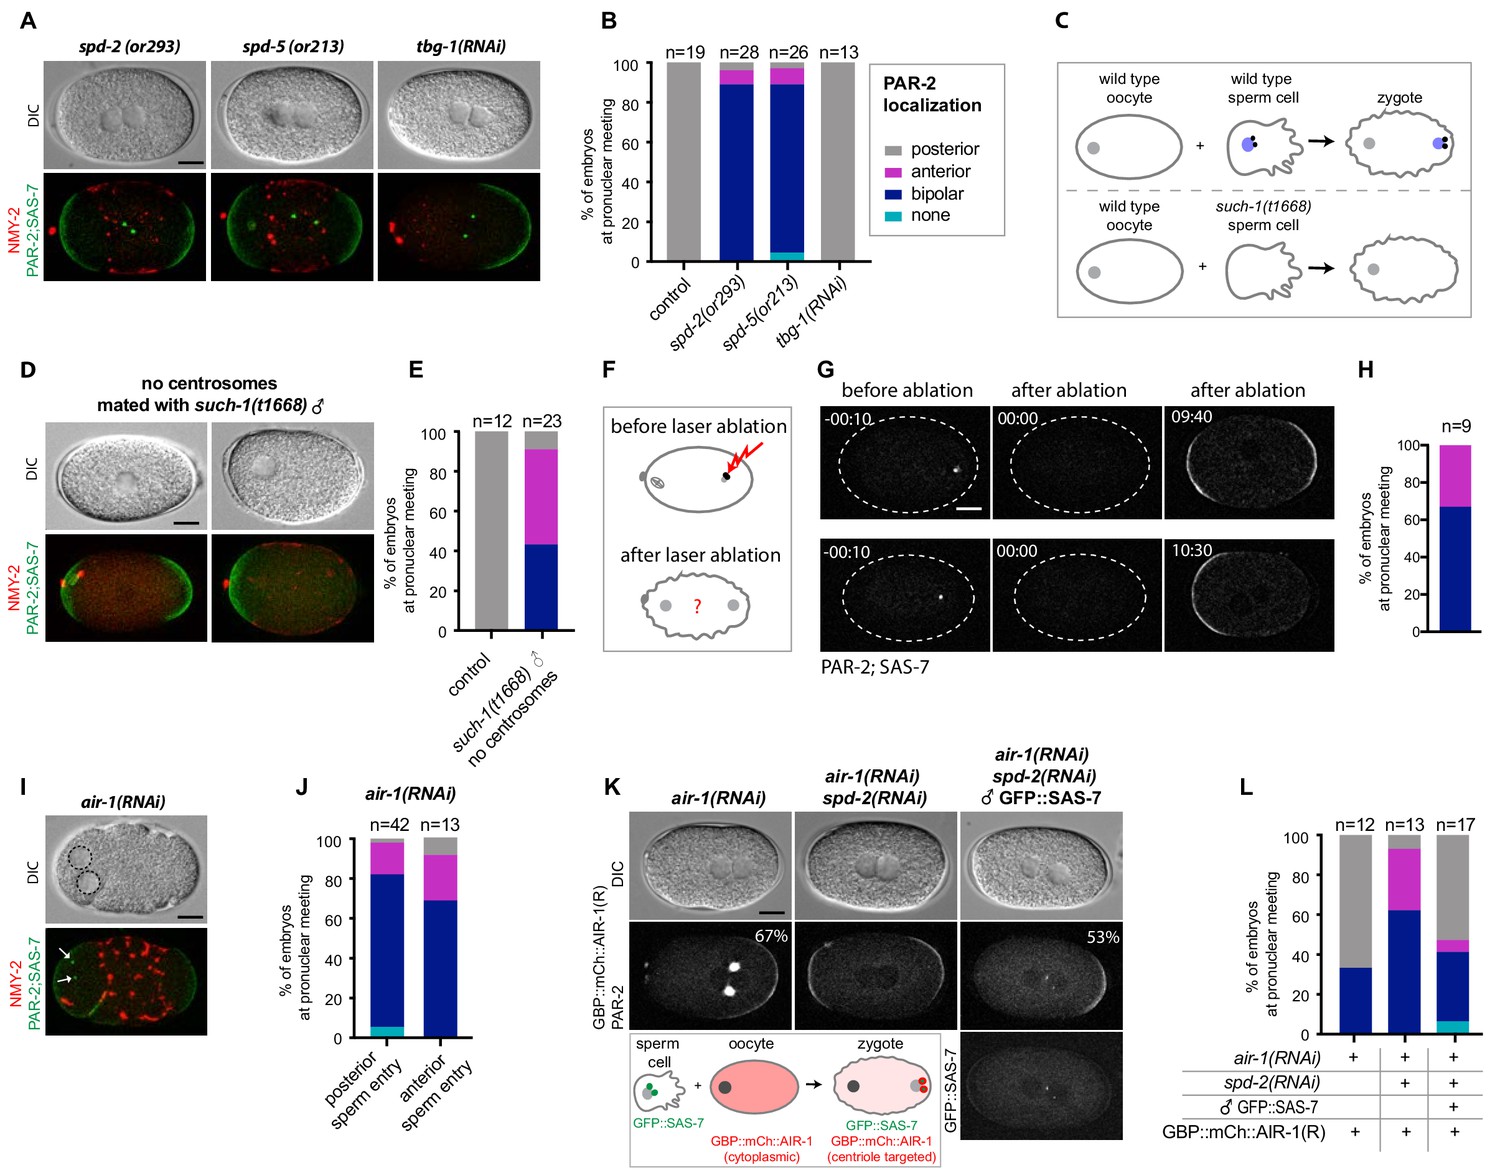
(A) spd-2(or293), spd-5(or213) or tbg-1(RNAi) embryos, as indicated, expressing RFP::NMY-2 (red), GFP::PAR-2 and GFP::SAS-7 (both green). Upper panels: DIC, lower panels: grey scale. (B) Quantification of GFP::PAR-2 distributions corresponding to (A). (C) Schematic showing experimental set up for (D) and (E). (D) fem-1(hc17) hermaphrodites expressing RFP::NMY-2 (red), GFP::PAR-2 and GFP::SAS-7 (both green) mated with such-1(t1668) males. Note lack of male pronucleus and of centriolar GFP::SAS-7. (E) Quantification of GFP::PAR-2 distributions corresponding to (D). (F) Schematic illustrating the experimental set-up of the centrosome laser ablation experiments. (G) Two embryos expressing GFP::PAR-2 and GFP::SAS-7 prior to laser ablation (t=-00:10), immediately after laser ablation of the centrosome (t = 00:00) and at pronuclear meeting (t = 09:40 and t = 10:30). (H) Quantification of GFP::PAR-2 distributions corresponding to (G). (I) air-1(RNAi) embryo expressing RFP::NMY-2 (red), GFP::PAR-2 and GFP::SAS-7 (both green) with sperm entry next to the maternal pronucleus. Dotted lines: pronuclei; arrows: centrosomes. (J) Quantification of GFP::PAR-2 distributions in air-1(RNAi) embryos with sperm entry next to maternal pronucleus ("anterior") or opposite from it ("posterior"). (K) Embryos expressing GBP::mCh::AIR-1 (RNAi-resistant, denoted R) and mCh::PAR-2, depleted of endogenous AIR-1 either alone (left panel) or together with SPD-2 (middle panel). Right panel: hermaphrodites depleted of endogenous AIR-1 and SPD-2 were mated with GFP::SAS-7 males; see schematic for a description of the experimental set up. Note that GBP::mCh::AIR-1(R) is not cortical in embryos depleted of SPD-2. (L) Quantification of mCh::PAR-2 distributions corresponding to (K).
Figure 7—figure supplement 1
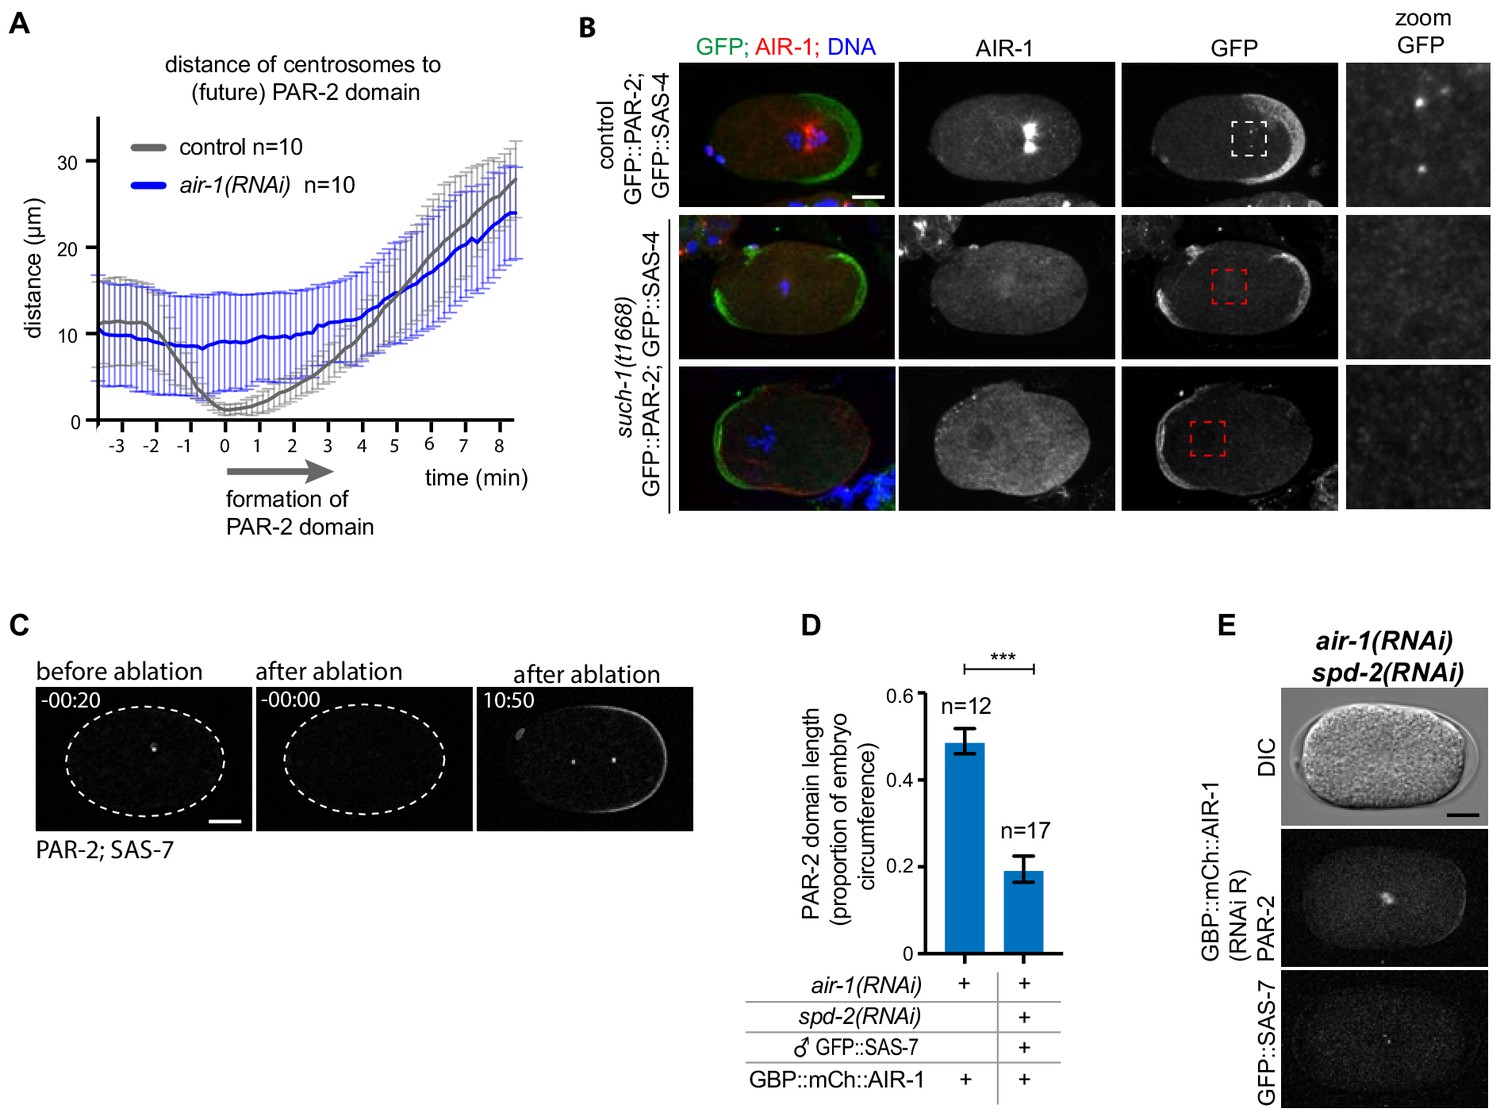
Embryos break symmetry in the absence of centrosomes.
(A) Distance of centrosomes to the PAR-2 initiation site in control and air-1(RNAi) embryos. N = 10 in each case. (B) Control or such-1(t1668) embryos expressing GFP::PAR-2 and GFP::SAS-7 fixed and stained with antibodies against AIR-1(red) and GFP (green). The zoom shows the centrioles in control embryos and their absence in a region where we would expect to find them in such-1(t1668) embryos. Note that the entire embryo was screened for centrioles. (C) Control embryo in which centrosome ablation was not successful; the centrosomal GFP::SAS-7 signal was only bleached and recovered thereafter in a focal manner, indicating that centrioles were spared. (D) Length of the posterior GFP::PAR-2 domain in embryos expressing GBP::mCh::AIR-1(RNAi -resistant), with depletion of endogenous AIR-1 alone or together with SPD-2, followed by mating with GFP::SAS-7 expressing males. ***p<0.001; Mann-Whitney-U test. Error bars = SD. (E) air-1(RNAi) spd-2(RNAi) embryo at the time of spindle formation expressing GBP::mCh::AIR-1 and mCh::PAR-2. Hermaphrodites were mated with males expressing GFP::SAS-7. Note defective spindle assembly.
Figure 8

Working model of AIR-1 function during symmetry breakingin the wild type (A–C) and the bipolar phenotype in air-1(RNAi) embryos (D–F).
(A) Prior to symmetry breaking in the wild type, AIR-1 localizes on the cell cortex and in the cytoplasm. (B,C) As the cell cycle progresses, AIR-1 is recruited onto centrosomes by SPD-2 and SPD-5, leading to AIR-1-mediated symmetry breaking in the vicinity. (C) Symmetry breaking is evidenced by the local recruitment of PAR-2 onto the plasma membrane and by anterior-directed cortical flows. (D,E) Upon air-1(RNAi), symmetry is broken spontaneously at the two poles of the zygote, since AIR-1 can neither prevent spontaneous polarization early in the cell cycle nor promote a single symmetry breaking event later in the cell cycle. (F) Curvature-dependent PAR-2 membrane attachment increases the dissociation of NMY-2, thus creating a feedback loop that induces weak cortical flows toward the center from either side, which drives the recruitment of more PAR-2 and the segregation of anterior and posterior PAR proteins. See text for further information.
Videos
Video 1
Control embryo expressing RFP::NMY-2 (red); GFP::PAR-2 and GFP::SAS-7 (both green).
Left: DIC, right: merge.
Video 2
air-1(RNAi) embryo expressing RFP::NMY-2 (red); GFP::PAR-2 and GFP::SAS-7 (both green).
Left: DIC, right: merge.
Video 3
Control embryo placed in a triangular chamber expressing RFP::NMY-2 (red); GFP::PAR-2 and GFP::SAS-7 (both green).
Left: DIC, right: merge of fluorescent signals.
Video 4
air-1(RNAi) embryo placed in a triangular chamber expressing RFP::NMY-2 (red); GFP::PAR-2 and GFP::SAS-7 (both green).
Left: DIC, right: merge of fluorescent signals.
Video 5
Another example of an air-1(RNAi) embryo placed in a triangular chamber expressing RFP::NMY-2 (red); GFP::PAR-2 and GFP::SAS-7 (both green).
Left: DIC, right: merge of fluorescent signals.
Video 6
Density of anterior and posterior PAR proteins (aPAR, pPAR) over time from solving the dynamical Equations (1-3) in a control embryo.
https://doi.org/10.7554/eLife.44552.016
Video 7
Density of anterior and posterior PAR proteins (aPAR, pPAR) over time from solving the dynamical Equations (1-3) in a air-1(RNAi) embryo.
https://doi.org/10.7554/eLife.44552.017
Video 8
Embryo expressing GFP::PAR-2 and GFP::SAS-7 that underwent successful laser ablation of the centrosome.
https://doi.org/10.7554/eLife.44552.024
Video 9
Embryo expressing GFP::PAR-2 and GFP::SAS-7 that underwent unsuccessful laser ablation of the centrosome.
https://doi.org/10.7554/eLife.44552.025Additional files
-
Supplementary file 1
List of worm strains.
- https://doi.org/10.7554/eLife.44552.027
-
Supplementary file 2
Statistical analysis of all bar graphs.
- https://doi.org/10.7554/eLife.44552.028
-
Transparent reporting form
- https://doi.org/10.7554/eLife.44552.029
Download links
A two-part list of links to download the article, or parts of the article, in various formats.
Downloads (link to download the article as PDF)
Open citations (links to open the citations from this article in various online reference manager services)
Cite this article (links to download the citations from this article in formats compatible with various reference manager tools)
Aurora A depletion reveals centrosome-independent polarization mechanism in Caenorhabditis elegans
eLife 8:e44552.
https://doi.org/10.7554/eLife.44552


