Arp2/3 complex-driven spatial patterning of the BCR enhances immune synapse formation, BCR signaling and B cell activation
- University of British Columbia, Canada
- National Heart, Lung and Blood Institute, National Institutes of Health, United States
- BC Children’s Hospital Research Institute, Canada
Figures
Figure 1 with 1 supplement
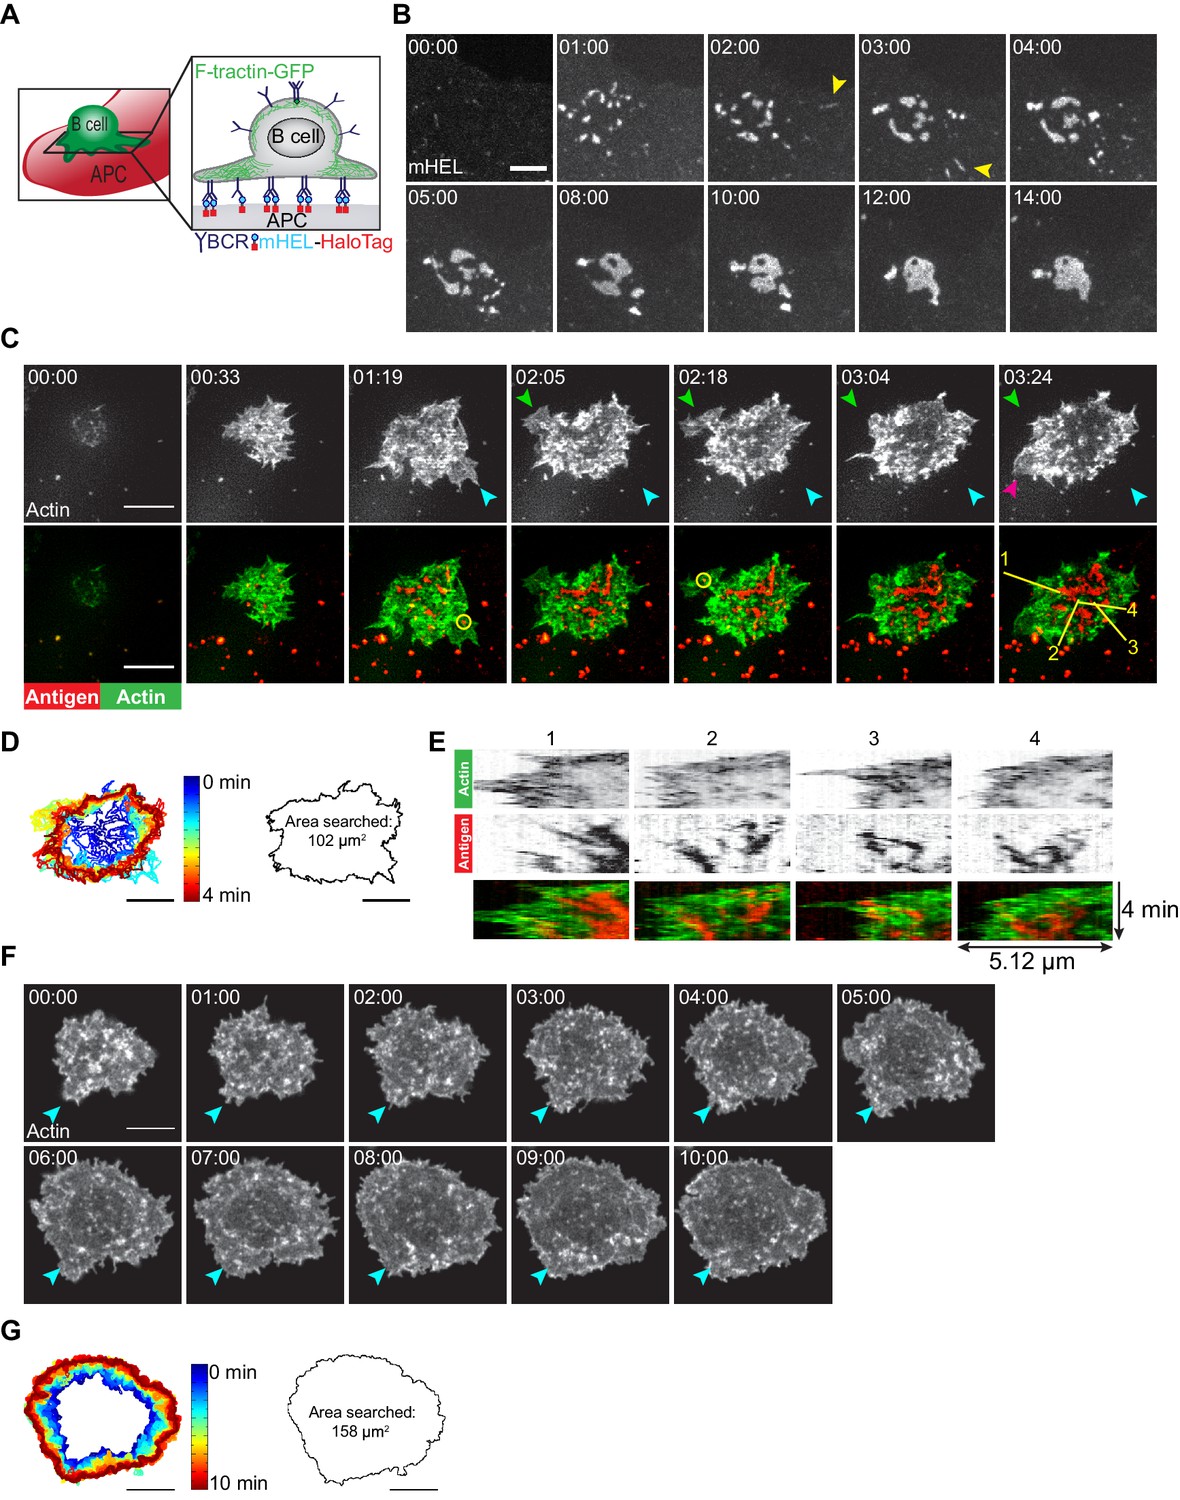
B cells generate dynamic actin-based probing protrusions in response to APC-bound Ags.
(A) Schematic of the B cell-APC system. COS-7 cells expressing mHEL-HaloTag Ag act as APCs for B cells expressing HEL-specific BCRs. (B) A20 D1.3 B cells were added to COS-7 cells expressing mHEL-HaloTag and the B cell-APC contact site was imaged every 12 s for 14 min using spinning disk microscopy. Images from Video 1 are shown. Yellow arrowheads indicate BCR-Ag microclusters that formed far from the center of the contact site. The data are representative of >40 cells from nine independent experiments. Times are shown in min:s. (C) A20 D1.3 B cells expressing F-Tractin-GFP (green) were added to COS-7 APCs expressing mHEL-HaloTag (red) and the B cell-APC contact site was imaged every 6.6 s for 4 min using ISIM. Images from Video 2 are shown. The different colored arrowheads in the upper panels (actin channel) represent membrane protrusions that were extended or retracted. The yellow circles in the lower panels indicate BCR-Ag microclusters (red) that were formed on new actin protrusions. (D) For each frame of Video 2, the cell edge, as defined by F-actin, was overlaid as a temporally-coded time series (left). The total area searched by the B cell over the 4-min period of observation is shown on the right. (E) Kymographs showing the time evolution of fluorescence signals along the yellow lines in the lower right panel of (C) depict the centripetal movement of Ag clusters and the surrounding actin structures. The velocity of a particle is proportional to the angle at which its track deviates from a vertical line along the time axis. See Figure 1—figure supplement 1 for additional explanation of kymograph analysis. (F) A20 B cells expressing F-Tractin-GFP were added to anti-IgG-coated coverslips and the contact site was imaged every 2 s for 10 min using a Zeiss Airyscan microscope. Images from Video 3 are shown. Blue arrowheads represent a long-lived membrane protrusion. (G) A temporally coded time series representing the edge of the cell (left) was generated from Video 3 and the total area searched by the B cell over the 10 min period of observation is shown (right). Scale bars: 5 µm.
Figure 1—figure supplement 1
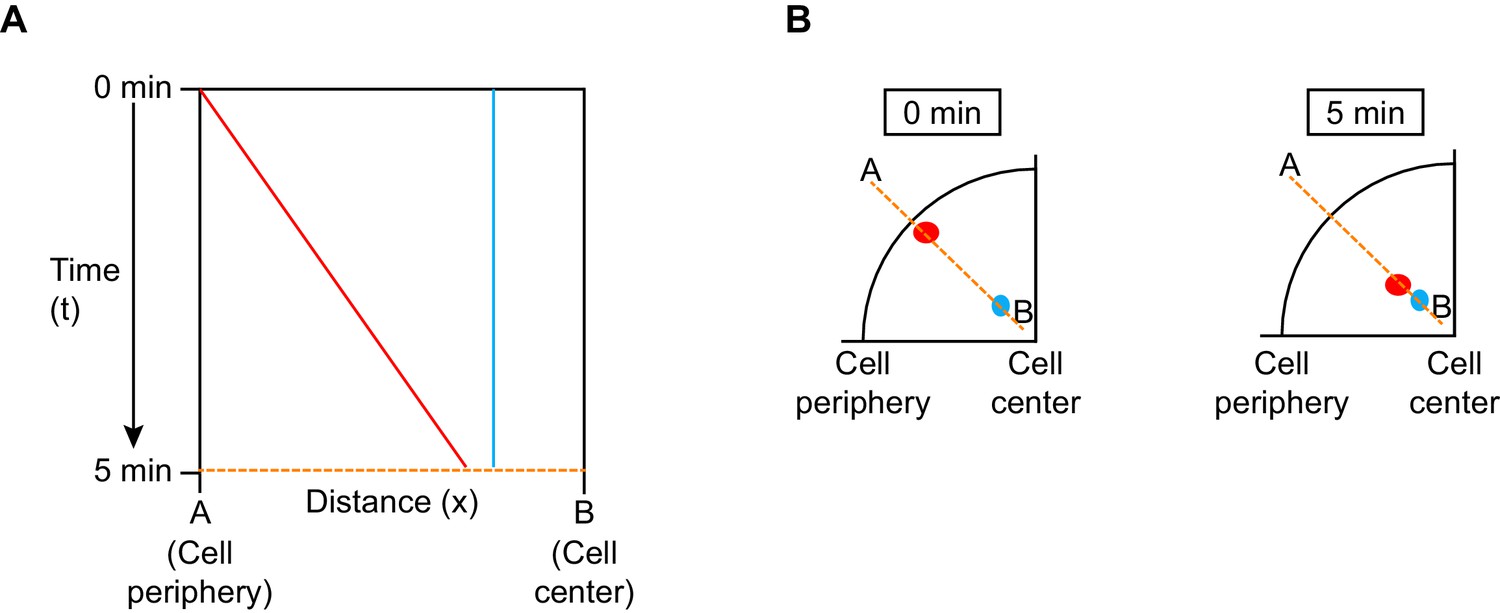
Schematic of kymograph analysis.
(A) Kymographs are 2-D space-time plots. The vertical axis represents time and the horizontal axis represents distance along a line that is fixed in space. The graph shows the time-dependent evolution of the fluorescence intensities for each pixel along the dotted line. Objects that are static, such as the blue dot in (B), yield vertical lines on the kymograph as their locations on the line (orange dashed lines in (A) and (B)) do not change over time. Mobile objects, such as the red dot in (B), yield lines that deviate from the horizontal, with dx/dt being proportional to the object’s velocity. Faster motion is indicated by lines with larger deviation from the vertical.
Figure 2 with 5 supplements
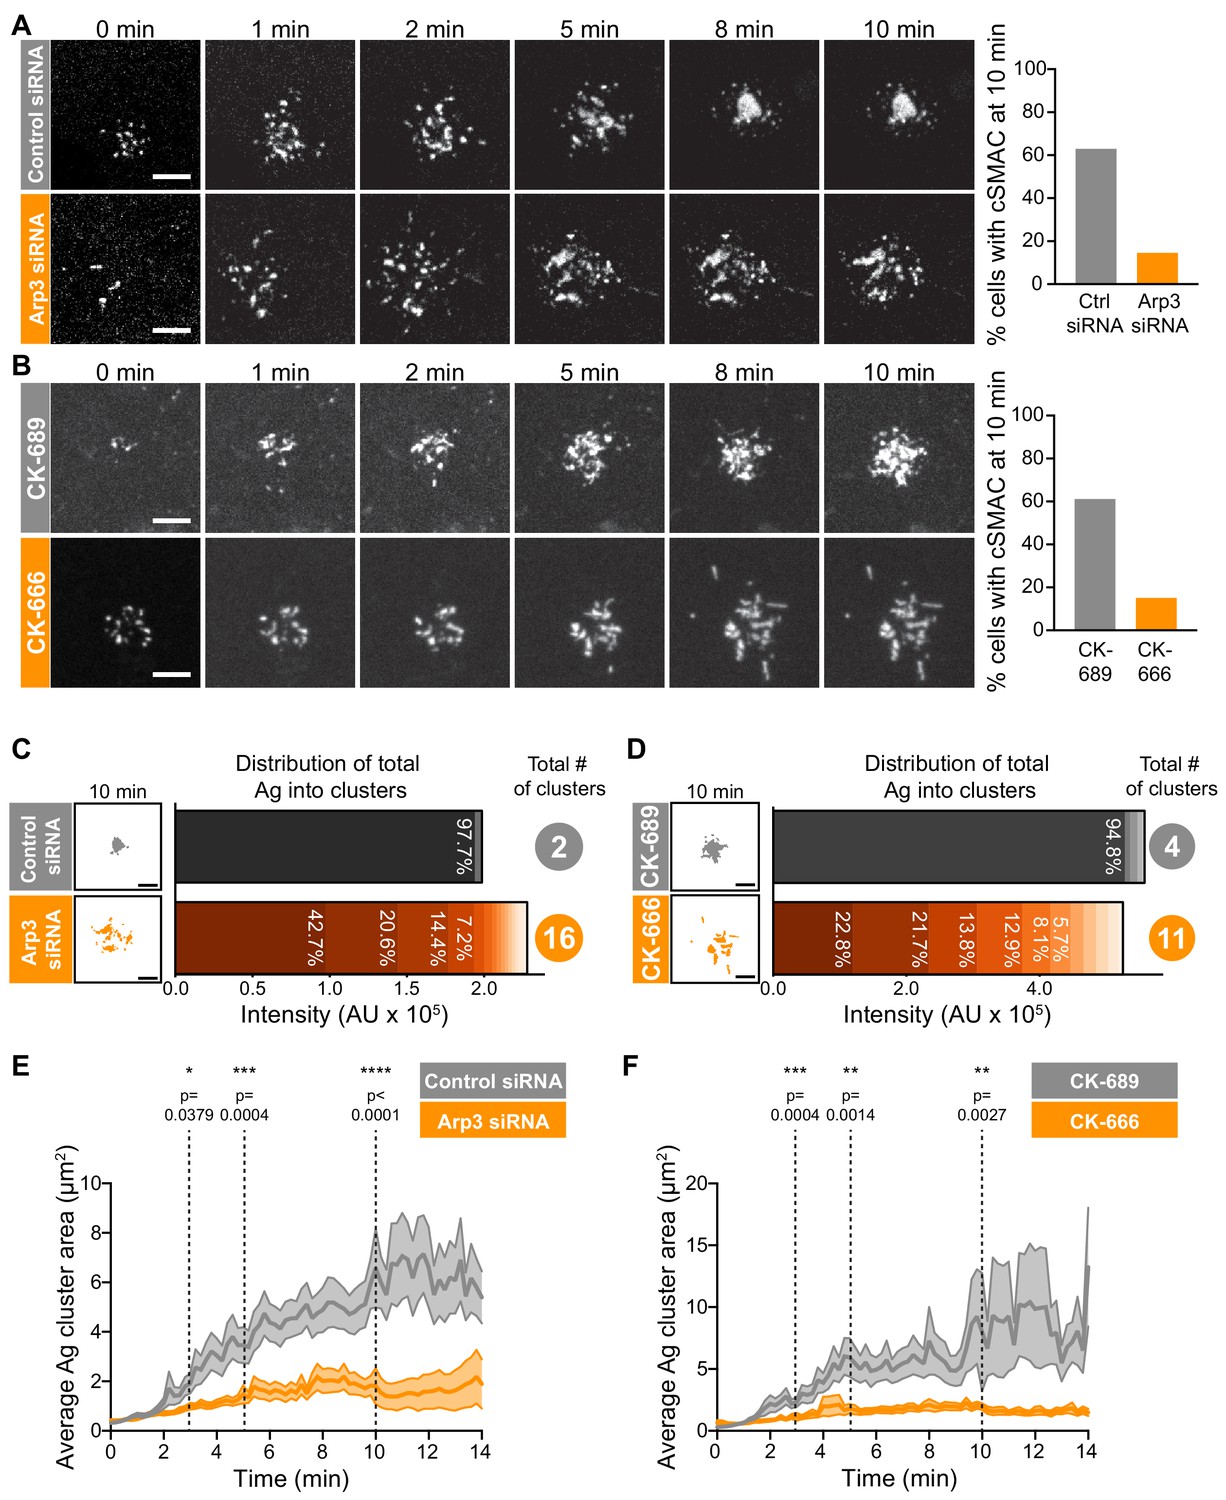
Arp2/3 complex function is important for centralization of BCR-Ag microclusters.
(A,B) A20 D1.3 B cells were transfected with control siRNA or Arp3 siRNA (A) or pre-treated for 1 hr with 100 μM of either the control compound CK-689 or the Arp2/3 complex inhibitor CK-666 (B). The cells were then added to mHEL-GFP-expressing COS-7 APCs and the B cell-APC contact site was imaged every 12 s for 10 min by spinning disk microscopy. Images are from Video 4 (Control siRNA) and Video 5 (Arp3 siRNA) or Video 6 (CK-689) and Video 7 (CK-666). The percent of cells for which >90% of the total Ag fluorescence intensity was contained in one or two clusters is graphed. n > 35 cells from four independent experiments combined (A); n > 18 cells from three independent experiments combined (B). (C,D) For the control siRNA- and Arp3 siRNA-transfected cells in (A), or the CK-689- and CK-666-treated cells in (B), binary representations of the Ag clusters present after 10 min of APC contact are shown. The graphs depict the percent of the total Ag fluorescence intensity, in arbitrary units (AU), present in individual clusters. The numbers to the right are the total number of Ag clusters at 10 min. (E,F) Control siRNA- and Arp3 siRNA-transfected A20 D1.3 B cells (E) or CK-689- and CK-666-treated A20 D1.3 B cells (F), were added to mHEL-GFP-expressing COS-7 APCs and imaged every 12 s for 14 min by spinning disk microscopy. For each B cell, the average size of the BCR-Ag microclusters was determined for every frame in the video. The data are plotted as the mean (line) ± SEM (shaded area). In (E), n = 35 cells (control) or 48 cells (Arp3 siRNA) from four experiments. In (F), n = 18 cells (CK-689) or 20 cells (CK-666) from three experiments. The Mann-Whitney U test was used to calculate p values. ****p<0.0001; ***p<0.001; **p<0.01; *p<0.05. Scale bars: 5 µm.
Figure 2—figure supplement 1
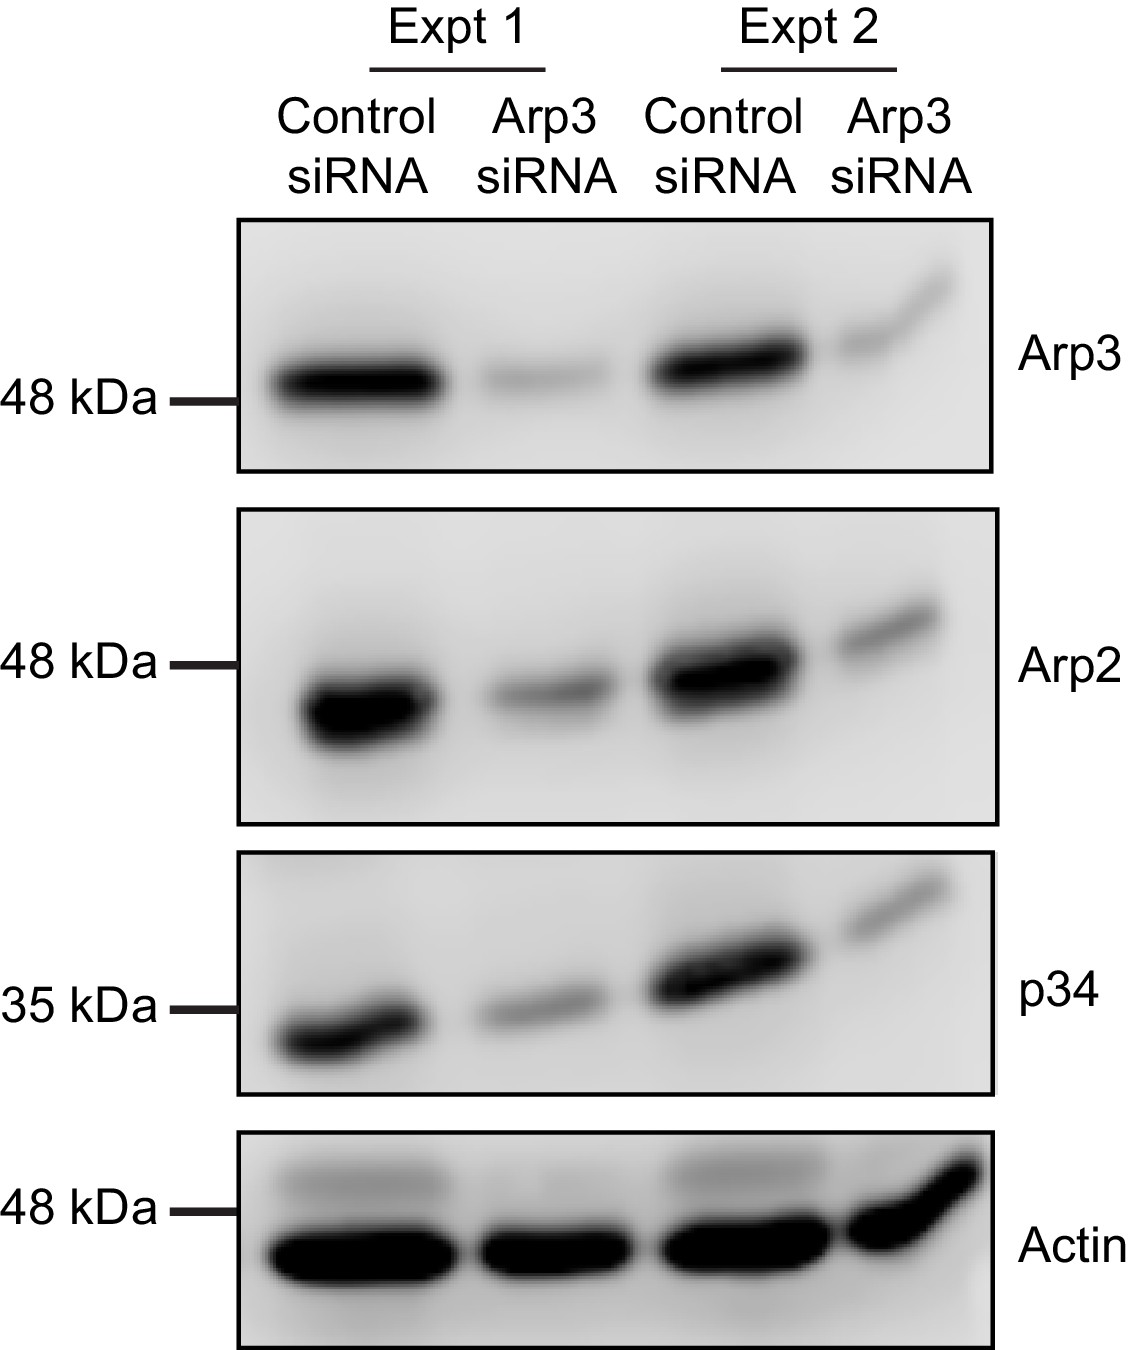
siRNA-mediated knockdown of Arp3 in A20 B cells.
The cells were transfected with control siRNA or Arp3 siRNA. Cell extracts were analyzed by immunoblotting for the Arp3, Arp2, and p34 components of the Arp 2/3 complex, and for actin. Results from two independent experiments are shown.
Figure 2—figure supplement 2
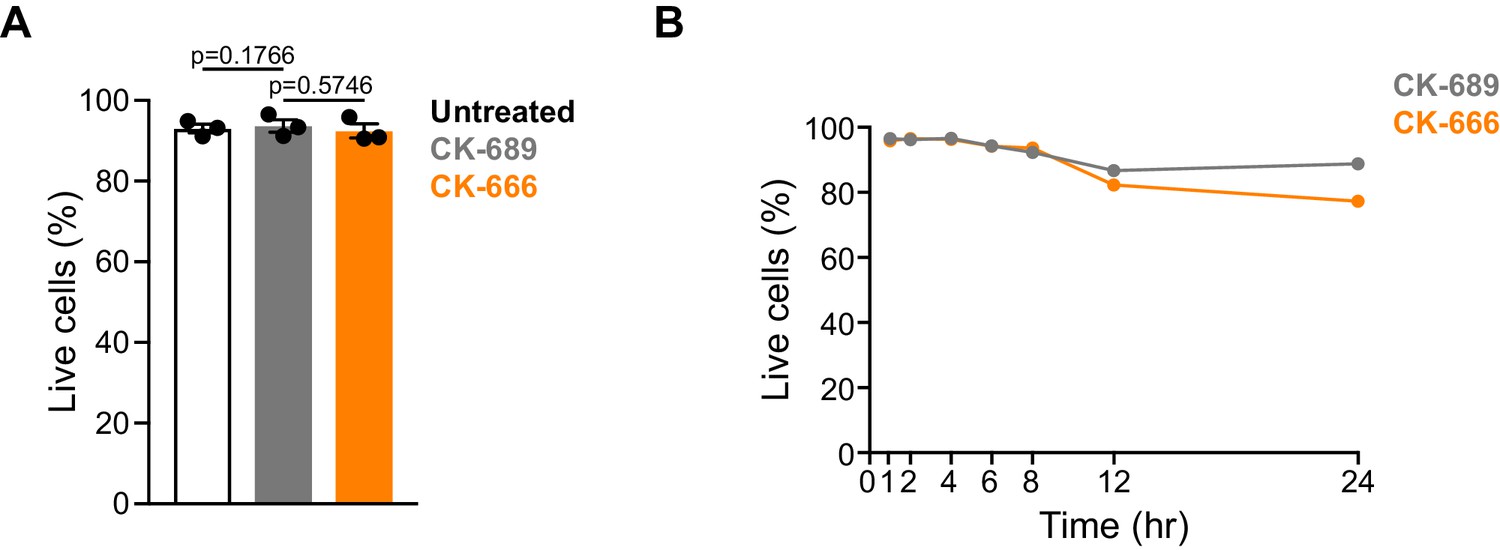
CK-666 treatment does not decrease cell viability.
(A) Primary murine B cells were treated with 100 μM CK-689 or CK-666, or left untreated for 1 hr. The cells were then stained with 7-AAD to identify dead cells and analyzed by flow cytometry. The percent of live cells (7-AAD negative) was quantified. Each dot represents an independent experiment. Bars represent the mean and error bars represent the SEM. (B) Primary murine B cells were treated with 100 µM CK-689 or CK-666 for the indicated lengths of time and the percent of live (7-AAD-negative) cells was determined. Representative graph from one of two independent experiments.
Figure 2—figure supplement 3
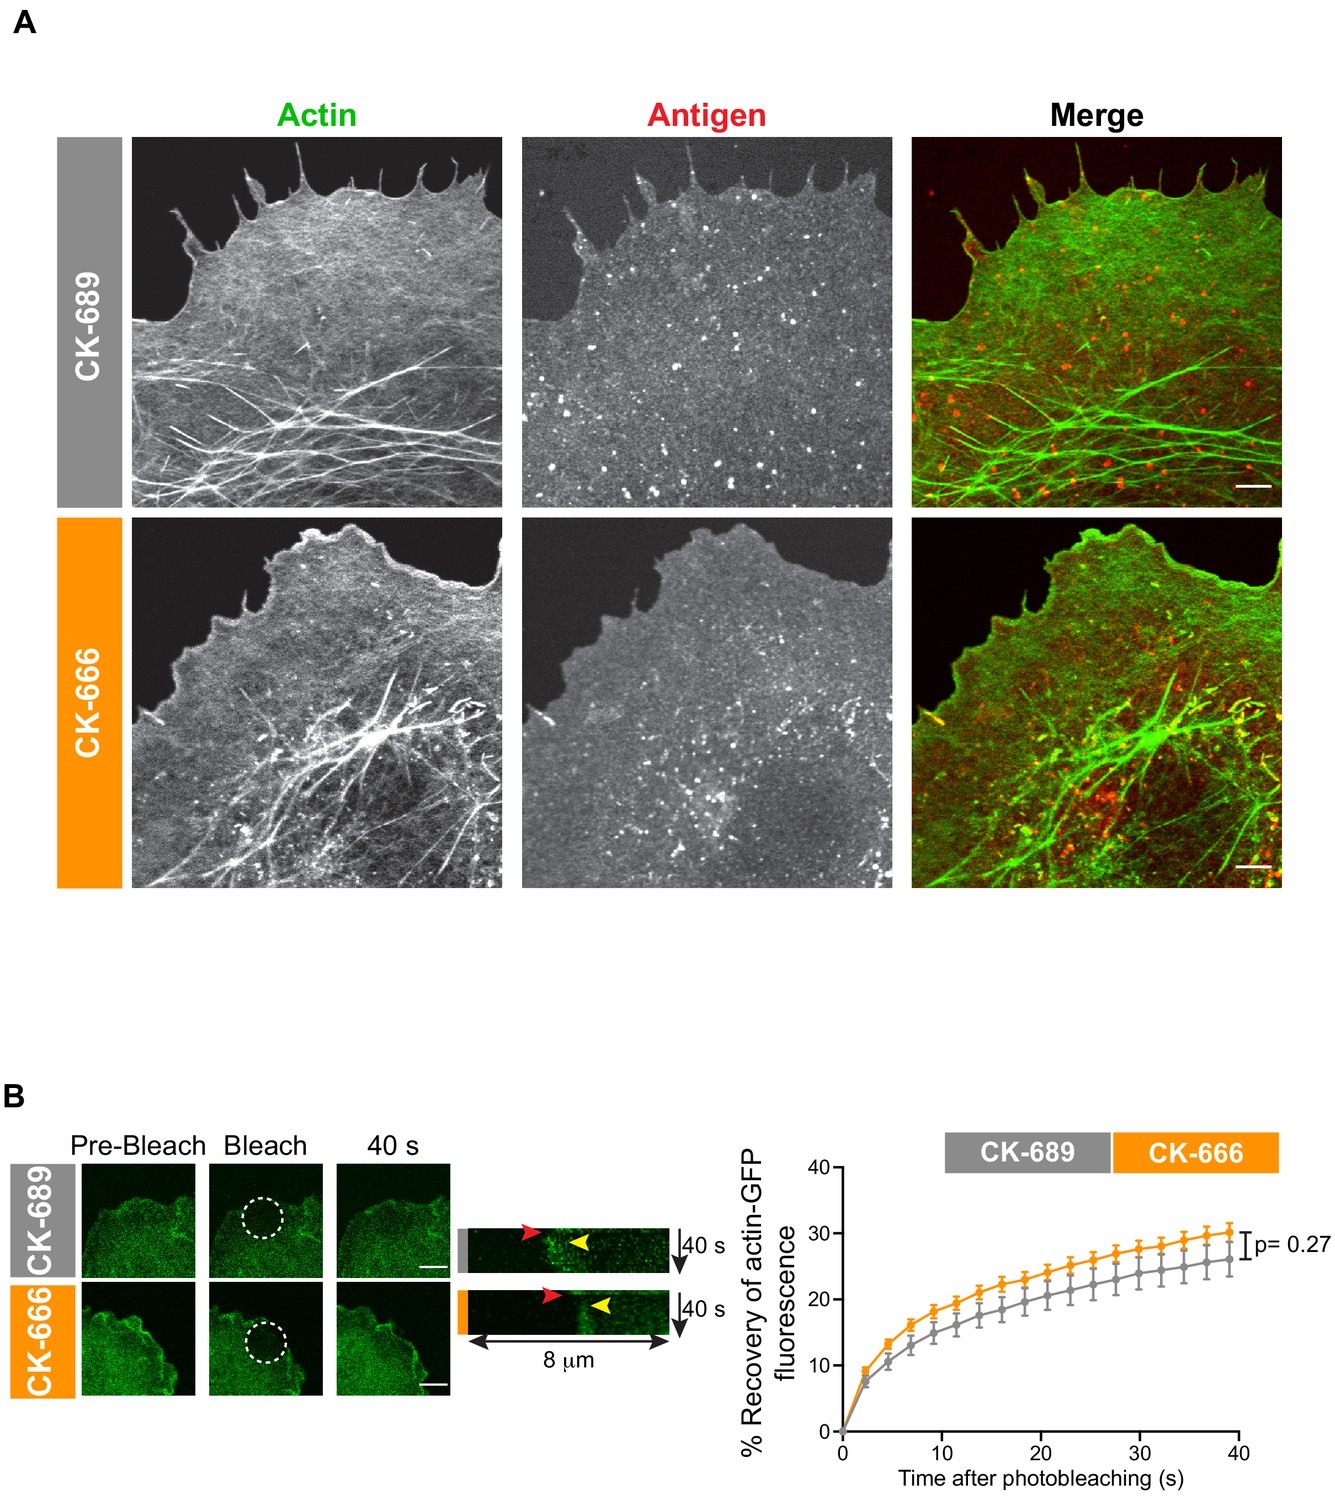
CK-666 does not alter actin organization or dynamics in the COS-7 APCs.
(A) COS-7 cells expressing mHEL-HaloTag (red) were allowed to adhere to fibronectin overnight and then treated with 100 µM of the CK-689 control drug (CK-689) or the CK-666 Arp2/3 complex inhibitor for 30 min. The cells were then stained with phalloidin to visualize F-actin. Scale bar: 5 µm. (B) FRAP analysis of membrane-proximal actin-GFP in COS-7 cells. COS-7 cells were transfected with actin-GFP and allowed to spread on fibronectin. The cells were then treated with 100 µM CK-689 or CK-666 for 30 min. Actin-GFP within the indicated ROI was photobleached and fluorescence recovery was measured at 2 s intervals for 1 min. Representative images are shown (left). Scale bar: 5 µm. Kymograph of actin recovery is shown in the middle panel. Red arrow indicates bleach event. Yellow arrow indicates repolymerization of actin at the cell edge. The recovery of actin-GFP fluorescence after photobleaching is graphed in the right panel (mean ± SEM for >17 cells from two experiments). The curves were not significantly different as assessed using the Kolmogorov-Smirnov test.
Figure 2—figure supplement 4
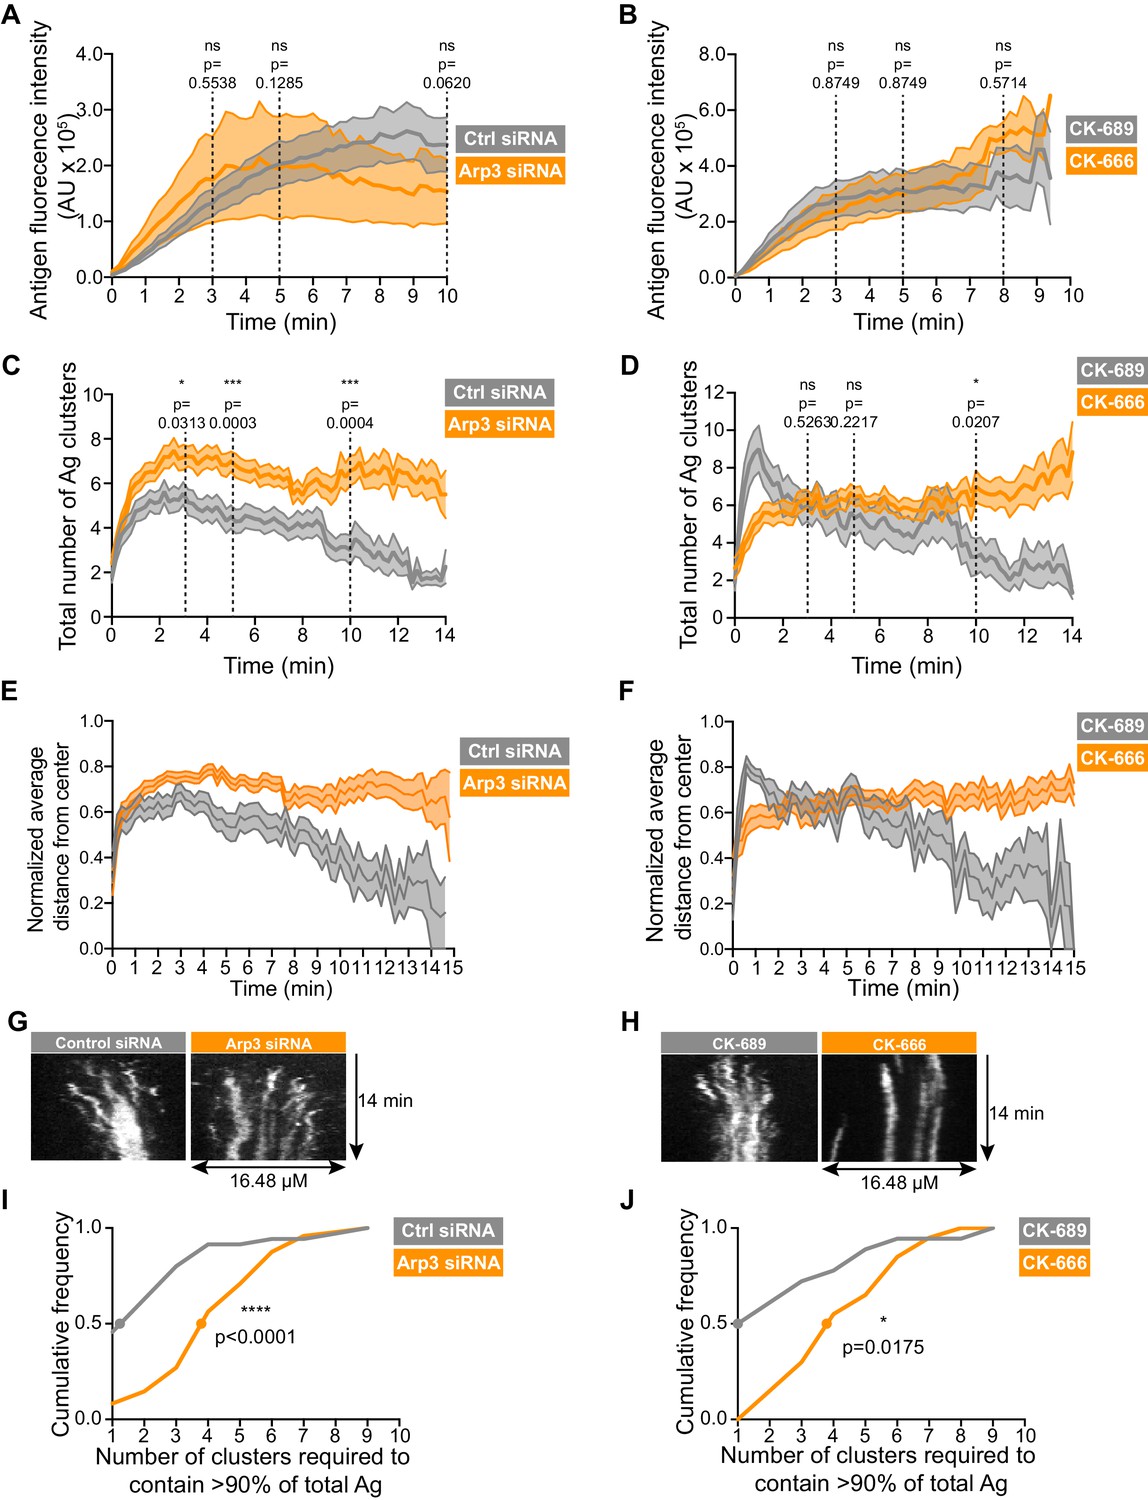
The Arp2/3 complex is important for the coalescence of BCR-Ag microclusters into a cSMAC.
Control siRNA- and Arp3 siRNA-transfected A20 D1.3 B cells (A, C, E, G, I), or CK-689- and CK-666-treated A20 D1.3 B cells (B, D, F, H, J), were added to HEL-GFP-expressing COS-7 APCs and imaged every 12 s for 10–14 min by spinning disk microscopy. (A,B) For each B cell, the total fluorescence intensity of Ag that was gathered into clusters at the B cell-APC contact site was determined for every frame in the video. The data are plotted as mean (line) ± SEM (shaded area) for 9 cells (control siRNA), 12 cells (Arp3 siRNA), 10 cells (CK-689) or 6 cells (CK-666) from a representative experiment. (C,D) For each B cell, the number of Ag clusters formed at the B cell-APC contact site was determined for every frame in the video. The data are plotted as mean ± SEM. (E–F) The distance between each microcluster and the center of mass of Ag fluorescence was calculated for each cell for every frame in the video. For each cell, the average distance from the center of Ag fluorescence for all microclusters was calculated for each time point and normalized to the maximum average distance for that cell. This normalized average distance from the center is plotted as mean ± SEM. (G,H) Kymographs depicting the locations of microclusters along a line extending across the immune synapse. In the control cells, the microclusters depicted move centripetally and then coalesce with other microclusters for form a cSMAC. When the Arp2/3 complex is depleted (G) or inhibited (H), the microclusters are largely static. Cells represented here are the same as those shown in Figure 2 and are the first cells depicted in Video 4 (control siRNA), Video 5 (Arp3 siRNA), Video 6 (CK-689), and Video 7 (CK-666). (I,J) The number of Ag clusters per cell required to contain >90% of the total Ag fluorescence intensity after 10 min of contact with the APCs was quantified and is plotted as a cumulative frequency curve. Dots show the 50th percentile (cumulative frequency = 0.5) for the number of clusters per cell required to contain 90% of the Ag fluorescence after 10 min. In (C–I), n = 35 control siRNA-transfected cells and 48 Arp3 siRNA-transfected cells from four experiments. In (D–J), n = 18 CK-689-treated cells and 20 CK-666-treated cells from three experiments. Mann-Whitney U or Kolmogorov-Smirnov tests were used to calculate p values. ****p<0.0001; ***p<0.001; **p<0.01; *p<0.05; ns, not significant. For each cell analyzed, the fraction of the total Ag fluorescence intensity in each cluster is shown in Figure 2—figure supplement 5.
Figure 2—figure supplement 5
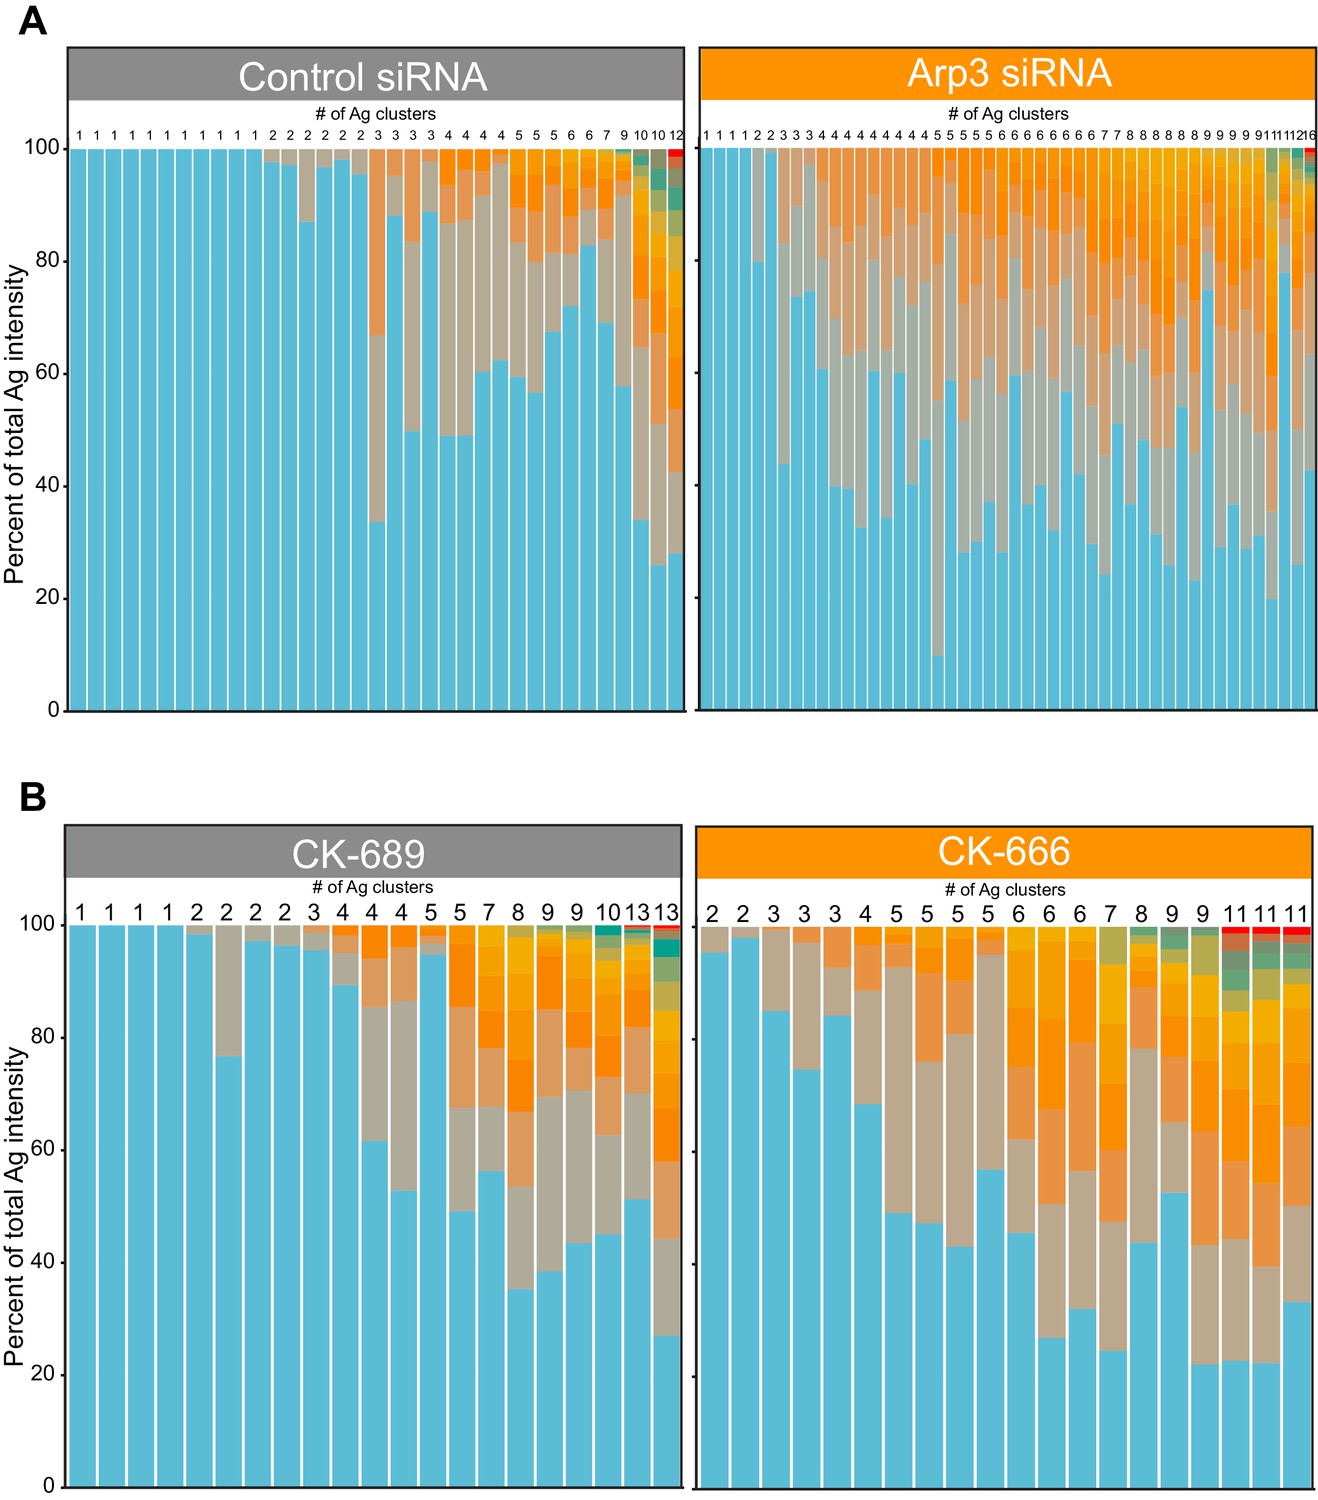
Distribution of total Ag fluorescence intensity in individual clusters.
For each B cell analyzed in Figure 2—figure supplement 4, the stacked bar plots show the fraction of the total Ag fluorescence intensity in individual clusters at 10 min after adding the A20 D1.3 B cells to HEL-GFP-expressing COS-7 APCs. Each bar represents one cell. Each colored segment within a bar represents a single Ag cluster, the size of which is proportional to the fraction of the cell’s total Ag fluorescence intensity contained within that cluster. The number at the top of each bar is the total number of distinct Ag clusters present at the 10 min time point. In (A) n = 35 control siRNA-transfected cells and 48 Arp3 siRNA-transfected cells from four experiments. In (B), n = 18 CK-689-treated cells and 20 CK-666-treated cells from three experiments.
Figure 3 with 1 supplement
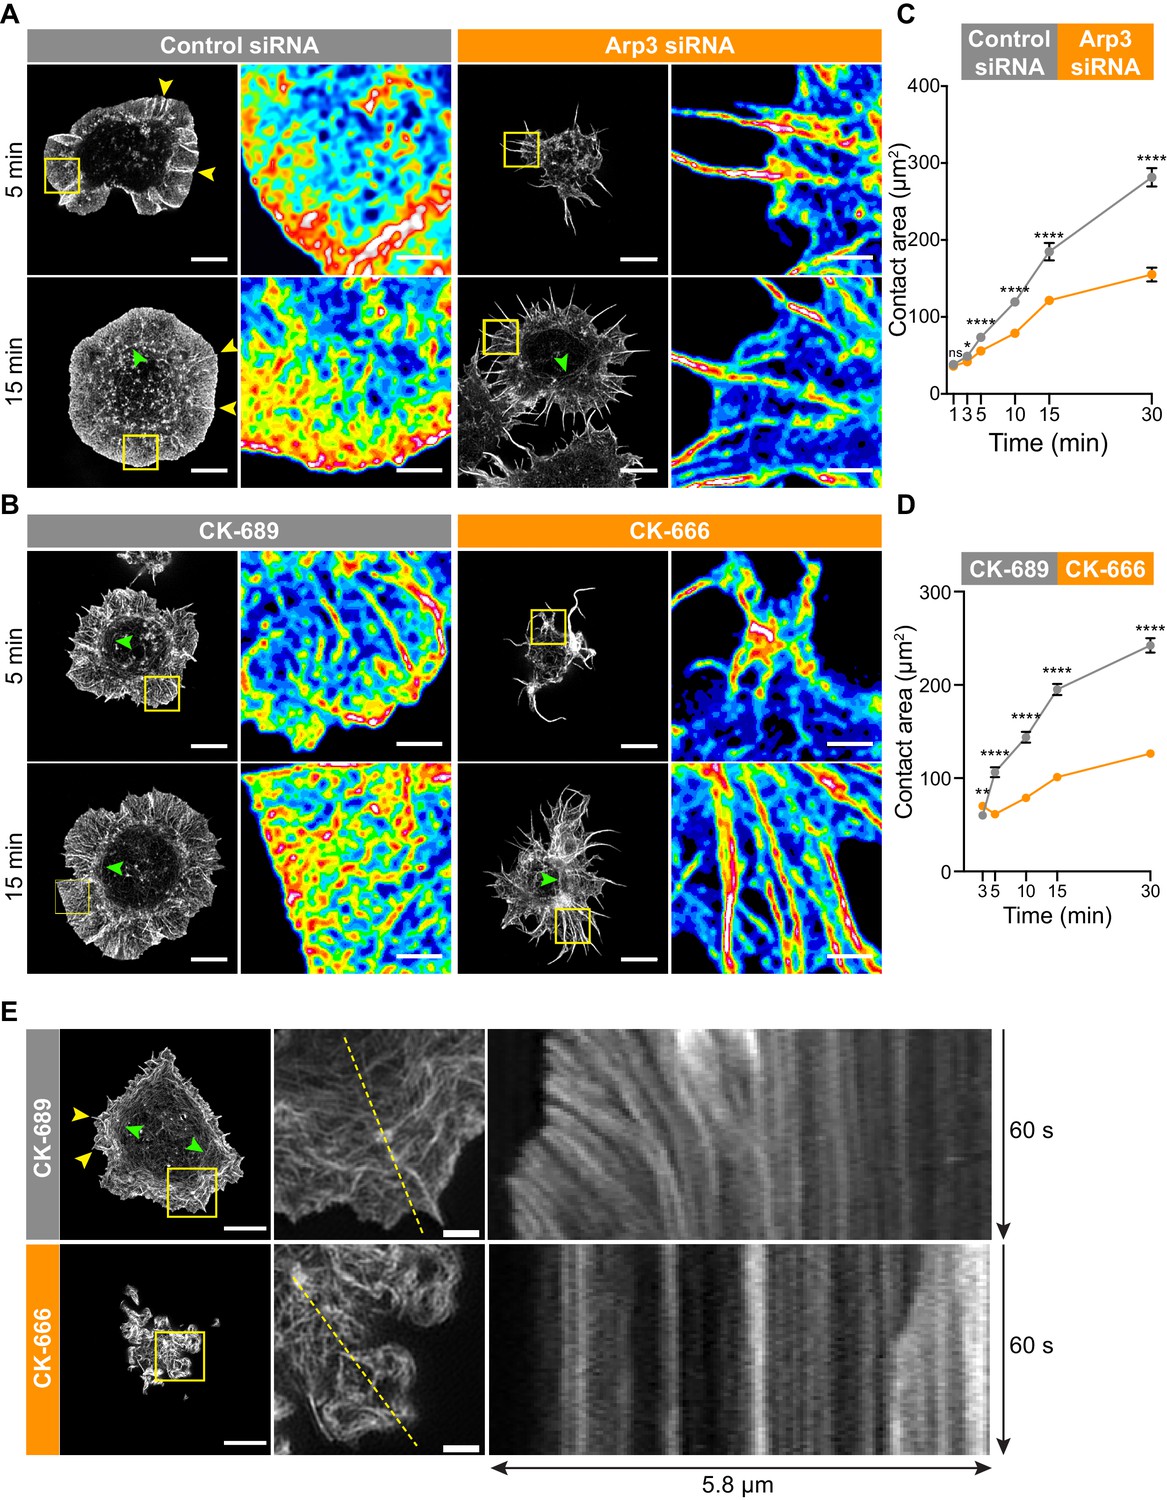
The Arp2/3 complex is important for BCR-induced actin reorganization and dynamics.
(A,B) A20 B cells were transfected with either control siRNA or Arp3 siRNA (A) or pre-treated for 1 hr with 100 μM of the control compound CK-689 or the Arp2/3 complex inhibitor CK-666 (B). Cells were then allowed to spread on anti-IgG-coated coverslips for the indicated times before being fixed, stained for actin, and imaged by STED microscopy. Images representative of >20 cells per condition are shown. Yellow arrowheads indicate linear actin structures embedded within the peripheral branched actin network. Green arrowheads indicate actin arcs. Scale bars: 5 µm. For the regions within the yellow boxes, the images were enlarged (scale bars: 2 µm) and the relative densities of the actin structures are shown as heat maps. (C,D) A20 B cells were transfected with either control siRNA or Arp3 siRNA (C) or pre-treated for 1 hr with μM CK-689 or CK-666 (D). The cells were then allowed to spread on anti-IgG-coated coverslips for the indicated times before being stained for F-actin. The B cell-coverslip contact site was imaged using spinning disk microscopy. The cell area was quantified, using F-actin to define the cell edge. For each data point the mean ± SEM is shown for >27 cells from a representative experiment. ****p<0.0001; **p<0.01; *p<0.05; ns, not significant; Mann-Whitney U test. (E) A20 B cells expressing F-Tractin-GFP were pre-treated for 1 hr with CK-689 or CK-666 and then added to anti-IgG-coated chamber wells. After 5 min, the cells were imaged by TIRF-SIM at 1 s intervals for 1 min. The left panels are the first images from Video 8 (CK-689-treated cells) and Video 9 (CK-689-treated cells), respectively (Scale bars: 5 µm). Yellow arrowheads indicate linear actin structures embedded within the peripheral branched actin network. Green arrowheads indicate actin arcs. The middle panels are enlargements of the areas within the yellow boxes in the left panels (Scale bars: 2 µm). The right panels are kymographs along the yellow dotted lines in the middle panels.
Figure 3—figure supplement 1
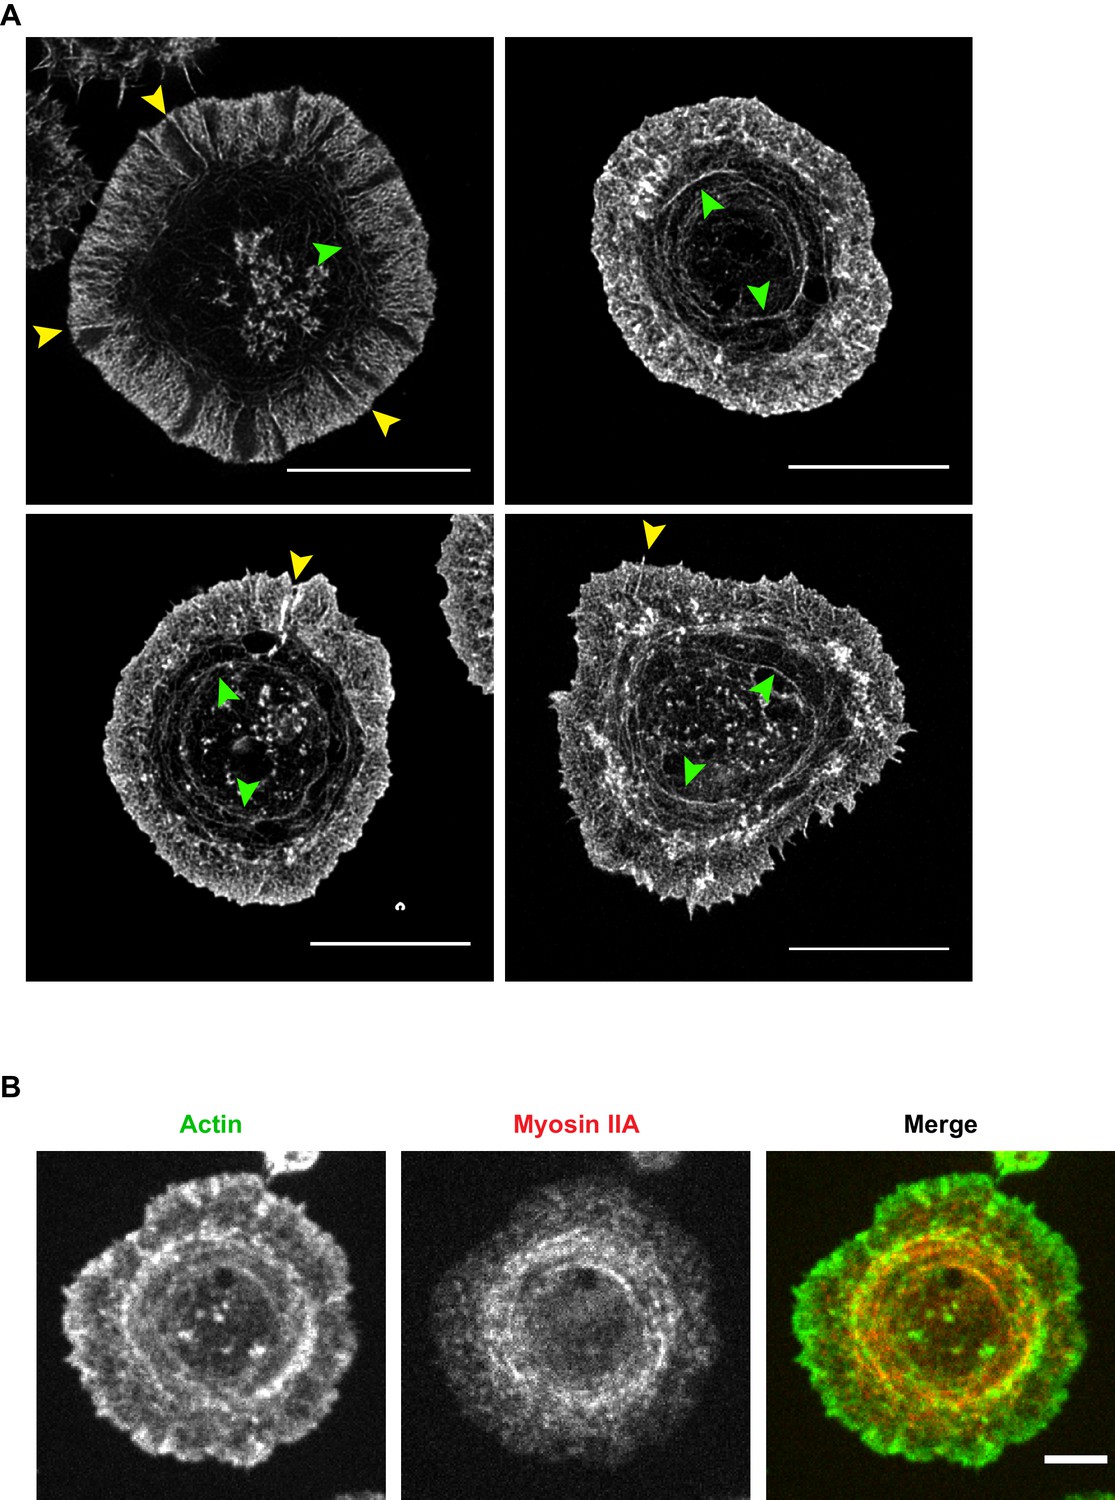
Actin and myosin structures in A20 B cells spreading on immobilized anti-IgG.
(A) A20 B cells were allowed to spread on anti-IgG-coated coverslips for 15 min before being imaged by STED microscopy. Yellow arrowheads indicate linear actin structures embedded within the peripheral branched actin network. Green arrowheads indicate actin arcs. Scale bars: 10 µm. (B) A20 B cells that had been transfected with myosin IIA-GFP were allowed to spread on anti-IgG-coated coverslips for 10 min. After phalloidin staining, the cells were imaged by spinning disk microscopy. Scale bar: 5 µm.
Figure 4 with 1 supplement
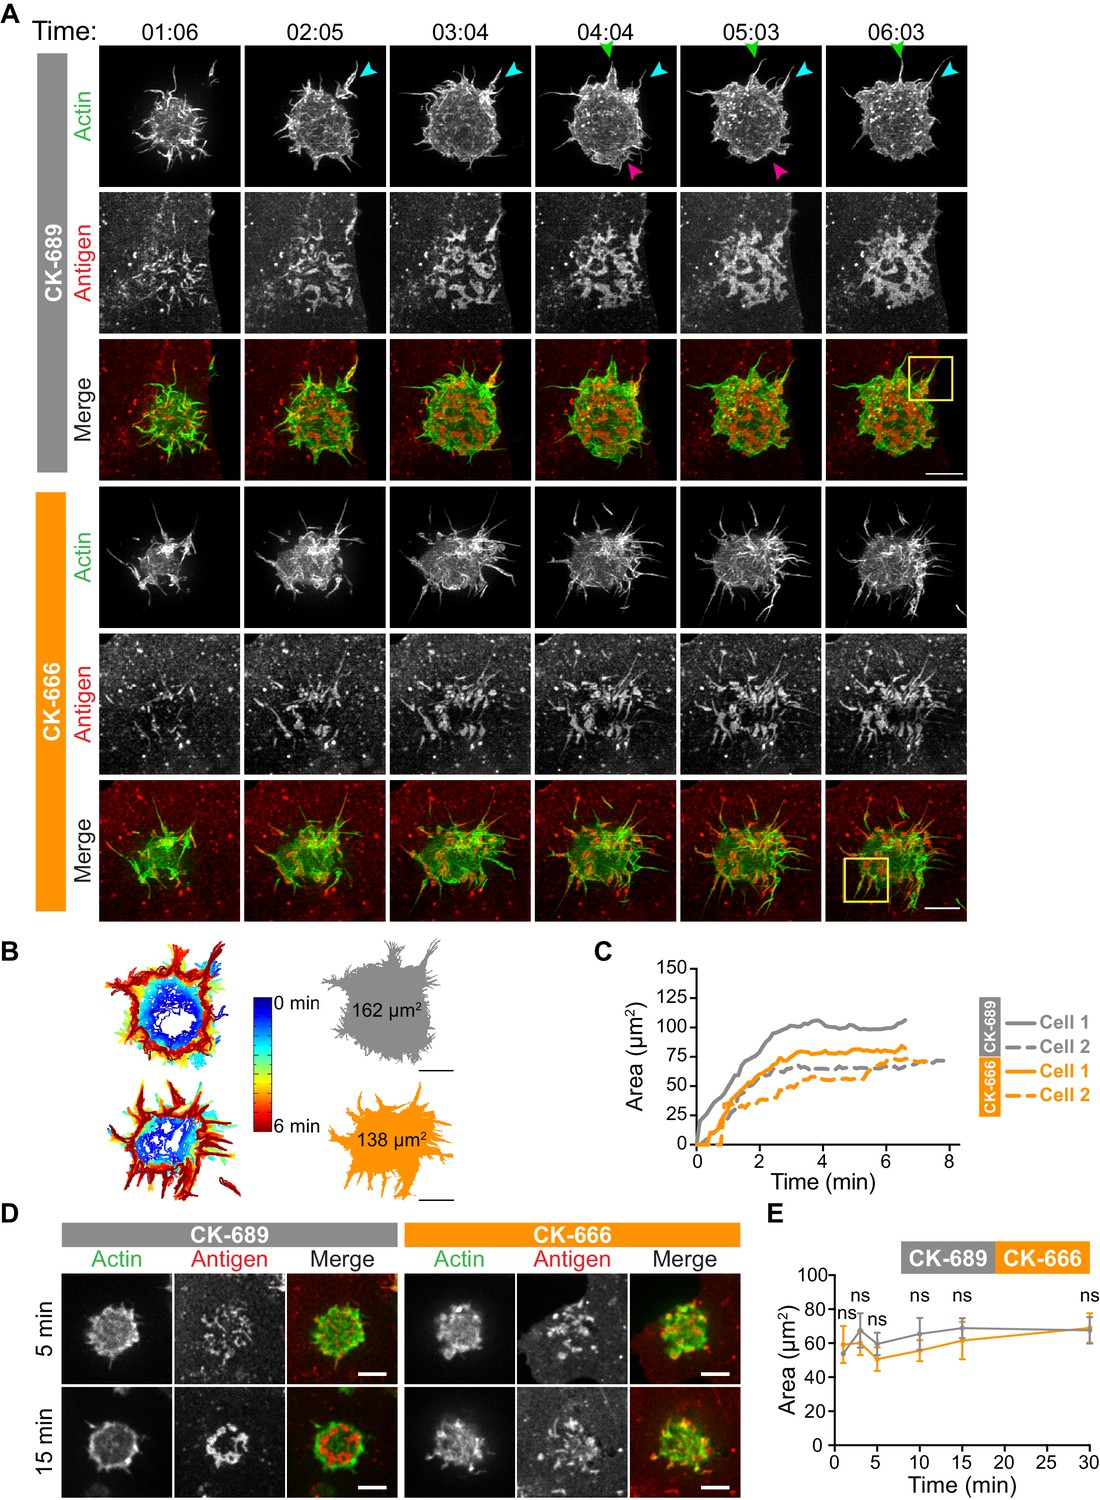
The Arp2/3 complex is important for actin and BCR microcluster dynamics at the B cell-APC immune synapse.
(A–C) A20 D1.3 B cells expressing F-Tractin-GFP (green) were pre-treated with 100 µM CK-689 or CK-666 for 1 hr and then added to COS-7 cells expressing mHEL-HaloTag (red). The cells were imaged every 6.6 s for 6 min using ISIM. Images from Video 10 and Video 11 are shown in (A). Arrowheads indicate new protrusion events. The yellow boxes indicate the regions that are enlarged in Figure 5. In (B) the cell edge from each frame in Video 10 (CK-689-treated cells) or Video 11 (CK-666-treated cells), as defined by the peripheral F-actin, was overlaid as a temporally coded time series (left). The total area searched by the B cell over the 6-min period of observation is shown the right. In (C) the B cell-APC contact area is shown as a function of time for the cells in (A) (solid lines), and for another set of representative cells (dashed lines; images are shown in Figure 4—figure supplement 1). (D,E) A20 D1.3 B cells expressing F-Tractin-GFP (green) were pre-treated with 100 μM CK-689 or CK-666 and then added to COS-7 cells expressing mHEL-HaloTag (red). The cells were fixed at the indicated times and imaged by spinning disk microscopy. Representative images are shown (D) and the B cell-APC contact area (mean ± SEM), as defined by F-actin, is graphed (E). For each data point, n > 20 cells from three independent experiments except for the 1 min time point (n = 4 cells). ns, not significant (p=0.7219, p=0.1310, p=0.0722, p=0.1443, p=0.2930, p=0.6263 for the 1, 3, 5, 10, 15, and 30 min time points, respectively); two-tailed paired t-test. Scale bars: 5 µm.
Figure 4—figure supplement 1
Arp2/3 complex activity is required for actin dynamics and for the centripetal movement of BCR-Ag microclusters at the periphery of the B cell-APC contact site.
A20 D1.3 B cells expressing F-Tractin-GFP (green) were pre-treated with 100 µM CK-689 or CK-666 for 1 hr and then added to COS-7 cells expressing mHEL-HaloTag (red). The cells were then imaged every 6.6 s for 6 min using ISIM. Images from movies are shown for representative cells (A). The total area searched by these cells over the 6-min period of observation is shown (B). Scale bars: 5 µm. The B cell-APC contact area for these cells, as a function of time, is shown in Figure 4C (dashed lines). The kymographs (C) represent a time series of images taken along the white dashed lines in (A).
Figure 5
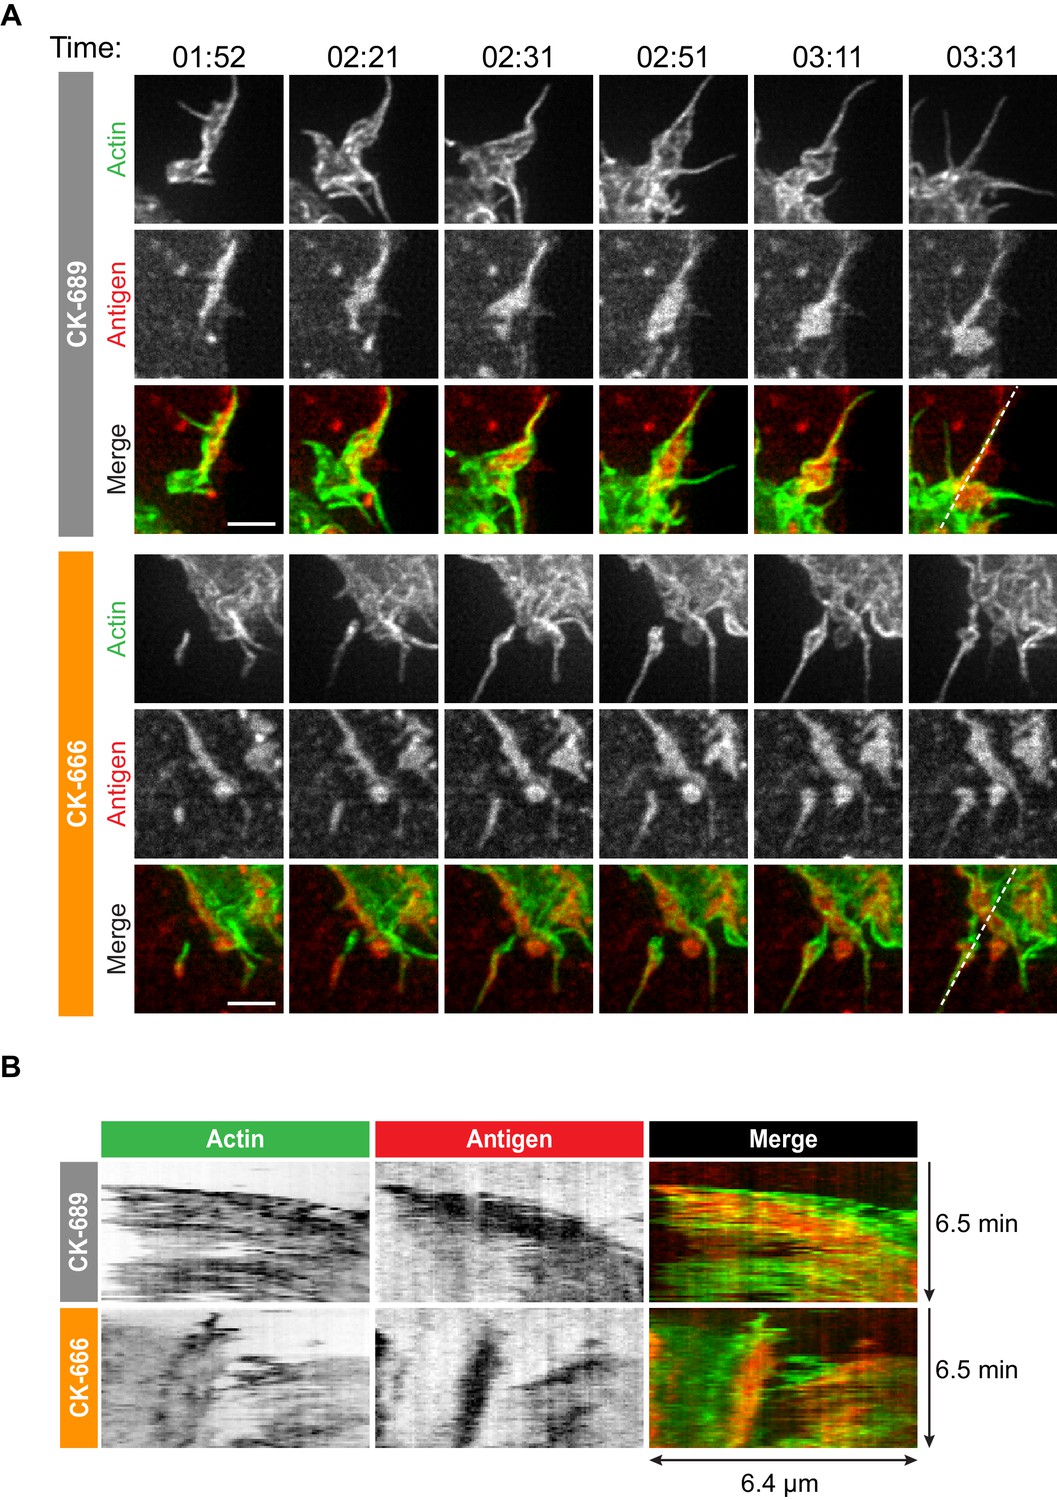
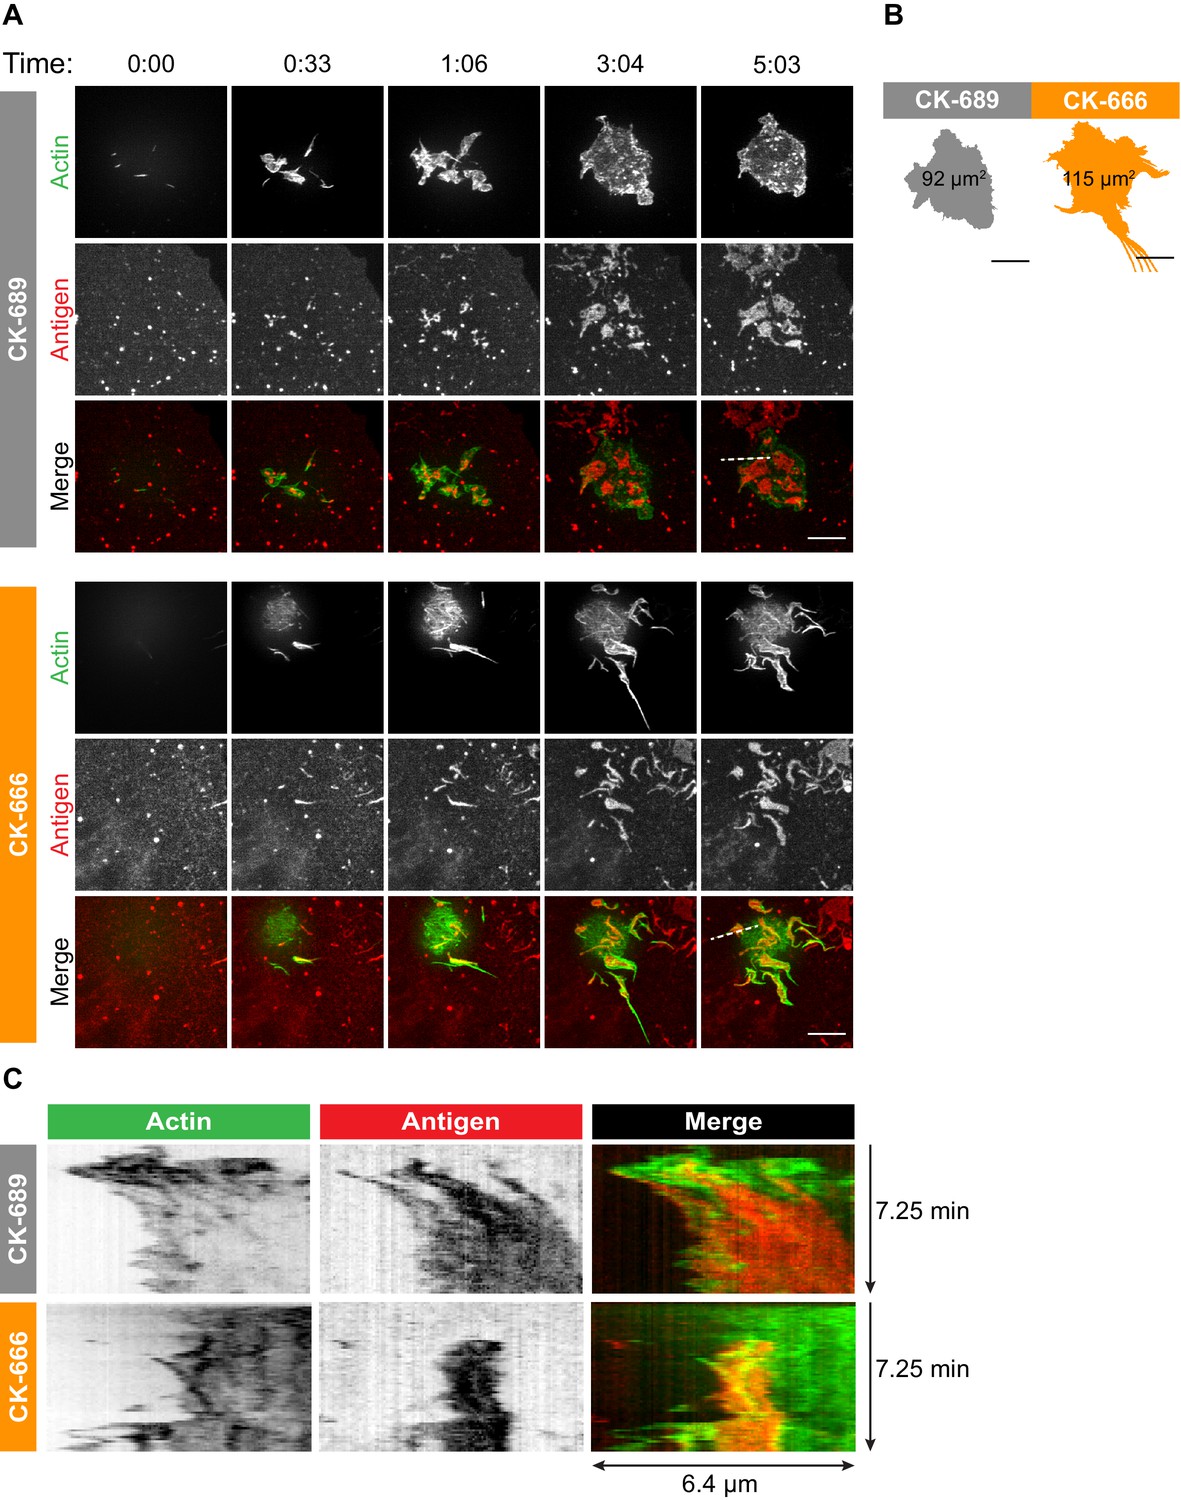
Arp2/3 complex-dependent actin structures encage BCR-Ag microclusters on membrane protrusions.
(A) Images from Video 10 and Video 11 showing enlargements of the regions indicated by the yellow boxes in Figure 4. A20 D1.3 B cells expressing F-Tractin-GFP (green) were pre-treated with 100 μM CK-689 or CK-666 for 1 hr and then added to COS-7 cells expressing mHEL-HaloTag (red). The cells were imaged every 6.6 s for 6 min using ISIM. Scale bars: 2 µm. (B) The kymographs represent a time series of images taken along the white dashed lines in (A).
Figure 6 with 3 supplements
The Arp2/3 complex amplifies proximal BCR signaling.
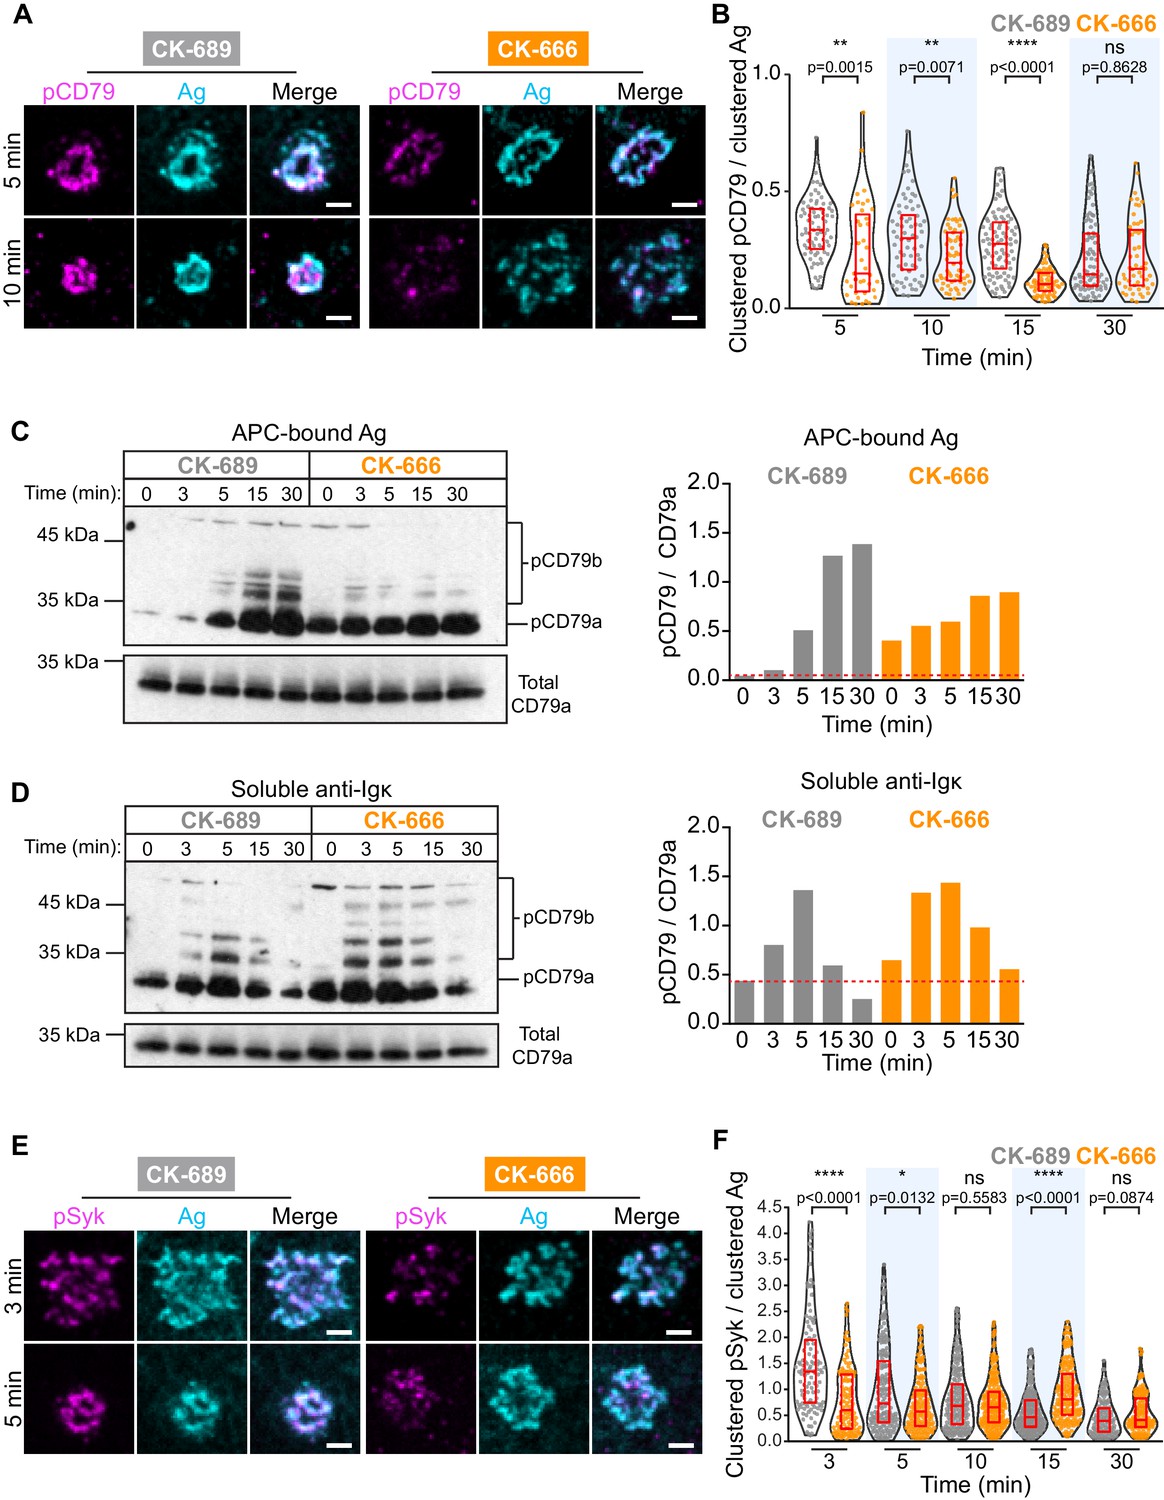
(A,B) Primary murine B cells were pre-treated with 100 μM CK-689 or CK-666 for 1 hr and then added to COS-7 cells expressing the single-chain anti-Ig surrogate Ag. The cells were fixed at the indicated times and stained with an antibody that recognizes the surrogate Ag and with an antibody that recognizes the phosphorylated ITAMs in CD79a and CD79b (pCD79). Images of representative cells are shown (A). For each B cell, the total fluorescence intensity of clustered pCD79 was divided by the total fluorescence intensity of clustered Ag at the B cell-APC contact site. Beeswarm plots in which each dot is one cell. The median (red line) and interquartile ranges (red box) for >39 cells for each time point from a representative experiment are shown (B). (C,D) Primary murine B cells were pre-treated with 100 μM CK-689 or CK-666 for 1 hr and then added to COS-7 cells expressing the single-chain anti-Ig surrogate Ag (C) or stimulated with 10 µg/ml soluble anti-Ig (D) for the indicated times. pCD79 and total CD79a immunoblots are shown (left panels) and the pCD79/total CD79a ratios are graphed (right panels). Dotted red line corresponds to the pCD79/total CD79a ratio value for unstimulated CK-689-treated B cells. Representative data from one of seven experiments. An additional independent experiment is shown in Figure 6—figure supplement 2. See Figure 9—figure supplement 6 for full blots. (E,F) Primary murine B cells that had been pre-treated with 100 μM CK-689 or CK-666 for 1 hr were added to COS-7 cells expressing the single-chain anti-Ig Ag. The cells were fixed at the indicated times and stained for the surrogate Ag and pSyk (E). For each B cell, the total fluorescence intensity of clustered pSyk was divided by the total fluorescence intensity of clustered Ag at the B cell-APC contact site. Beeswarm plots with the median and interquartile ranges for >112 cells for each time point from a representative experiment are shown (F). ****p<0.0001; ***p<0.001; **p<0.01; *p<0.05; ns, not significant; Mann-Whitney U test. Scale bars: 2 µm.
Figure 6—figure supplement 1
Arp2/3 complex activity amplifies CD79 phosphorylation.
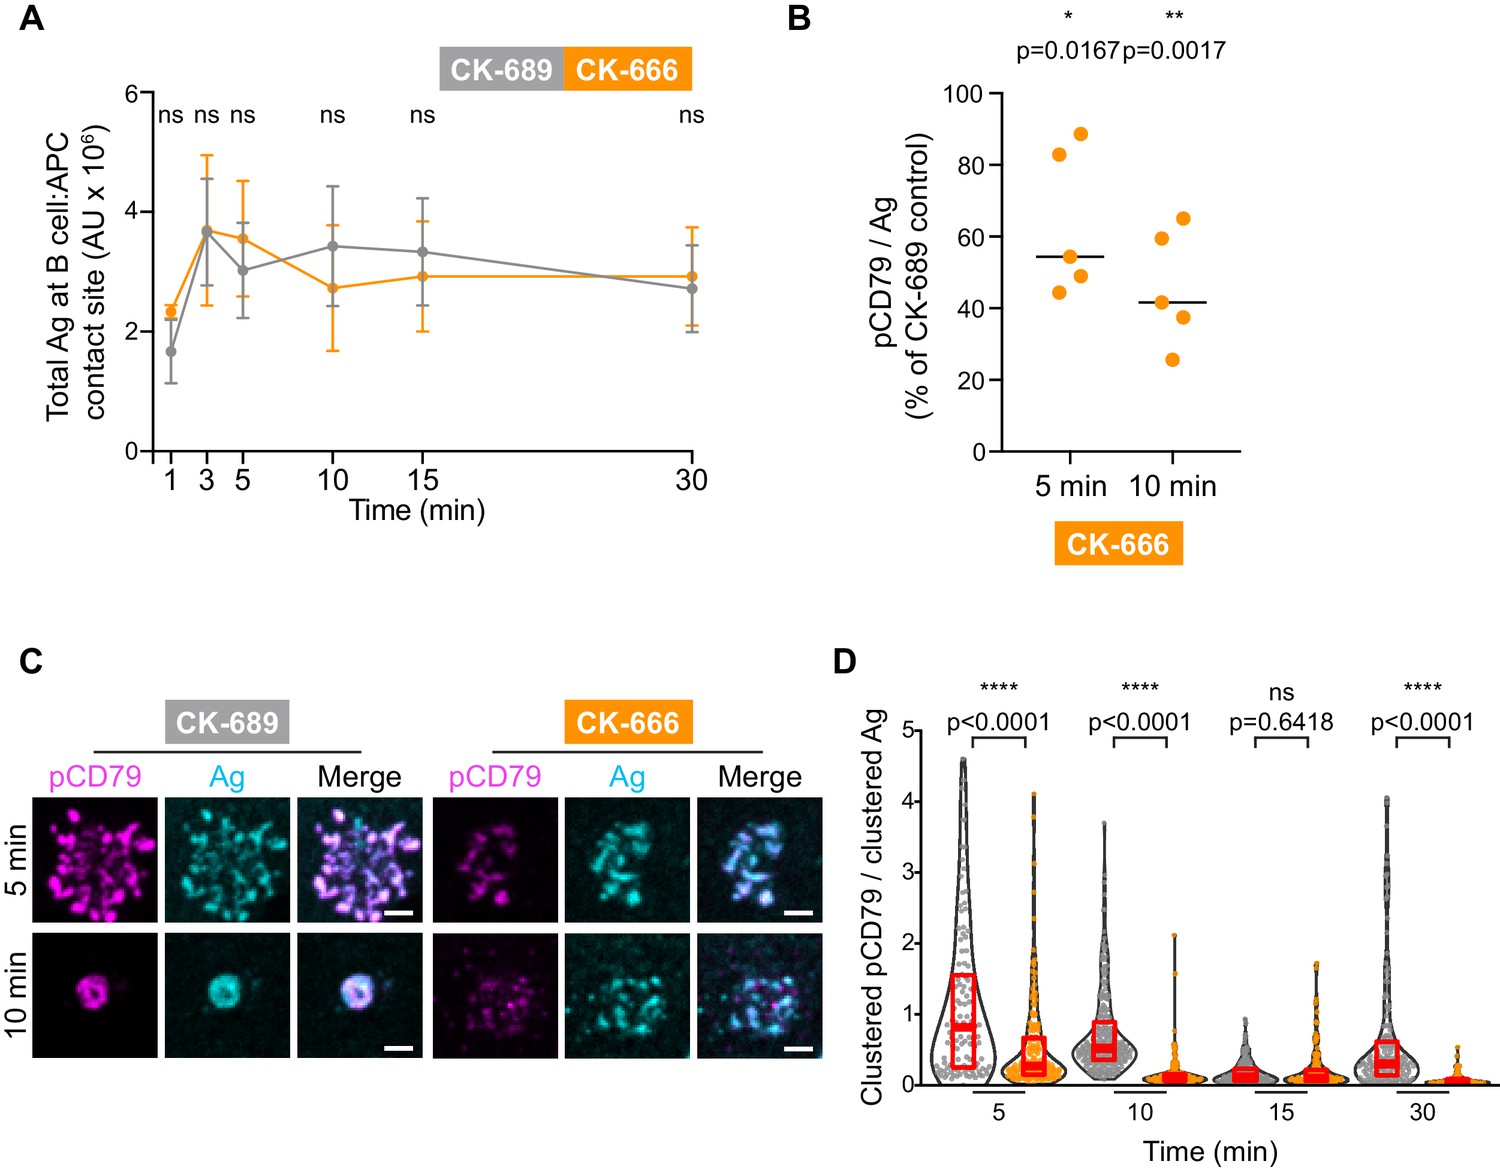
(A) Primary murine B cells were pre-treated with 100 µM CK-689 or CK-666 for 1 hr and then added to COS-7 cells expressing the single-chain anti-Ig surrogate Ag. The cells were fixed at the indicated times and stained for the surrogate Ag. For each condition, the total fluorescence intensity of Ag that had been gathered into clusters at the B cell-APC contact site was quantified for >20 cells per experiment. The means ± SEM for the median values from 11 independent experiments are graphed. ns, not significant (p=0.3702, p=0.3573, p=0.3044, p=0.1644, p=0.4388, p=0.6089 for the 1, 3, 5, 10, 15, and 30 min time points, respectively); two-tailed paired t-test. (B) Primary murine B cells were treated with CK-689 or CK-666 for 1 hr and then added to COS-7 cells expressing the anti-Ig surrogate Ag. The cells were fixed after 3, 5, 10, 15 and 30 min and stained for surrogate Ag (anti-Ig) and pCD79. For each B cell, the total fluorescence intensity of clustered pCD79 was divided by the total fluorescence intensity of clustered Ag at the B cell-APC contact site. For each condition, the median values for this ratio were determined in each experiment. The graph shows the median values of pCD79/Ag in CK-666-treated B cells as a percent of the median values in CK-689-treated control cells (=100%) for the 5 and 10 min time points from five independent experiments. The number of cells analyzed for each condition was >75 (expt 1), >7 (expt 2), >39 (expt 3), >116 (expt 4), and >75 (expt 5), respectively. CK-666/CK-689 ratios were not significantly different from 100% at 15 and 30 min. (C,D) Primary murine B cells from MD4 mice were treated with CK-689 or CK-666 for 1 hr and then added to COS-7 cells expressing the mHEL-HaloTag Ag. The cells were fixed at the indicated times and then stained for pCD79. Images of representative cells are shown (C). Scale bar: 2 µm. For each B cell, the total fluorescence intensity of clustered pCD79 was divided by the total fluorescence intensity of clustered Ag at the B cell-APC contact site. In the beeswarm plots, each dot is one cell. For each time point, the median (red line) and interquartile ranges (red box) for >71 cells from a representative experiment are shown (B). ****p<0.0001; ***p<0.001; **p<0.01; *p<0.05; ns, not significant. Two-tailed paired t-test for panels A and B. Mann-Whitney U test for panel D.
Figure 6—figure supplement 2
Arp2/3 complex activity amplifies Syk phosphorylation.
(A) Primary murine B cells were treated with CK-689 or CK-666 for 1 hr and then added to COS-7 cells expressing the anti-Ig surrogate Ag. The cells were fixed after 3, 5, 10, 15 and 30 min and stained for surrogate Ag (anti-Ig) and pSyk. For each B cell, the total fluorescence intensity of clustered pSyk was divided by the total fluorescence intensity of clustered Ag at the B cell-APC contact site. For each condition, the median values for this ratio were determined for >10 cells per experiment. The graph shows the median values of pSyk/Ag in CK-666-treated B cells as a percent of the median values in CK-689-treated control cells (=100%) from three independent experiments at the 3 min time point. CK-666/CK-689 ratios were not significantly different from 100% at 5, 10, 15 and 30 min. (B–C) Primary murine B cells from MD4 mice were treated with CK-689 or CK-666 for 1 hr and then added to COS-7 cells expressing the mHEL-HaloTag Ag. The cells were fixed at the indicated times and then stained for the Ag and pSyk. Images of representative cells are shown (B). Scale bar: 2 µm. For each B cell, the total fluorescence intensity of clustered pSyk was divided by the total fluorescence intensity of clustered Ag at the B cell-APC contact site. Each dot is one cell. The median (red line) and interquartile ranges (box) for >40 cells from a representative experiment are shown (C). ****p<0.0001; ***p<0.001; **p<0.01; *p<0.05; ns, not significant. Two-tailed paired t-test for panels A, Mann-Whitney U test for panel C.
Figure 6—figure supplement 3

Additional independent experiment associated with Figure 6C,D.
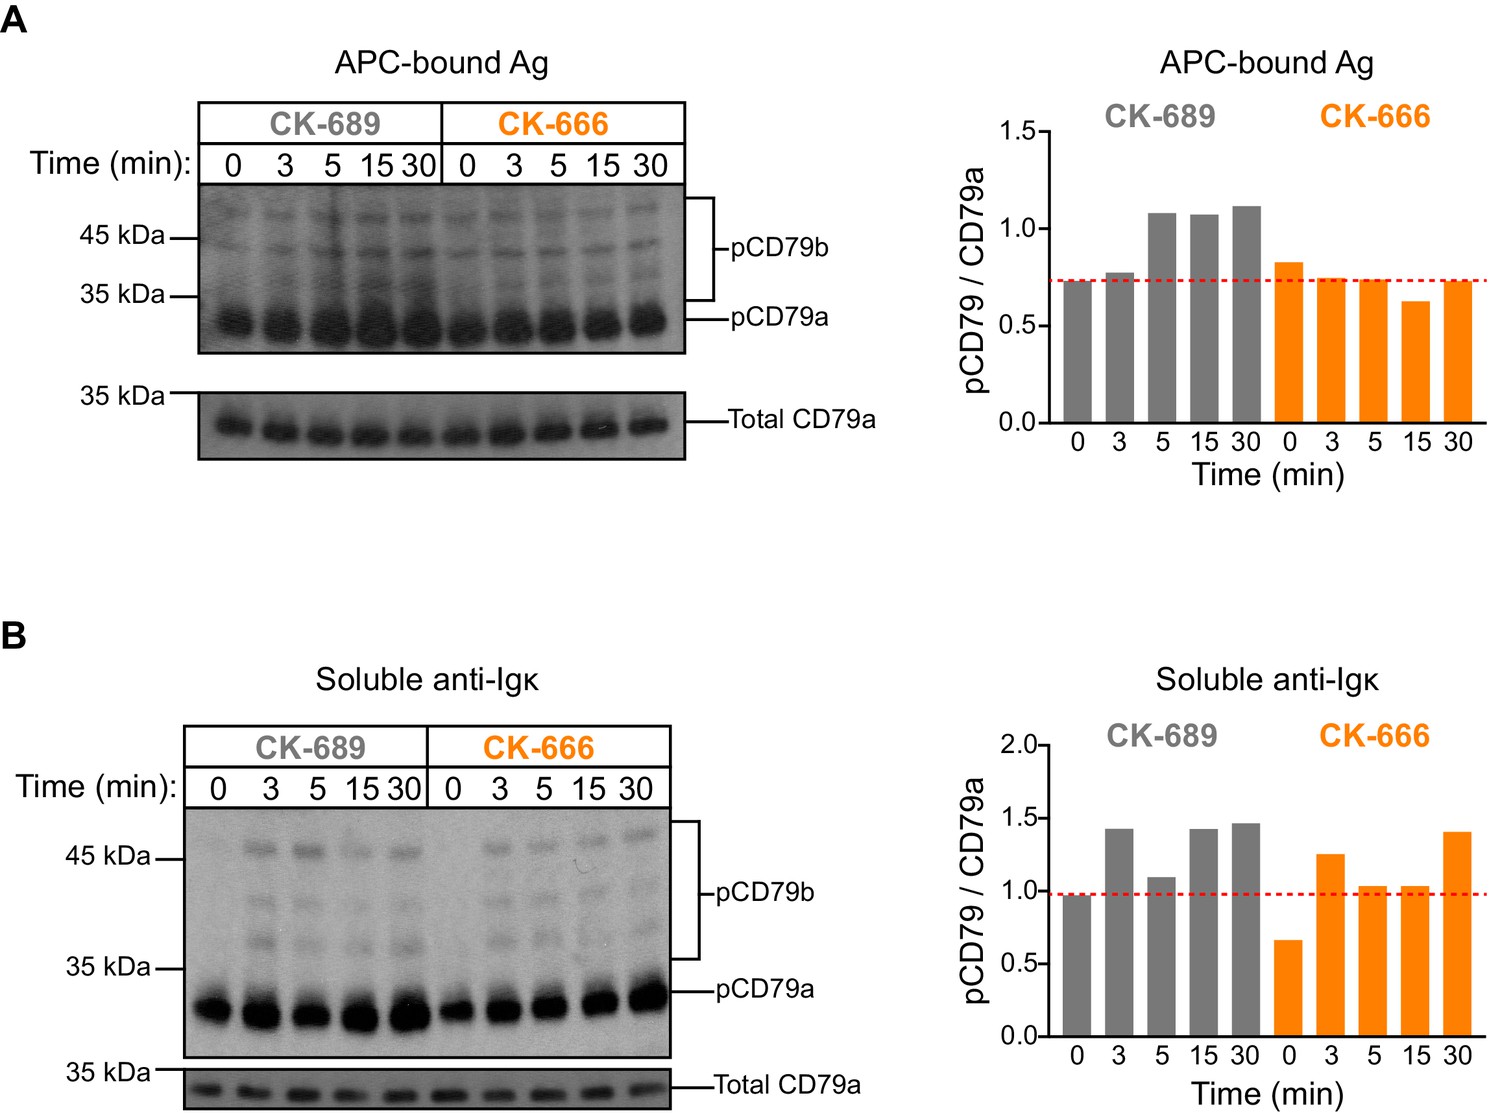
Primary murine B cells were pre-treated with 100 μM CK-689 or CK-666 for 1 hr and then added to COS-7 APCs expressing the single-chain anti-Ig surrogate Ag (C) or stimulated with 10 µg/ml soluble anti-Ig, (B) for the indicated times. pCD79 and total CD79a immunoblots are shown (left panels) and the pCD79/total CD79a ratios are graphed (right panels). The dotted red lines correspond to the pCD79/total CD79a ratio for unstimulated CK-689-treated B cells. Representative data from one of seven experiments. See Figure 9—figure supplement 6 for full blots.
Figure 7
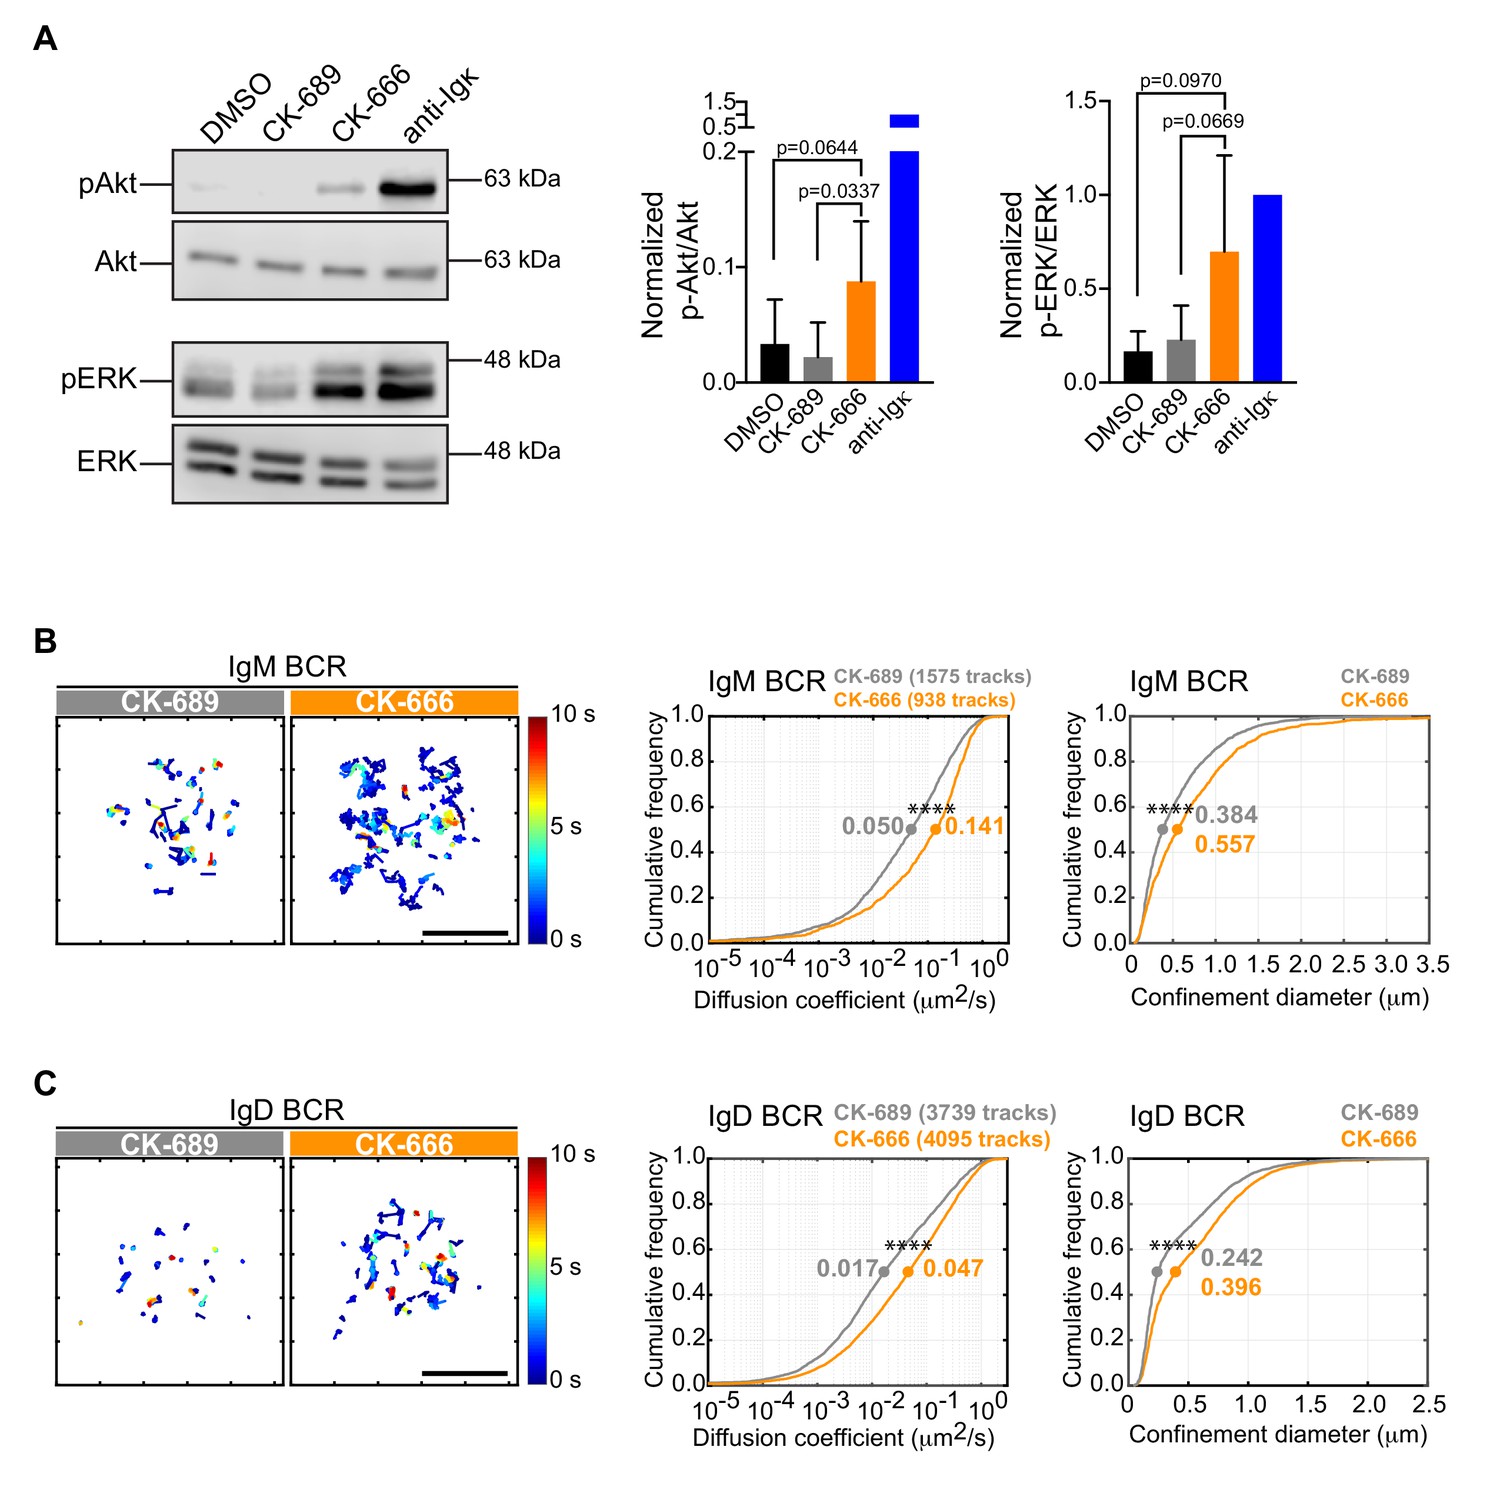
The Arp2/3 complex regulates BCR mobility and tonic signaling in resting B cells.
(A) Ex vivo primary murine B cells were treated with DMSO, 100 μM CK-689, or 100 μM CK-666 for 1 hr, or stimulated with anti-Ig antibodies for 5 min. Cell extracts were analyzed by immunoblotting with antibodies against phospho-ERK (pERK) and total ERK, or phospho-Akt (pAkt) and total Akt. Representative blot are shown (left). Band intensities were quantified and the ratio of pERK/total ERK and pAkt/total Akt (right) relative to those in anti-Ig-treated cells (=1.0) are graphed as the mean ± SEM for four (pERK) or five (pAkt) independent experiments. Two-tailed paired t-test. See Figure 9—figure supplement 6 for full blots. (B–D) Ex vivo primary murine splenic B cells were treated with 100 μM CK-689 or CK-666 for 1 hr. SPT was then carried out by labeling the cells at low stoichiometry with Cy3-labeled Fab fragments of antibodies to IgM (B) or IgD (C). The cells were then settled onto non-stimulatory anti-MHC II-coated coverslips and imaged for 10 s at 33 Hz by total internal reflection florescence microscopy (TIRFM). Single-particle trajectories from representative cells are plotted using a color-coded temporal scale (left panels). Scale bars: 5 µm. Diffusion coefficients were calculated for the indicated number of tracks and cumulative frequency curves are shown (center panels). The diameter of maximum displacement over the 10 s period of observation (confinement diameter) was calculated for each track and cumulative frequency curves are shown (right panels). The dots on the curves indicate the median values. Representative data from one of three independent experiments ****p<0.0001; Kolmogorov-Smirnov test.
Figure 8 with 1 supplement
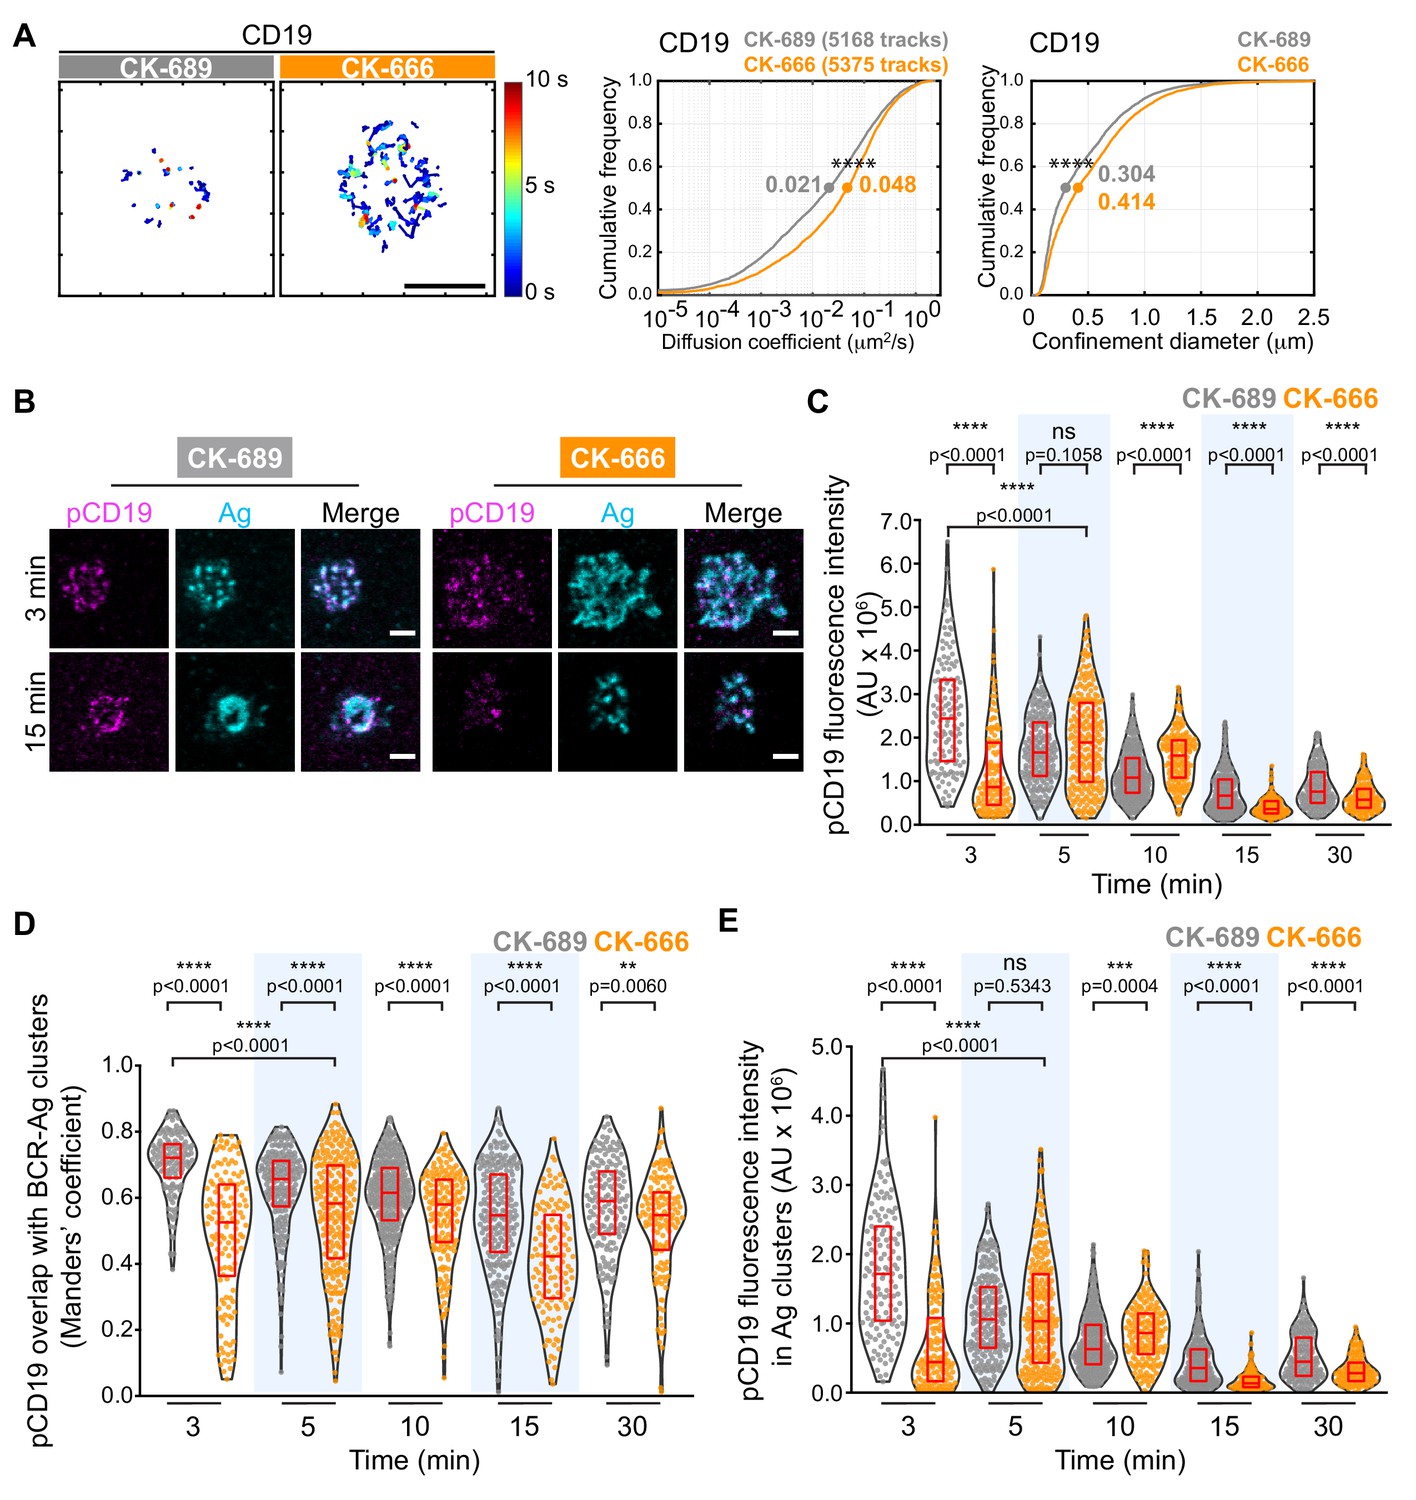
The Arp2/3 complex regulates CD19 mobility and BCR-CD19 interactions.
(A) Ex vivo primary murine splenic B cells were treated with 100 μM CK-689 or CK-666 for 1 hr. SPT was then carried out as in Figure 7, using Cy3-labeled Fab fragments of antibodies to CD19. Single-particle trajectories from a representative cell are plotted using a color-coded temporal scale (left panels). Scale bars: 5 µm. Diffusion coefficients (center panels) and the diameter of maximum displacement (confinement diameter, right panels) over the 10 s period of observation were calculated for each track and cumulative frequency curves are shown. The dots on the curves indicate the median values. ****p<0.0001; Kolmogorov-Smirnov test. (B–E) Primary murine B cells were pre-treated with 100 μM CK-689 or CK-666 for 1 hr and then added to COS-7 cells expressing the single-chain anti-Ig surrogate Ag. Cells were fixed at the indicated time points and stained with an antibody that recognizes the surrogate Ag and with an antibody that recognizes phosphorylated CD19. Representative cells are shown (B). Scale bars: 2 µm. For each B cell, the total fluorescence intensity of clustered pCD19 was calculated. Beeswarm plots in which each dot represents one cell are plotted with the median (red line) and interquartile ranges (red box) for >125 cells per time point from a representative experiment (C). For each cell in (C), the fraction of total pCD19 fluorescence that overlaps with BCR-Ag microclusters was quantified by calculating the Manders’ coefficient (D). For each cell in (C), the total fluorescence intensity of pCD19 that was within BCR-Ag microclusters in cells was quantified (E). ****p<0.0001; ***p<0.001; ns, not significant; Mann-Whitney U test.
Figure 8—figure supplement 1
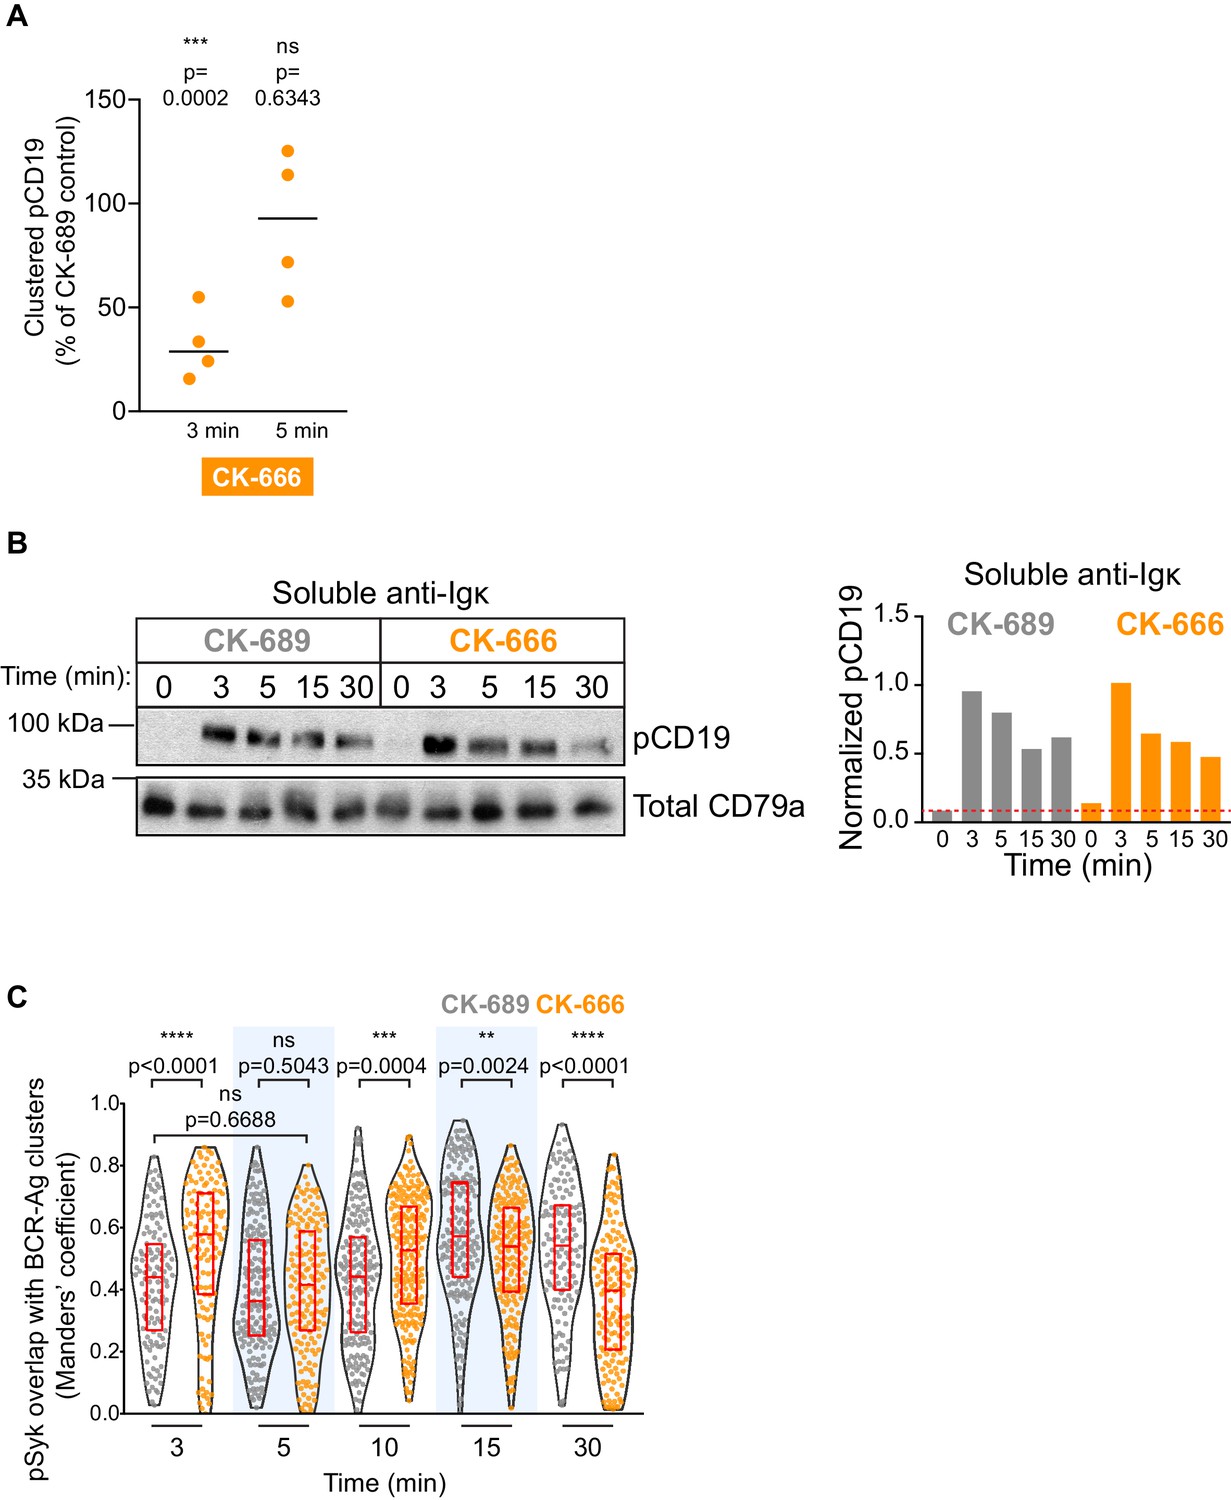
Arp2/3 complex activity increases CD19 phosphorylation in response to membrane-bound Ags.
(A) Primary murine B cells were treated with CK-689 or CK-666 for 1 hr and then added to COS-7 cells expressing the anti-Ig surrogate Ag. The cells were fixed at indicated times and stained for surrogate Ag (anti-Ig) and pCD19. For each B cell, the total fluorescence intensity of clustered pCD19 was calculated. For each condition, the median pCD19 fluorescence intensity was determined for >15 cells per experiment. For each experiment, the median pCD19 fluorescence intensity for CK-666-treated cells was expressed as a percent of the median value for CK-689-treated cells (=100%). This ratio is plotted for four independent experiments. (B) Primary murine B cells were pre-treated with 100 µM CK-689 or CK-666 for 1 hr and then stimulated with 10 µg/ml soluble anti-Ig for the indicated times. pCD19 and total CD79a (loading control) immunoblots are shown (left panels) and the pCD19/total CD79a ratios are graphed (right panels). Dotted red line corresponds to the pCD19/total CD79a ratio value for unstimulated CK-689-treated B cells. Representative data from one of three experiments. See Figure 9—figure supplement 6 for full blots. (C) The co-localization of pSyk with BCR-Ag clusters is not dependent on Arp2/3 complex activity. The co-localization of pSyk and Ag in the cells that were analyzed in Figure 6F was quantified using Manders’ coefficient.
Figure 9 with 6 supplements
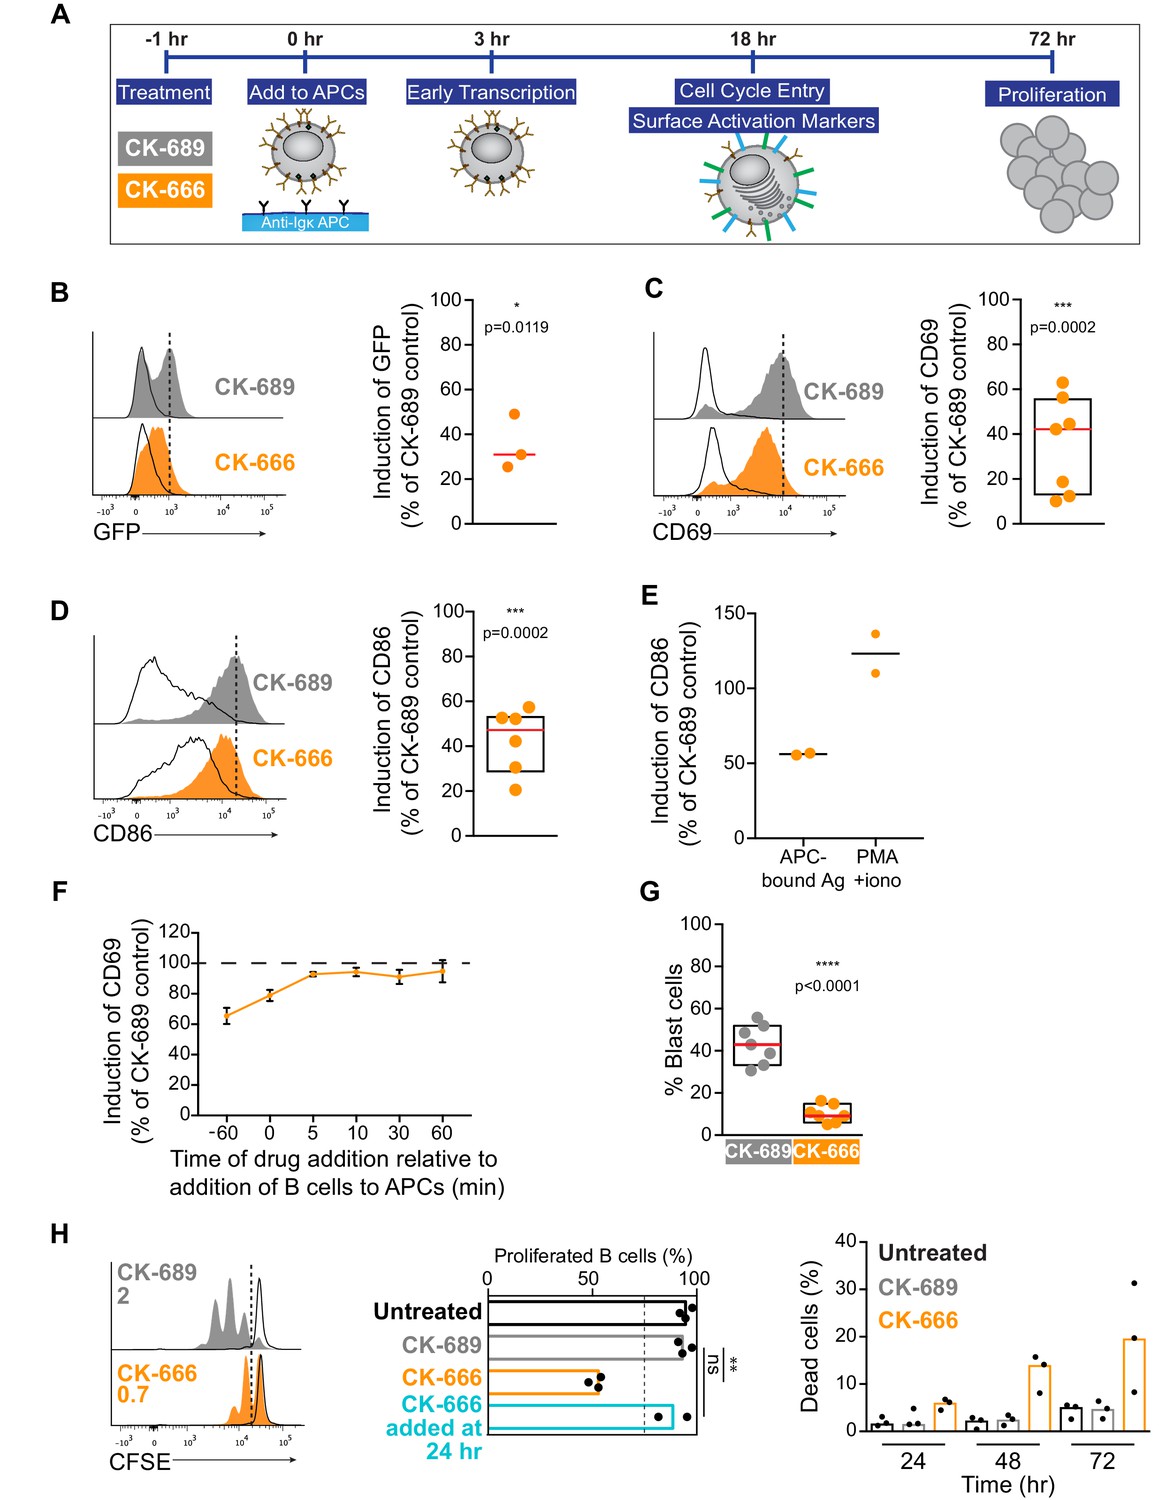
Arp2/3 complex activity is required for B cell activation responses.
(A) Readouts used to assess B cell activation in response to anti-Ig-expressing APCs. Primary murine B cells were pre-treated with CK-689 or CK-666 for 1 hr and then added to the APCs. The CK-689 or CK-666 was present in the co-culture for the entire length of the experiment unless otherwise indicated. (B) Histograms showing GFP fluorescence in primary ex vivo Nur77GFP B cells exposed to anti-Ig-expressing COS-7 APCs (filled curves) or parental COS-7 cells (unfilled curves) for 3 hr. The Ag-induced increase in GFP fluorescence was calculated as the geometric mean for B cells cultured with anti-Ig-expressing APCs (dotted line) minus the geometric mean for B cells cultured with parental COS-7 cells. See Figure 9—figure supplement 1A for gating strategy. The graph shows the Ag-induced increase in GFP fluorescence in CK-666-treated B cells as a percent of the response in CK-689-treated control cells (=100%). Each dot is an independent experiment and the red line is the median. (C,D) Histograms showing CD69 (C) or CD86 (D) upregulation in primary ex vivo C57BL/6J B cells exposed to anti-Ig-expressing APCs (filled curves) or parental COS-7 cells (unfilled curves) for 18 hr. The Ag-induced increases in CD69 or CD86 expression were calculated as in (B). See Figure 9—figure supplement 2 for gating strategy and representative calculations. Graphs show the increase in expression in CK-666-treated B cells as a percent of the response in CK-689-treated controls (=100%). Each dot is an independent experiment. The median (red line) and interquartile ranges (box) are shown. (E) Induction of CD86 expression in response to APCs (calculated as above) or to PMA +ionomycin (geometric mean for stimulated B cells minus geometric mean for unstimulated B cells) in the same experiment. Responses by CK-666-treated B cells are expressed as a percent of those in the CK-689-treated control cells. Results from two experiments are shown along with the average (bar). (F) B cells were pre-treated with CK-689 or CK-666 for 1 hr before being added to anti-Ig-expressing APCs or parental COS-7 cells (−60 min time point). Alternatively, the drugs were added at the same time that the B cells (0 min) were added to the APCs or parental COS-7 cells, or at 5–60 min after initiating the co-culture. The Ag-induced increase in CD69 expression after 18 hr of co-culture was calculated as above and responses by CK-666-treated B cells are expressed as a percent of those in the CK-689-treated control cells. For each point, the average ± range is shown for two experiments. (G) B cells were pre-treated with CK-689 or CK-666 for 1 hr prior to being added to anti-Ig-expressing APCs. After 18 hr of co-culture, the percent of blast cells with increased forward and side scatter was determined by flow cytometry (see Figure 9—figure supplement 2 for gating strategy). Each dot is an independent experiment. The median (red line) and interquartile ranges are shown. (H) CFSE-labeled B cells were pre-treated with CK-689 or CK-666 for 1 hr prior to being cultured with APCs, IL-4, and BAFF for 3 days (filled curves). The unfilled curves depict CFSE dilution at Day 1. Representative data from one experiment is shown on the left and the average number of divisions per cell is indicated. The graph in the center shows the percent of live cells that had proliferated by Day 3. The percent of dead B cells that stained with 7-AAD is shown (right). Where indicated, CK-666 was added 24 hr after initiating the B cell-APC co-culture instead of 1 hr prior. In the graphs, each dot is an independent experiment and the bars indicate medians. ****p<0.0001; ***p<0.001; **p<0.01; *p<0.05; ns, not significant. Two-tailed paired t-test.
Figure 9—figure supplement 1
Gating strategy for GFP expression.
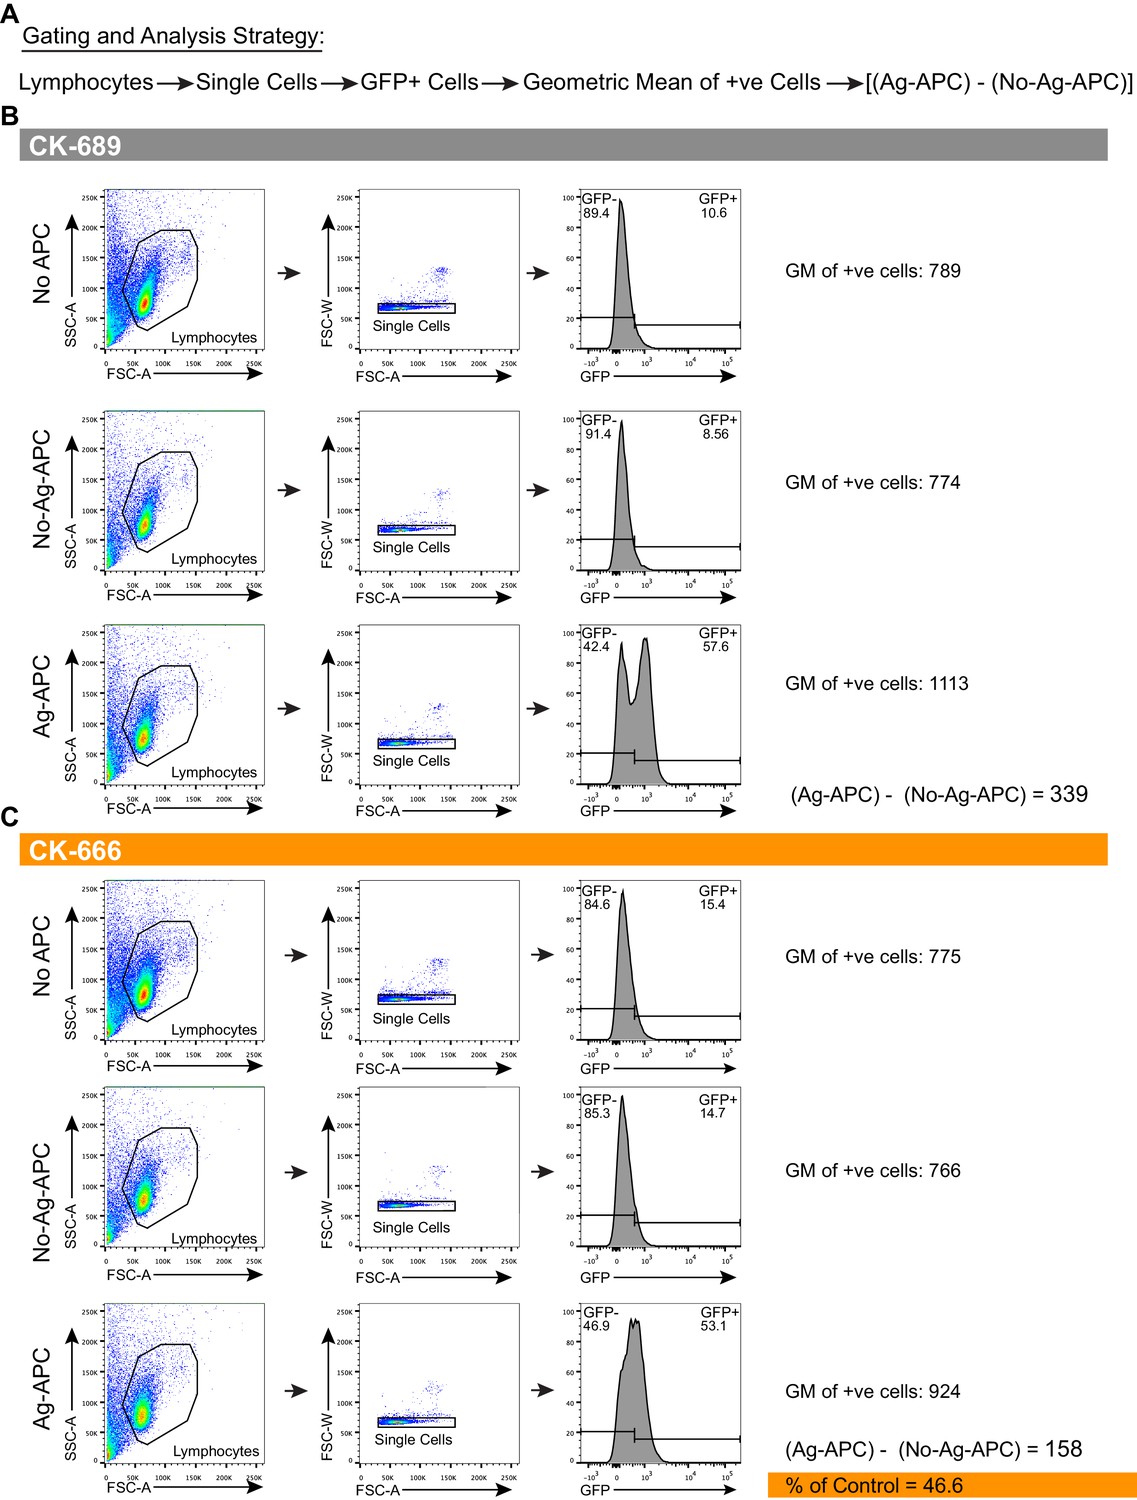
(A) Schematic of gating strategy. In Figure 9B, isolated primary murine B cells from Nur77GFP reporter mice were pre-treated with CK-689 or CK-666 for 1 hr. These cells were then cultured by themselves for 3 hr (No APC) or cultured with either parental COS-7 cells (No-Ag-APC) or COS-7 cells expressing membrane-bound anti-Ig (Ag-APC) for 3 hr. The cells were then analyzed for GFP expression by flow cytometry. Lymphocytes were gated on using SSC-A and FSC-A. Single cells were gated on using FSC-W and FSC-A. The geometric mean (GM) of the GFP fluorescence was calculated for GFP+-gated cells. To quantify Ag-induced increases in GFP fluorescence, the GM for GFP + B cells that had been added to parental COS-7 APCs was subtracted from the GM of GFP+ B cells that had been added anti-Ig-expressing COS-7 APCs. (B,C) Examples of these calculations for CK-689-treated (B) and CK-666-treated (C) B cells are shown. In Figure 9B, the Ag-induced increase in the GFP fluorescence for the CK-666-treated cells value is expressed as a percent of the corresponding value for the CK-689-treated cells.
Figure 9—figure supplement 2

Gating strategy for CD69 and CD86 upregulation and blast cell formation.
(A) Schematic of gating strategy. In Figure 9C–G, primary murine B cells from C57BL/6J mice were either left untreated and cultured by themselves for 18 hr, or were pre-treated for 1 hr with CK-689 or CK-666 and then cultured with either parental COS-7 cells (No-Ag-APC) or COS-7 cells expressing membrane-bound anti-Ig (Ag-APC) for 18 hr. Lymphocytes were gated on using SSC-A and FSC-A. Single cells were gated on using FSC-W and FSC-A. Dead cells were excluded by DAPI staining. The cells were then analyzed for cell surface expression of CD69 or CD86 by flow cytometry. (B) Representative flow cytometry analysis for B cells that were left untreated and not co-cultured with APCs. (C,D) To quantify Ag-induced increases in the expression of CD69 or CD86, the GM of the CD69 +or CD86+B cells that had been added to parental COS-7 APCs was subtracted from the GM of CD69 +or CD86+B cells that had been added anti-Ig-expressing COS-7 APCs. Examples of these calculations for CK-689-treated (C) and CK-666-treated (D) B cells are shown. In Figure 9C–F, the Ag-induced increase in the expression of CD69 or CD86 for the CK-666-treated cells is expressed as a percent of the corresponding value for the CK-689-treated cells. Blast cells were identified as SSC-Ahi and FSC-Ahi cells and the percent of DAPI-negative blast cells is graphed in Figure 9G.
Figure 9—figure supplement 3
Depletion of the Arp2/3 complex in APCs does not affect B cell activation responses.
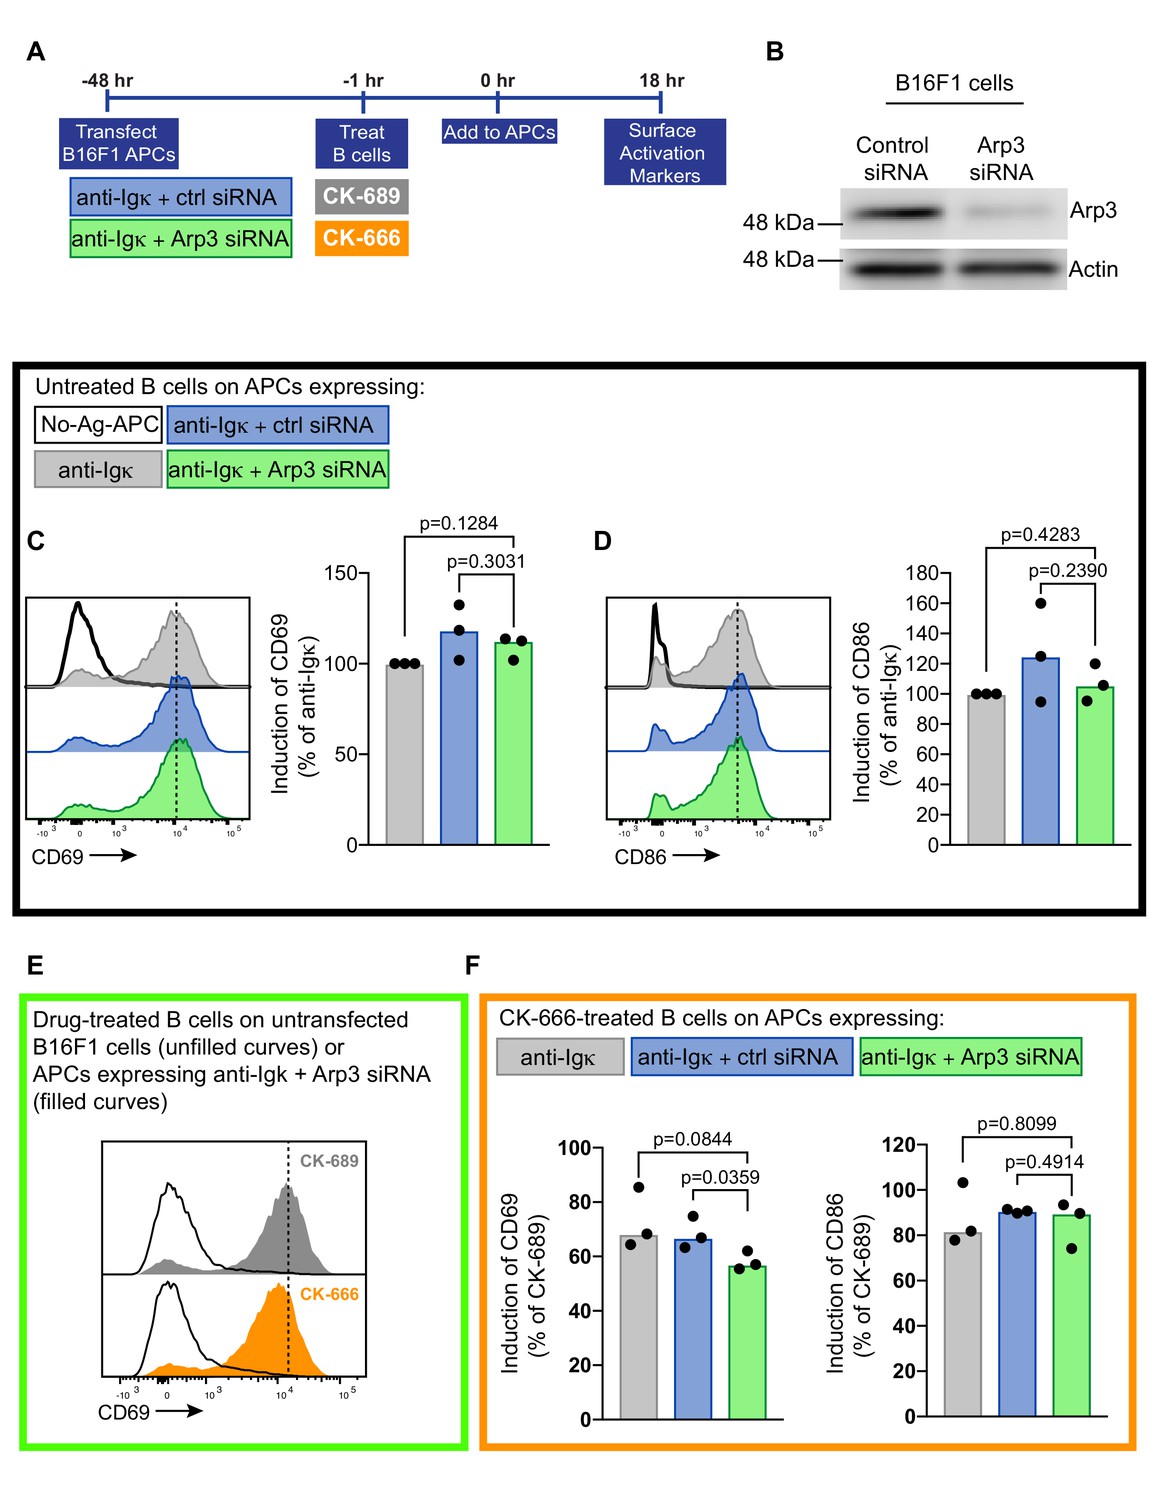
The APCs used were untransfected B16F1 murine melanoma cells (white in panels C-F) or B16F1 cells transfected with the single chain anti-Ig alone (grey), anti-Ig plus control siRNA (blue), or anti-Ig plus Arp3 siRNA (green). (A) Schematic of experimental work flow. (B) B16F1 cells that had been transfected with control siRNA or Arp3 siRNA were analyzed by immunoblotting for Arp3 and actin. Results from one representative experiment are shown. (C,D) Primary murine B cells were added to the different APC populations for 18 hr. Cell surface levels of CD69 (C) and CD86 (D) were quantified by flow cytometry. The Ag-induced increases in CD69 and CD86 fluorescence were calculated as in Figure 9C,D. The data are expressed relative to the increase in CD69 or CD86 expression stimulated by APCs that had been transfected with only the single chain anti-Ig (the MFI for these cells is indicated by the dotted line on the histogram). Each dot represents an independent experiment and bars represent the median. (E) Primary B cells were pre-treated CK-689 (grey) or CK-666 (orange) for 1 hr and added to untrasfected (No-Ag-APC) B16F1 cells (unfilled curves) or B16F1 cells that had been transfected with single chain anti-Ig plus Arp3 siRNA (filled curves). The MFI for CK-689-treated cells that were added to Ag-bearing Arp3 siRNA-transfected APCs is indicated by the dotted line. (F) CK-666-treated B cells were added to B16F1 APCs expressing membrane-bound anti-Ig alone (grey filled bar), anti-Ig plus control siRNA (blue filled bar), or anti-Ig plus Arp3 siRNA (green filled bar). Ag-induced increases in CD69 and CD86 expression were calculated as in Figure 9C,D. Each dot represents one independent experiment and bars represent the median. Two-tailed paired t-test.
Figure 9—figure supplement 4

Washout of CK-666 allows normal APC-induced upregulation of CD69 and cSMAC formation.
(A) Primary murine B cells were treated with CK-689 or CK-666 for 1 hr and then added to COS-7 APCs expressing membrane-bound anti-Ig (Ag-APC) or to parental COS-7 cells (No-Ag-APC). The culture medium was removed at the indicated times after adding the B cells to the APCs and replaced with medium lacking CK-689 or CK-666. For t = 0, the drugs were washed out immediately before adding the B cells to the APCs. After 18 hr, the cells were stained and analyzed for cell surface expression of CD69 as in Figure 9—figure supplement 2. The increase in CD69 expression in CK-666-treated B cells is expressed as a percent of that for cells that were treated with CK-689 in the identical manner. For each point, the average ±range is shown for two experiments. Where no error bars are shown, they were smaller than the symbol. (B–D) A20 D1.3 B cells were pre-treated with 100 µM CK-689 or CK-666 for 1 hr and then added to COS-7 APCs expressing mHEL-HaloTag. These ‘no washout’ cells were fixed after 10 min of B cell-APC contact. Alternatively, B cells were added to the APCs and after 5 min of contact the drug-containing medium was washed out and replaced with fresh medium (Drug washout). After another 5 min, the cells were fixed. Cells were imaged by spinning disk microscopy (C). Representative images are shown. For each cell, the number of clusters required to contain 90% of the Ag fluorescence was calculated and graphed in (D). Each dot represents one cell and the median (red line) and interquartile ranges (black box) are shown for n>25 cells per condition. Representative data from one of two independent experiments. The Mann-Whitney U test was used to calculate p values. ****p<0.0001; ***p<0.001; **p<0.01; *p<0.05. Scale bars: 5 µm.
Figure 9—figure supplement 5
Inhibition of myosin does not affect upregulation of B cell activation markers or cSMAC formation.
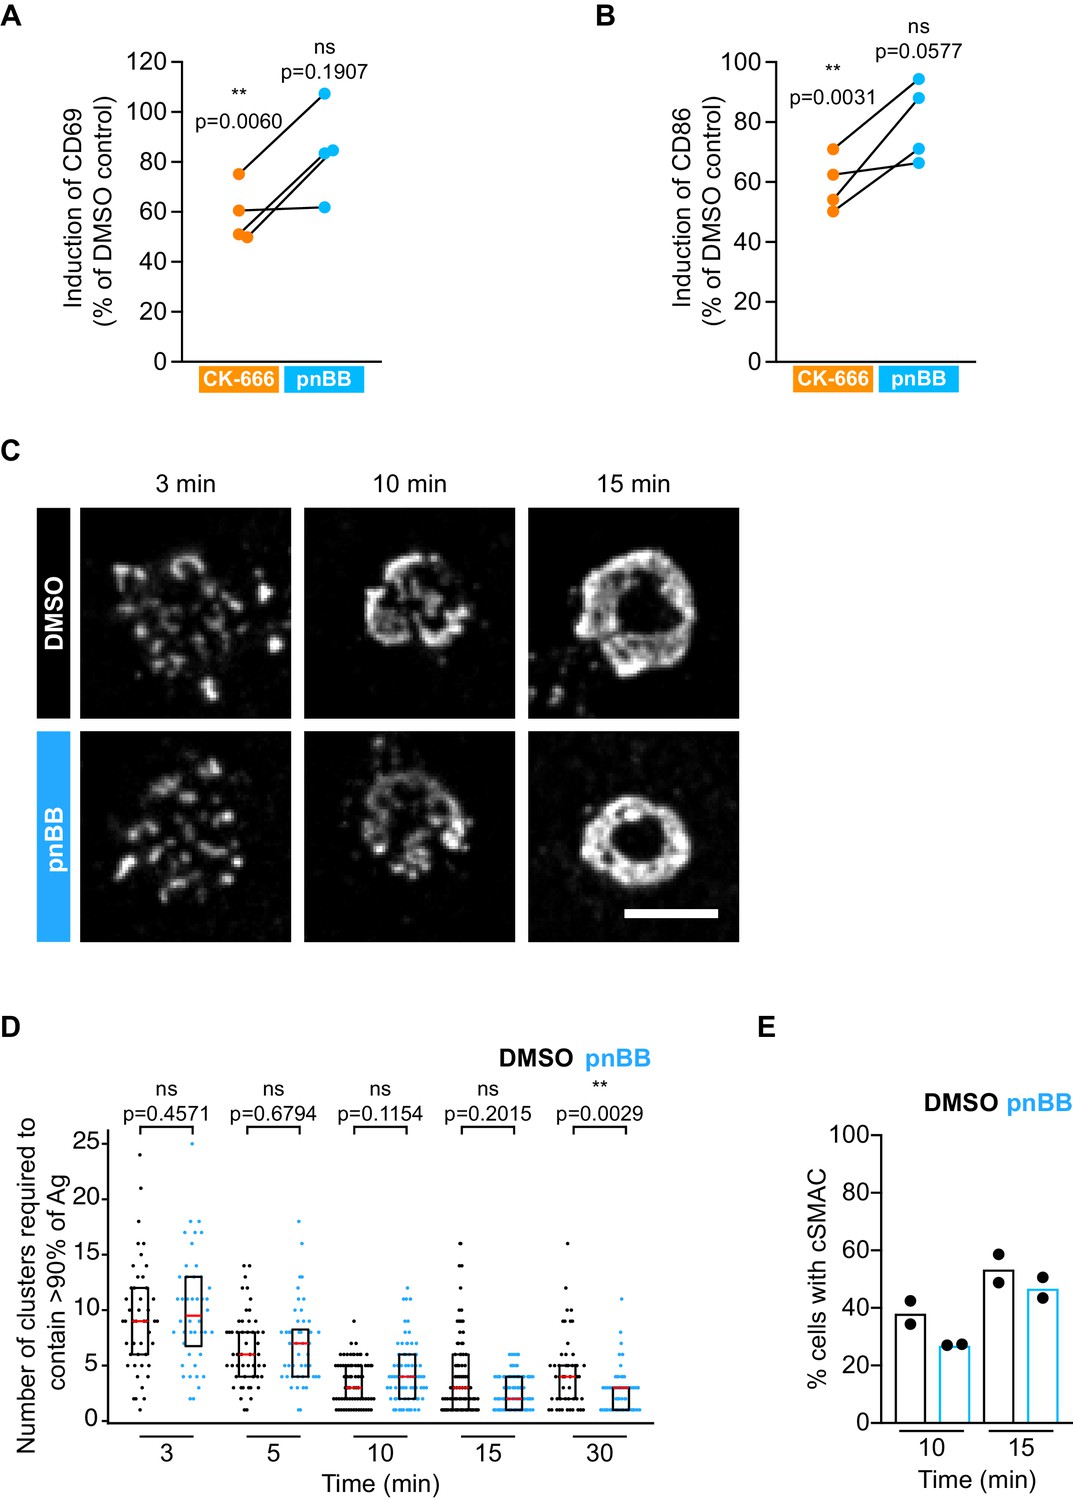
(A,B) Primary murine B cells were pre-treated with DMSO (control), 50 μM pnBB for 30 min or 100 μM CK-666 for 1 hr and then added to COS-7 APCs expressing anti-Ig for 18 hr. Cell surface levels of CD69 (A) and CD86 (B) were quantified by flow cytometry. The Ag-induced increases in CD69 and CD86 fluorescence were calculated as in Figure 9C,D. Graphs show the increase in expression in CK-666-treated and pnBB-treated B cells as a percent of the response in DMSO-treated controls (=100%). Each dot represents an independent experiment. (C–E) A20 D1.3 B cells were pre-treated with DMSO (control) or 50 μM pnBB for 30 min and then added to COS-7 APCs expressing mHEL-HaloTag. The cells were then fixed at the indicated times and imaged by spinning disk microscopy (C). Representative images are shown. For each cell, the number of clusters required to contain >90% of the Ag fluorescence was calculated and graphed in (D). Each dot represents one cell and the median (red line) and interquartile ranges (black box) are shown for n>57 cells per condition. The percent of cells for which > 90% of the total Ag fluorescence intensity was contained in one or two clusters is graphed in (E).
Figure 9—figure supplement 6
Images of full blots.
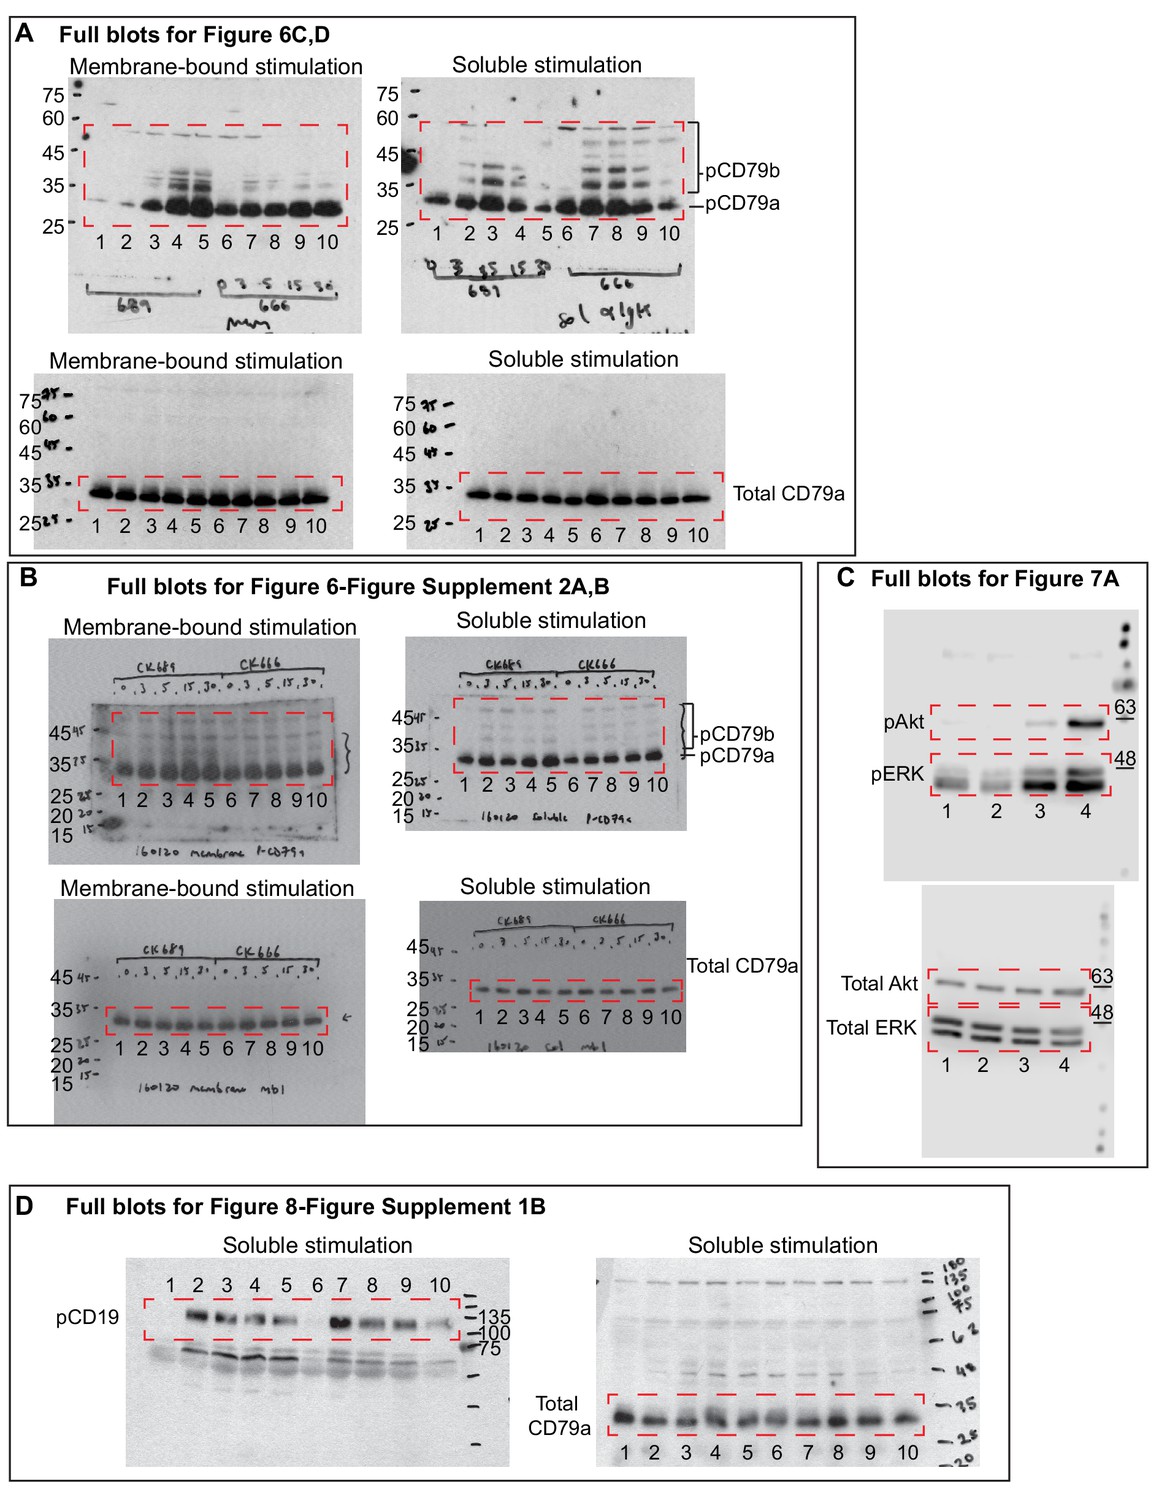
Images of blots that were cropped for presentation in Figure 6, Figure 6—figure supplement 2, Figure 7 and Figure 8—figure supplement 1 are shown. The portions of the blots that were shown in the indicated figures are outlined by a red dashed box. Molecular weight markers are shown in kDa. (A) Full blots for Figure 6C and Figure 6D. Primary murine B cells were pre-treated with CK-689 (lanes 1–5) or CK-666 (lanes 6–10) for 1 hr then stimulated with COS-7 APCs expressing anti-Ig (left) or with soluble anti-Ig (right) for 0, 3, 5, 15 or 30 min. The upper blots were probed with anti-pCD79 antibodies and the lower blots with anti-CD79a antibodies. (B) Full blots for Figure 6—figure supplement 2, an additional independent experiment carried out as in (A). (C) Full blots for Figure 7A. Primary murine splenic B cells were treated with DMSO (lane 1), CK-689 (lane 2), CK-666 (lane 3) for 1 hr, or stimulated with anti-Ig antibodies for 5 min (lane 4). The blots were probed with anti-pAkt plus anti-pERK antibodies (upper blot) or with anti-ERK plus anti-Akt antibodies (lower blot). (D) Full blots for Figure 8—figure supplement 1B. Primary murine B cells were pre-treated with CK-689 (lanes 1–5) or CK-666 (lanes 6–10) for 1 hr then stimulated with soluble anti-IgΚ for 0, 3, 5, 15 or 30 min. The left blot was probed with anti-pCD19 antibodies and the right blot with anti-CD79a antibodies as a loading control.
Videos
Video 1
BCR-Ag microclusters coalesce into a cSMAC at the B cell-APC contact site.
A20 D1.3 B cells were added to COS-7 APCs expressing mHEL-GFP (white) and the B cell-APC contact site was imaged using spinning disk microscopy. Images taken every 12 s. Video playback is 10 frames per second (120X real speed). See also Figure 1B.
Video 2
Dynamic actin-based protrusions and BCR-Ag microclusters at the B cell-APC contact site.
A20 D1.3 B cells expressing F-Tractin-GFP (green) were added to COS-7 APCs expressing mHEL-HaloTag (red) and the B cell-APC contact site was imaged using ISIM. Images taken every 6.6 s. Video playback is 10 frames per second (66X real speed). See also Figure 1C.
Video 3
Actin dynamics in B cells spreading on immobilized anti-IgG antibodies.
A20 B cells expressing F-Tractin-GFP were added to anti-IgG-coated coverslips and the contact site was imaged using a Zeiss Airyscan microscope. Images taken every 2 s. Video playback is 15 frames per second (30X real speed). See also Figure 1F.
Video 4
BCR-Ag microclusters coalesce into a cSMAC in B cells expressing control siRNA.
A20 D1.3 B cells expressing control siRNA were added to COS-7 APCs expressing mHEL-GFP (white) and the B cell-APC contact site was imaged using spinning disk microscopy. Images taken every 12 s. Video playback is 10 frames per second (120X real speed). Four representative cells are shown. The first cell in the video is also shown in Figure 2A. DOI: https://doi.org/10.5061/dryad.3b15k/2
Video 5
Impaired cSMAC formation in B cells expressing Arp3 siRNA.
A20 D1.3 B cells expressing Arp3 siRNA were added to COS-7 APCs expressing mHEL-GFP (white) and the B cell-APC contact site was imaged using spinning disk microscopy. Images taken every 12 s. The video is played back at 10 frames per second (120X real speed). Four representative cells are shown. The first cell in the video is also shown in Figure 2A. DOI: https://doi.org/10.5061/dryad.3bc215k/1
Video 6
BCR-Ag microclusters coalesce into a cSMAC in CK-689-treated B cells.
A20 D1.3 B cells were pre-treated with 100 µM CK-689 for 1 hr and then added to COS-7 APCs expressing mHEL-GFP (white). The B cell-APC contact site was imaged using spinning disk microscopy. Images taken every 12 s. Video playback is 10 frames per second (120X real speed). Four representative cells are shown. The first cell in the video is also shown in Figure 2B. DOI: https://doi.org/10.5061/dryad.3bc215k/3
Video 7
Impaired cSMAC formation in CK-666-treated B cells.
A20 D1.3 B cells were pre-treated with 100 µM CK-666 for 1 hr and then added to COS-7 APCs expressing mHEL-GFP (white). The B cell-APC contact site was imaged using spinning disk microscopy. Images taken every 12 s. Video playback is 10 frames per second (120X real speed). Four representative cells are shown. The first cell in the video is also shown in Figure 2B. DOI: https://doi.org/10.5061/dryad.3bc215k/4
Video 8
Peripheral actin dynamics in CK-689-treated B cells plated on immobilized anti-IgG.
A20 B cells expressing F-Tractin-GFP were pre-treated for 1 hr with 100 µM CK-689 and then added to anti-IgG-coated coverslips. The contact site was imaged using TIRF-SIM. Images taken every 1 s. Video playback is 10 frames per second (10X real speed). See also Figure 3E.
Video 9
Impaired peripheral actin dynamics in CK-666-treated B cells plated on immobilized anti-IgG.
A20 B cells expressing F-Tractin-GFP were pre-treated for 1 hr with 100 µM CK-666 and then added to anti-IgG-coated coverslips. The contact site was imaged using TIRF-SIM. Images taken every 1 s. Video playback is 10 frames per second (10X real speed). See also Figure 3E.
Video 10
Actin and BCR-Ag microcluster dynamics in CK-689-treated B cells interacting with APCs.
A20 D1.3 B cells expressing F-Tractin-GFP (green) were pre-treated for 1 hr with 100 µM CK-689 and then added to COS-7 APCs expressing mHEL-HaloTag (red). The B cell-APC contact site was imaged using ISIM. Images taken every 6.6 s. Video playback is 10 frames per second (66X real speed). See also Figure 4 and Figure 5.
Video 11
Impaired actin and BCR-Ag microcluster dynamics in CK-666-treated B cells interacting with APCs.
A20 D1.3 B cells expressing F-Tractin-GFP (green) were pre-treated for 1 hr with 100 µM CK-666 and then added to COS-7 APCs expressing mHEL-HaloTag (red). The B cell-APC contact site was imaged using ISIM. Images taken every 6.6 s. Video playback is 10 frames per second (66X real speed). See also Figure 4 and Figure 5.
Tables
Key resources table
| Reagent type | Designation | Source or reference | Identifiers | Additional information |
|---|---|---|---|---|
| Sequence-based reagent | ON-TARGETplus Non-Targeting Pool, | Dharmacon | #D-001810-01-05 | |
| Sequence-based reagent | SMARTpool ON-TARGETplus, Dharmacon, | Dharmacon | #L-046642-01-0005 | |
| Other | RPMI-1640 without phenol red | Life Technologies | #32404014 | |
| Antibody | Goat anti-mouse IgG | Jackson ImmunoResearch | #115-005-008 | Coverslip coating 2.5 µg/cm2 |
| Antibody | Goat anti-mouse IgM | Jackson ImmunoResearch | #115-005-020 | Coverslip coating 2.5 µg/cm2 |
| Antibody | Rabbit anti-pZap70(Y319)/pSyk(Y352) | Cell Signaling Technologies | #2701 | Immunofluorescence 1:200 |
| Antibody | Rabbit anti-pCD79a(Y182) | Cell Signaling Technologies | #5173 | Immunofluorescence 1:400, Western blot 1:1000 |
| Antibody | Rabbit anti-CD79a | Gold et al., 1991 | Western blot 1:5000 | |
| Antibody | Rabbit anti-pCD19(Y531) | Cell Signaling Technologies | #3571 | Immunofluorescence 1:200, Western blot 1:1000 |
| Antiboday | Rabbit anti-CD19 | Cell Signaling Technologies | #3574 | Western blot 1:1000 |
| Antibody | Alexa Fluor 488 goat anti-rabbit IgG | Invitrogen | #A-11008 | Immunofluorescence 1:400 |
| Antibody | Alexa Fluor 647 goat anti-rat IgG | Invitrogen | #A-21247 | Immunofluorescence 1:400 |
| Antibody | Goat anti-mouse Ig kappa | Southern Biotech | #1050–01 | Stimulation 20 µg/ml |
| Antibody | Rabbit anti-ACTR3 (Arp3) | Santa Cruz | #sc-15390 | Western blot 1:1000 |
| Antibody | Rabbit anti-Arp2 | Abcam | #ab128934 | Western blot 1:1000 |
| Antibody | Mouse anti-β-actin | Santa Cruz | #sc-47778 | Western blot 1:5000 |
| Antibody | Rabbit anti-p34-Arc/ARPC2 | Millipore | #07–227 | Western blot 1:1000 |
| Antibody | Rabbit anti-pERK | Cell Signaling Technologies | #9101 | Western blot 1:1000 |
| Antibody | Rabbit anti-ERK | Cell Signaling Technologies | #9102 | Western blot 1:1000 |
| Antibody | Rabbit anti-pAkt | Cell Signaling Technologies | #9271 | Western blot 1:1000 |
| Antibody | Rabbit anti-Akt | Cell Signaling Technologies | #9272 | Western blot 1:1000 |
| Antibody | Goat anti-rabbit IgG(H + L)-HRP conjugate | Bio-Rad | #170–6515 | Western blot 1:3000 |
| Antibody | Goat anti-mouse IgM Fab fragment-Cy3-conjugated | Jackson ImmunoResearch | #115-167-020 | Single particle tracking 1 ng/ml |
| Antibody | Rat anti-mouse IgD Fab fragment-Cy3-conjugated | ATCC | #HB-250 (11–26 c) | Fab made by AbLab; SPT 100 ng/ml |
| Antibody | Rat anti-mouse CD19 Fab fragment-Cy3-conjugated | ATCC | #HB-305 (1D3) | Fab made by AbLab; SPT 10 ng/ml |
| Antibody | Rabbit anti-MHC II monoclonal antibody (M5/114) | Millipore | #MABF33 | Coverslip coating 0.25 µg/cm2 |
| Antibody | 2.4G2 monoclonal antibody | ATCC | #HB-197 | 0.25 µg/ml |
| Antibody | Anti-CD69-FITC | eBioscience | #11-0691-82 | Flow cytometry 1:200 |
| Antibody | Anti-CD86-APC | eBioscience | #17-0862-82 | Flow cytometry 1:200 |
| Biological sample (bovine) | Fibronectin | Sigma-Aldrich | #F4759 | Coverslip coating 5 µg/ml |
| Cell line (C. aethiops) | COS-7 | American Type Culture Collection | #CRL-1651; RRID:CVCL_0224 | |
| Cell line (M. musculus) | A20 | American Type Culture Collection | #TIB-208; RRID:CVCL_1940 | |
| Cell line (M. musculus) | A20 D1.3 | Batista and Neuberger, 1998 | F Batista (Ragon Institute, Cambridge, MA) | |
| Cell line (M. musculus) | B16F1 | American Type Culture Collection | #CRL-6323; RRID:CVCL_0158 | |
| Chemical compound, drug | CK-666 | Calbiochem | #CAS 442633-00-3 | 100 µM |
| Chemical compound, drug | CK-689 | Calbiochem | #CAS 170930-46-8 | 100 µM |
| Chemical compound, drug | (S)-nitro-blebbistatin (pnBB) | Cayman Chemicals | #CAS 856925-71-8 | 50 µM |
| Chemical compound, drug | HaloTag Janelia Fluor 549 ligand | Promega | #GA1110 | Cell labeling 1:2000 |
| Chemical compound, drug | HaloTag tetramethylrhodamine ligand | Promega | #G8251 | Cell labeling 1:2000 |
| Chemical compound, drug | Rhodamine phalloidin | Thermo Fisher | #R415 | Immunofluorescence 1:1000 |
| Chemical compound, drug | Alexa Fluor 568-conjugated phalloidin | Thermo Fisher | #A12380 | Immunofluorescence 1:1000 |
| Chemical compound, drug | Alexa Fluor 532-conjugated-phalloidin | Thermo Fisher | #A22282 | Immunofluorescence 1:1000 |
| Chemical compound, drug | ProLong Diamond anti-fade reagent | Thermo Fisher | #P36965 | |
| Chemical compound, drug | ECL detection reagent | GE Life Sciences | #RPN2106 | |
| Chemical compound, drug | CFSE | Invitrogen | #C1157 | Flow cytometry 2 µM |
| Chemical compound, drug | 7-AAD | Thermo Fisher | #A1310 | Flow cytometry 1:1000 |
| Commercial assay or kit | B cell isolation kit | Stemcell Technologies | #19854A | |
| Commercial assay or kit | AMAXA nucleofector kit V | Lonza | #VCA-1003 | |
| Commercial assay or kit | Ingenio electroporation solution | Mirus | #MIR 50117 | |
| Commercial assay or kit | Lipofectamine 3000 | Thermo-Fisher | #L3000008 | |
| Commercial assay or kit | Fab preparation kit | Pierce | #44985 | |
| Genetic reagent (M. musculus) | C57BL/6J | Jackson Laboratories | Stock #000664; MGI:3028467 | |
| Genetic reagent (M. musculus) | C57BL/6-Tg(IghelMD4)4Ccg/J | Jackson Laboratories | Stock #002595; MGI:2384162 | Goodnow et al., 1988 |
| Genetic reagent (M. musculus) | C57BL/6-Tg(Nr4a1-EGFP/cre)820Khog | Moran et al., 2011 | MGI:5007644 | PMID:21606508; K Hogquist (University of Minnesota) |
| Peptide, recombinant protein | BAFF | R&D Systems | #8876-BF-010 | 5 ng/ml |
| Peptide, recombinant protein | IL-4 | R&D Systems | #404 ML-010 | 5 ng/ml |
| Recombinant DNA reagent | F-tractin-GFP | Johnson and Schell, 2009 | ||
| Recombinant DNA reagent | Myosin IIA-GFP | Addgene | #38297 | |
| Recombinant DNA reagent | mHEL-GFP | Batista et al., 2001 | F Batista (Ragon Institute, Cambridge, MA) | |
| Recombinant DNA reagent | mHEL-HaloTag | PMID: 29388105 | M Gold (University of British Columbia) | |
| Recombinant DNA reagent | Single-chain anti-mouse Ig kappa antibody | Ait-Azzouzene et al., 2005 | D Nemazee (Scripps Reseach Institute) | |
| Recombinant DNA reagent | β-Actin-GFP | R Nabi (University of British Columbia) | ||
| Software, algorithm | ISIM deconvolution | PMID: 26210400 | ||
| Software, algorithm | Softworx | Applided Precision Ltd.; GE Healthcare Life Sciences | ||
| Software, algorithm | FIJI | Schindelin et al., 2012 | https://imagej.net/Fiji | |
| Software, algorithm | MATLAB | MathWorks | R2015b | |
| Software, algorithm | MetaMorph | Molecular Devices | ||
| Software, algorithm | ICY | de Chaumont et al., 2012 | http://icy.bioimageanalysis.org | |
| Software, algorithm | FlowJo | Tree Star | v10.5.3 | |
| Software, algorithm | Robust Regression and Outlier Removal (ROUT) | Graphad | v7 | Motulsky and Brown, 2006 |
Additional files
-
Transparent reporting form
- https://doi.org/10.7554/eLife.44574.040
Download links
A two-part list of links to download the article, or parts of the article, in various formats.
Downloads (link to download the article as PDF)
Open citations (links to open the citations from this article in various online reference manager services)
Cite this article (links to download the citations from this article in formats compatible with various reference manager tools)
Arp2/3 complex-driven spatial patterning of the BCR enhances immune synapse formation, BCR signaling and B cell activation
eLife 8:e44574.
https://doi.org/10.7554/eLife.44574


