Conformational and dynamic plasticity in substrate-binding proteins underlies selective transport in ABC importers
- University of Groningen, The Netherlands
- Ludwig-Maximilians-Universität München, Germany
- KU Leuven, Belgium
- University of Melbourne, Australia
- The University of Adelaide, Australia
Figures
Figure 1
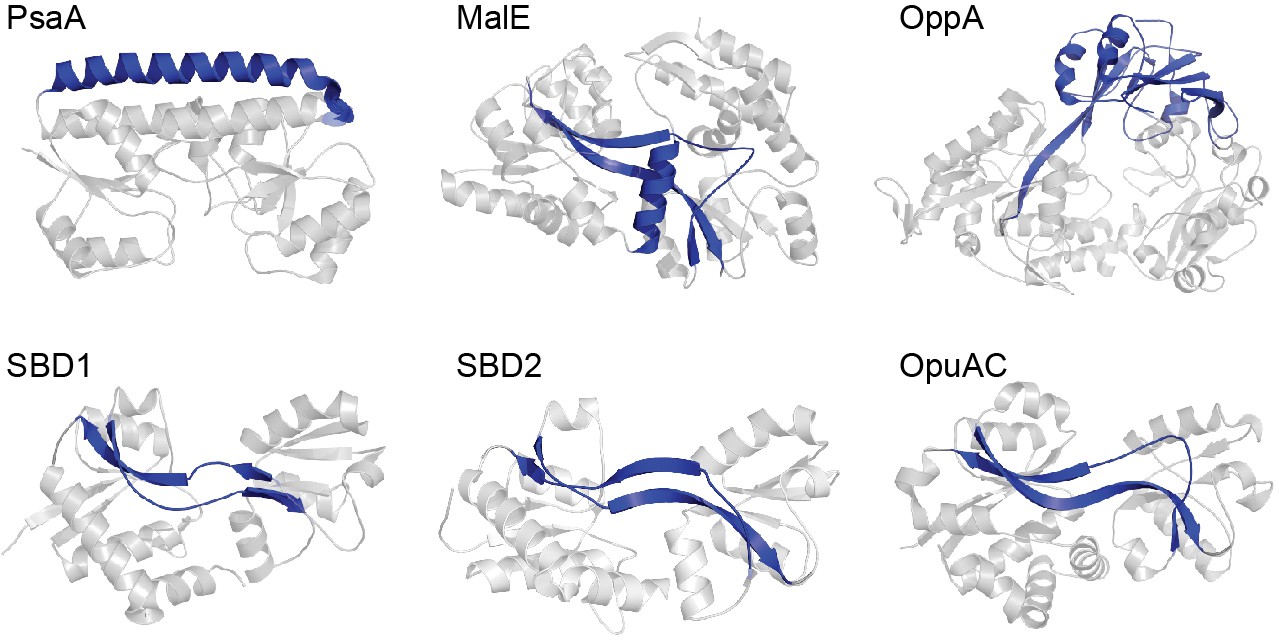
Representative SBPs from different structural clusters, categorized by their hinge region.
X-ray crystal structures of PsaA (3ZK7; cluster A), MalE (1OMP; cluster B), OppA (3FTO; cluster C), OpuAC (3L6G; cluster F), SBD1 (4LA9; cluster F) and SBD2 (4KR5; cluster F) are all shown in the open, ligand-free conformation. Hinge regions are shown in blue and the two rigid lobes in grey. For classification of the proteins in clusters see (Berntsson et al., 2010; Scheepers et al., 2016).
Figure 2 with 4 supplements
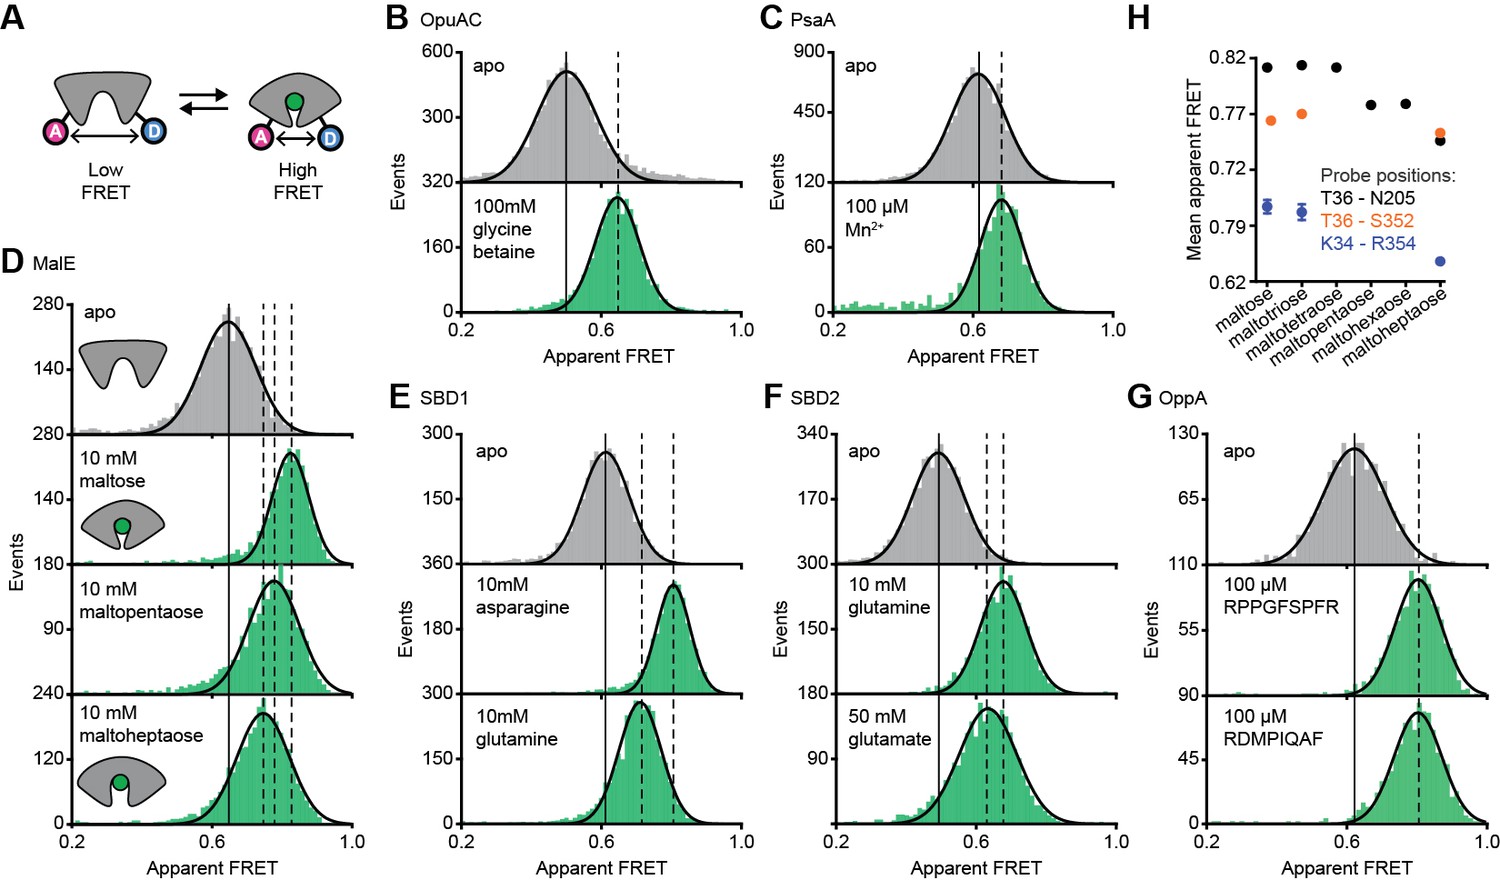
Conformational states of SBPs probed by smFRET reveal multiple active conformations.
(A) Experimental strategy to study SBP conformational changes via FRET. Solution-based apparent FRET efficiency histograms of OpuAC(V360C/N423C) (B), PsaA(V76C/K237C) (C), MalE(T36C/S352C) (D), SBD1(T159C/G87C) (E), SBD2(T369C/S451) (F) and OppA(A209C/S441C) (G) in the absence (grey bars) and presence of different cognate substrates (green bars). The OppA substrates are indicated by one-letter amino acid code. Bars are the data and the solid line a Gaussian fit. The 95% confidence interval of the Gaussian distribution mean is shown in Supplementary file 3, and the interval center is indicated by vertical lines (solid and dashed). (H) Mean of the Gaussian distribution of MalE labeled at T36/S352 (black), T36/N205 (green) or K34/R352 (blue). Error bars indicate 95% confidence interval.
-
Figure 2—source data 1
Apparent FRET efficiency histograms of Figure 2B–G.
- https://doi.org/10.7554/eLife.44652.010
-
Figure 2—source data 2
Apparent FRET efficiency histograms of Figure 2—figure supplement 3.
- https://doi.org/10.7554/eLife.44652.011
Figure 2—figure supplement 1
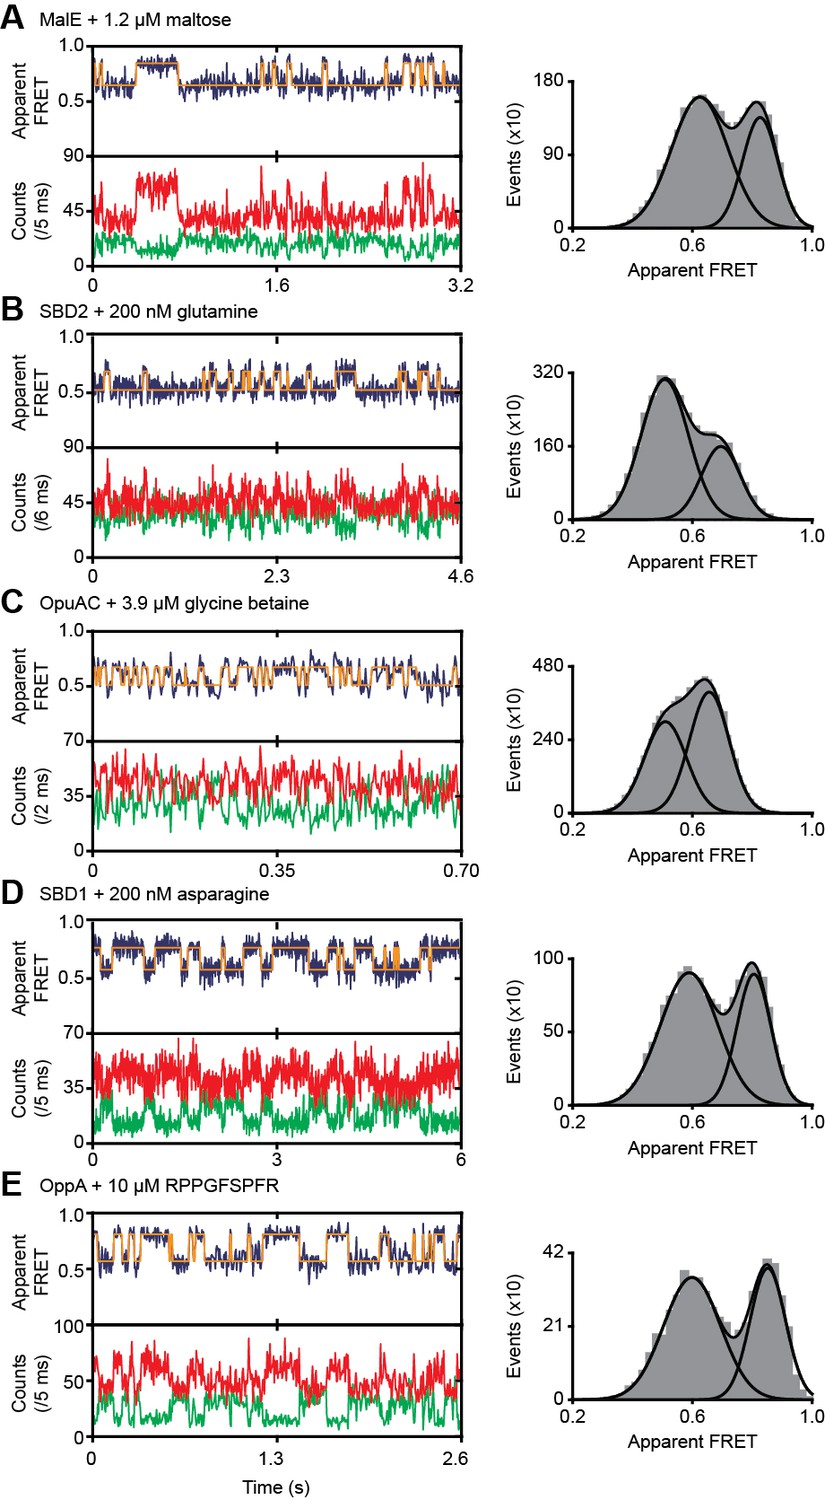
Ligand-induced conformational dynamics of SBPs.
Representative fluorescence trajectories (left) and apparent FRET efficiency histograms from all fluorescence trajectories (right) of MalE(T36C/S352C) (A), SBD2(T369C/S451) (B), OpuAC(V360C/N423C) (C), SBD1(T159C/G87C) (D) and OppA(A209C/S441C) (E) in the presence of the indicated substrate concentration. In the fluorescence trajectories: the top panel shows the calculated apparent FRET efficiency (blue) from the donor (green) and acceptor (red) photon counts as shown in the bottom panels. The most probable state-trajectory of the Hidden Markov Model (HMM) is shown by the orange line. Statistics in Supplementary file 4. The histogram was fitted with two Gaussian distribution to obtain the relative population of the high FRET state . Ignoring the small contribution of intrinsic closing (Figure 3H), we use (one site-binding model), where is the indicated ligand concentration, to determine (see Table 1).
Figure 2—figure supplement 2

OppA uses an induced-fit ligand binding mechanism.
(A) Representative fluorescence trajectories of OppA(A209C/S441C) at different peptide (RPPGFSFR) concentrations; donor (green) and acceptor (red) photon counts. The top panel shows the calculated apparent FRET efficiency (blue) with the most probable state-trajectory of the Hidden Markov Model (HMM) (orange). Dwell time histogram of the high FRET (closed conformation) (B) and low FRET state (open conformation) (C) as obtained from the most probable state-trajectory of the HMM. Bars are the data and the solid line is an exponential fit. Statistics in Supplementary file 4. (D) Average closing rate (rate of low to high FRET state; black) and average lifetime of the ligand-bound conformation (lifetime high FRET state; purple). Data correspond to mean ± s.e.m. and the solid line a linear fit. Slope or intercept of the fit are shown (95% confidence interval). From the fit a KD of 14 ± 5 µM (95% confidence interval) is obtained. (E) Isothermal calorimetry binding isotherm of the titration of OppA with RPPGFSFR, obtaining KD of 5 ± 3 µM (mean ± s.d., n = 3). Points are the data and the solid line a fit to a one site-binding model.
Figure 2—figure supplement 3
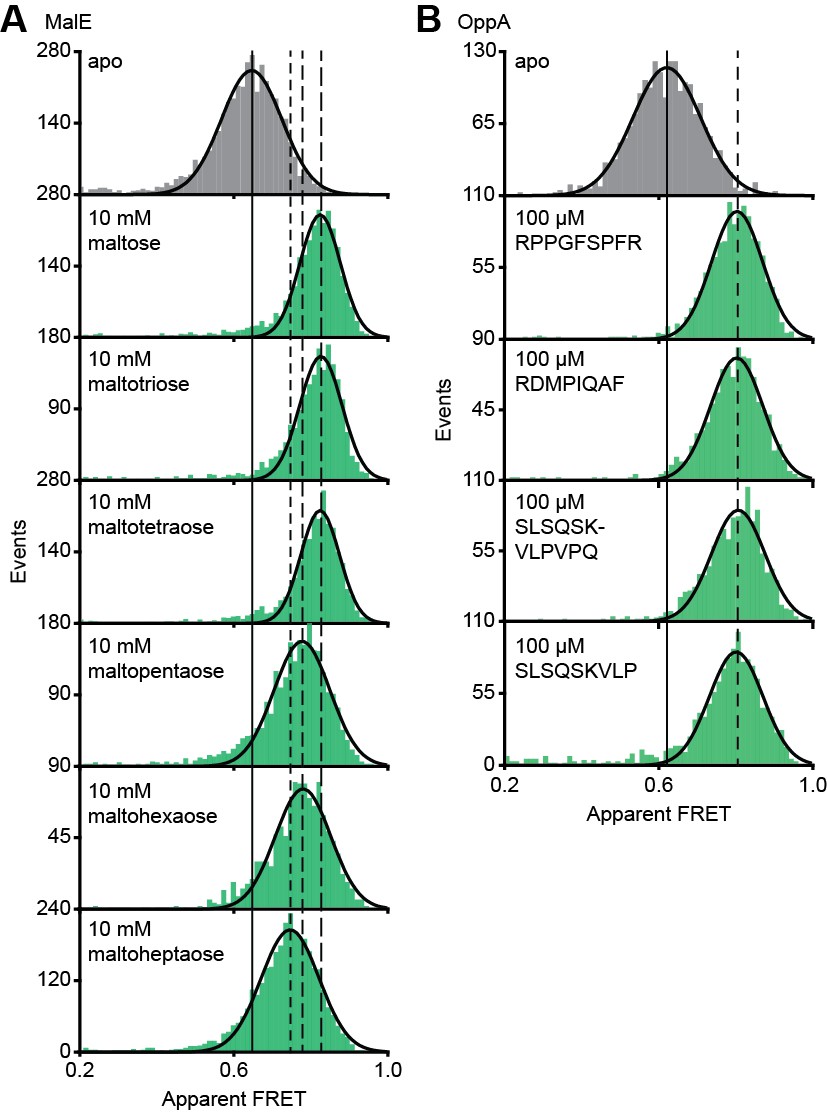
Translocation competent conformation(s) of MalE and OppA.
Solution-based apparent FRET efficiency histogram of MalE(T36C/S352C) (A) and OppA(A209C/S441C) (B) in the absence and presence of different cognate substrates as indicated. The OppA substrates are indicated by one-letter amino acid code. Bars are the data and solid line a Gaussian fit. The 95% confidence interval for the mean of the Gaussian distribution is shown in Supplementary file 3, and the interval center is indicated by vertical lines (solid and dashed).
Figure 2—figure supplement 4
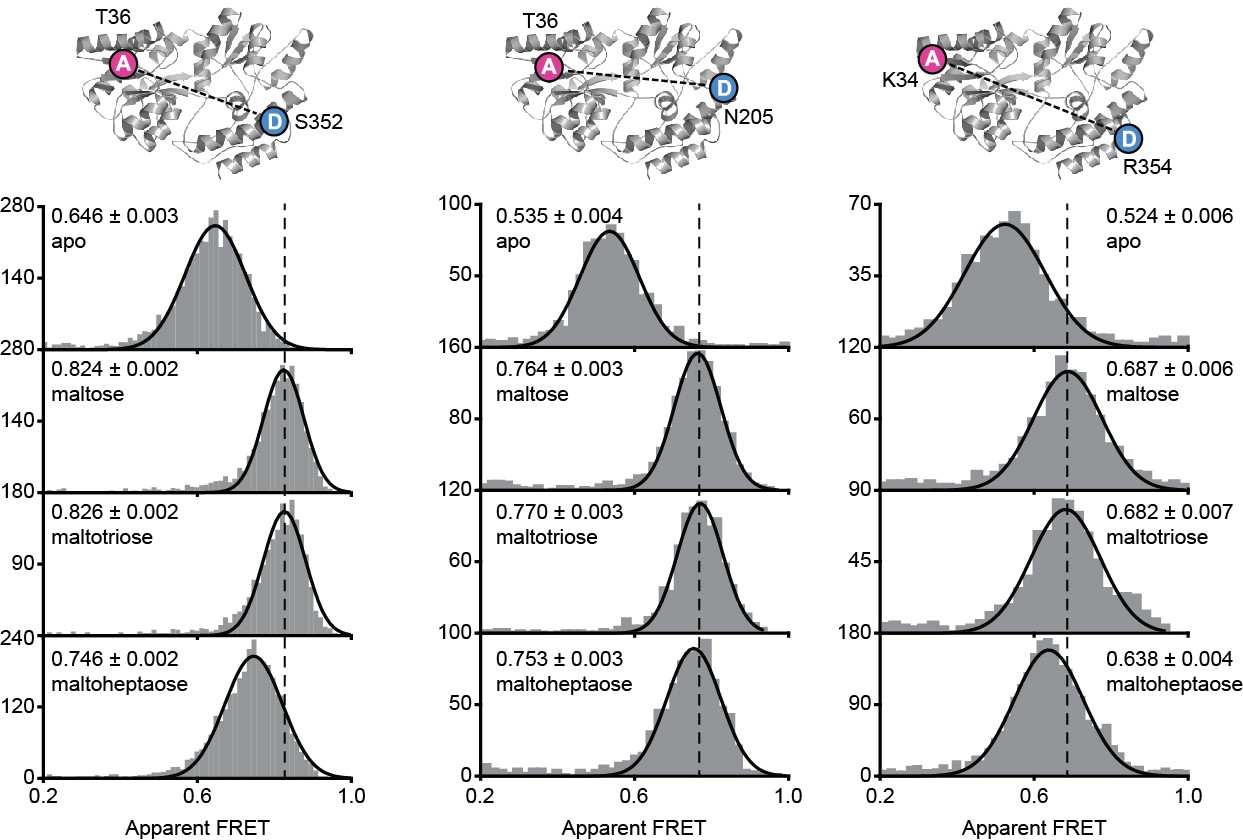
MalE conformations studied by smFRET.
Solution-based apparent FRET efficiency histogram of MalE(T36C/S352C), MalE(T36C/N205C) and MalE(K34C/R354C) in the absence and presence of different cognate substrates as indicated. Bars are the data and the solid line a Gaussian fit. The 95% confidence interval for the mean of the Gaussian distribution is shown in Supplementary file 3, and the interval center is indicated by vertical lines (solid and dashed). Structure of ligand-free MalE (PDB ID: 1OMP) with corresponding donor and acceptor fluorophore positions is indicated above the histograms.
Figure 3 with 2 supplements
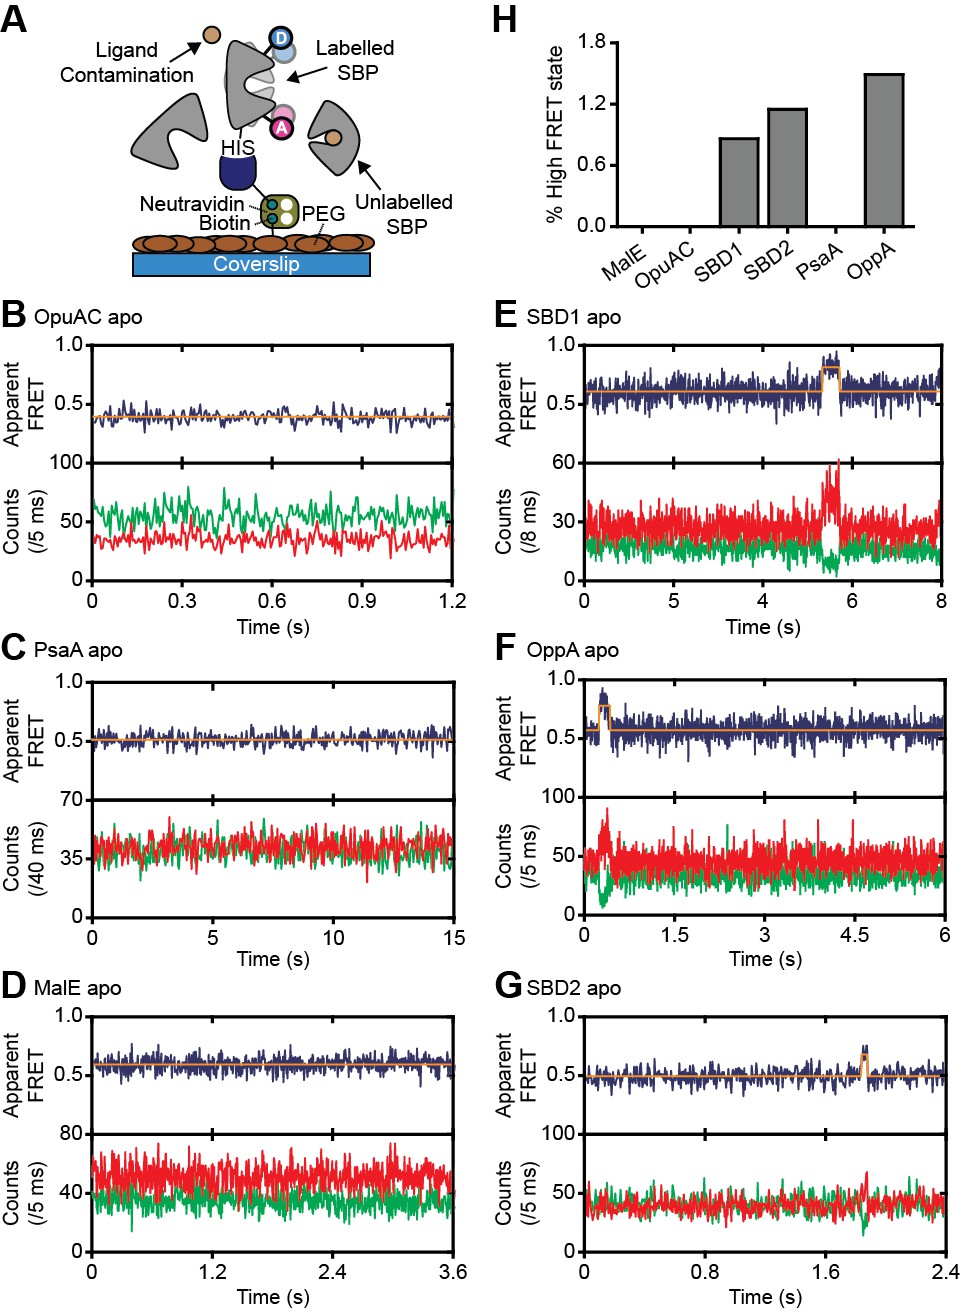
Rare conformational states of ligand-free SBPs.
(A) Schematic of the experimental strategy to study the conformational dynamics of ligand-free SBPs. Representative fluorescence trajectories of OpuAC(V360C/N423C) (B), PsaA(V76C/K237C) (C), MalE(T36C/S352C) (D), SBD1(T159C/G87C) (E), OppA(A209C/S441C) (F) and SBD2(T369C/S451) (G) in the absence of substrate. 10–20 μM of unlabeled protein or 1 mM EDTA (for PsaA) was added to scavenge any ligand contaminations. In all fluorescence trajectories presented in the figure: top panel shows calculated apparent FRET efficiency (blue) from the donor (green) and acceptor (red) photon counts as shown in the bottom panels. Orange lines indicate average apparent FRET efficiency value or most probable state-trajectory of the Hidden Markov Model (HMM). Statistics in Supplementary file 4. (H) Percentage of time a SBP is in the high FRET state. Statistics in Supplementary file 4.
-
Figure 3—source data 1
Donor and acceptor photon counts, apparent FRET efficiency and most probable state-trajectory of the Hidden Markov Model of the traces in Figure 3.
- https://doi.org/10.7554/eLife.44652.015
Figure 3—figure supplement 1
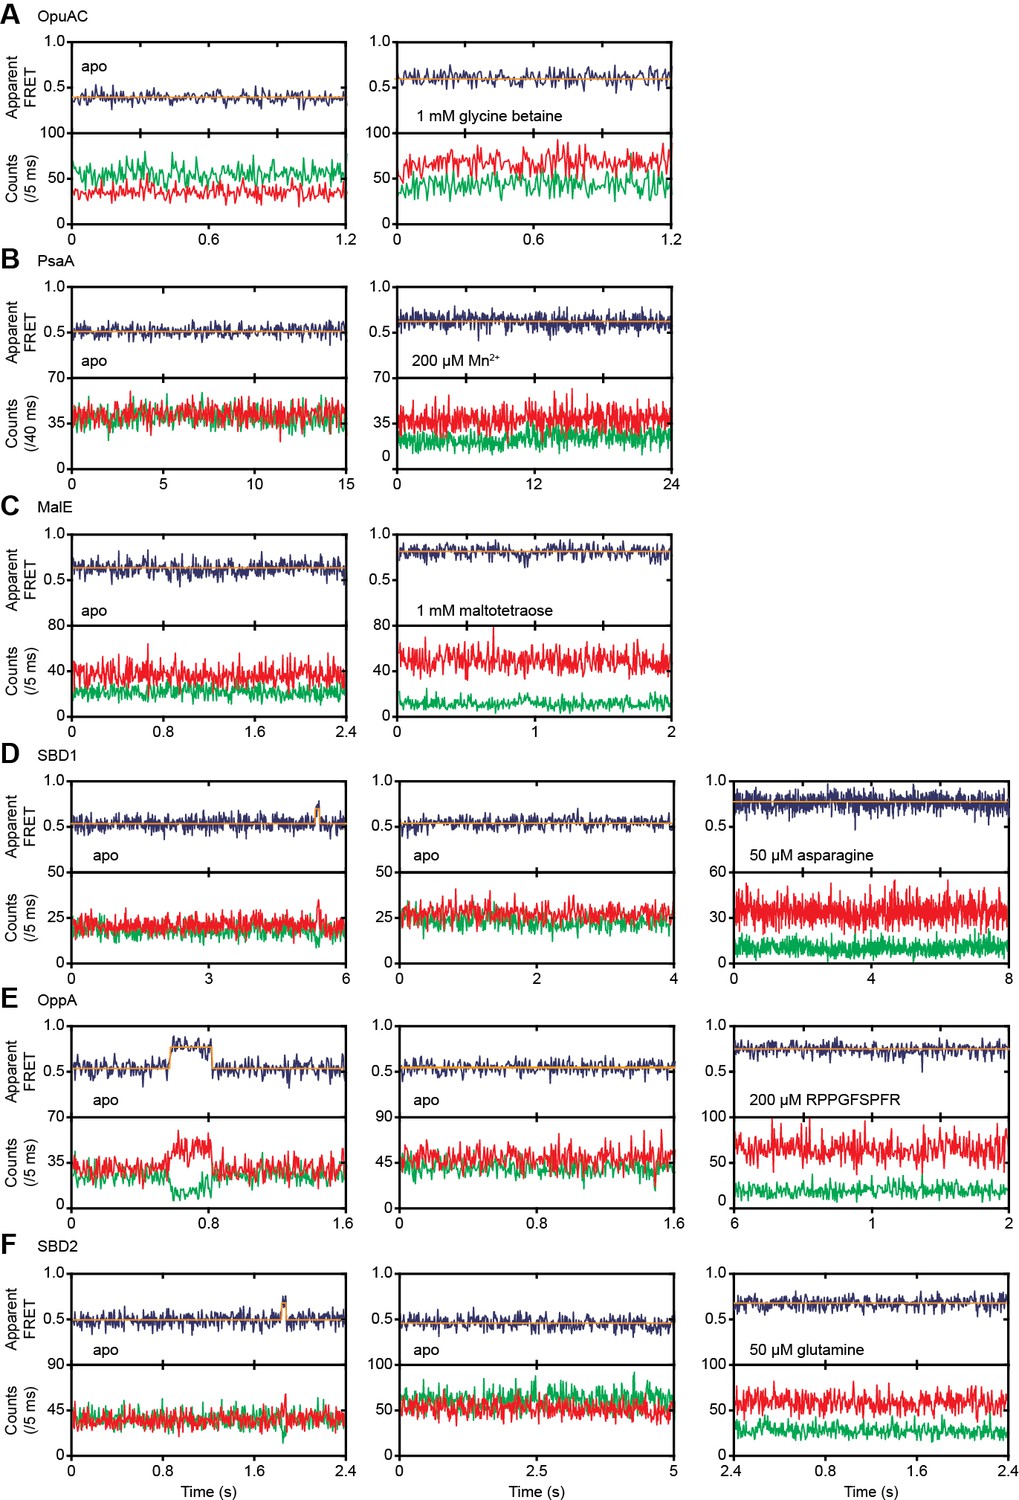
Conformational dynamics of ligand-free and ligand-bound SBPs.
Representative fluorescence trajectories of OpuAC(V360C/N423C) (A), PsaA(V76C/K237C) (B), MalE(T36C/S352C) (C), SBD1(T159C/G87C) (D), OppA(A209C/S441C) (E) and SBD2(T369C/S451) (F) in the absence of substrate and under saturating conditions of ligand, as indicated. In the absence of ligand, 10–20 μM of unlabeled protein or 1 mM EDTA (for PsaA) was added to scavenge any ligand contaminations. The top panels show the calculated apparent FRET efficiency (blue) from the donor (green) and acceptor (red) photon counts as presented in bottom panels. The orange line indicates the average apparent FRET efficiency value or most probable state-trajectory of the HMM. Statistics in Supplementary file 4.
Figure 3—figure supplement 2
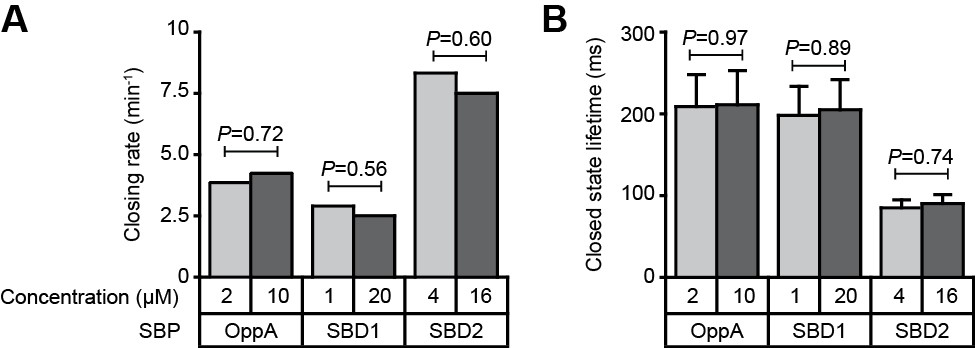
Intrinsic conformational dynamics in the presence of unlabeled protein.
Closing rate (A) and average lifetime of the closed conformation (B) for OppA, SBD1 and SBD2 in the absence of ligand and in the presence of different concentrations of unlabeled protein to scavenge potential ligand contaminations. Examples of the high FRET transitions are shown in Figure 3 and Figure 3—figure supplement 1. Error bars correspond to s.e.m. The closing rate was determined by dividing the total observation time of all molecules by the number of observed high FRET transitions. The statistical significance of the average closed state lifetime was determined by a two-tailed unpaired t-tests. The statistical significance of the closing rate was determined by testing for the difference in the proportion of time-bins in which a low to high FRET transition is made and using the z-test. Statistics in Supplementary file 4.
Figure 4 with 3 supplements
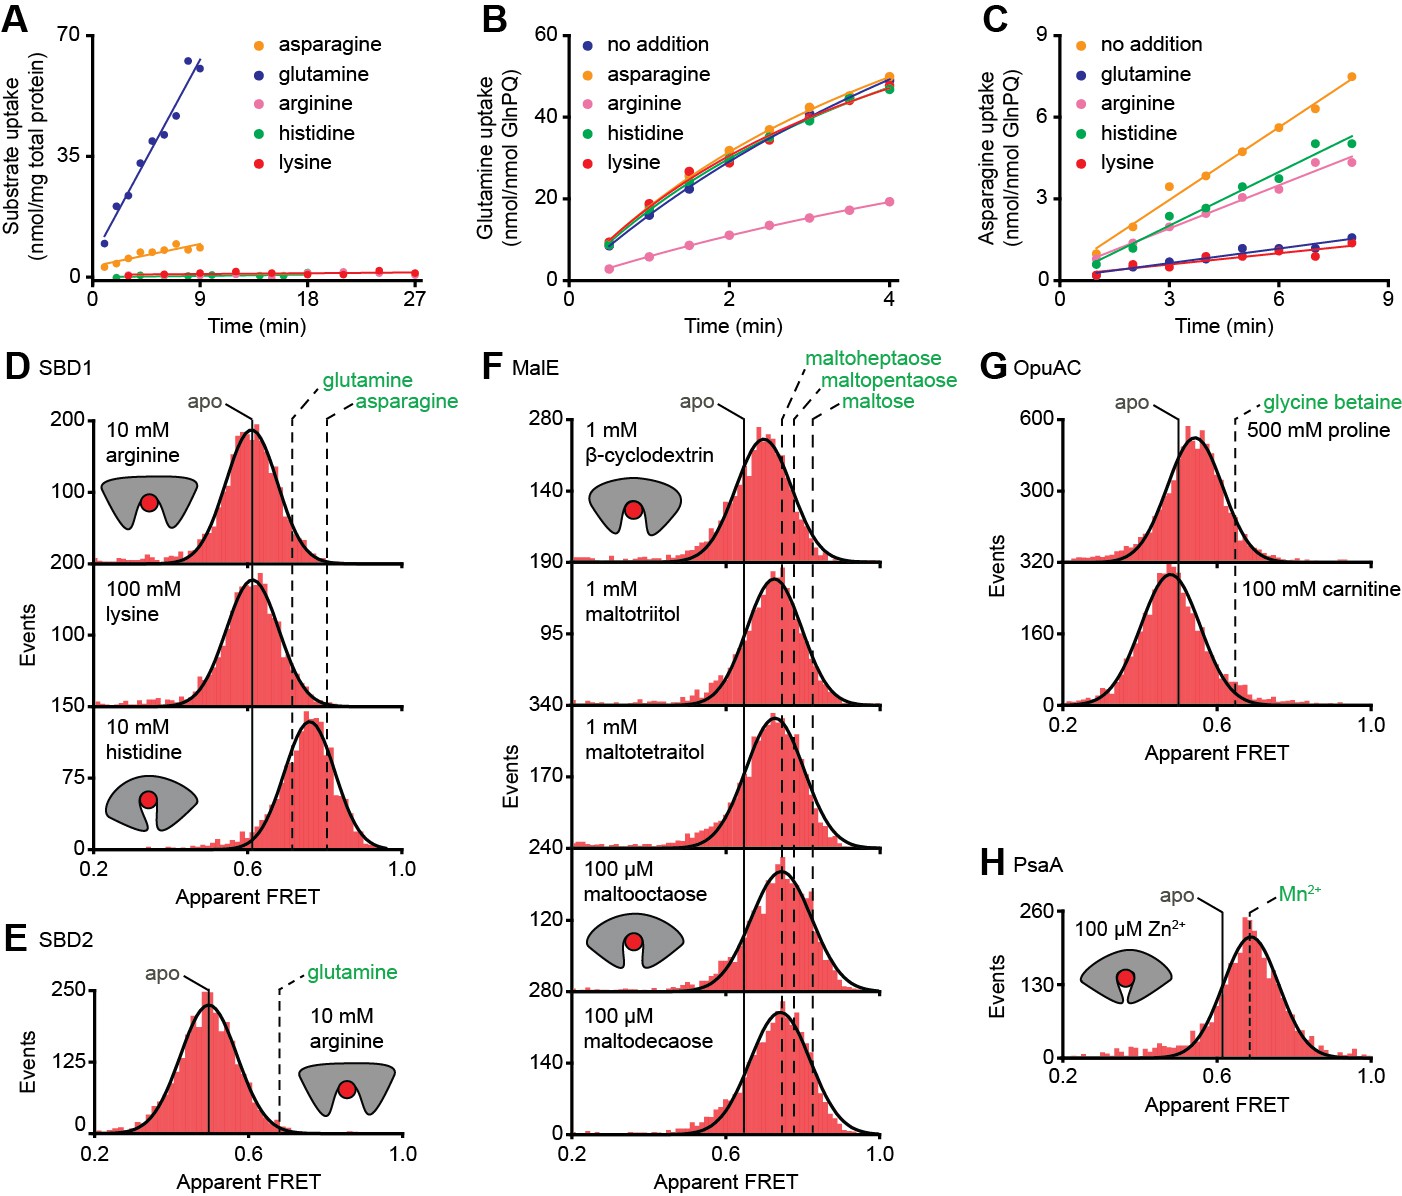
Substrate-specificity of GlnPQ and SBP conformations induced by non-cognate substrates.
(A) Time-dependent uptake [14C]-asparagine (5 μM), [14C]-glutamine (5 μM), [14C]-arginine (100 μM), [14C]-histidine (100 μM) and [3H]-lysine (100 μM) by GlnPQ in L. lactis GKW9000 complemented in trans with a plasmid for expressing GlnPQ; the final amino acid concentrations are indicated between brackets. Points are the data and the solid line a hyperbolic fit. Time-dependent uptake of glutamine (B) and asparagine (C) in proteoliposomes reconstituted with purified GlnPQ (see Materials and methods section). The final concentration of [14C]-glutamine and [14C]-asparagine was 5 μM, respectively; the amino acids indicated in the panel were added at a concentration of 5 mM. Solution-based apparent FRET efficiency histogram of SBD1(T159C/G87C) (D), SBD2(T369C/S451) (E), MalE(T36C/S352C) (F), OpuAC(V360C/N423C) (G) and PsaA(V76C/K237C) (H) in the presence of non-cognate (red bars) substrates as indicated. Bars are the data and solid line a Gaussian fit. The 95% confidence interval for the distribution mean is shown in Supplementary file 3. The interval center is indicated by vertical lines (solid and dashed).
-
Figure 4—source data 1
Apparent FRET efficiency histograms of Figure 4D–H.
- https://doi.org/10.7554/eLife.44652.020
Figure 4—figure supplement 1
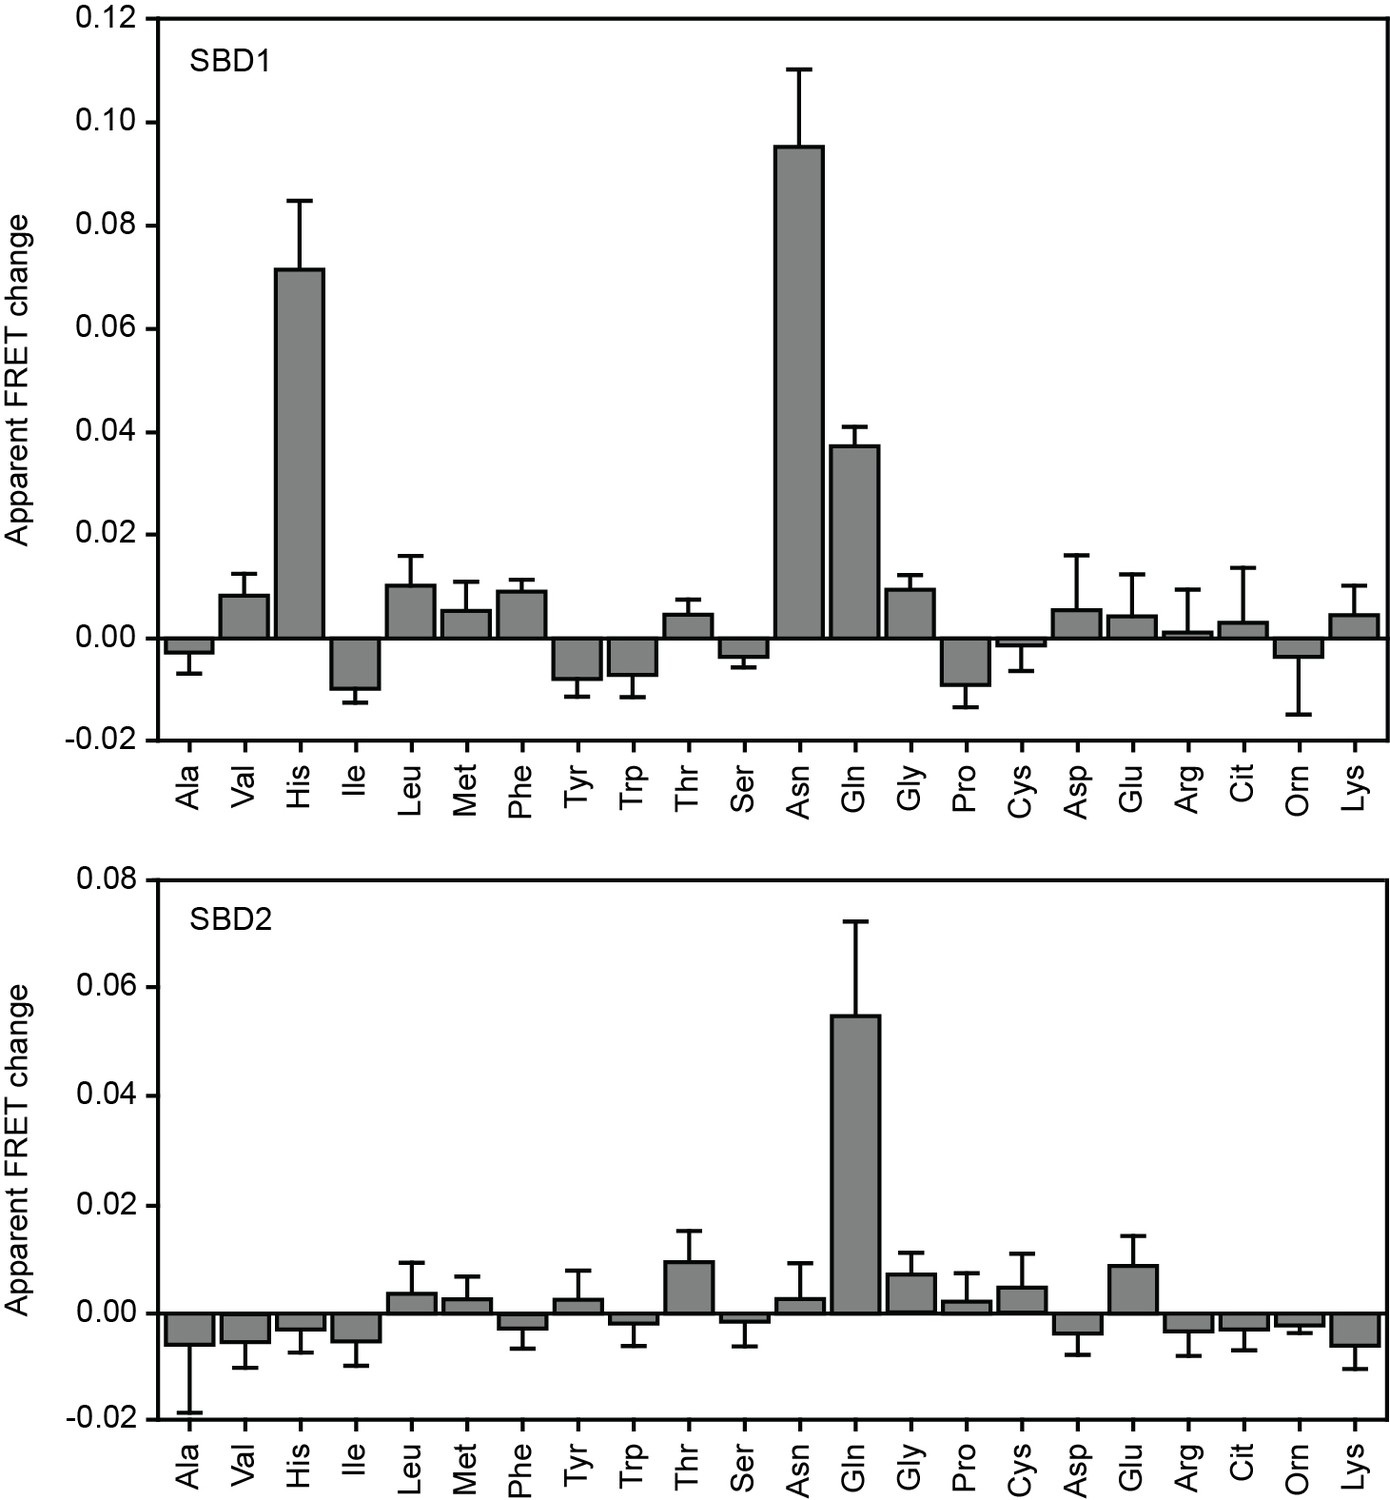
Substrate binding of SBD1 and SBD2 studied by ensemble FRET.
The mean apparent FRET change of SBD1 (top) and SBD2 (bottom) in the presence of 5 mM of the indicated amino acids relative to their absence; measurements were performed in 50 mM KPi, 50 mM KCl, pH 7.4. Amino acids are indicated by their three letter abbreviation. Data correspond to mean ± s.d. of the apparent FRET change of duplicate measurements with the same labeled protein sample.
Figure 4—figure supplement 2

Non-cognate substrate binding by SBD1 and SBD2.
Solution-based apparent FRET efficiency histograms of SBD1(T159C/G87C) (A and C) and SBD2(T369C/S451) (B) in the presence of different ligand concentrations as indicated. Bars are the data and the solid lines a fit to a mixture model with two Gaussian distributions or a fit with a single Gaussian distribution. The mean of the Gaussian distributions was obtained from the extreme conditions and fixed in the mixture model. Fraction of SBD1 bound to asparagine (D), SBD2 bound to glutamine (E) and SBD1 bound to histidine (F). Points are the data and the solid line a fit to a one site-binding model. (G) Estimated dissociation constants KD as obtained from the fit. Error bars represent 95% confidence interval.
Figure 4—figure supplement 3
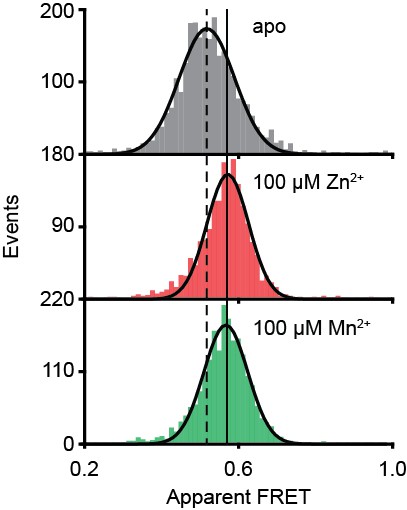
PsaA(E74C/K237C) conformational changes probed by smFRET.
Solution-based apparent FRET efficiency histogram of PsaA(E74C/K237C) in the presence and absence of metals as indicated. Bars are the data and solid line a Gaussian fit. The 95% confidence interval for the distribution mean is shown in Supplementary file 3. The interval center is indicated by vertical lines (solid and dashed).
Figure 5
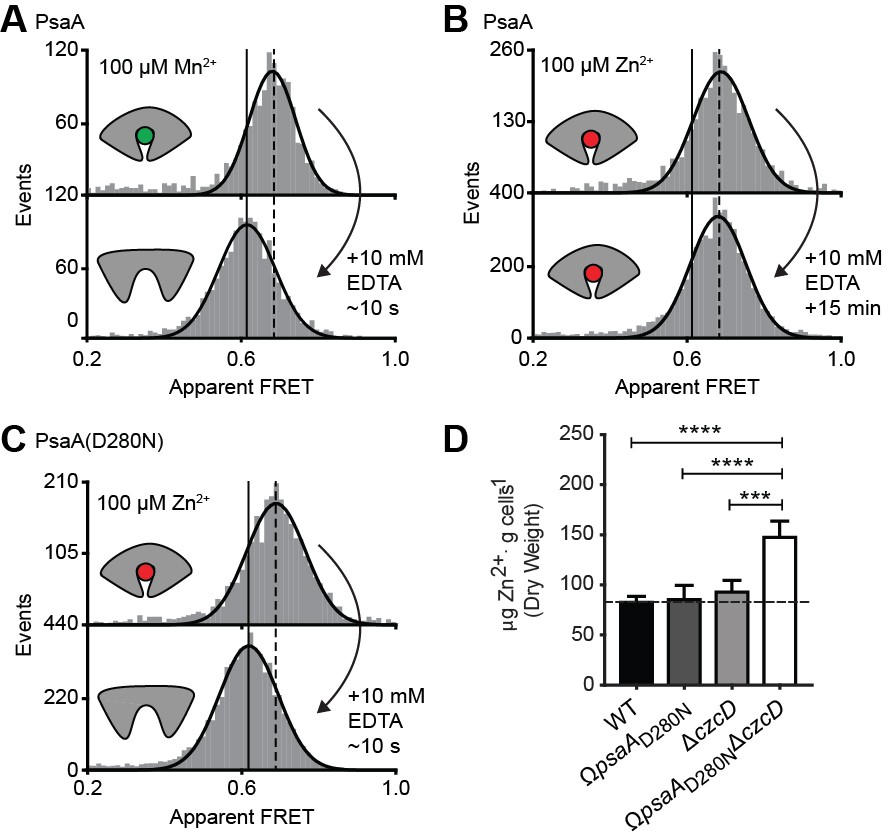
Opening transition in PsaA dictates transport specificity.
Solution-based apparent FRET efficiency histograms of PsaA(V76C/K237C) in the presence of Mn2+ (A) or Zn2+ (B) and PsaA(D280N) in the presence of Zn2+ (C) upon addition of 10 mM EDTA and incubated for the indicated duration. Bars are the data and the solid line a Gaussian fit. The 95% confidence interval for the mean of the Gaussian distribution can be found in Supplementary file 3, and the interval center is indicated by vertical lines (solid, metal-free and dashed, metal-bound). (D) Whole cell Zn2+ accumulation of S. pneumoniae D39 and mutant strains in CDM supplemented with 50 µM ZnSO4 as determined by ICP-MS. Data correspond to mean ± s.d. μg Zn2+.g−1 dry cell weight from three independent biological experiments. Statistical significance was determined by one-way ANOVA with Tukey post-test (***p < 0.005 and ****p < 0.0001).
Figure 6 with 3 supplements
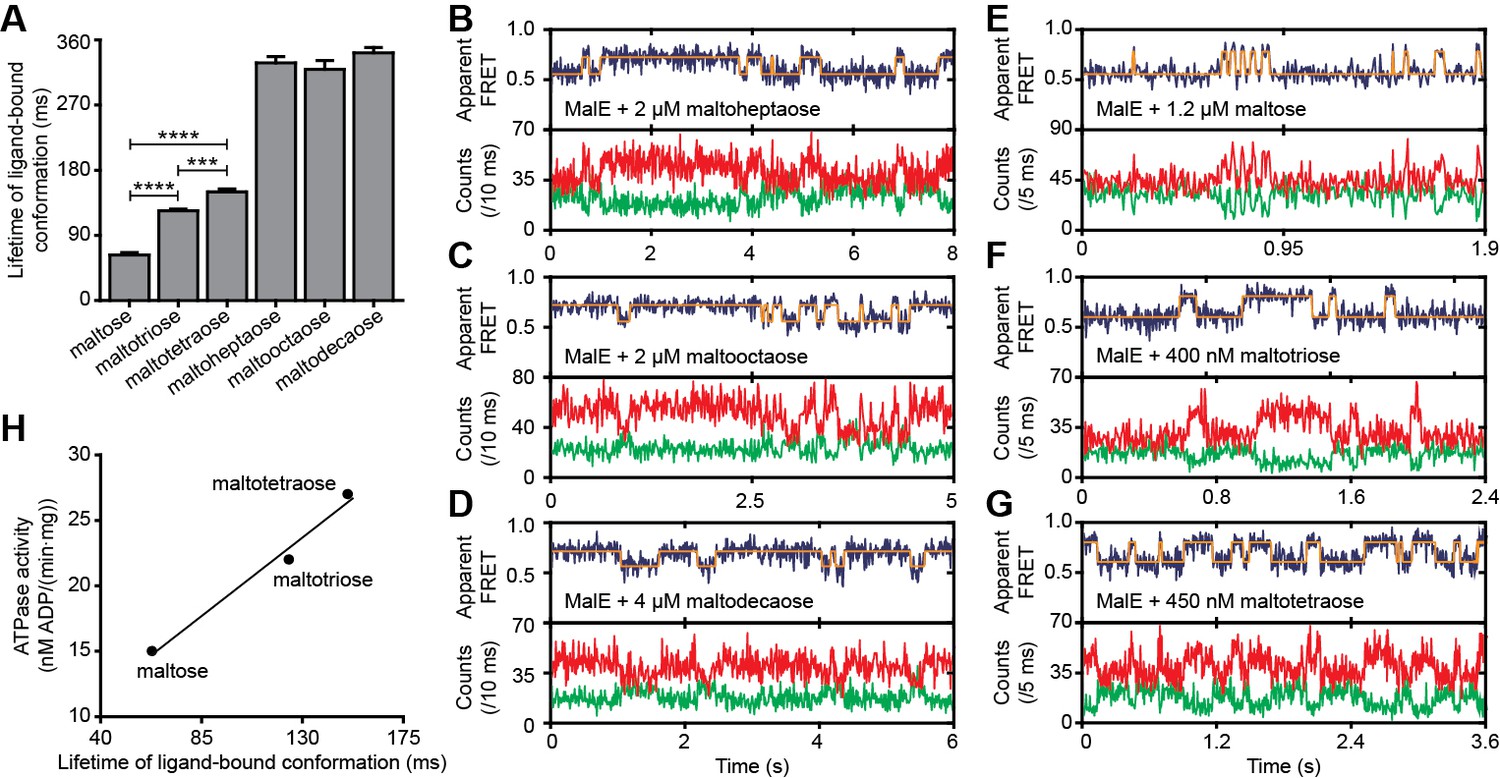
Lifetime of MalE ligand-bound conformations and relation to activity.
(A) Mean lifetime of the ligand-bound conformations of MalE, obtained from all single-molecule fluorescence trajectories in the presence of different maltodextrins as indicated. Data corresponds to mean ± s.e.m. Data in Figure 6—figure supplement 2. Statistical significance was determined by two-tailed unpaired t-tests (***p < 0.005 and ****p < 0.0001). (B, C, D, E, F and G) Representative fluorescence trajectories of MalE(T36C/S352C) in the presence of different substrates as indicated. In all fluorescence trajectories presented: top panel shows calculated apparent FRET efficiency (blue) from the donor (green) and acceptor (red) photon counts as shown in the bottom panels. Most probable state-trajectory of the Hidden Markov Model (HMM) is shown (orange). (H) Published ATPase activity (Hall et al., 1997a) linked to the lifetime of the closed MalE conformation induced by transport of different cognate substrates as indicated. Points are the data and the solid line a simple linear regression fit.
-
Figure 6—source data 1
Lifetimes of the high FRET state of the data shown in Figure 6A and Figure 6—figure supplement 2.
- https://doi.org/10.7554/eLife.44652.026
-
Figure 6—source data 2
Donor and acceptor photon counts, apparent FRET efficiency and most probable state-trajectory of the Hidden Markov Model of the traces in Figure 6B–G.
- https://doi.org/10.7554/eLife.44652.027
-
Figure 6—source data 3
Lifetimes of the high FRET state of the data shown in Figure 6—figure supplement 3B.
- https://doi.org/10.7554/eLife.44652.028
Figure 6—figure supplement 1
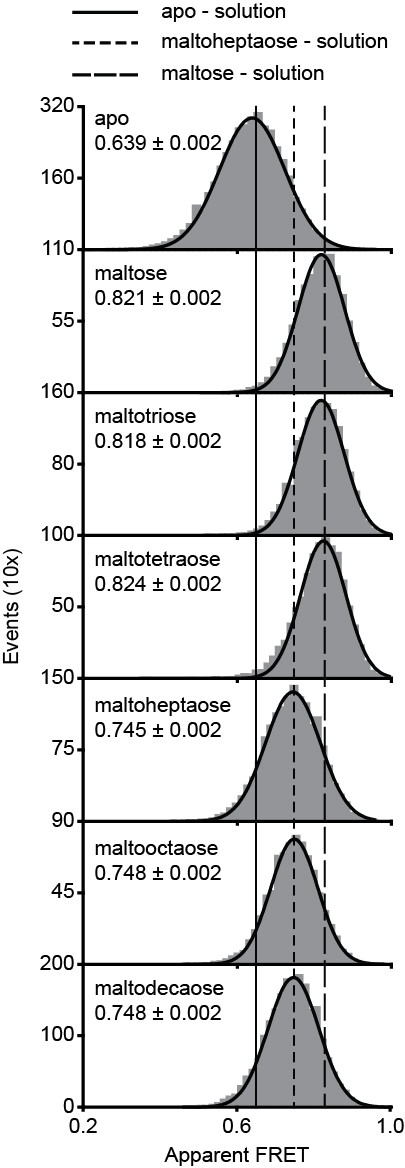
Surface-based smFRET histogram of MalE.
(A) Surface-based apparent FRET efficiency histogram of MalE(T36C/S352C) in the presence of different maltodextrin substrates as indicated. From the probable state-trajectory of the Hidden Markov Model (HMM), the apparent FRET efficiencies of the low (ligand-free conformation) and high FRET state (closed ligand-bound conformation) were obtained. The final histogram was constructed from all fluorescence trajectories. Representative fluorescence trajectories are shown in Figure 6B–G. Bars are the data and solid line a Gaussian fit. The 95% confidence interval for the distribution mean is indicated. The average apparent FRET efficiency of the solution-based smFRET measurements (Figure 2—figure supplement 3A) is indicated by vertical lines.
Figure 6—figure supplement 2
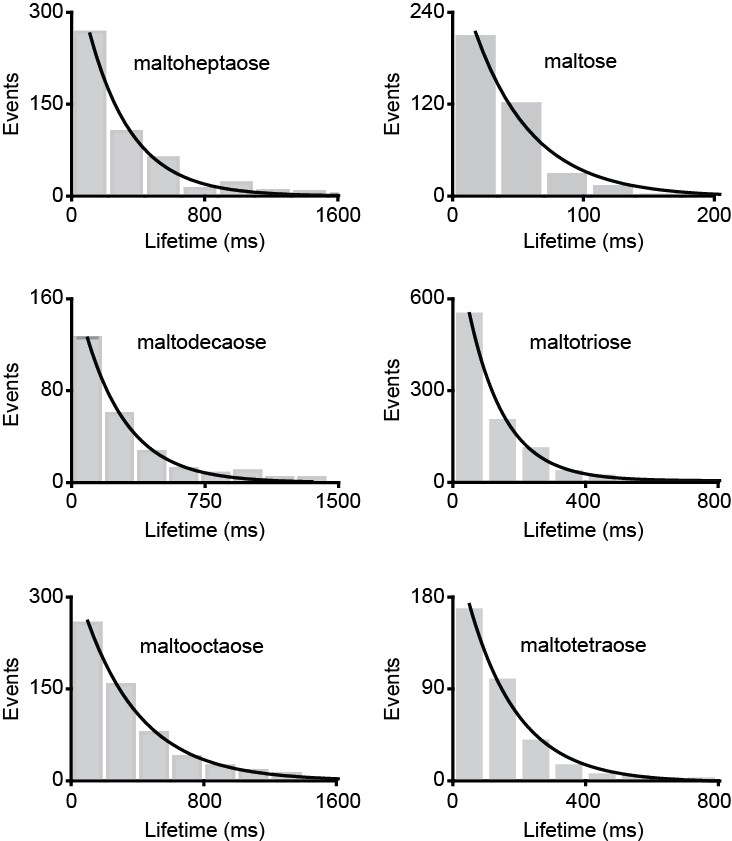
Lifetime distribution of the ligand-bound conformations of MalE.
Dwell time histogram of the high FRET (closed ligand-bound conformation) as obtained from the most probable state-trajectory of the Hidden Markov Model (HMM) of all molecules per condition as shown in Figure 6B–G. Grey bars are the data and the solid line an exponential fit. Statistics in Supplementary file 4.
Figure 6—figure supplement 3
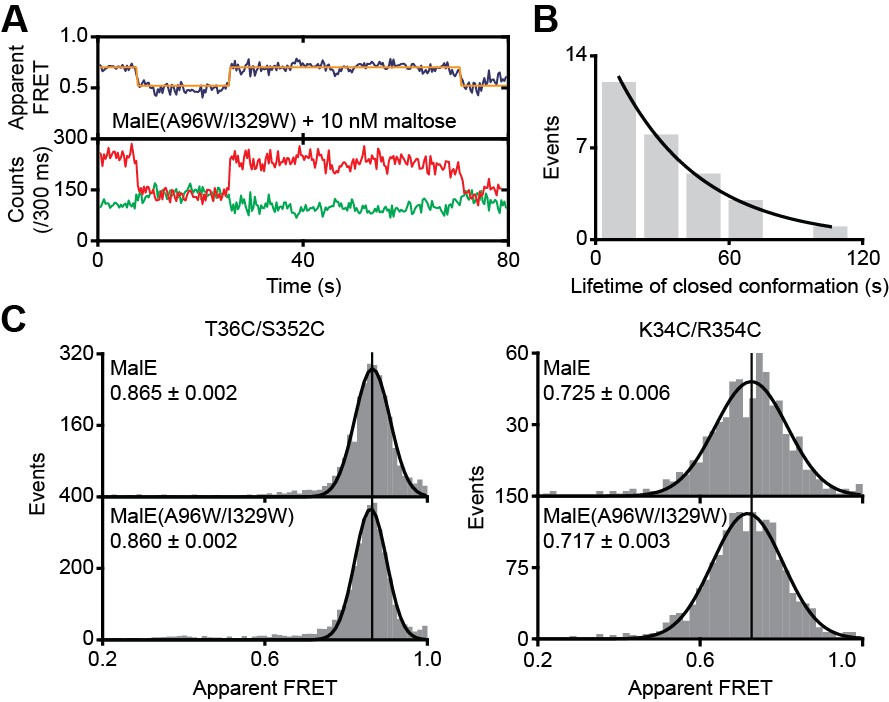
Conformational changes and dynamics of MalE(A96W/I329W).
(A) Representative fluorescence trajectories of MalE(T36C/S352C/A96W/I329W) in the presence of 10 nM maltose. Fluorescence trajectories: the top panel shows the calculated apparent FRET efficiency (blue) from the donor (green) and acceptor (red) photon counts as shown in the bottom panel. The most probable state-trajectory of the Hidden Markov Model (HMM) is shown (orange). (B) Dwell time histogram of the high FRET state (closed conformation) as obtained from the most probable state-trajectory of the HMM of all molecules. Grey bars are the data and the solid line is an exponential fit. Statistics in Supplementary file 4. (C) Solution-based apparent FRET efficiency histogram of MalE and MalE(A96W/I329W) in the presence of 1 mM maltose for the indicated inter-dye positions. Bars are the data and solid line a Gaussian fit. The 95% confidence interval for the mean of the Gaussian distribution is indicated. The FRET distributions of the wildtype and mutant protein are not significantly different; p = 0.28 (T36C/S352C) and p = 0.30 (K34C/R352) using the two-way KS test.
Figure 7
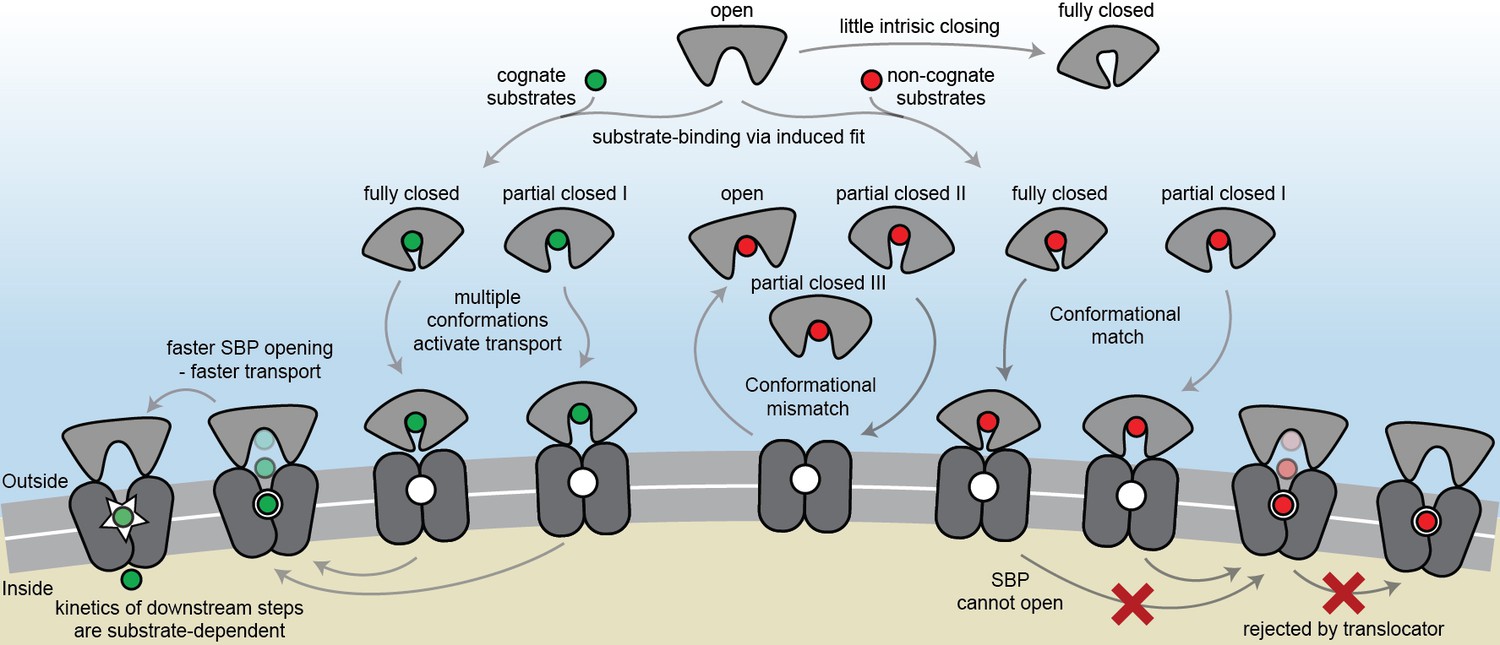
The conformational changes and dynamics of SBPs and the regulation of transport.
Schematic summarizing the plasticity of ligand binding and solute import via ABC importers. Intrinsic closing of an SBP is a rare event or absent in some SBPs (‘little intrinsic closing’). Ligands are bound via induced fit (‘ligand-binding via induced fit’). SBPs can acquire one or more conformations that can activate transport (‘multiple conformations activate transport’). Variations in cognate substrate transport are caused by: (i) openings rate of the SBP and substrate transfer to the translocator (‘faster SBP opening – faster transport’) and (ii) substrate-dependent downstream steps (‘kinetics of downstream steps are substrate-dependent’). Although SBPs can acquire a conformation that activates transport (‘conformational match’), transport still fails when: (i) the SBP has no affinity for the translocator and/or cannot make the allosteric interaction with the translocator (‘conformational mismatch’); (ii) the SBP cannot open and release the substrate to the translocator (‘SBP cannot open’); or (iii) due to the specificity and size limitations of the translocator (‘rejected by translocator’).
Tables
Table 1
Dissociation constant KD of substrate-binding proteins.
https://doi.org/10.7554/eLife.44652.003| KD (µM) | |||||
|---|---|---|---|---|---|
| Protein* | Ligand | Freely-diffusing protein | Surface-tethered protein | KD WT protein¶ (µM) | |
| OpuAC(V360C/N423C) | Glycine betaine | 3.4 ± 0.4† | 3.1‡ | 4–5 (Wolters et al., 2010) | |
| OppA(A209C/S441C) | RPPGFSFR | 7.0 ± 1† | 14 ± 5# | 5 ± 3# | |
| SBD2(T369C/S451) | Glutamine | 1.2 ± 0.2§ | 0.5‡ | 0.9 ± 0.1 (Gouridis et al., 2015) | |
| SBD1(T159C/G87C) | Asparagine | 0.34 ± 0.03§ | 0.3‡ | 0.2 ± 0.0 (Gouridis et al., 2015) | |
| MalE(T36C/S352C) | Maltose | 1.7 ± 0.3† | 2.2‡ | 1-2 (Hall et al., 1997a, Kim et al., 2013) | |
| MalE(T36C/S352C) | Maltotriose | 0.6 ± 0.2† | 0.9‡ | 0.2-2 (Hall et al., 1997a, Kim et al., 2013) | |
-
*. KD could not be determined reliably for labeled PsaA due to background metal contamination.
†. Population of the closed conformation in the presence of a ligand concentration was determined using solution-based smFRET. The for a one-binding site model. Data corresponds to mean ± s.d. of duplicate experiments with the same protein sample.
-
#. Figure 2—figure supplement 2
¶. The KD values of wildtype (WT) proteins are obtained from the indicated references.
Table 2
Steady-state anisotropy values.
https://doi.org/10.7554/eLife.44652.004| Anisotropy | ||||
|---|---|---|---|---|
| Alexa555 | Alexa647 | Cy3B | Atto647N | |
| Free dye | 0.25 | 0.20 | 0.08 | 0.08 |
| OpuAC(V360C/N423C) | NA | NA | 0.17 | 0.11 |
| OppA(A209C/S441C) | 0.25 | 0.19 | NA | NA |
| SBD1(G87C/T159C) | 0.27 | 0.19 | NA | NA |
| SBD2(T369C/S451) | 0.26 | 0.20 | NA | NA |
| MalE(T36C/S352C) | 0.29 | 0.24 | NA | NA |
| PsaA(V76C/K237C) | 0.28 | 0.22 | NA | NA |
-
NA: not applicable. Data correspond to mean (s.d. below < 0.01) of duplicate experiments, using the same labeled protein sample.
Key resources table
| Reagent type (species) or resource | Designation | Source or reference | Identifiers | Additional information |
|---|---|---|---|---|
| Gene(Escherichia coli) | MalE | NA | UniProt: P0AEX9 | |
| Antibody | Mouse anti-his | Qiagen | RRID:AB_2714179 | (1:200) |
| Strain, strain background (Streptococcus pneumoniae) | D39 | National Collection of Type Cultures | NCTC:7466 | Capsular serotype 2 |
| Strain, strain background (Streptococcus pneumoniae) | D39 ∆psaA | This paper | Replacement of psaA with the Janus cassette (∆psaA::Janus) | |
| Strain, strain background (Streptococcus pneumoniae) | D39 ∆czcD | This paper | Replacement of czcD with the Janus cassette (∆czcD::Janus) | |
| Strain, strain background (Streptococcus pneumoniae) | D39 ΩpsaAD280N | This paper | Replacement of ∆psaA::Janus with psaA D280N (∆psaA::psaAD280N) | |
| Strain, strain background (Streptococcus pneumoniae) | D39 ΩpsaAD280N∆czcD | This paper | Replacement of ∆psaA::Janus with psaA D280N; replacement of czcD with the Janus cassette (∆psaA::psaAD280N∆czcD::Janus) | |
| Strain, strain background (Lactococcus lactis) | NZ9000 | NIZO food research | ||
| Strain, strain background (Lactococcus lactis) | GKW9000 | DOI: 10.1038/ nsmb2929 | Lactococcus lactis NZ9000 with glnPQ gene deleted | |
| Strain, strain background (Escherichia coli) | K12 | Other | Provided by Tassos Economou, KU Leuven | |
| Strain, strain background (Escherichia coli) | BL 21 DE3 | Other | Provided by Tassos Economou, KU Leuven | |
| Recombinant DNA reagent | pET20b | Merck | Cat#:69739–3 | |
| Recombinant DNA reagent | pNZglnPQhis | DOI: 10.1047/ jbc.M500522200 | Expression plasmid for GlnPQ | |
| Recombinant DNA reagent | SBD1-T159C/G87C | DOI: 10.1038/ nsmb2929 | Expression plasmid for SBD1(T159C/G87C) | |
| Recombinant DNA reagent | SBD2-T369C/S451C | DOI: 10.1038/ nsmb2929 | Expression plasmid for SBD2(T369C/S451C) | |
| Recombinant DNA reagent | pCAMcLIC01-PsaA | DOI: 10.1038/ nchembio.1382 | Expression plasmid for PsaA | |
| Recombinant DNA reagent | pCAMcLIC01-PsaAD280N | DOI: 10.1038/ nchembio.1382 | Expression plasmid for PsaA(D280N) | |
| Recombinant DNA reagent | pNZOpuCHis | DOI: 10.1093/ emboj/cdg581 | Expression plasmid for OpuAC | |
| Recombinant DNA reagent | pNZcLIC-OppA | DOI: 10.1002/pro.97 | Expression plasmid for OppA | |
| Recombinant DNA reagent | PsaA-V76C/K237C | This paper | Expression plasmid for PsaA(V76C/K237C) from the pCAMcLIC01-PsaA construct | |
| Recombinant DNA reagent | PsaA-E74C/K237C | This paper | Expression plasmid for PsaA(E74C/K237C) from the pCAMcLIC01-PsaA construct | |
| Recombinant DNA reagent | PsaA-D280N/V76C/K237C | This paper | Expression plasmid for PsaA(D280N/V76C/K237C) from the pCAMcLIC01-PsaAD280N construct | |
| Recombinant DNA reagent | MalE-T36C/S352C | This paper | Progenitors: PCR, E. coli gDNA; pET20b vector | |
| Recombinant DNA reagent | MalE-T36C/N205C | This paper | Progenitors: PCR, E. coli gDNA; pET20b vector | |
| Recombinant DNA reagent | MalE-K34C/ R354C | This paper | Progenitors: PCR, E. coli gDNA; pET20b vector | |
| Recombinant DNA reagent | MalE-T36C/S352C/ A96W/I329W | This paper | Progenitors: PCR, E. coli gDNA; pET20b vector | |
| Recombinant DNA reagent | OpuAC-V360C/ N423C | This paper | Expression plasmid for OpuAC(V360C/N423C) from the pNZOpuCHis construct | |
| Recombinant DNA reagent | OppA-A209C/ S441C | This paper | Expression plasmid for OppA(A209C/ S441C) from the pNZcLIC-OppA construct | |
| Sequence- based reagent | Primers | Merck | see Supplementary File 2 | |
| Peptide, recombinant protein | RPPGFSPFR | Merck | Cat#:B3259 | peptide sequence: RPPGFSPFR |
| Peptide, recombinant protein | RDMPIQAF | CASLO ApS | peptide sequence: RDMPIQAF | |
| Peptide, recombinant protein | SLSQSKVLPVPQ | CASLO ApS | peptide sequence: SLSQSKVLPVPQ | |
| Peptide, recombinant protein | SLSQSKVLP | CASLO ApS | peptide sequence: SLSQSKVLP | |
| Chemical compound, drug | Glycine Betaine | Merck | Cat#:B3501 | |
| Chemical compound, drug | Carnitine | Merck | Cat#:94954 | |
| Chemical compound, drug | Maltose | Merck | Cat#:63418 | |
| Chemical compound, drug | Maltotriose | Merck | Cat#:851493 | |
| Chemical compound, drug | Maltotetraose | Carbosynth Limited | Cat#:OM06979 | |
| Chemical compound, drug | Maltopentaose | Merck | Cat#:M8128 | |
| Chemical compound, drug | Maltohexaose | Santa Cruz Biotechnology | Cat#:sc-218665 | |
| Chemical compound, drug | Maltoheptaose | Carbosynth Limited | Cat#:OM06868 | |
| Chemical compound, drug | Maltodecaose | Carbosynth Limited | Cat#:OM146832 | |
| Chemical compound, drug | Maltooctaose | Carbosynth Limited | Cat#:OM06941 | |
| Chemical compound, drug | Beta Cyclodextrin | Merck | Cat#:C4767 | |
| Chemical compound, drug | Maltotetroitol | Carbosynth Limited | Cat#:OM02796 | |
| Chemical compound, drug | Maltotriitol | Merck | Cat#:M4295 | |
| Chemical compound, drug | 3H-Asparagine | American Radiolabeled Chemicals | Cat#:ART 0500–250 µCi | |
| Chemical compound, drug | 14C-Glutamine | PerkinEllmer | Cat#:NEC451050UC | |
| Chemical compound, drug | 14C-Histidine | PerkinEllmer | Cat#:NEC277E050UC | |
| Chemical compound, drug | 14C-Arginine | Moravek | Cat#:MC 137 | |
| Chemical compound, drug | 3H-Lysine | PerkinEllmer | Cat#:NET376250UC | |
| Chemical compound, drug | Alexa555 | Thermo Fisher Scientific | Cat#:A20346 | |
| Chemical compound, drug | Alexa647 | Thermo Fisher Scientific | Cat#:A20347 | |
| Chemical compound, drug | Cy3B | GE Healthcare | Cat#:PA63131 | |
| Chemical compound, drug | ATTO647N | ATTO-TECH | Cat#:AD 647 N-45 | |
| Software, algorithm | Dual-Channel- Burst-Search | DOI: 10.1021/ jp063483n | ||
| Software, algorithm | LabView data acquisition | DOI: 10.1371/journal. pone.0175766 | Provided by Shimon Weiss, UCLA | |
| Software, algorithm | Hidden Markov Model | DOI: 10.1109/ 5.18626 | ||
| Software, algorithm | Origin | OriginLab | RRID:SCR_002815 | |
| Software, algorithm | MATLAB | MathWorks | RRID:SCR_001622 |
Additional files
-
Supplementary file 1
P-values of two-way Kolmogorov-Smirnov test on the solution-based smFRET data.
- https://doi.org/10.7554/eLife.44652.030
-
Supplementary file 2
Primer sequences of all protein constructs used in this study.
- https://doi.org/10.7554/eLife.44652.031
-
Supplementary file 3
Apparent FRET efficiency values of solution-based measurements.
- https://doi.org/10.7554/eLife.44652.032
-
Supplementary file 4
Statistics of confocal scanning experiments of immobilized molecules.
- https://doi.org/10.7554/eLife.44652.033
-
Transparent reporting form
- https://doi.org/10.7554/eLife.44652.034
Download links
A two-part list of links to download the article, or parts of the article, in various formats.
Downloads (link to download the article as PDF)
Open citations (links to open the citations from this article in various online reference manager services)
Cite this article (links to download the citations from this article in formats compatible with various reference manager tools)
Conformational and dynamic plasticity in substrate-binding proteins underlies selective transport in ABC importers
eLife 8:e44652.
https://doi.org/10.7554/eLife.44652


