Structure of the gene therapy vector, adeno-associated virus with its cell receptor, AAVR
- Oregon Health and Science University, United States
- Florida State University, United States
- OHSU Center for Spatial Systems Biomedicine, United States
- University of Missouri, United States
Figures
Figure 1
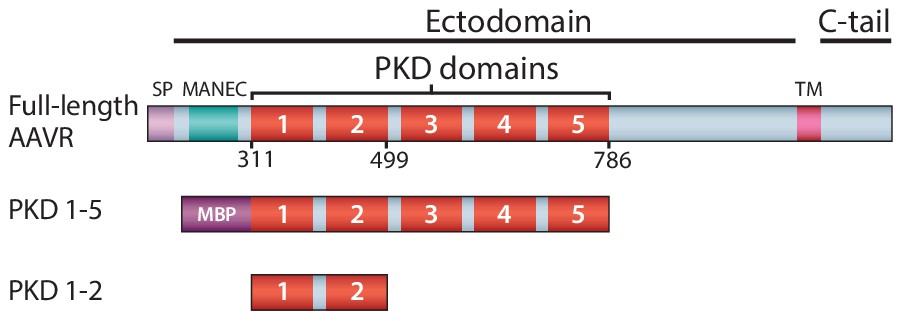
Schematic representation of the domain structure of AAVR, and the AAV-binding constructs used in this work.
Domain acronyms: SP - signal peptide; MANEC - motif at the N-terminus with eight cysteines; PKD - polycystic kidney disease; TM – transmembrane helix; C-tail – cytoplasmic, C-terminal tail; MBP – maltose-binding protein (fusion). Numbers refer to the first or last amino acids of native AAVR used in the construct.
Figure 2
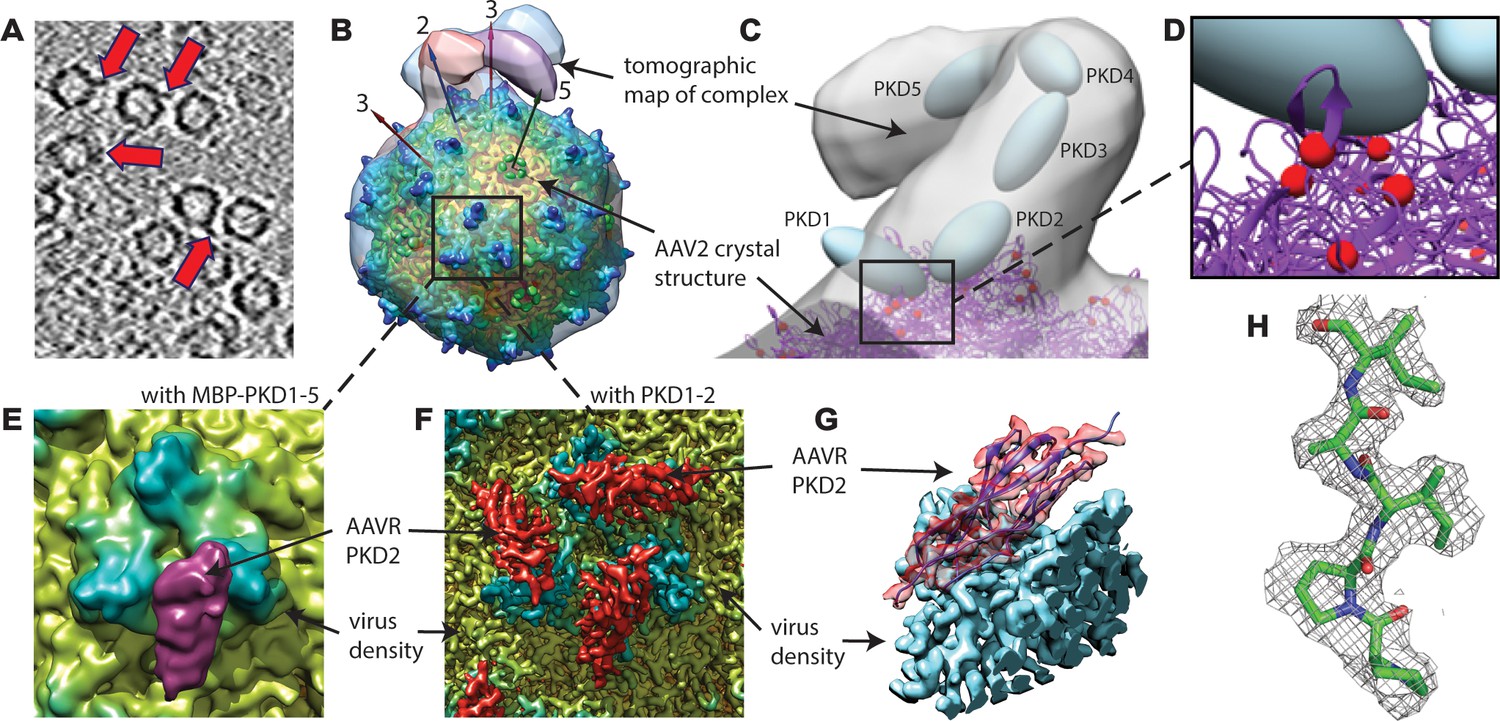
EM imaging of AAV-AAVR complexes.
(A) A slice of a raw tomogram of a complex between AAV2 and the MBP-PKD1-5 fusion construct highlighted with arrows. (B) Four of the sub-tomogram classes (Figure 3) that result from aligning occupied sites, overlaid on the crystal structure of AAV2 (Xie et al., 2002) with selected symmetry axes numbered. AAVR binds near the threefold spikes with varied configuration of viral-distal domains. (C) Domain-sized ellipsoids are modeled into the highest-population tomographic class at ~30 Å resolution. (D) AAV2 sites (red) that can be cross-linked to PKD1 or the PKD1/2 hinge. (E) The sub-volume classified single particle reconstruction of the MBP-PKD1-5 fusion complex shows one domain (purple), ordered and bound on the shoulder and plateau between spikes surrounding each threefold. (F) The icosahedrally-averaged single particle reconstruction of a complex with PKD1-2 shows binding at a larger fraction of the same site and its symmetry-equivalents. (G) Rotated to a tangential view, the PKD density (red) is traceable as an immunoglobulin domain; (H) Resolution of 2.4 Å is sufficient to model side chains specific to the PKD2 sequence.
Figure 3
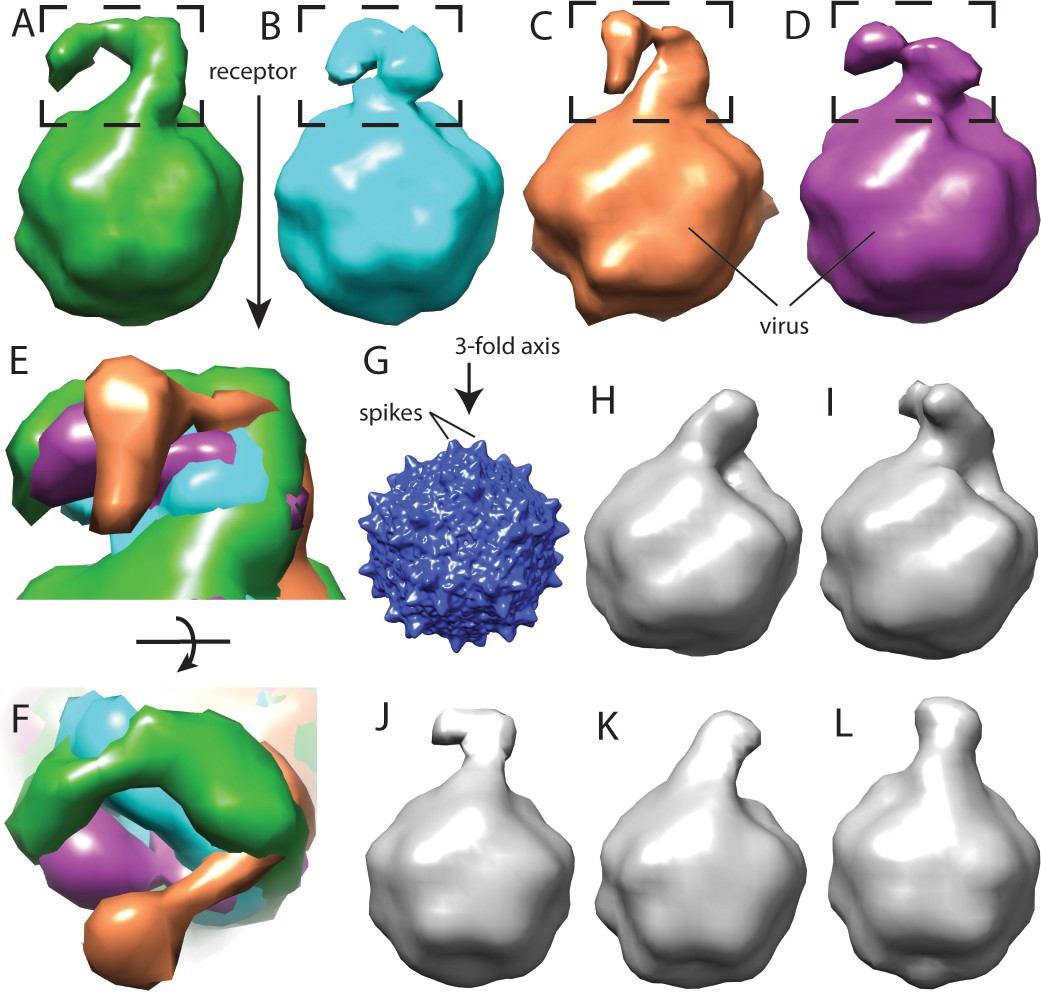
Flexibility between domains of AAVR, revealed by cryo-electron tomography.
(A–D) Class averages, oriented like the overall symmetry-averaged reconstruction (G), correspond to classes 1 through 4 of EMDB depositions EMD-0621 through EMD-0624, respectively. They show AAVR anchored at the same location on AAV, near three spikes surrounding symmetry axes on the AAV surface, but with distal PKD domains in different orientations; (E and F) Tangential and top-down magnifications of the boxed region of classes (A – D) superimposed, highlighting variation in domain conformations; (H–L) Additional classes for which viral-distal PKD domains are unseen, presumably due to disorder from inter-domain flexibility.
Figure 4
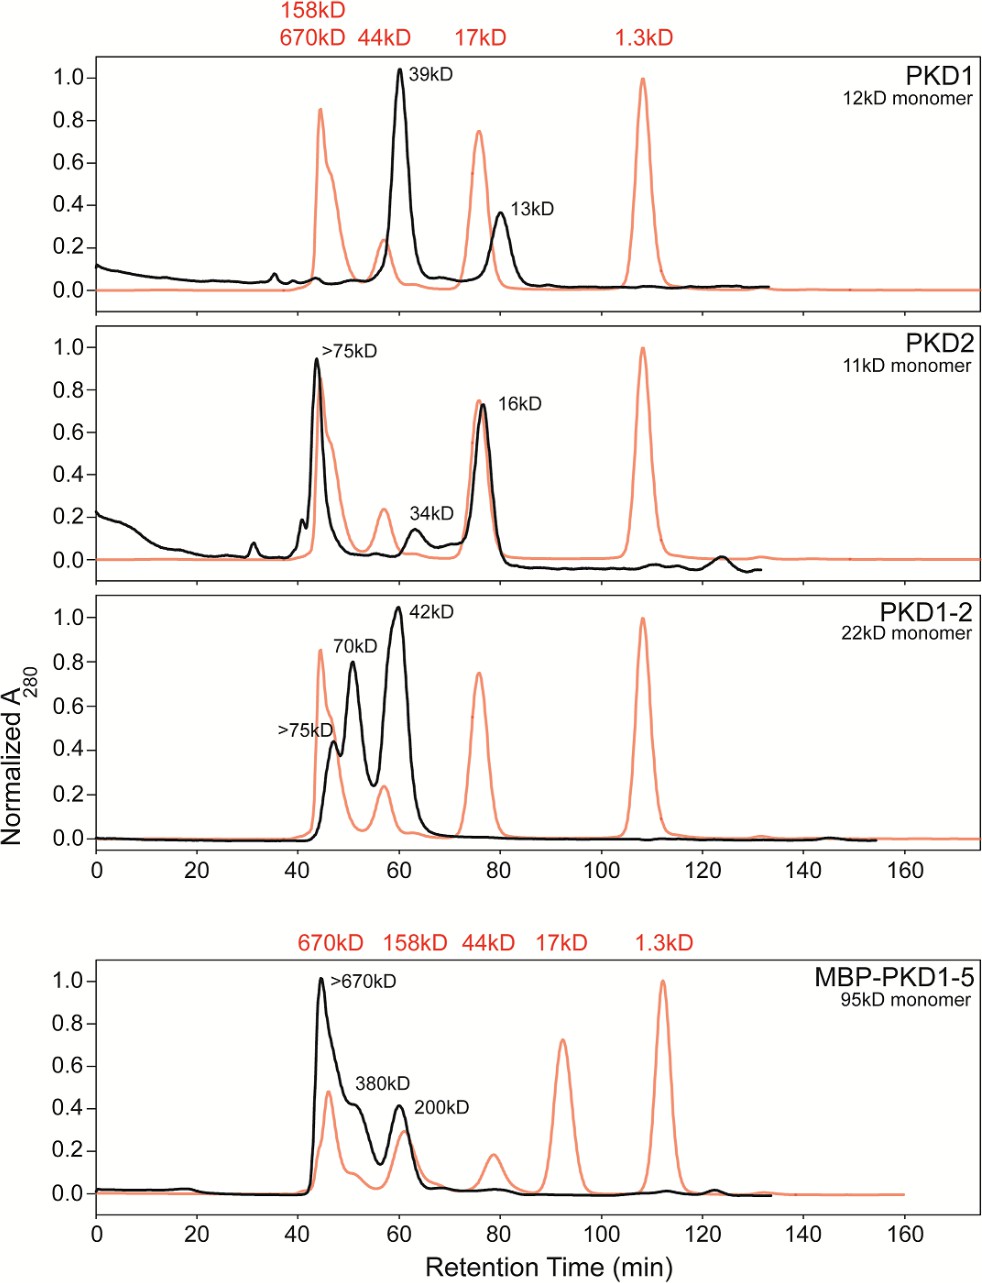
Size exclusion chromatography allowing fractionation of oligomeric states of His6-tagged AAVR-PKD constructs.
PKD1, PKD2, and PKD1-2 were run on a Superdex 75 column and MBP-PKD1-5 on Superdex 200, and are compared to standards, in red. MBP-PKD1-5 revealed hexamers predominating over tetramers and dimers, which are also seen in PKD1-2 along with larger oligomers. Monomers were only seen with PKD1 and PKD2 (along with larger species). Separated fractions of PKD1-2 re-equilibrated over a month at 4°C, inspiring EM sample preparation by first adhering AAV to a thin carbon film on the EM grid (O'Donnell et al., 2009) prior to addition of a freshly-prepared chromatographic fraction of an AAVR construct.
Figure 5
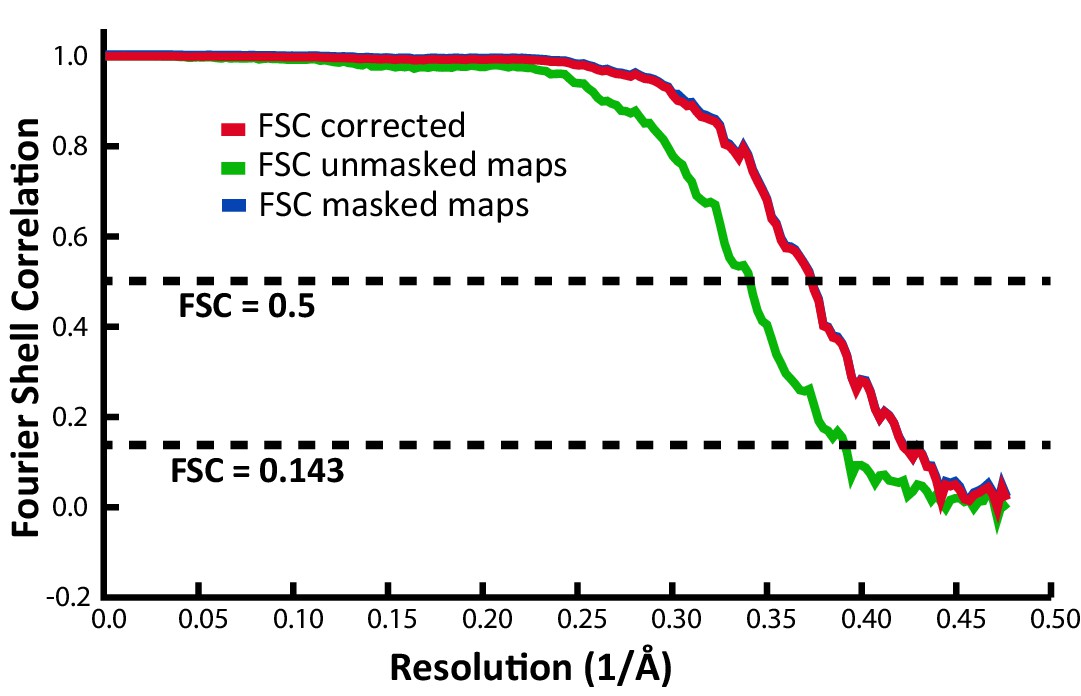
Fourier shell correlation (FSC) indicating an overall resolution of 2.39 Å.
https://doi.org/10.7554/eLife.44707.006
Figure 6 with 1 supplement
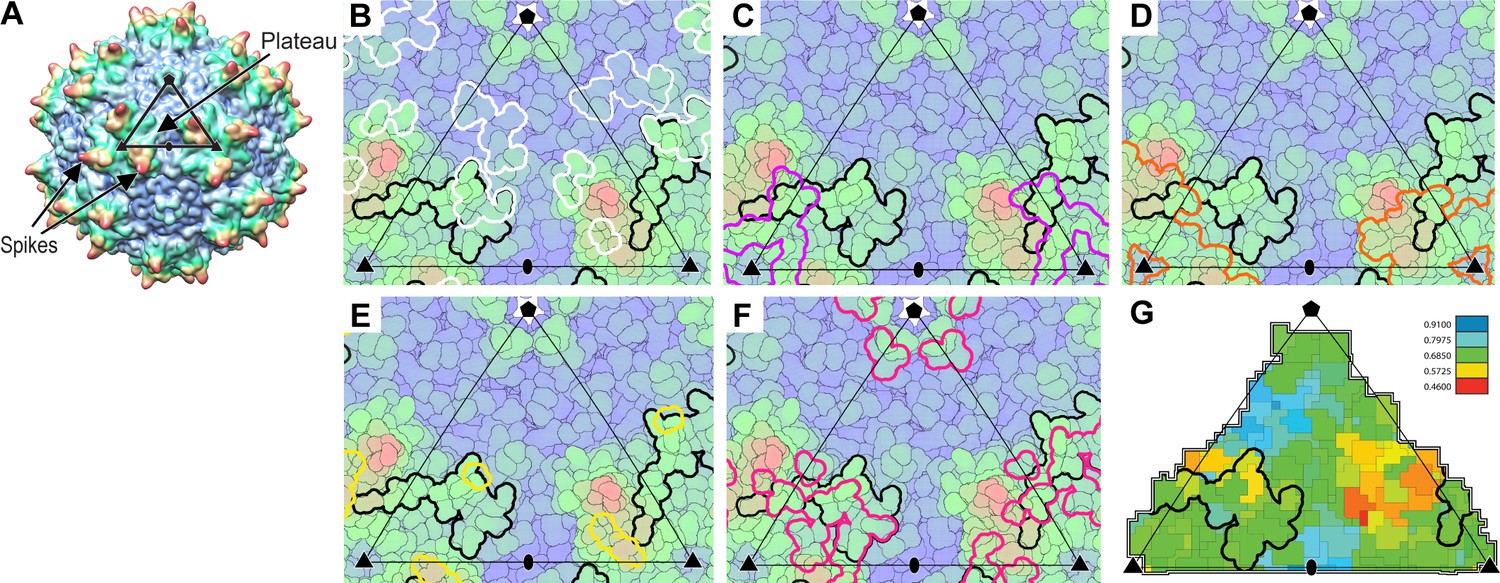
Interactions of AAVR with AAV.
(A) The surface of AAV can be divided into 60 equivalent triangular asymmetric units bounded by a 5-fold and two 3-fold symmetry axes, and containing parts of several subunits together adding to one. In panels A-E, the viral surface is colored blue-to-red by distance from the virus center. (B-E) Overlaid on an asymmetric unit are outlined the footprints of AAVR-PKD2 (black; Table 2) and neutralizing monoclonal antibodies: A20 (B; white), C37B (C; purple), D3 (D; orange) and C24B (E; yellow) (Wobus et al., 2000; McCraw et al., 2012; Gurda et al., 2013). (Residues are labeled in the supplement.) (F) The sites of ‘dead zone’ transduction-abrogated mutations are outlined in pink (Lochrie et al., 2006). (G) The AAVR footprint is outlined over a projection colored by sequence identity (among presumptive AAVR-binding serotypes) from conserved blue (>90% identity) to variable red (<50% identity).
Figure 6—figure supplement 1
Overlap between the AAVR footprint on AAV2 and epitopes of neutralizing monoclonal antibodies.
The surface of AAV can be divided into 60 equivalent triangular regions bounded by a 5-fold (pentagon), two 3-fold symmetry axes (triangles) and a diad (oval). The region contains parts of several subunits that together add to one. The projected surface is colored blue-to-red by distance from the virus center, with the footprints outlined of AAVR-PKD2 (black) and neutralizing monoclonal antibodies: A20 (white), C37B (purple), D3 (orange) and C24B (yellow) (Wobus et al., 2000; McCraw et al., 2012; Gurda et al., 2013).
Figure 7
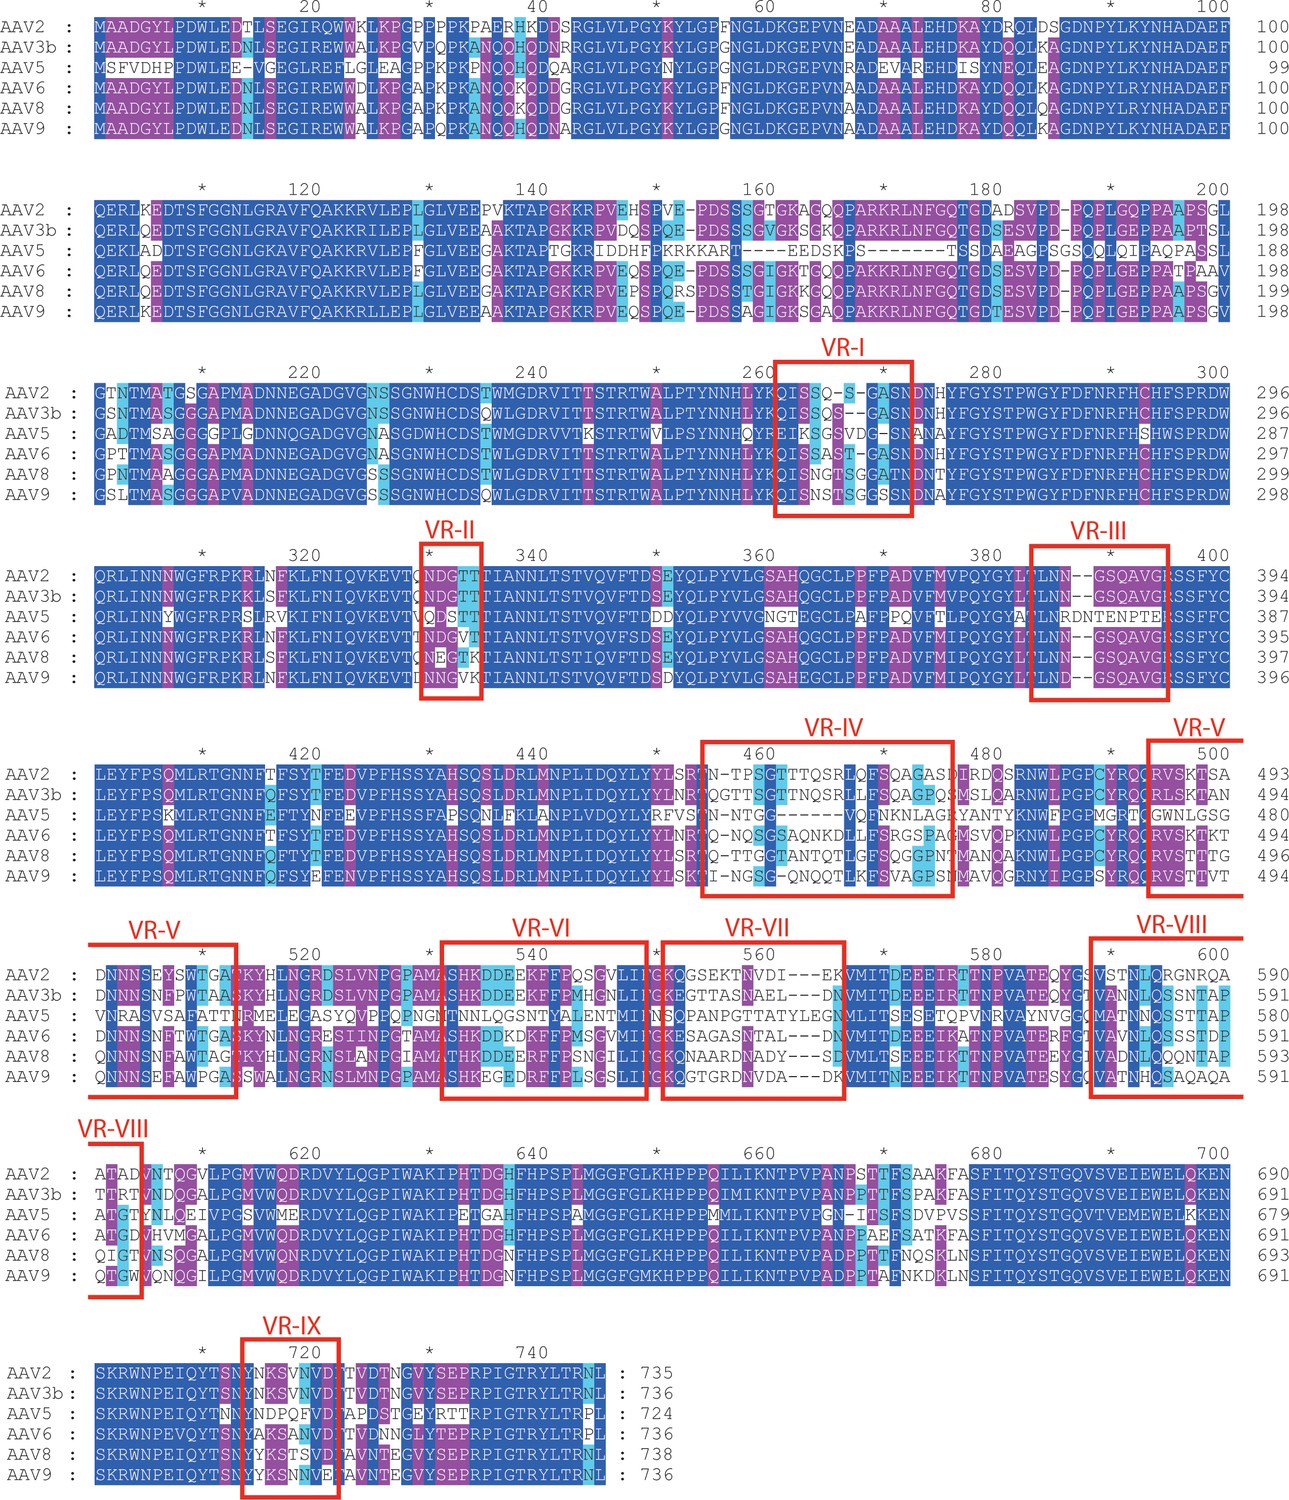
Aligned AAV sequences, highlighting variable regions (VR) I to IX.
Representative sequences were aligned using Clustal (Chenna et al., 2003). Boxes highlight the regions designated as variable when the atomic structure of AAV4 was compared to AAV2 (Govindasamy et al., 2006). For VR IV through IX, sequence diversity extends through all strains. However, variability in VR I through III arises primarily through divergence of the AAV4 clade from others. VR-I and VR-III constitute the surface loops with most intimate interactions between AAV2 and AAVR. Among AAVs that use AAVR, that is excluding the AAV4 clade, variability is not elevated in VR-I and VR-III compared to other surface regions.
Figure 8
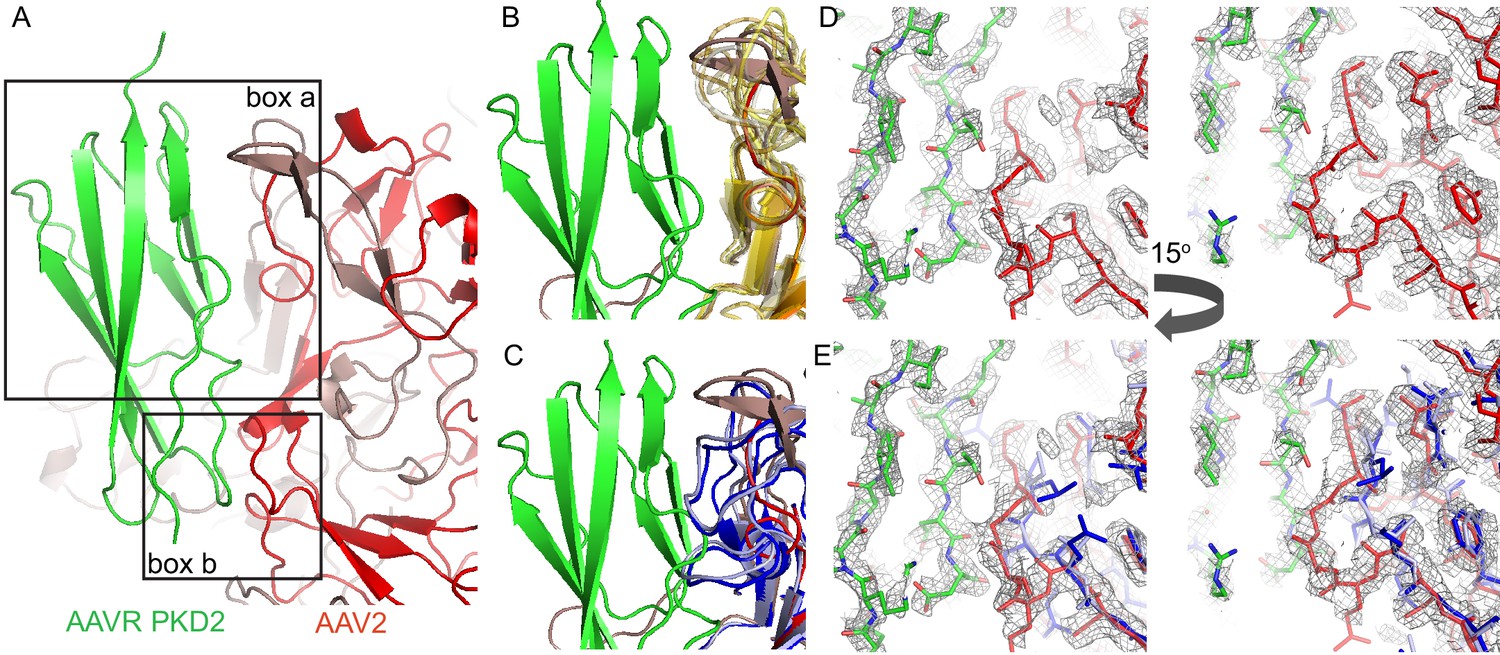
Interactions between AAVR and AAV-2.
(A) Boxed areas show contact points between PKD2 of AAVR (green) and two adjacent subunits of AAV2 (red). (B) Boxed volume ‘a’, now with AAV serotypes 3b, 5, 6, 8, 9, and DJ superimposed (translucent, yellow to brown) (Lerch et al., 2010; Walters et al., 2004; Xie et al., 2011; Nam et al., 2007; DiMattia et al., 2012; Xie et al., 2017), all of which can accommodate AAVR. (C) The same volume ‘a’, superimposing AAV4 (dark blue) and AAVrh32.33 (light blue) (Govindasamy et al., 2006; Mikals et al., 2014) that have a loop insertion in variable region VRIII of the sequence that would clash with AAVR. (D and E) EM density for the AAV2 complex in boxed volume ‘b’, contrasting the complementarity with AAVR for AAV2 (D, red) with poor complementarity (E), due to a deletion (variable region VRI of the sequence), in the superimposed crystal structures of AAV4 (dark blue) and AAVrh32.33 (light blue).
Figure 9
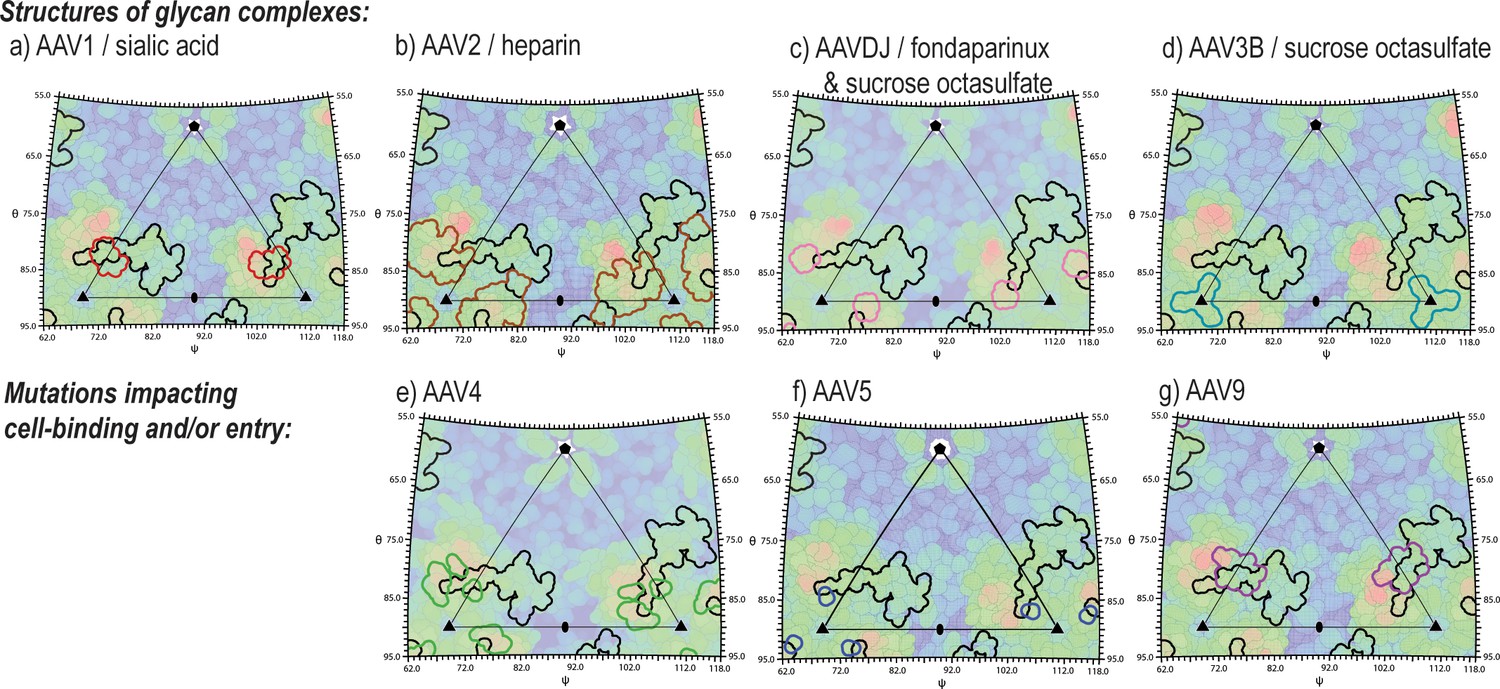
Juxtaposition of AAV glycan attachment sites, and the AAV2 contact footprint of entry receptor, AAVR.
Panels show the surface topologies of different AAV serotypes, projected as in Figure 6, colored, blue to red, with increasing distance from the virus center. The contact footprint of AAVR on AAV2 overlaid is outlined in black. Outlined in color are amino acids that contact glycan analogs in structures of complexes (AAV1-sialic acid [Huang et al., 2016], AAV2-heparin [O'Donnell et al., 2009], AAV3B with sucrose octasulfate [Lerch and Chapman, 2012], AAV-DJ with sucrose octasulfate [Xie et al., 2013] or fondaparinux [Xie et al., 2017]) or that have been implicated by mutagenesis in cell attachment and/or uptake (AAV4 [Shen et al., 2013], AAV5 [Afione et al., 2015] and AAV9 [Bell et al., 2012]).
Figure 10
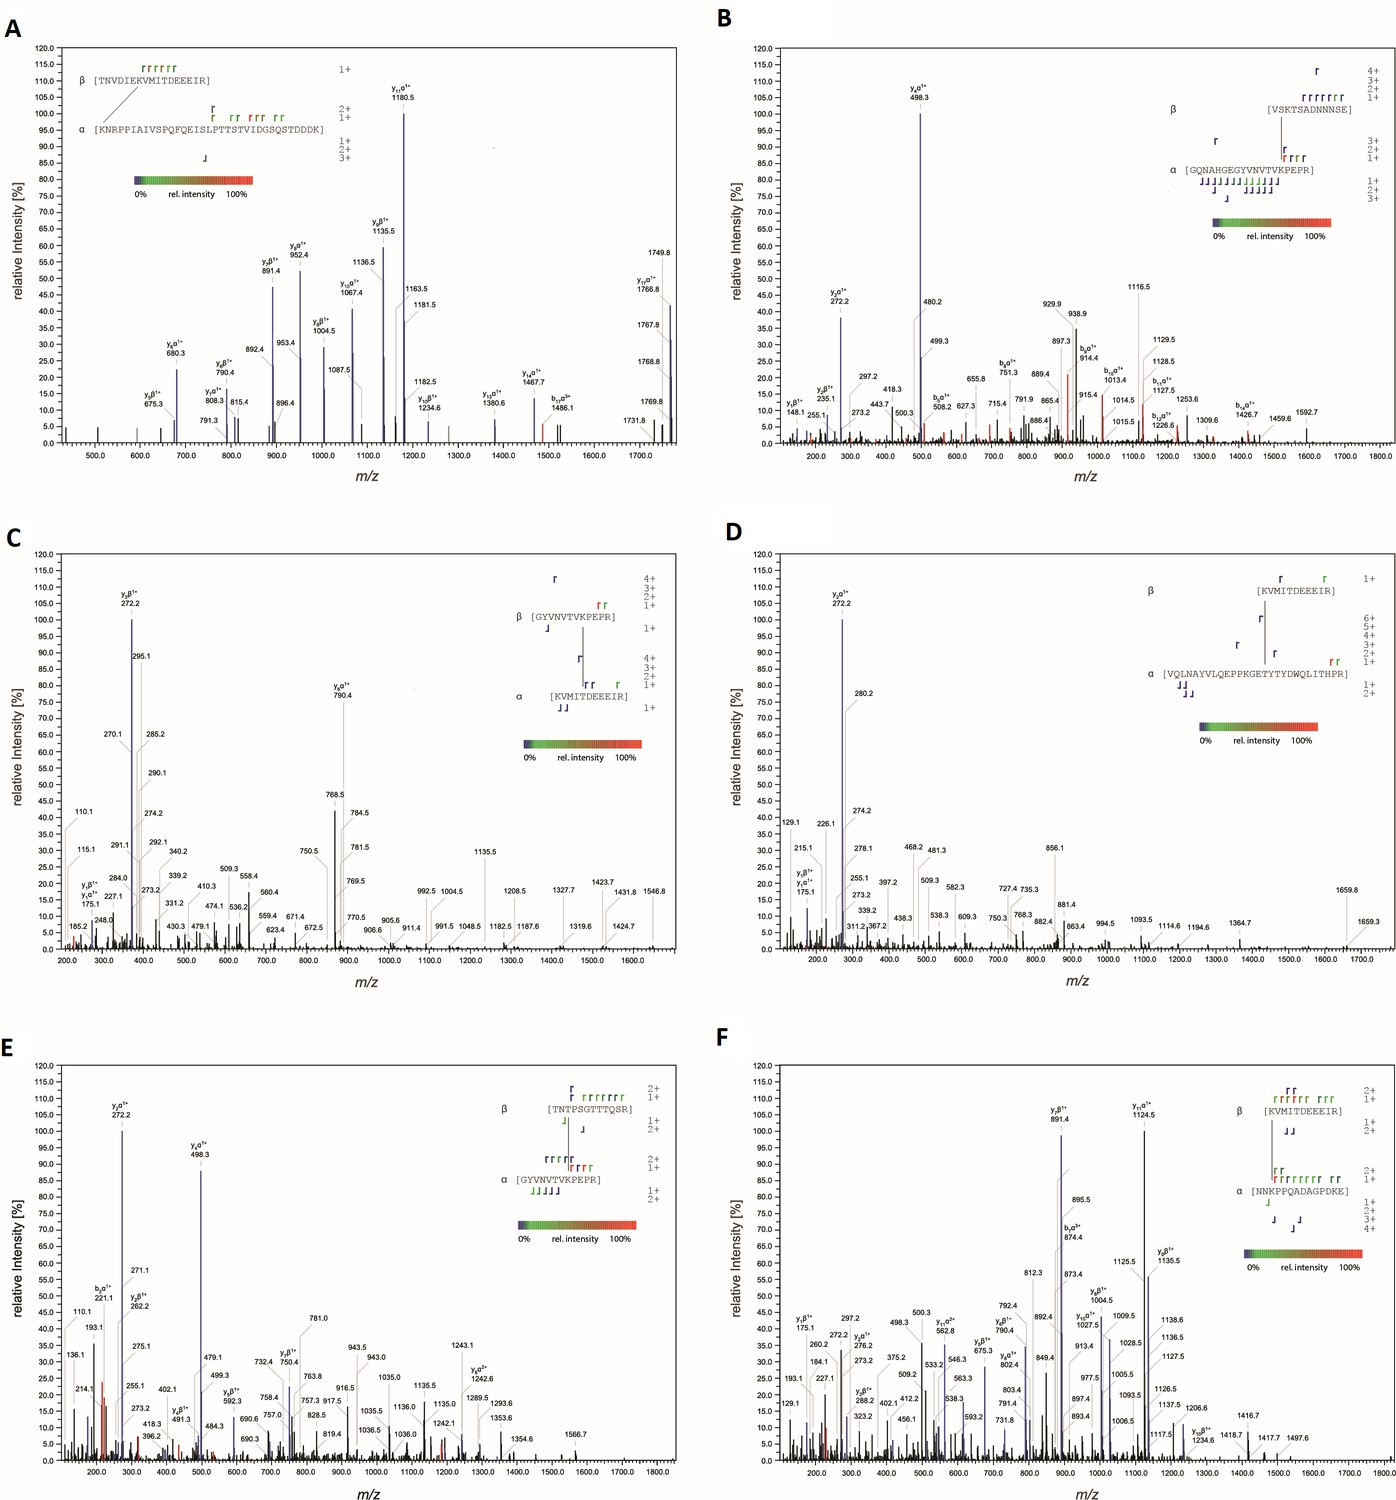
MS-MS characterization of cross-linked peptides.
Fragmentation spectra of peptides cross-linked at (A) AAVDJ K556:AAVR K93, (B) AAV2 K490:AAVR K88, (C) AAV2 T560:AAVR K88, (D) AAV2 K556:AAVR K27, (E) AAV2 T450:AAVR K88, and (F) AAV2 K556:AAVR K286. Peaks corresponding to y and b fragments are colored blue and red, respectively. Resulting fragment ions shown in the insets.
Tables
Table 1
Structural analysis of virus-receptor complexes cross-linked with CBDPS at sites identified by tandem mass spectrometry following proteolytic digestion and affinity purification of cross-linked peptides.
The spacer length of CBDPS is 14 Å. Distances are measured from models based on electron microscopy of complexes that were not cross-linked. Thus, the distances do not reflect any chemical constraint imposed by the cross-linker on conformation, or any remodeling of the protein structure.
| Virus | Residue | AAVR construct | Residue | Location | Distance | Measured from: |
|---|---|---|---|---|---|---|
| AAVDJ | K556 | Full ecto-protein | K404 | PKD2 (N-terminal) | 13.4 Å | PKD2 modeled into high resolution EM of AAV2-PKD1/2 |
| AAV2 | K490 | MBP-PKD1-5 | K399 | PKD1/2 linker | 9.9 Å | PKD1 homology model, anchored to PKD2 in above EM |
| AAV2 | T560 | MBP-PKD1-5 | K399 | PKD1/2 linker | 17.8 Å | As above |
| AAV2 | K556 | MBP-PKD1-5 | K338 | PKD1 | 13.8 Å | As above |
| AAV2 | T450 | MBP-PKD1-5 | K399 | PKD1/2 linker | 27.7 Å | As above |
| AAV2 | K556 | MBP-PKD1-5 | K597 | PKD3/4 linker | Not attempted |
Table 2
Amino acids at the AAV2-AAVR interface.
Residues of AAVR are listed if any non-hydrogen atom is within 4.5 Å of any non-hydrogen AAV2 atom, et vice versa. This criterion corresponds approximately to the distance expected between methyl groups that are in van der Waals contact, and is intermediate between that of hydrogen-bonding and solvent exclusion. However, to assess the potential for specific interactions, readers are encouraged to inspect the deposited coordinates and maps (PDBid 6NZ0/EMD-0553).
| AAVR residues close to AAV2: | |||||||||||
|---|---|---|---|---|---|---|---|---|---|---|---|
| Arg406 | Ser413 | Ile419 | Thr423 | Ser425 | Thr426 | Val427 | Asp429 | Ser431 | Gln432 | Ser433 | Thr434 |
| Asp435 | Asp436 | Asp437 | Lys438 | Ile439 | Tyr442 | Glu458 | Asp459 | Ile462 | Lys464 | ||
| AAV2 residues close to AAVR: | |||||||||||
| Gln263 | Ser264 | Gly265 | Ala266 | Ser267 | Asn268 | His271 | Asn382 | Gly383 | Ser384 | Gln385 | |
| Arg471 | Trp502 | Thr503 | Asp528 | Asp529 | Gln589 | Lys706 | Val708 | ||||
Key resources table
| Reagent type (species) or resource | Designation | Source or reference | Identifiers | Additional information |
|---|---|---|---|---|
| Strain, strain background (Escherichia coli) | BL21(DE3) E. coli | ThermoFisher | ThermoFisher: C601003 | |
| Strain, strain background (E. coli) | NEB Express E. coli | New England Biolabs | NEB: C2523I | |
| Cell line (Spodoptera frugiperda) | Sf9 | Gibco | Gibco: 11496015 | |
| Recombinant DNA reagent | pET-11a | Novagen | EMD Milli-pore: 69436–3 | |
| Recombinant DNA reagent | pMAL-c5X | New England Biolabs | NEB: N8108S | |
| Commercial assay or kit | Cleavable ICAT Reagent Kit for Protein Labeling | SCIEX | ||
| Commercial assay or kit | Bac-to-Bac Baculovirus Expression System | ThermoFisher (Invitrogen) | ThermoFisher: 10359016 | |
| Commercial assay or kit | MBPTrap HP column | GE | GE: 28918778 | |
| Commercial assay or kit | HiTrap Chelating HP column | GE | GE: 17040801 | |
| Commercial assay or kit | Superdex 75/200 column | GE | GE: GE17-5174-01 | |
| Software, algorithm | Leginon | Suloway et al., 2005 doi: 10.1016/j.jsb.2005.03.010 | RRID:SCR_016731 | |
| Software, algorithm | Protomo | Winkler, 2007 doi: 10.1016/j.jsb.2006.07.014 | ||
| Software, algorithm | TOMOCTF | Fernández et al., 2006 doi: 10.1016/j.jsb.2006.07.014 | ||
| Software, algorithm | Dynamo | Castaño-Díez et al., 2012 doi: 10.1107/52059798317003369 | ||
| Software, algorithm | Relion 3.0 | Scheres, 2012 doi: 10.1016/j.jsb.2012.09.006 | RRID:SCR_016274 | |
| Software algorithm | Motioncor2 1.1.0 | Zheng et al., 2017 doi: 10.1038/nmeth.4193 | RRID:SCR_016499 | |
| Software, algorithm | Gctf 1.06 | Zhang, 2016 doi: 10.1016/j/jsb.2015.11.003 | RRID:SCR_016500 | |
| Software, algorithm | Localized reconstruction | Ilca et al., 2015 doi: 10.1038/ncomms9843 | ||
| Software, algorithm | StavroX | Götze et al., 2012 doi: 10.1007/s13361-011-0261-2 | RRID:SCR_014957 | |
| Software, algorithm | Coot | Brown et al., 2015 doi: 10.1017/S1399004714021683 | RRID:SCR_014222 | |
| Software, algorithm | MapMan | RRID:SCR_003543 | ||
| Software, algorithm | EMAN | RRID:SCR_016867 | ||
| Software, algorithm | RSRef | Chapman et al., 2013 doi: 10.1016/j.jsb.2013.01.003 | RRID:SCR_017211 | |
| Software, algorithm | Roadmap | Chapman, 1993 doi: 10.1002/pro.5560020318 | RRID:SCR_017207 | |
| Software, algorithm | Rivem | Xiao and Rossmann, 2007 doi: 10.1016/j.jsb.2006.10.013 | ||
| Software, algorithm | Modeller 9.2 | Eswar et al., 2006 doi: 10.1007/978-1-60327-058-8_8 | RRID:SCR_008395 | |
| Software, algorithm | Chimera | RRID:SCR_002959 | ||
| Software, algorithm | Pymol | RRID:SCR_000305 |
Table 3
Cryo-EM AAV2-PKD1-2 data collection and processing statistics.
https://doi.org/10.7554/eLife.44707.014| Data collection: | |
|---|---|
| Magnification | 75,000 x |
| Voltage | 300 kV |
| Electron exposure | 25 e¯/Ų |
| Defocus range | −0.8 to −2.0 μm |
| Pixel size | 1.049 Å |
| Data processing: | |
| Motion correction | Motioncor2 1.1.0 |
| Anisotropic magnification correction: | |
| Distortion angle | 3.2° |
| Percent distortion | 1.10% |
| CTF estimation | Gctf 1.06 |
| Resolution range | 30 to 3 Å |
| Symmetry imposed | I1 |
| Initial particle images | 34,450 |
| Final particle images | 21,373 |
| Map resolution | 2.39 Å |
| FSC threshold | 0.143 |
Additional files
-
Transparent reporting form
- https://doi.org/10.7554/eLife.44707.016
Download links
A two-part list of links to download the article, or parts of the article, in various formats.
Downloads (link to download the article as PDF)
Open citations (links to open the citations from this article in various online reference manager services)
Cite this article (links to download the citations from this article in formats compatible with various reference manager tools)
Structure of the gene therapy vector, adeno-associated virus with its cell receptor, AAVR
eLife 8:e44707.
https://doi.org/10.7554/eLife.44707


