Parallel visual circuitry in a basal chordate
- University of California, Santa Barbara, United States
Figures
Figure 1 with 2 supplements
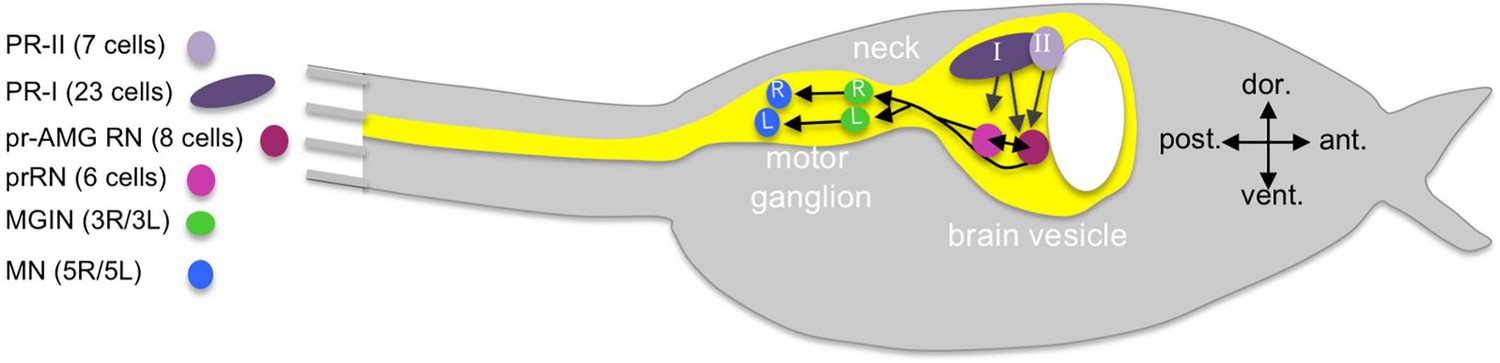
Cartoon of a Ciona tadpole larva with outline of the central nervous system.
The minimal visuomotor circuit is shown with circles representing classes of neurons with the number of cells of each class indicated in the parentheses of the key. Abbreviations: dor., dorsal; vent., ventral; ant., anterior; post., posterior; PR-II, photoreceptor group II; PR-I, photoreceptor group I; pr-AMG RN, photoreceptor ascending motor ganglion relay neuron; prRN, photoreceptor relay neuron; MGIN, motor ganglion interneuron; MN, motor neuron. L, left; R, right. Cell types are color coded according to Ryan et al. (2016).
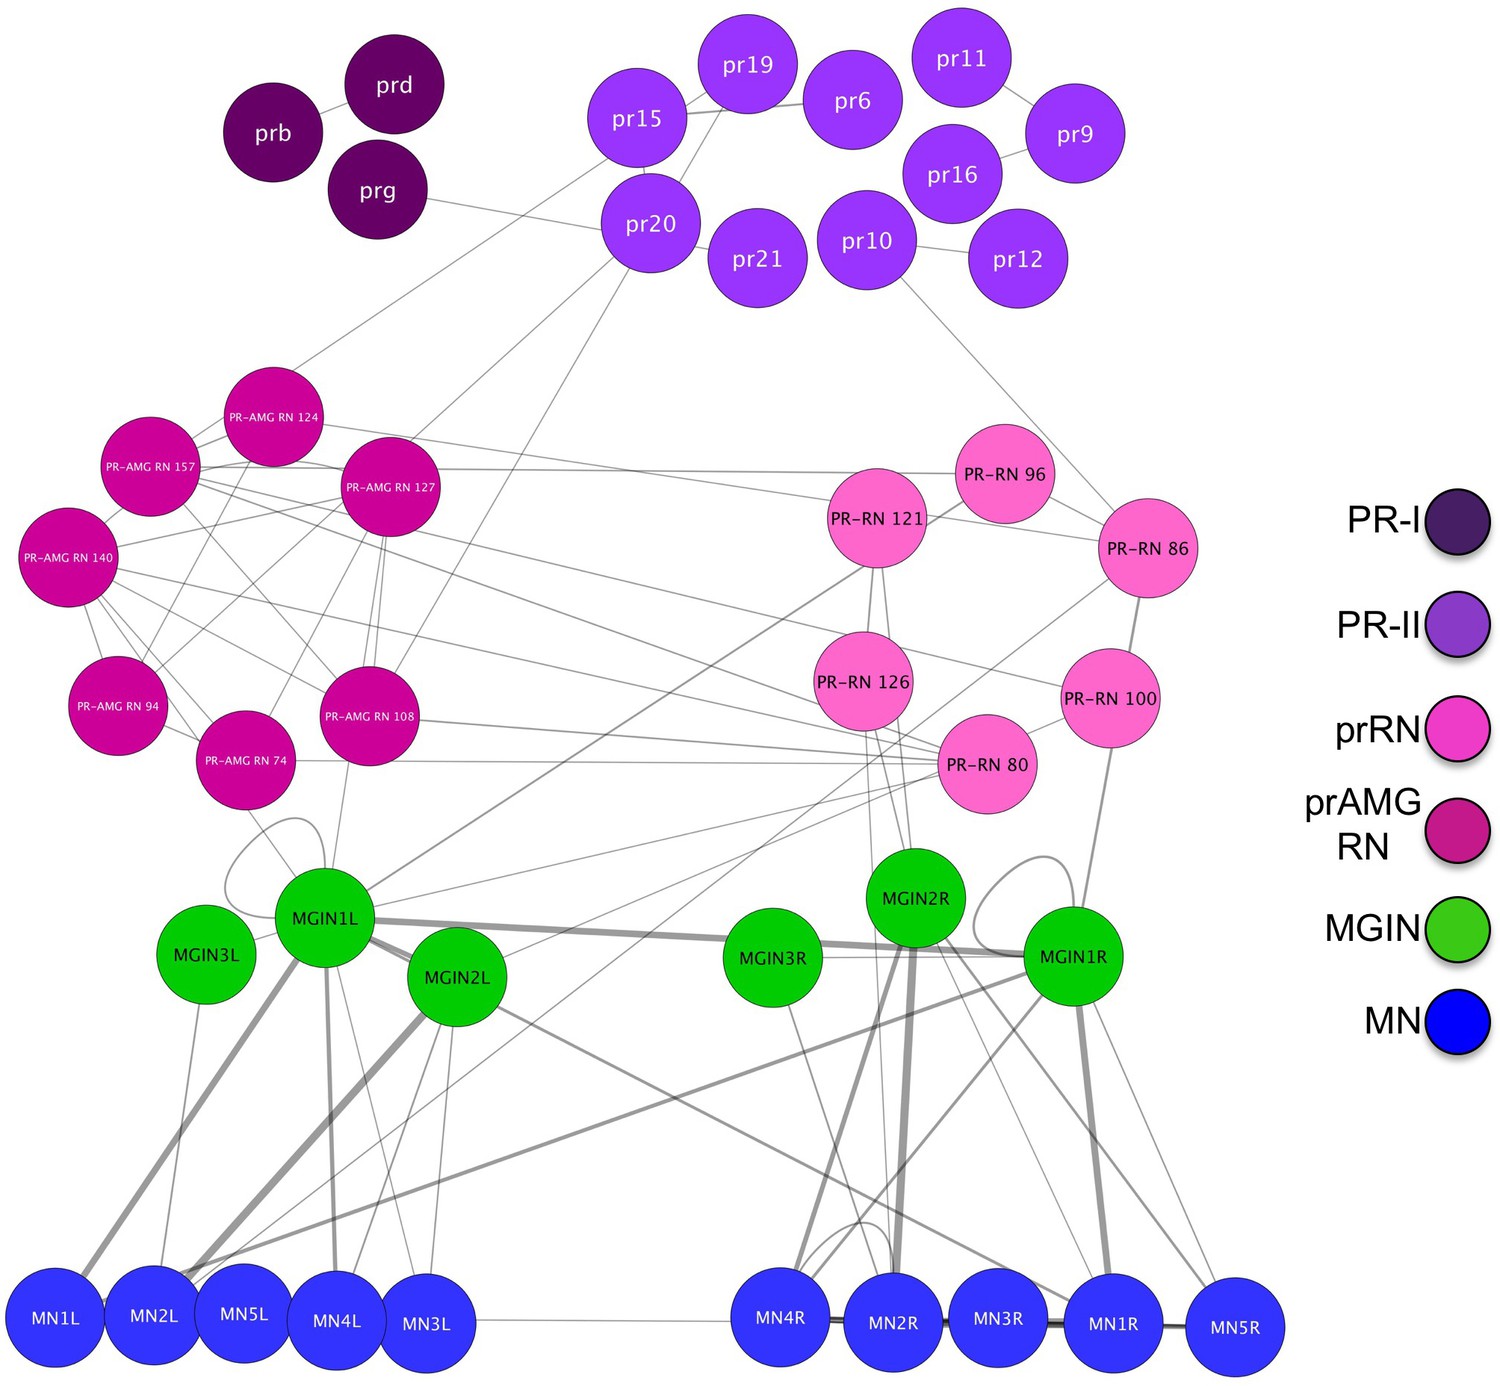
Figure 1—figure supplement 1

Chemical synapse connectivity of minimal visuomotor system of Ciona.
Electrical synapse connectivity of minimal visuomotor system of Ciona. Both panels derived from data in Satoh (1994). Thickness of lines is proportional to synapse strength. Abbreviations: PR-II, photoreceptor group II; PR-I, photoreceptor group I; pr-AMG RN, photoreceptor ascending motor ganglion relay neuron; prRN, photoreceptor relay neuron; MGIN, motor ganglion interneuron. L, left; R, right.
Figure 1—figure supplement 2
Electrical synapse connectivity of minimal visuomotor system of Ciona.
https://doi.org/10.7554/eLife.44753.004
Figure 2 with 1 supplement

Neurotransmitter use in the ocellus.
(a) Coexpression of opsin and VGAT reporter constructs in the ocellus (white and orange arrowheads). Insets show expression of Opsin-1 and VGAT individually. (b) Expression of VGLUT and VGAT in the brain vesicle and epidermis by in situ hybridization. VGAT was observed in an anterior (white arrowhead) and posterior (orange arrowhead) domain of the ocellus. Blue arrowhead indicates VGLUT expression in the ocellus, and red arrowheads indicate VGLUT-expressing epidermal sensory neurons. (c) Posterior VGAT-expression in the ocellus consists of two cells (orange arrowheads), one exclusively expressing VGAT, and one coexpressing VGAT and VGLUT. Two cells in the anterior exclusively express VGAT (white arrowheads). Nuclei are shown as red spheres. Asterixis indicate overlap of VGAT and VGLUT. (d) Neurotransmitter predictions color-coded on a schematic diagram of the ocellus photoreceptors. Lines between photoreceptors indicate chemical synaptic connections taken from Satoh (1994), with red lines indicating projections to the relay neurons. (e) Heat map of neurotransmitter predictions from registration for photoreceptor group I (cells 01–23). Scale assigns color to proportion of iterations predicting VGAT or VGLUT within a particular cell. (f) Confusion matrix of registration of photoreceptor group I cells (cells 01–23). High values (light colors) in the diagonal indicate higher confidence. Abbreviations: dor., dorsal; vent., ventral; ant., anterior; post., posterior; em., eminens cell; RN, relay neuron; AC, antenna cells; pr-AMG RN, photoreceptor ascending motor ganglion relay neuron; prRN, photoreceptor relay neuron; VGAT, vesicular GABA transporter; VGLUT, vesicular glutamate transporter; PR-I, photoreceptor group I (01–23).
Figure 2—figure supplement 1
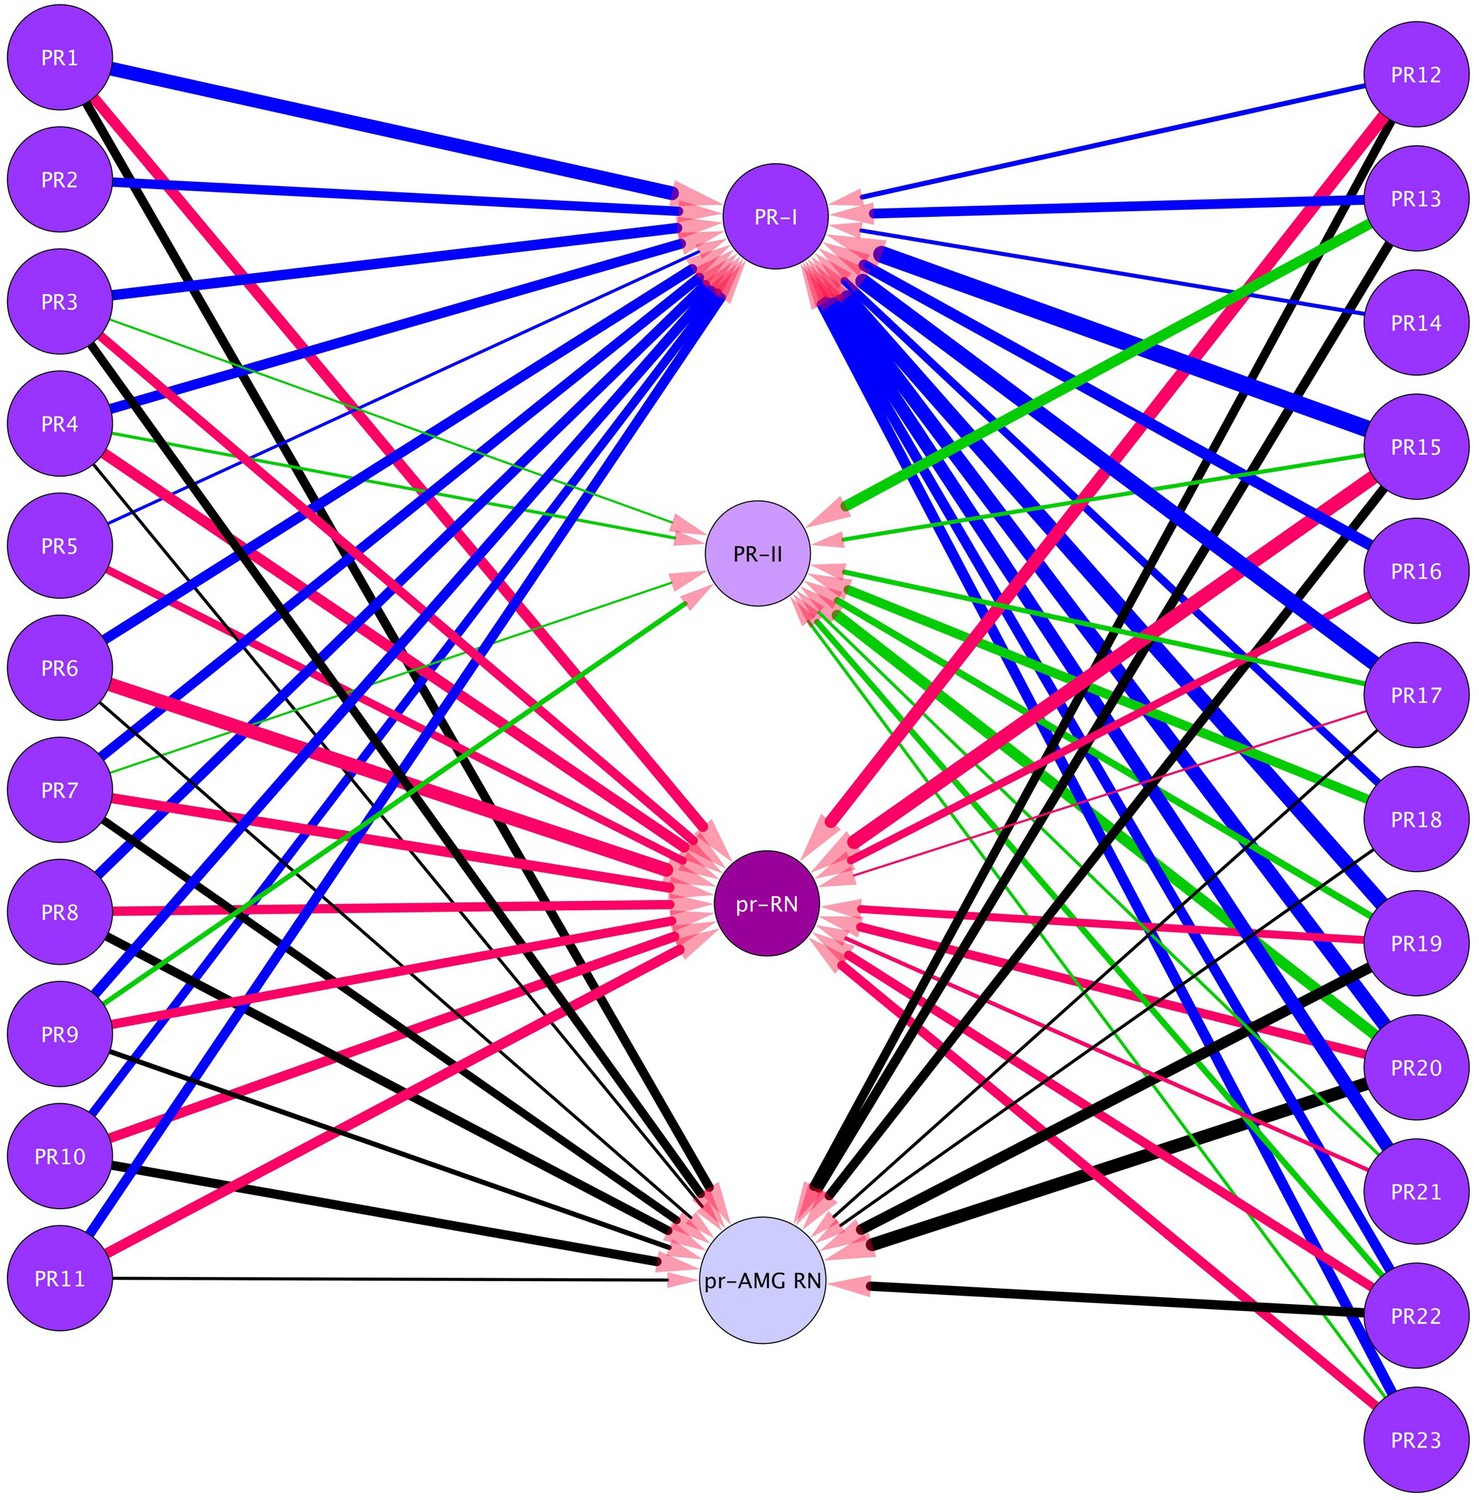
Neurons in the visuomotor circuit postsynaptic to the Group-I Photoreceptors (PR1-PR23).
Lines indicate chemical synapses and their thickness indicates synaptic strength. Data from Ryan et al. (2016). Abbreviations: PR-I, photoreceptor group I; PR-II, photoreceptor group II; pr-AMG RN, photoreceptor ascending motor ganglion relay neuron; prRN, photoreceptor relay neuron.
Figure 3 with 1 supplement
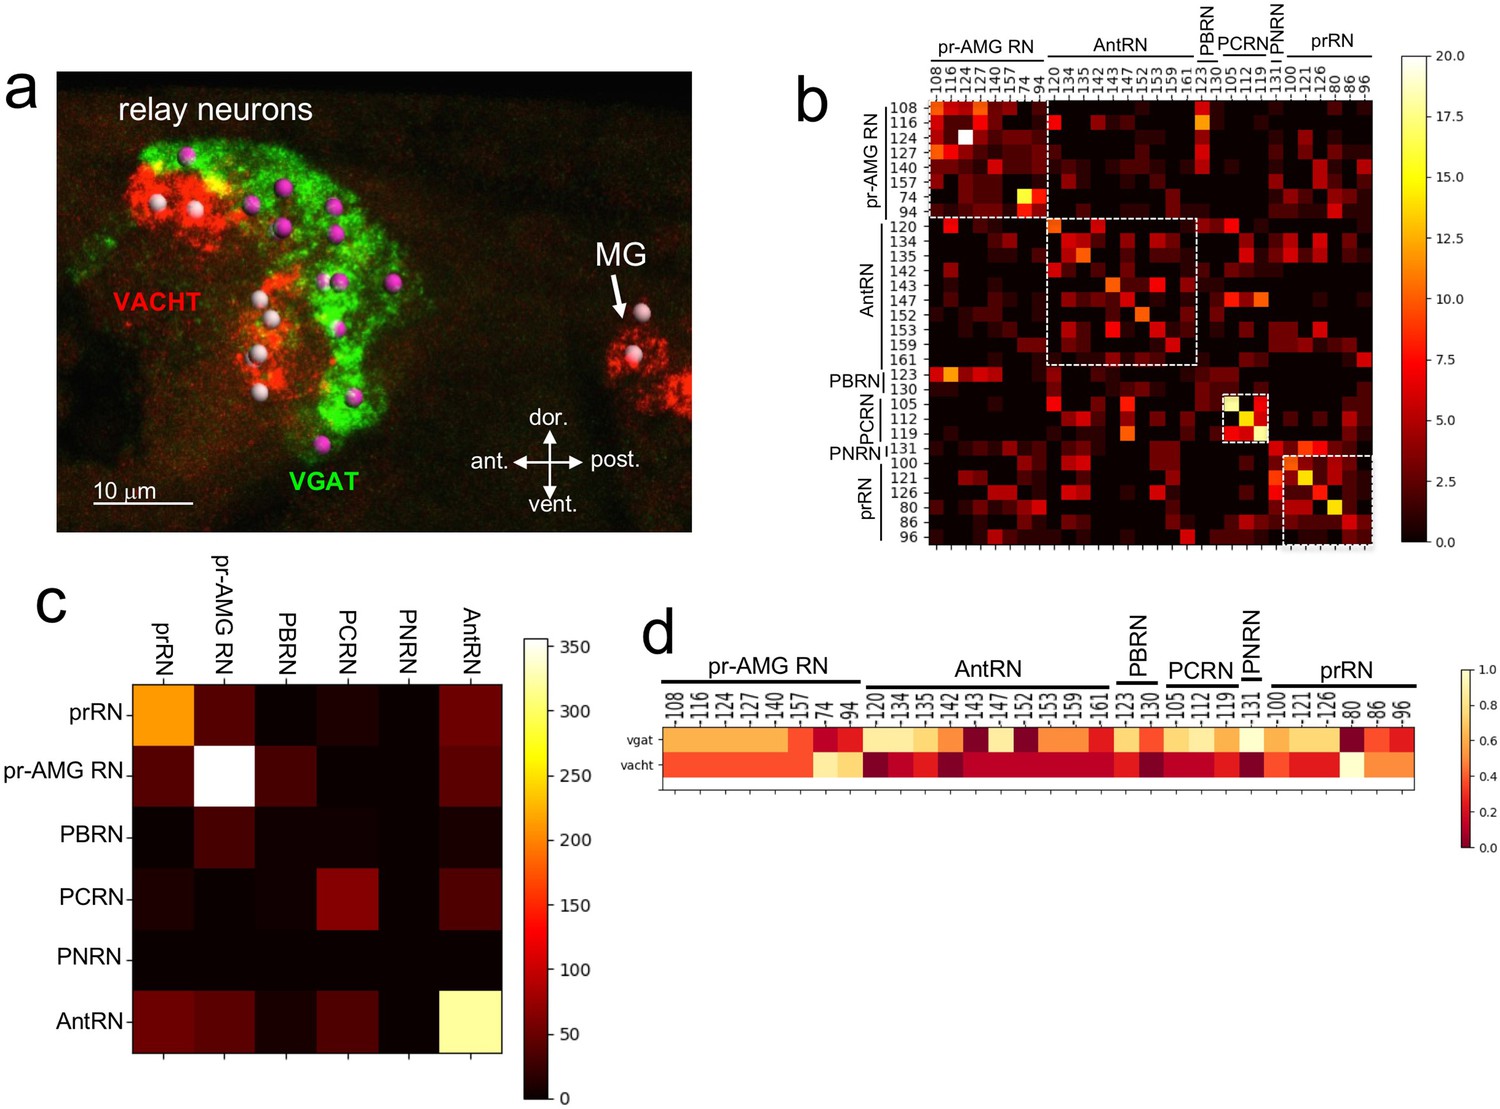
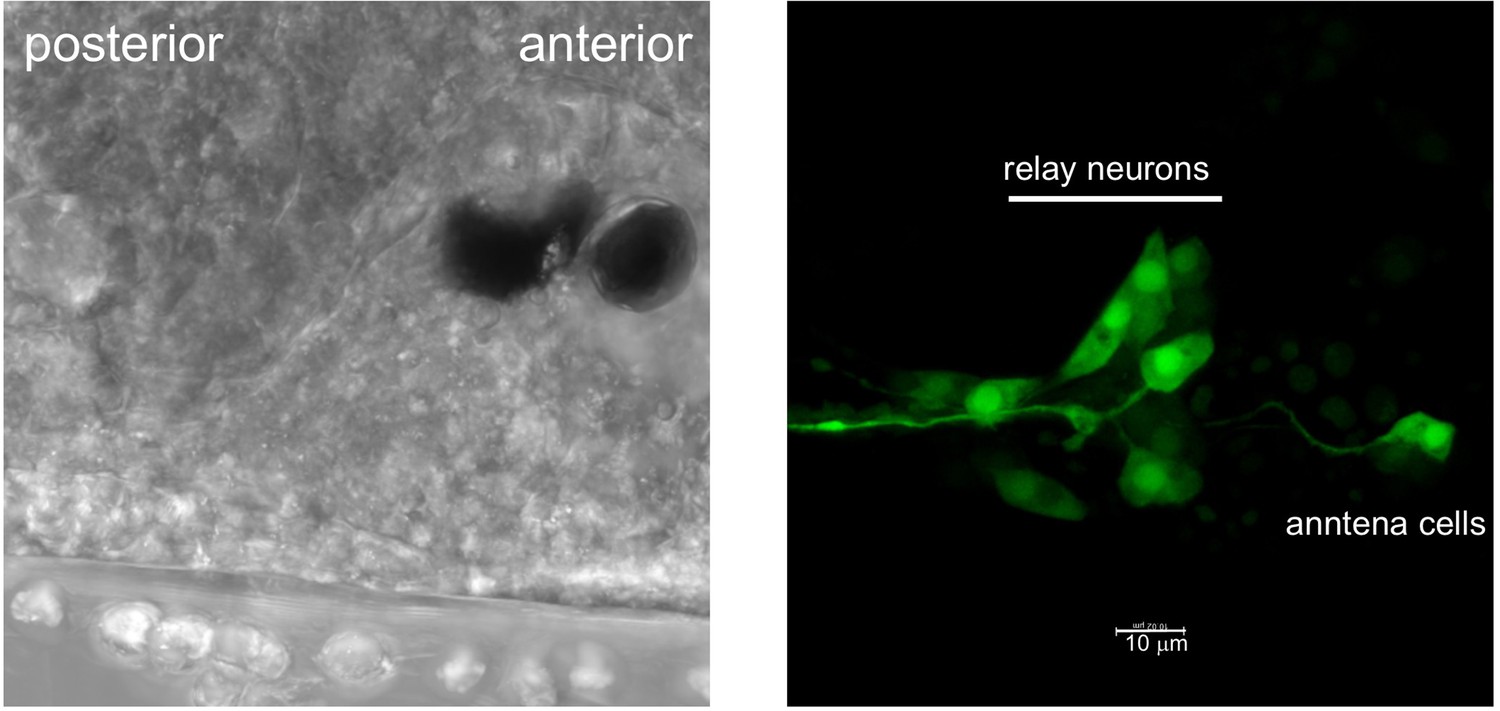
Neurotransmitter use in the relay neurons.
(a) In situ hybridization of VGAT and VACHT to the relay neurons in the brain vesicle. Also visible is the anterior tip of the motor ganglion. Nuclei are shown as spheres. (b) Confusion matrix for relay neuron registration. (c) Confusion matrix for relay neurons grouped by type. (d) Heat map of neurotransmitter predictions from cell registration of relay neurons, with scale showing color by proportion of iterations predicting either VGAT or VACHT. Abbreviations: ant., anterior; post., posterior; dor., dorsal; vent., ventral; MG, motor ganglion; pr-AMG RN, photoreceptor ascending motor ganglion relay neuron; prRN, photoreceptor relay neuron; AntRN, antenna cell relay neuron; PBRN, photoreceptor-bipolar tail neuron relay neuron; PCRN, photoreceptor-coronet relay neuron; PNRN, peripheral relay neuron; VGAT, vesicular GABA transporter; VACHT, vesicular acetylcholine transporter.
Figure 3—figure supplement 1
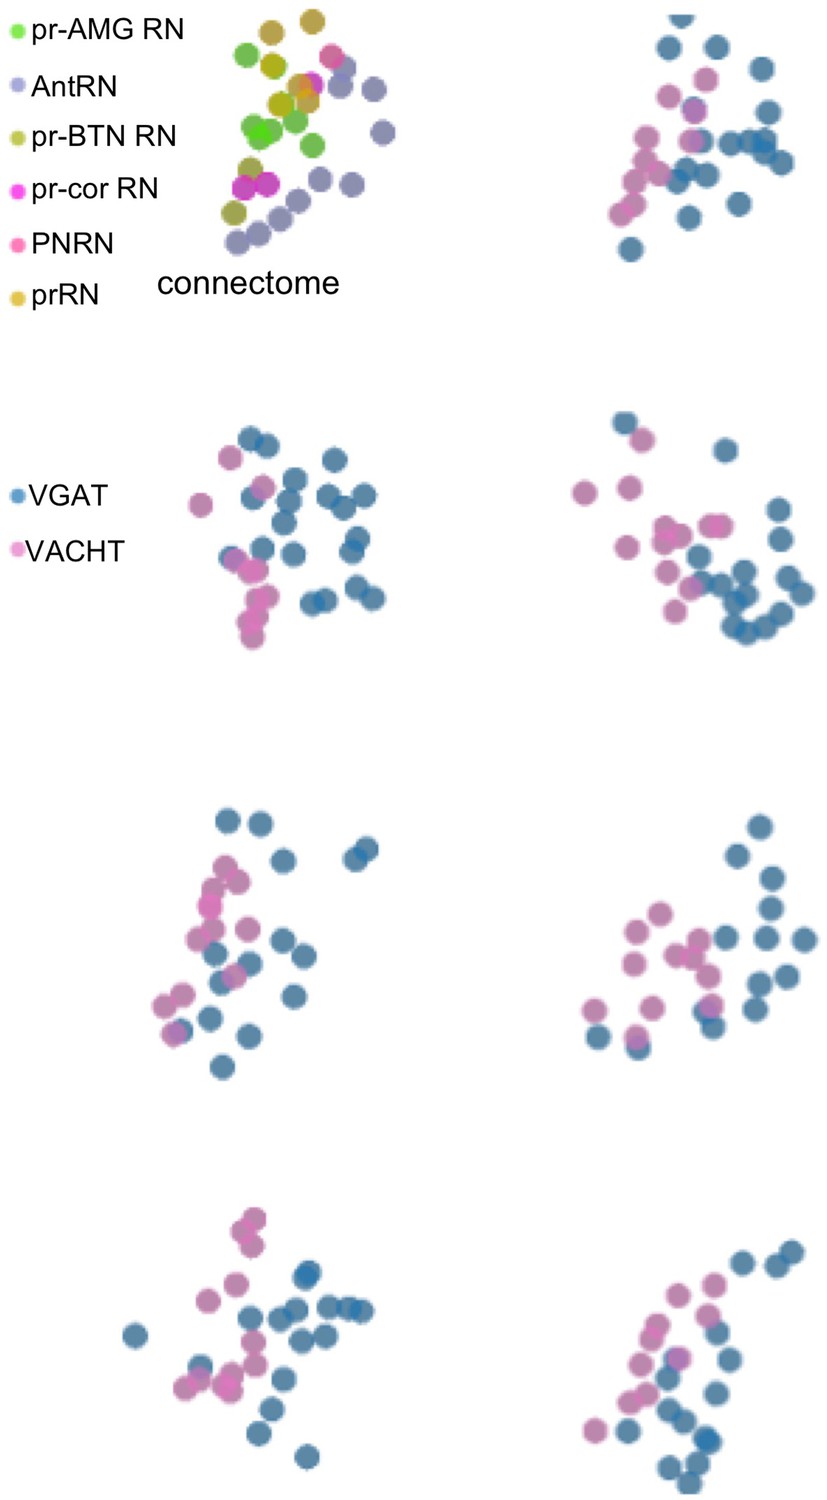
Relay neuron centroids projected in two dimensions.
The top left panel is from the connectome, and the remaining panels show centroids from seven larvae. Anterior is to the left and dorsal is at the top.
Figure 4 with 1 supplement
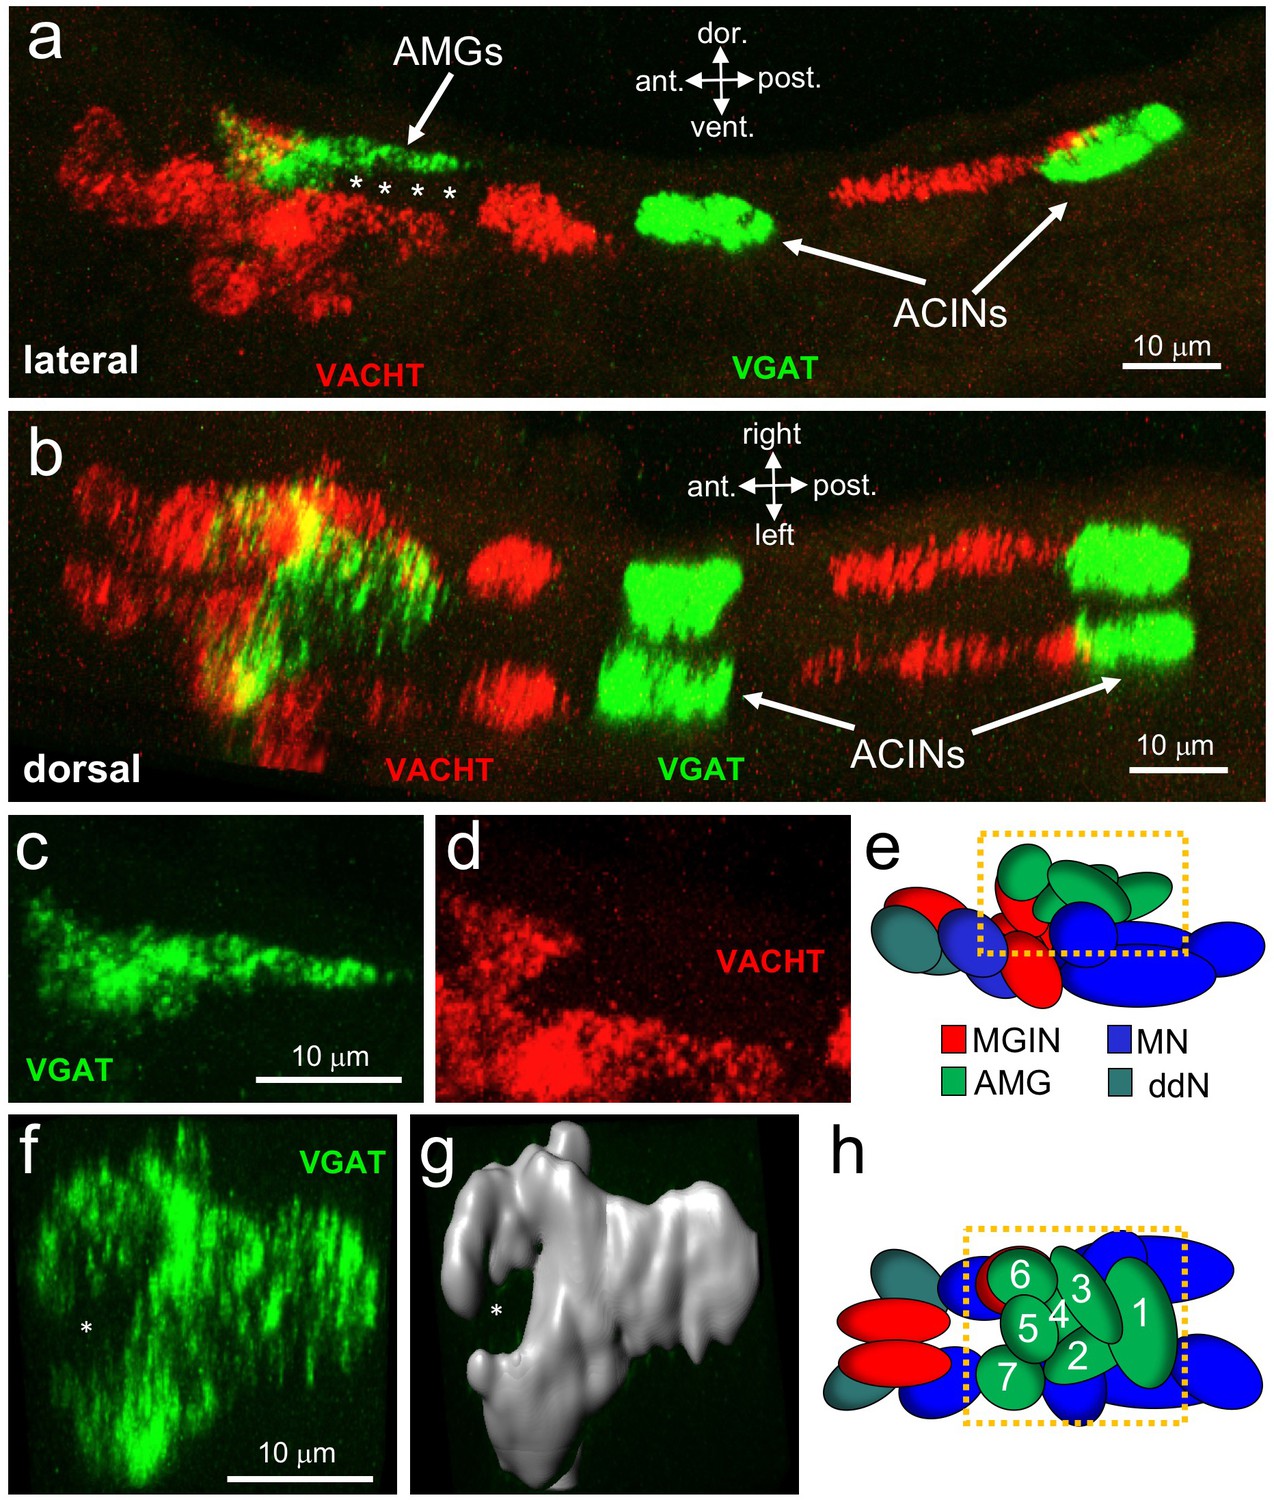
Neurotransmitter use in the motor ganglion.
(a and b) Expression of VGAT and VACHT by in situ hybridization in the motor ganglion, lateral (a) and dorsal (b) views. Asterisks indicate predicted ependymal cells. (c) Lateral view of VGAT expression in the AMGs. (d) shows same view as c, but with VACHT expression. (e) Diagram of neurons in the motor ganglion (derived from Figure 1 of Ryan et al., 2017). Box indicates approximate positions of panels c and d. Lateral view; anterior is to the left. (f) Dorsal view of VGAT expression in the AMGs. Asterisk indicates central non-VGAT expressing cell. (g) Three dimensional surface rendering of VGAT expressing cells in the AMGs. (h) Diagram of a dorsal view of the motor ganglion. AMG cells are numbered. Abbreviations: dor., dorsal; vent., ventral; ant., anterior; post., posterior; AMG, ascending motor ganglion neuron; MGIN, motor ganglion interneuron; ddN, descending decussating neurons; ACIN, ascending contralateral inhibitory neurons; MN, motor neuron; VGAT, vesicular GABA transporter; VACHT, vesicular acetylcholine transporter.
Figure 4—figure supplement 1
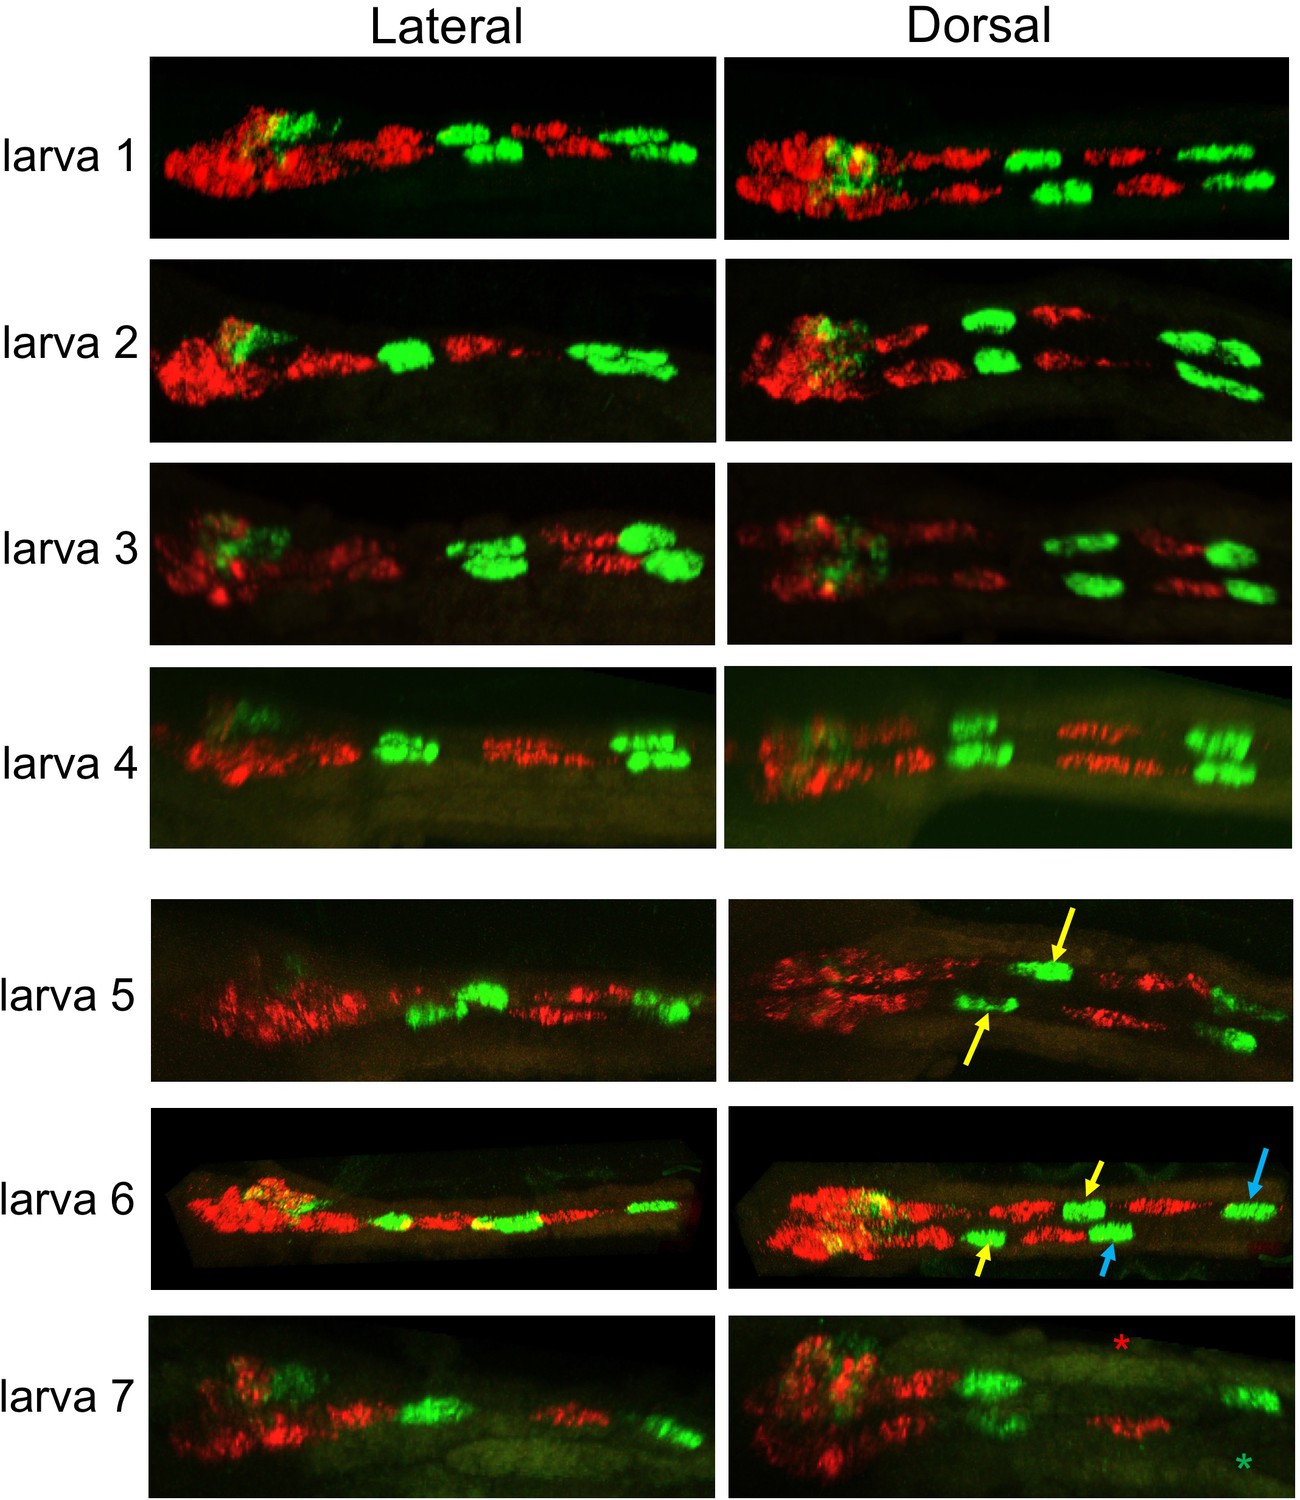
Representative larvae showing expression pattern for VGAT (green) and VACHT (red) by HCR in situ.
Top four larvae show the most common expression pattern (also observed in larva shown in Figure 4). Larvae 5 and 6 have offset ACINs (arrows). Larva seven is missing both a motor neuron (red asterisk) and an ACIN (green asterisk). Anterior is to the left in all samples.
Figure 5 with 1 supplement
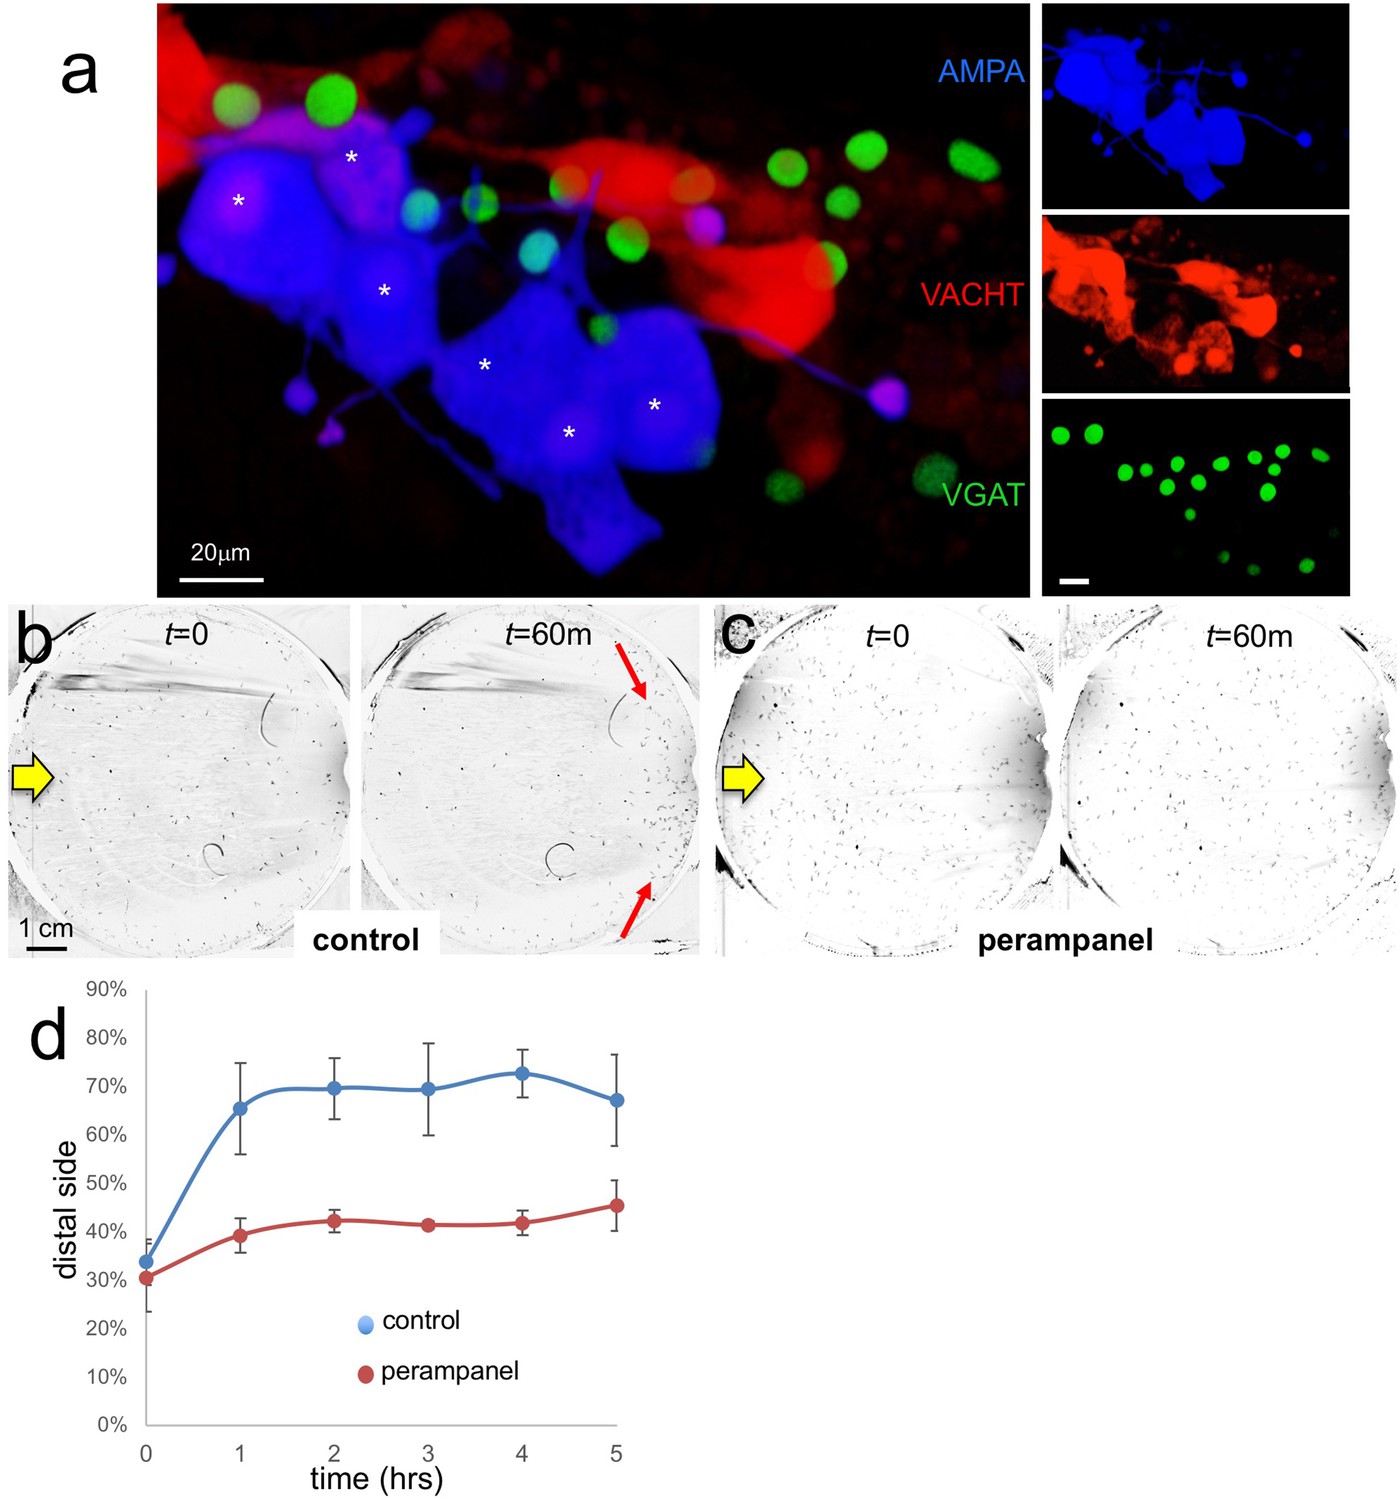
AMPA receptors in negative phototaxis.
(a) Coexpression of an AMPA-receptor and VACHT expression constructs in the relay neurons (white asterisks). The main panel shows the merge while smaller panels at right show single channels. (b) Negative phototaxis assay in control larvae. Yellow arrow indicates direction of 505 nm light. By 60 min (m) the majority of the larvae have swum to the side of the dish away from the light (red arrow). (c) Perampanel-treated larvae do not show negative phototaxis. (d) Quantification of negative phototaxis in control and perampanel-treated larvae. Points indicate the averages from three independent assays, ±standard deviation. Y-axis represents the percentage of larvae found on the side away from the light source (distal third). Abbreviations: VGAT, vesicular GABA transporter; VACHT, vesicular acetylcholine transporter.
-
Figure 5—source data 1
Source data for Figure 5D.
- https://doi.org/10.7554/eLife.44753.013
Figure 5—figure supplement 1
AMPA-receptor neurons in the Ciona brain vesicle identified with an AMPA-receptor promoter construct driving GFP.
https://doi.org/10.7554/eLife.44753.012
Figure 6
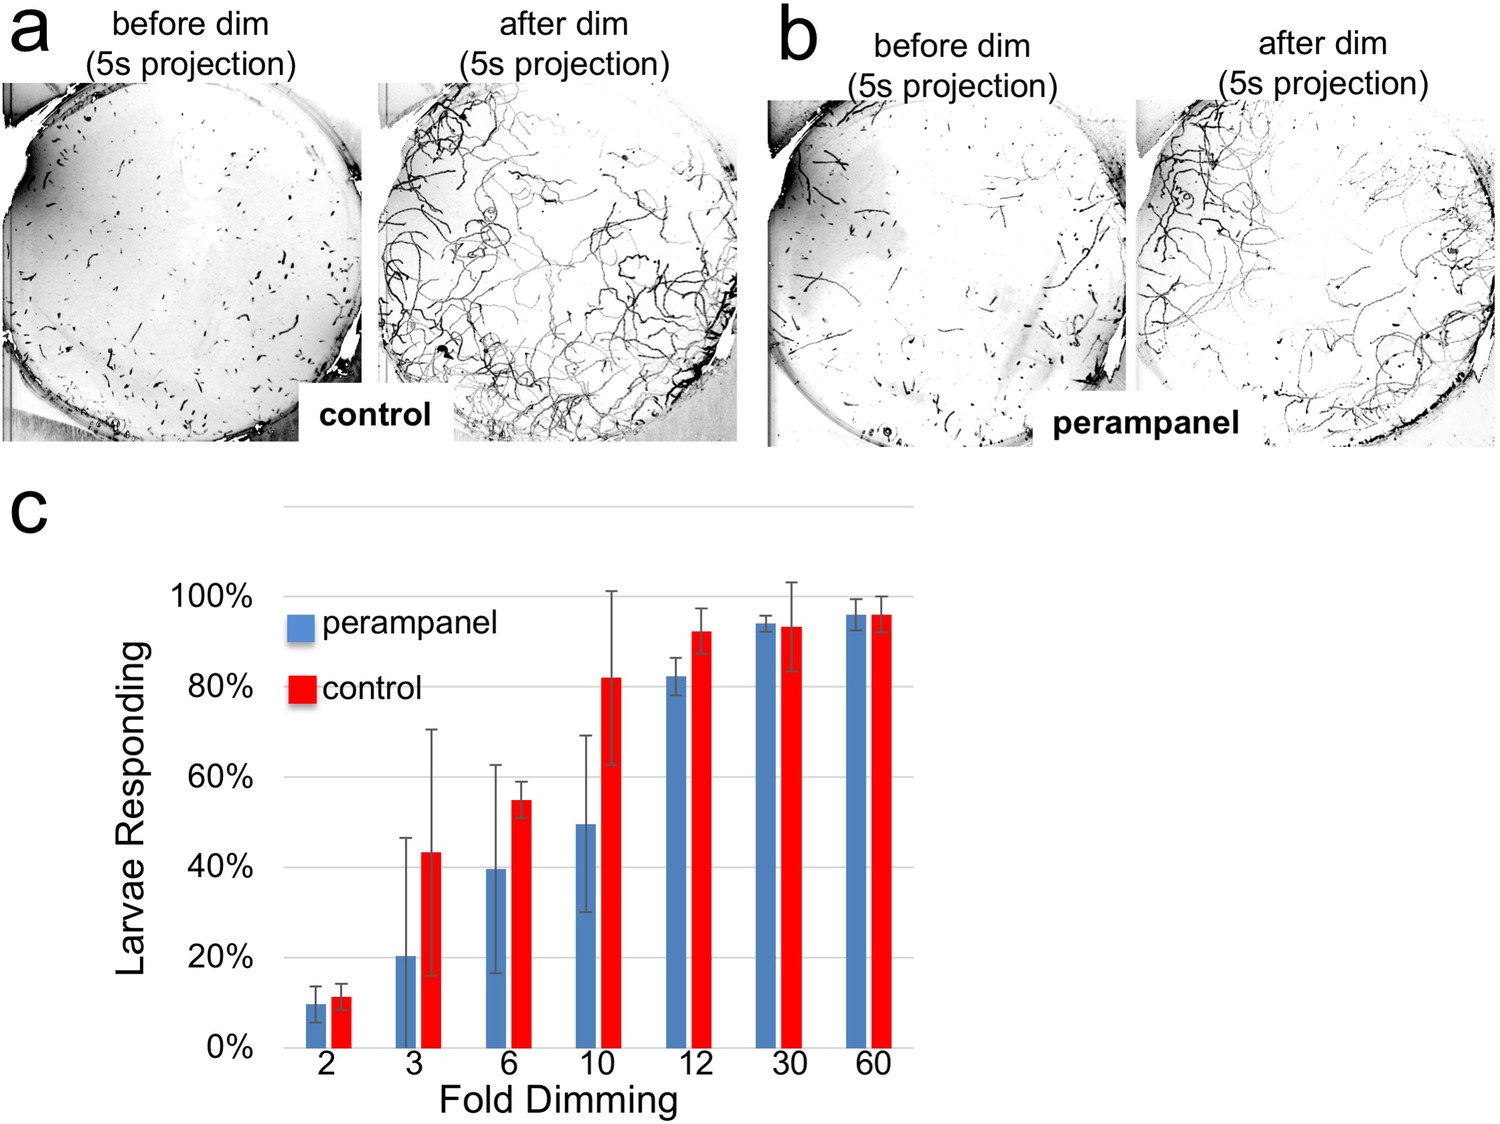
Perampanel does not disrupt the light dimming response.
(a) Light dimming response in control larvae. Shown are 5 s (s) projections from time-lapse videos in which swims appear as lines. Left panel shows a projection 5 s before dimming, and right panel 5 s after dimming. (b) same as a, but larvae were perampanel-treated. (c) Quantification of light dimming response in control and perampanel treated larvae. Larvae were exposed to dimming of 505 nm light from 2- to 60-fold. Dimming response was scored as percent of larvae responding. Bars show averages of three independent assays ± standard deviation.
-
Figure 6—source data 1
Source data for Figure 6C.
- https://doi.org/10.7554/eLife.44753.016
Figure 7
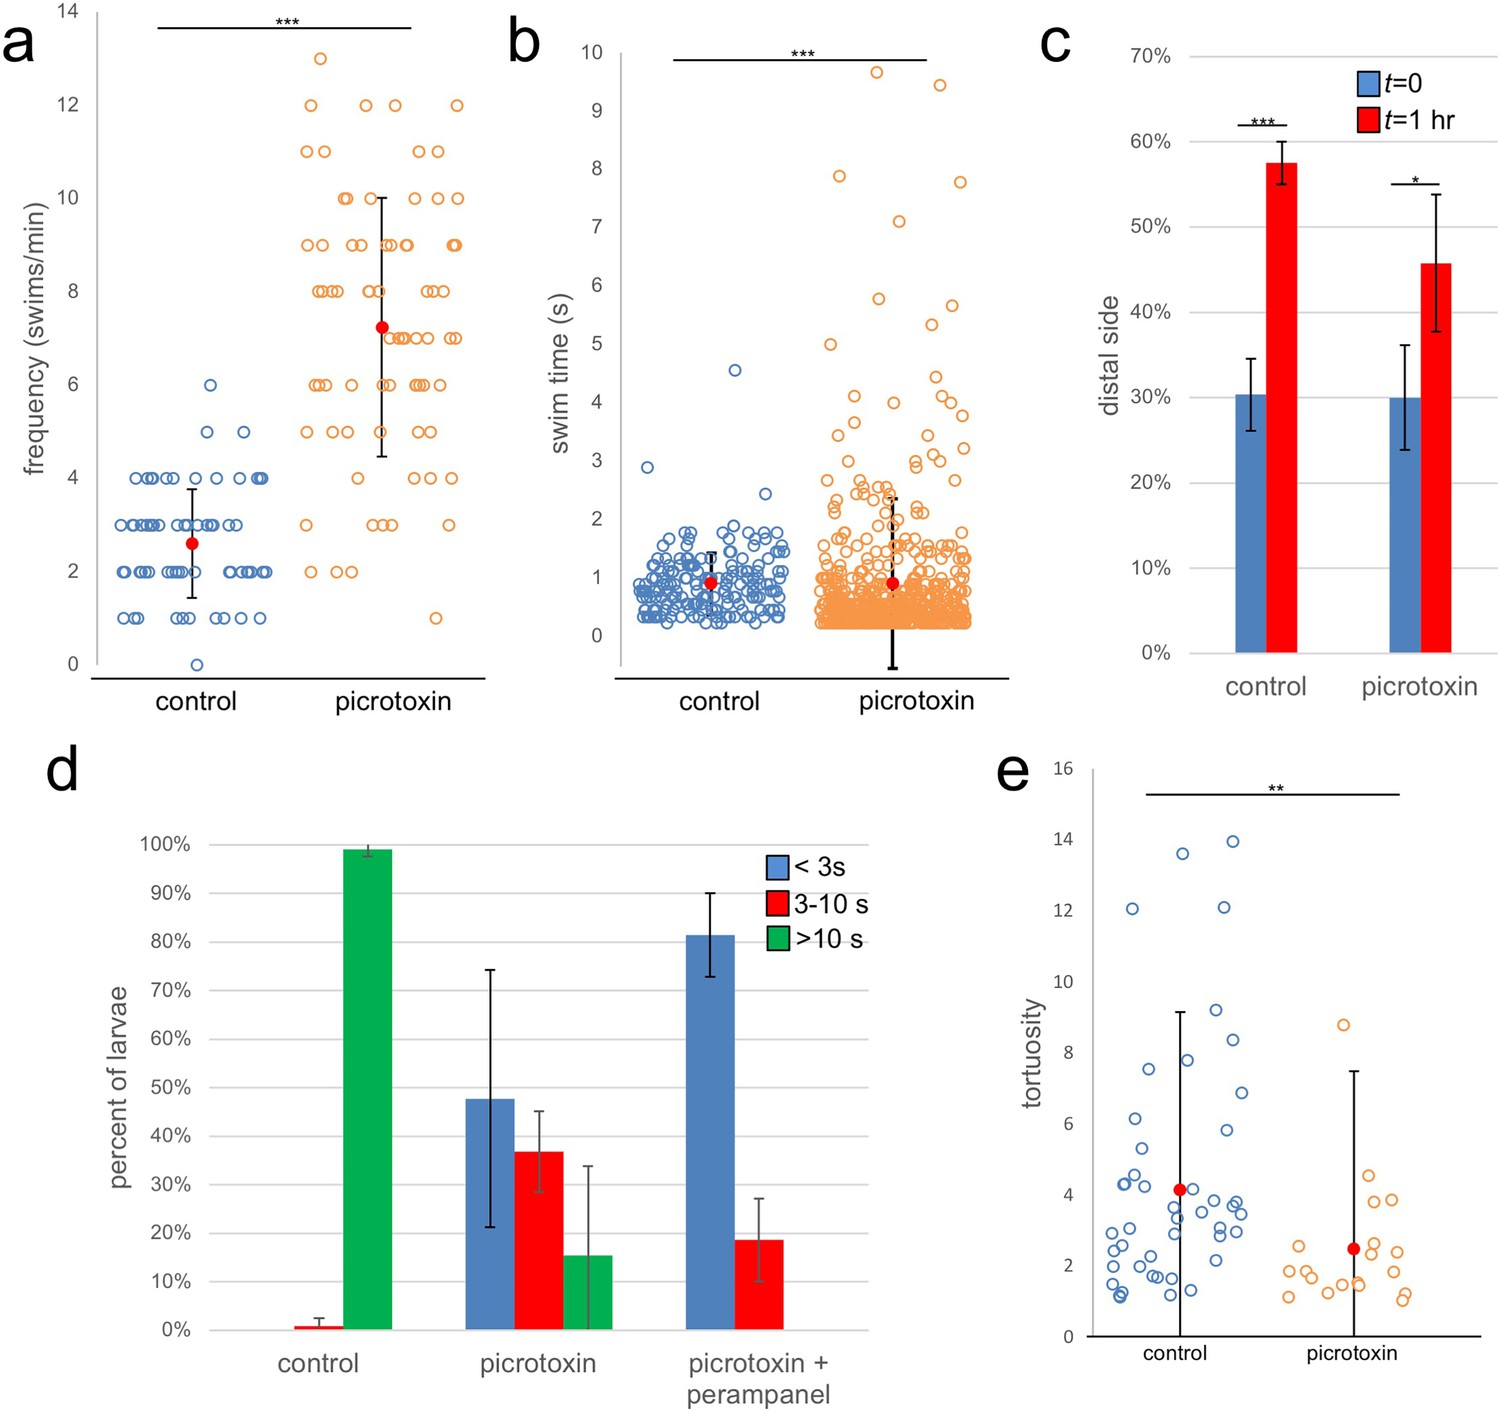
Effects of the GABA receptor antagonist picrotoxin on swimming behavior.
(a) Frequency of spontaneous swims for control (vehicle only) and picrotoxin-treated larvae in dark conditions (i.e., 700 nm illumination). Each open circle represents a single tracked larva with the number of swim bouts in one minute presented. Also shown are the averages (red circles)±standard deviation. (b) Duration of spontaneous swims in seconds (s). Each circle is one swim bout recorded during a one-minute capture session. (c) Picrotoxin-treated larvae retain negative phototaxis. Bars show the averages of three trails and present the percentage of larvae in the side of the petri dish opposite the illumination (distal third of dish). (d) Dimming response is diminished in picrotoxin-treated larvae, and further diminished by cotreatment with picrotoxin and perampanel. Shown are the averages of three independent trials (37–99 larvae quantified per trial). Data shows the duration in seconds (s) of swims. (e) Tortuosity of sustained swims (>10 s) for control and picrotoxin-treated larvae. Data is presented as in panel a. *, p<0.05; **, p<0.01; ***, p<0.001.
Figure 8
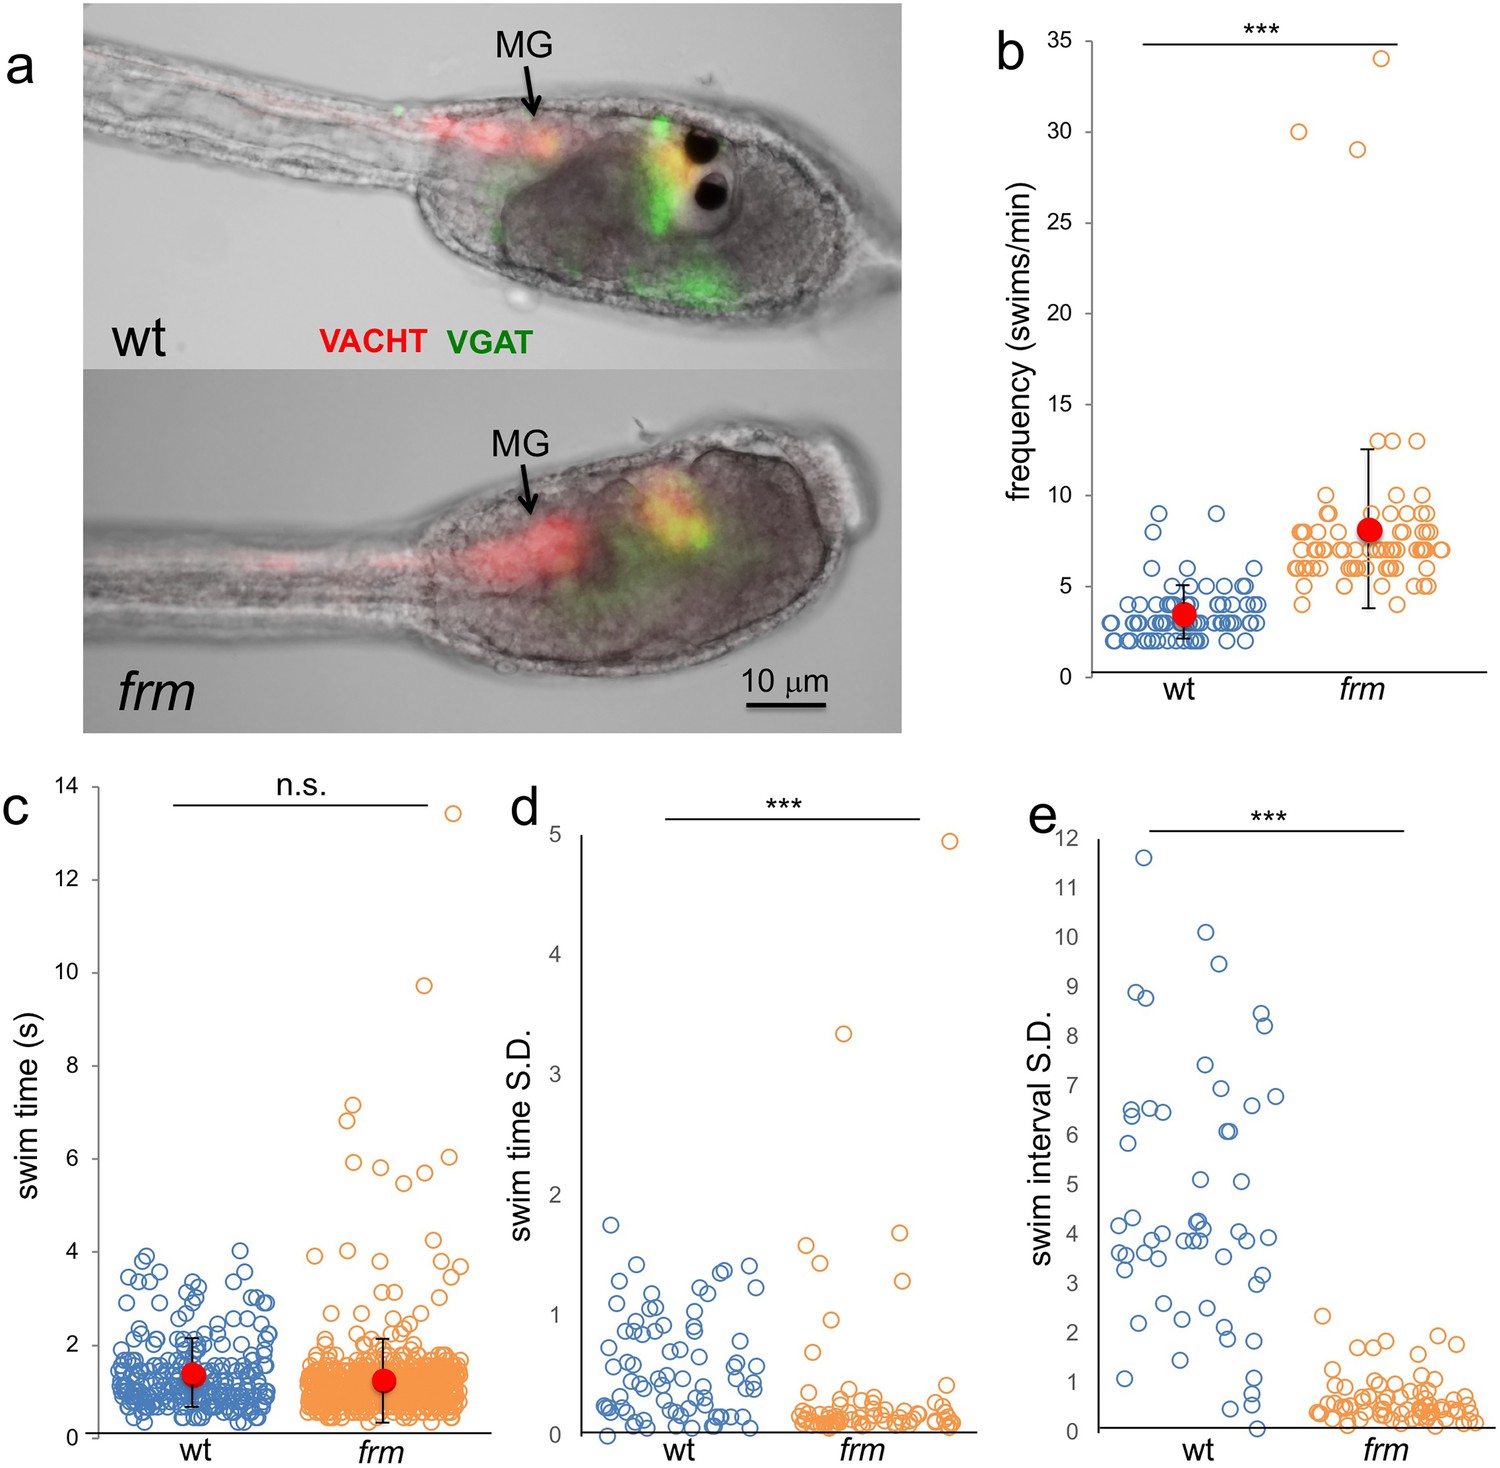
Behavior of homozygous frimousse (frm) larvae.
(a) VGAT and VACHT reporter construct expression in wild type (wt) and frm larvae. (b) Frequency of spontaneous swims of wt and frm larvae in dark conditions (i.e., 700 nm illumination). Each open circle represents one tracked larva with the number of swim bouts in one minute presented. Also shown are the averages (red circles) ±standard deviation. (c) Duration of all spontaneous swims in one-minute recording presented in seconds (s) for wt and frm larvae. (d) Standard deviation (S.D.) of the duration of swim bouts over one minute for each individual larva recorded. (e) S.D. of the interval between swim bouts over one minute for each individual larva recorded. For d and e, larvae with <4 swim bouts were not included in the analysis. ***, p<0.001; n.s., not significant.
Figure 9
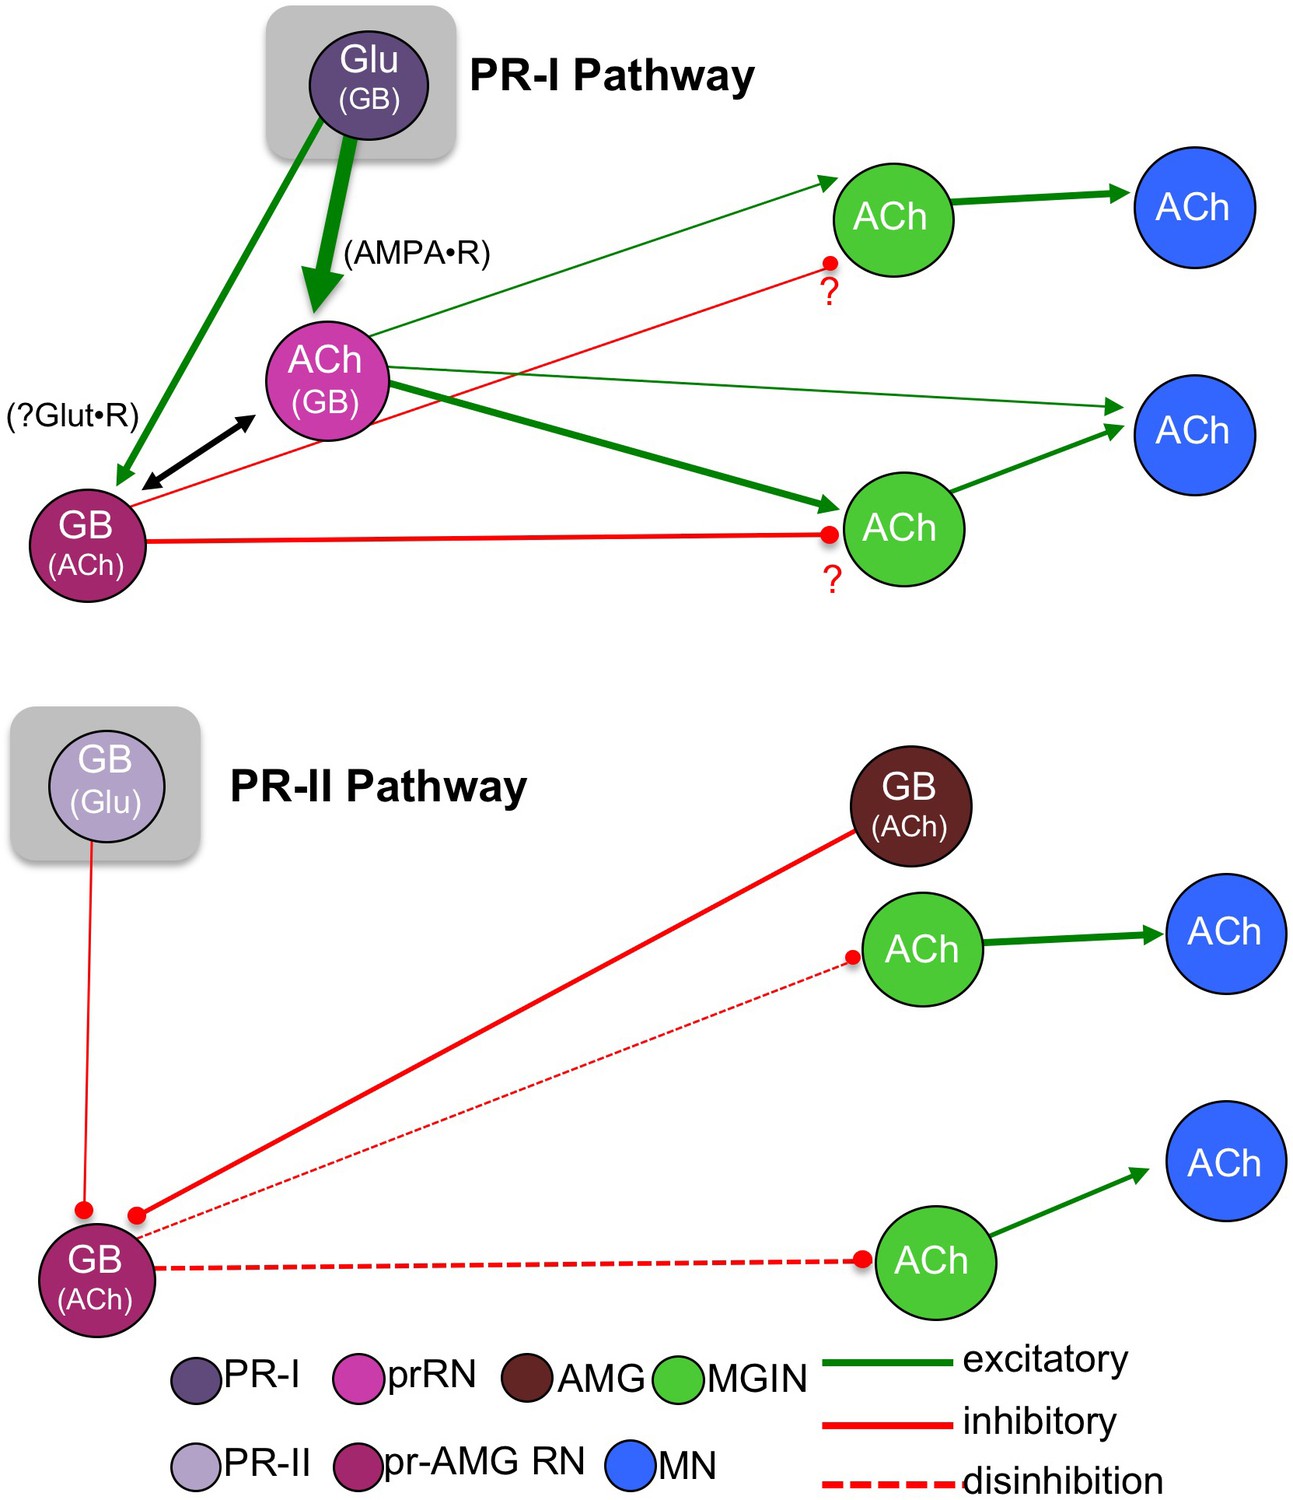
Models showing parallel visuomotor pathways for negative phototaxis (top) and light dimming response (bottom).
Neurotransmitters in parentheses are thought to play a lesser role in the proposed pathway. Abbreviations: PR-II, photoreceptor group II; PR-I, photoreceptor group I; pr-AMG RN, photoreceptor ascending motor ganglion relay neuron; prRN, photoreceptor relay neuron; MGIN, motor ganglion interneuron; MN, motor neuron; Glu, glutamate; GB, GABA; ACh, acetylcholine. Cell types are color coded according to Satoh (1994).
Videos
Video 1
Negative phototaxis of control and perampanel-treated Ciona larvae in 10 cm petri dishes.
Directional 505 nm illumination is from the left. Frames were taken at 1 per minute over five hours. In the video the 5 hr is compressed to 15 s (i.e., 1200X normal speed). Black and white tones were inverted to make the larvae more visible.
Video 2
Swimming of control and perampanel-treated Ciona larvae in a directional light field.
Larvae in 10 cm petri dishes were recorded at nine frames/second. Black and white tones were inverted to make the larvae more visible. The video plays at 5X normal speed.
Video 3
Dimming response of control and perampanel-treated Ciona larvae in 10 cm petri dishes.
Larvae were imaged for 70 s at five frames/second, with dimming of 505 nm ambient light at 10 s. Black and white tones were inverted, and thus the dimming appears as a brightening. The video plays at 5X normal speed.
Video 4
Spontaneous swimming behavior in control and picrotoxin-treated Ciona larvae.
Larvae in 6 cm petri dishes were recorded for 1 min at nine frames/second with 700 nm illumination. Black and white tones were inverted to make the larvae more visible. The video plays at 5X normal speed.
Video 5
Negative phototaxis of control and picrotoxin-treated Ciona larvae in 10 cm petri dishes.
Picrotoxin-treated larvae can be seen to stop swimming at ~1 hr. Directional 505 nm illumination is from the left. Frames were taken at one per minute over five hours. In the video the 5 hr is compressed to 15 s (i.e., 1200X normal speed). Black and white tones were inverted to make the larvae more visible.
Video 6
Dimming response of control and picrotoxin-treated Ciona larvae in 10 cm petri dishes.
Larvae were imaged for 20 s at five frames/second, with dimming of 505 nm ambient light at 10 s. Black and white tones were inverted, and thus the dimming appears as a brightening. The video plays at 2X normal speed.
Video 7
Spontaneous swimming behavior in wild type and homozygous frimousse larvae.
Larvae in 6 cm petri dishes were recorded for 1 min at 9 frames/second with 700 nm illumination. Black and white tones were inverted to make the larvae more visible. The video plays at 5X normal speed.
Tables
Key resources table
| Reagent type (species) or resource | Designation | Source or reference | Identifiers | Additional information |
|---|---|---|---|---|
| Chemical compound, drug | fluorescently-labeled RNA probes for VGAT, VGLUT, VACHT | Molecular instruments | ||
| Chemical compound, drug | SlowFade Gold | Invitrogen | ||
| Chemical compound, drug | perampanel | Santa Cruz Biotech; Adooq Bioscience | ||
| Chemical compound, drug | picrotoxin | Tocris | ||
| Equipment | 700 nm and 505 nm led light sources | Mightex | ||
| Equipment | light meter | Extech Instruments | ||
| Recombinant DNA reagent | Ciona robusta pVGAT > CFP | Yasunori Sasakura, University of Tsukuba, Japan | ||
| Recombinant DNA reagent | C. robusta opsin promoter (as pSP-Ci-opsin1) | Takeo Horie, Tsukuba University, Japan; Takehiro Kusakabe, Konan University, Japan | ||
| Recombinant DNA reagent | synthesized RFP | Gene Block; IDT | ||
| Recombinant DNA reagent | C. robusta pAMPAR > GFP | Haruo Okado, Tokyo Metropolitan Institute of Medical Science, Japan | See Hirai et al., (Hirai et al., 2017). | |
| Recombinant DNA reagent | C. robusta pOpsin > RFP | This paper. | This construct was created using the opsin promoter (Horie and Kusakabe) and a synthesized RFP (Gene Block, IDT). | |
| Recombinant DNA reagent | C. robusta pVGAT > H2B::RFP | This paper. | This construct was created using the Gateway cloning system, cloning pVGAT into pDONR-221-P3-P5, then recombining with an H2B::RFP entry clone. | |
| Software, algorithm | Python v 2.7 | Python Software Foundation | ||
| Software, algorithm | Microsoft Excel | Microsoft | ||
| Software, algorithm | Imaris v 9.1 | Bitplane | ||
| Software, algorithm | MATLAB | WolframAlpha | ||
| Software, algorithm | ELIANE script for MATLAB | This paper. | Estimator of Locomotion Iterations for Animal Experiments; a MATLAB script for tracking swimming larvae during behavioral assays. | |
| Strain, strain background | C. intestinalis | Marine Biological Laboratory, Woods Hole, Massachusetts, USA | Formerly known as C. intestinalis type B. | |
| Strain, strain background | C. robusta | Santa Barbara Harbor, USA; S. Lepage, M-REP, Carlsbad, USA | Formerly known as C. intestinalis type A. | |
| Strain, strain background | pVGAT > kaede, C. robusta stable line | National Bioresource Project, Japan | ||
Additional files
-
Source code 1
Calculates transformation between each dataset in a folder and the EM data based on nuclei location in 3D.
- https://doi.org/10.7554/eLife.44753.026
-
Source code 2
Calculates cell assignments based on an affine transformation between each dataset and the EM data based on nuclei location in 3D.
- https://doi.org/10.7554/eLife.44753.027
-
Source code 3
Plots the nucleus locations in 3D for each dataset along with the EM dataset using Plot.ly.
- https://doi.org/10.7554/eLife.44753.028
-
Source code 4
Estimator of locomotion iterations for animal experiments: Stimulus Response Tracker v0.07 (Matlab script).
- https://doi.org/10.7554/eLife.44753.029
-
Source data 1
Photoreceptor matrix.
- https://doi.org/10.7554/eLife.44753.030
-
Source data 2
Relay neuron matrix.
- https://doi.org/10.7554/eLife.44753.031
-
Source data 3
Grouped relay neuron matrix.
- https://doi.org/10.7554/eLife.44753.032
-
Supplementary file 1
Nucleotide sequences for HCR probe selection.
- https://doi.org/10.7554/eLife.44753.033
-
Transparent reporting form
- https://doi.org/10.7554/eLife.44753.034
Download links
A two-part list of links to download the article, or parts of the article, in various formats.
Downloads (link to download the article as PDF)
Open citations (links to open the citations from this article in various online reference manager services)
Cite this article (links to download the citations from this article in formats compatible with various reference manager tools)
Parallel visual circuitry in a basal chordate
eLife 8:e44753.
https://doi.org/10.7554/eLife.44753


