Myonuclear accretion is a determinant of exercise-induced remodeling in skeletal muscle
- Cincinnati Children’s Hospital Medical Center, United States
- University of Cincinnati College of Medicine, United States
- The Jackson Laboratory, United States
- University of Connecticut School of Medicine, United States
Figures
Figure 1
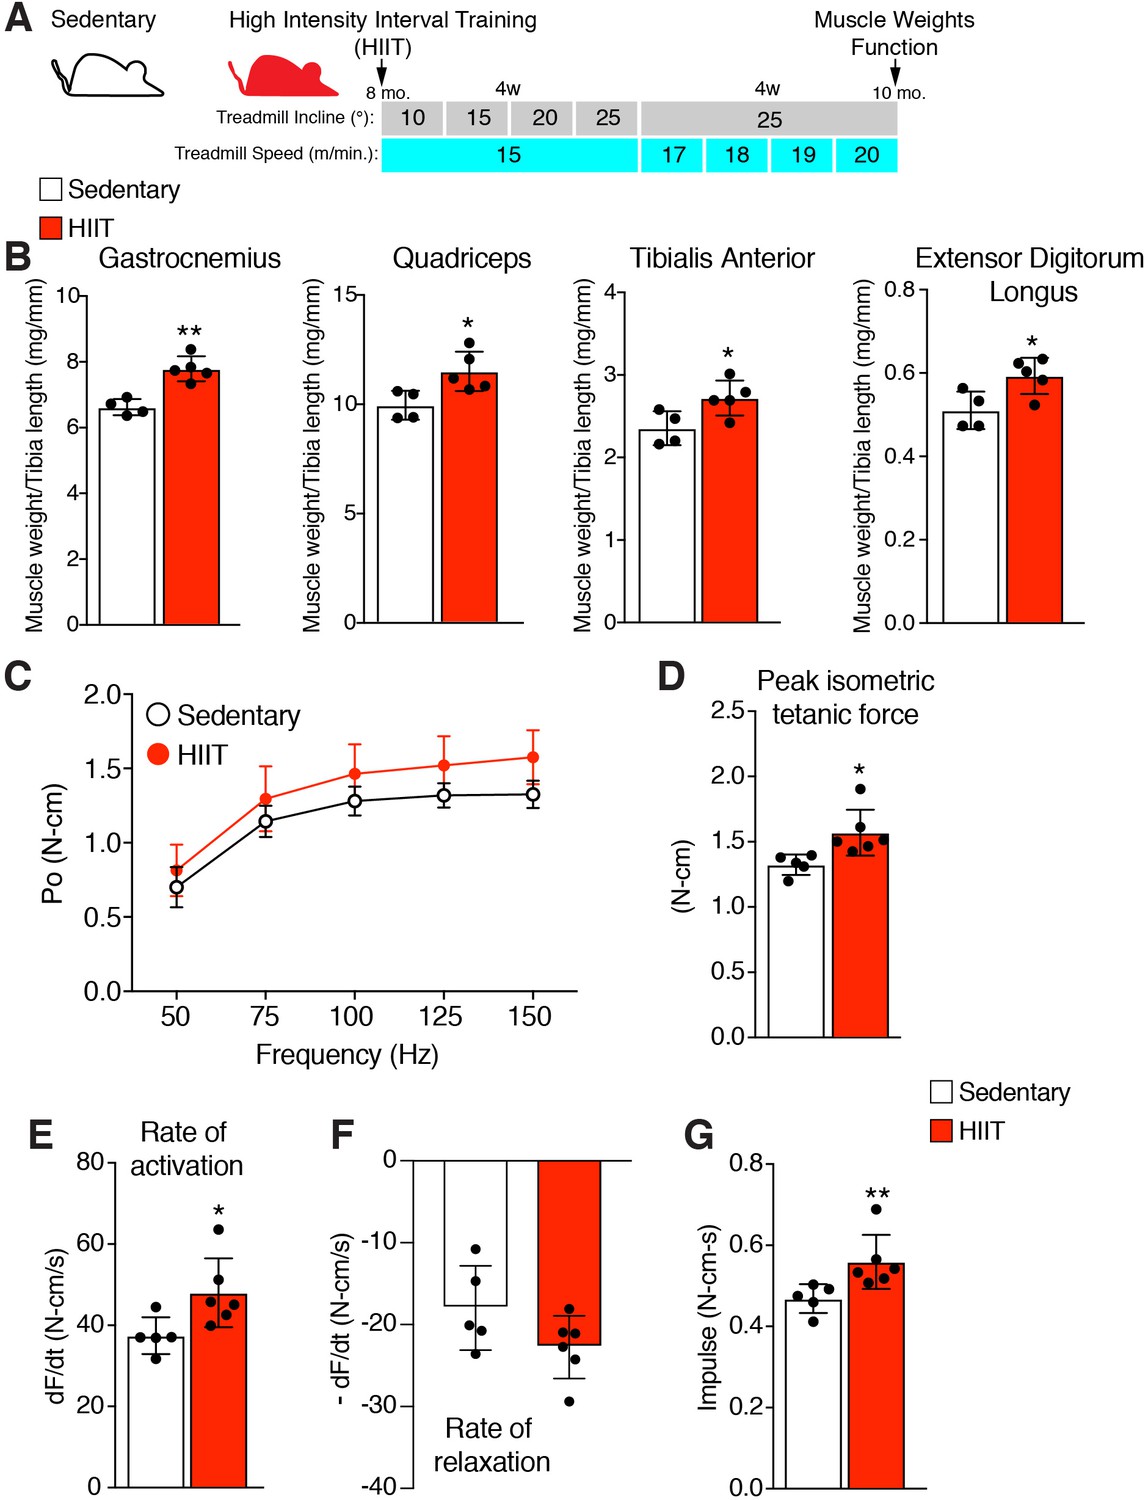
High intensity interval training (HIIT) in mice increases muscle size and strength.
(A) Schematic showing the HIIT protocol using a treadmill. During the initial 4 weeks (w) treadmill incline was increased gradually each week while speed remained constant. In the final 4 weeks, incline was set at 25° but speed increased gradually each week. See Materials and methods for further details. (B) Muscle weight to tibia length ratios for multiple muscles in sedentary and HIIT-trained (8 weeks) mice. (C–G) In vivo isometric tetanic force measurements of plantar flexor muscles demonstrates functional improvements in muscle strength after 8 weeks of HIIT. (C) Force-frequency curve, (D) peak force, (E) rate of force generation, (F) rate of contraction relaxation, and (G) impulse. Data are presented as mean ± SD. Statistical analyses: (B), (D), (E) unpaired two-tailed Student’s t-test, (G) Mann-Whitney test. *p<0.05, **p<0.01.
Figure 2 with 1 supplement

Persistent myonuclear accretion throughout HIIT while myofiber size increases between 4 and 8 weeks.
(A) Representative single EDL myofibers from sedentary mice or mice subjected to HIIT for various durations. Myofibers were stained with DAPI to identify nuclei. (B) Total nuclei number per myofiber was quantified from the myofibers in (A) showing that myonuclear accretion occurs throughout the protocol. (C) Representative images of muscle sections from sedentary and HIIT-trained mice. Sections were immunostained with laminin antibodies and DAPI. (D) Quantification of myofiber cross-sectional area (CSA) in the gastrocnemius and quadriceps from the various groups of mice showing an increase of CSA 8 weeks after initiation of HIIT. Data are presented as mean ± SD. Statistical analyses: (B), (D) 1-way ANOVA with a Tukey correction for multiple comparisons. *p<0.05, **p<0.01. Scale bars: 100 µm.
Figure 2—figure supplement 1

An independent method to assess myonuclear number confirms a progressive increase during HIIT.
(A) Sections from the indicated groups of WT mice were immunostained with dystrophin antibodies to identify the boundary of the myofiber (not shown). Myonuclei were identified as being entirely inside the dystrophin perimeter, and these nuclei were counted and normalized to myofiber number. (B) Comparison of the relative increase in myonuclear number (plotted as a percentage of sedentary controls) between analysis of EDL myofibers (total nuclei/myofiber) and quadriceps (nuclei within a dystrophin+ myofiber), which revealed that both methods detect a similar level of increase. Data are presented as mean ± SD. Statistical analysis: (A) 1-way ANOVA with a Tukey correction for multiple comparisons. *p<0.05.
Figure 3 with 2 supplements
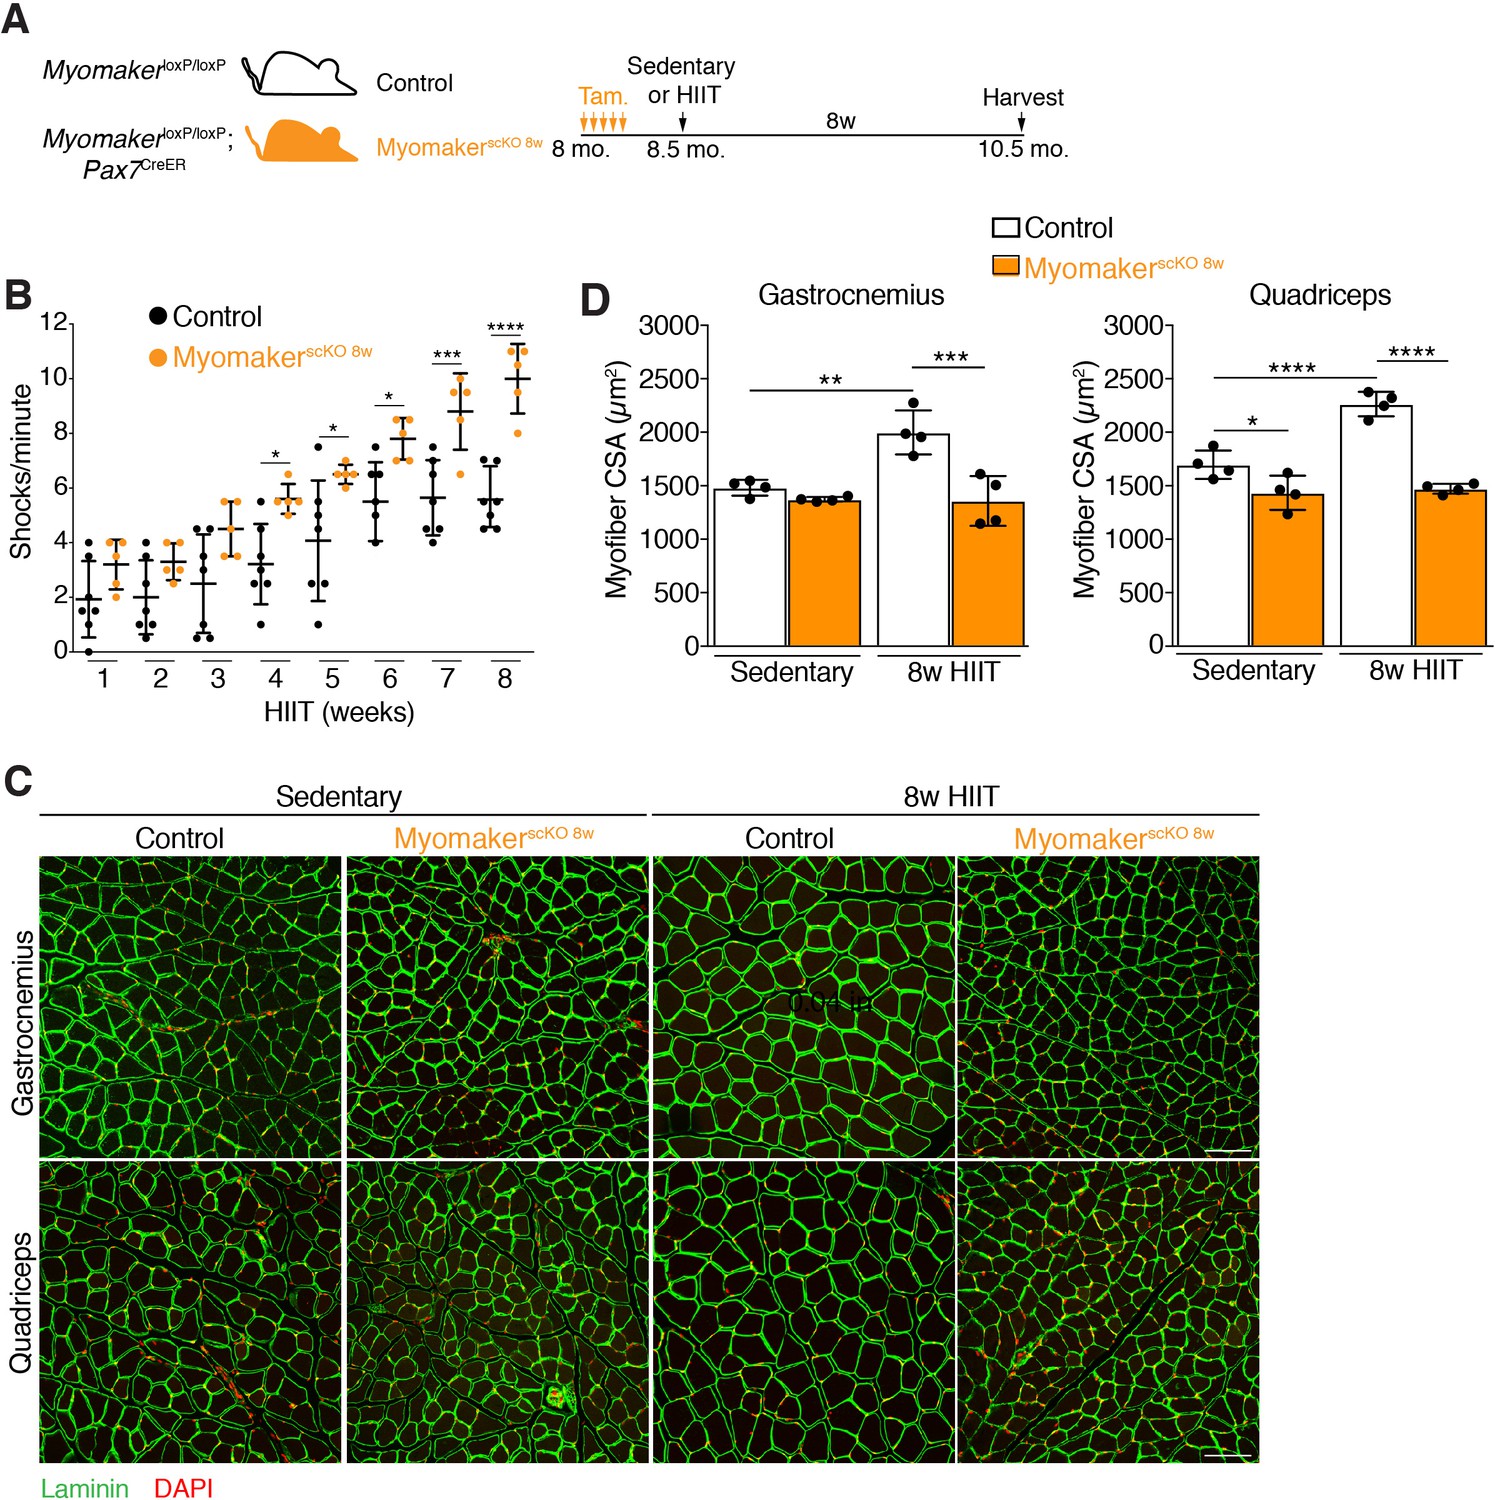
Genetic deletion of Myomaker in muscle progenitors at the onset of HIIT results in exercise intolerance and an absence of hypertrophy.
(A) Illustration of experimental strategy to render muscle progenitors fusion-incompetent prior to HIIT. (B) Quantification of the number of times control and MyomakerscKO 8w mice visited the shock grid at the bottom of the treadmill to assess the ability to accomplish the exercise protocol. (C) Representative sections from the gastrocnemius and quadriceps of control and MyomakerscKO 8w mice after HIIT. Sections were immunostained with laminin antibodies and DAPI. (D) Quantification of myofiber CSA from the samples in (C). Data are presented as mean ± SD. Statistical analyses: (B), (D) 2-way ANOVA with a Bonferroni correction for multiple comparisons. *p<0.05, **p<0.01, ***p<0.001, ****p<0.0001. Scale bars: 100 µm.
Figure 3—figure supplement 1

Loss of Myomaker at the onset of HIIT effectively blocks myonuclear accretion and impairs subsequent functional gains.
(A) Single EDL myofibers from sedentary and HIIT MyomakerscKO 8w mice where the nuclei were identified by DAPI staining. (B) Quantification of nuclei per myofiber from the samples in (A) demonstrates that MyomakerscKO 8w mice do not add nuclei. (C) Muscle weights of various muscles normalized to tibia length. (D) Peak force achieved through an in vivo muscle functional assessment shows that HIIT-trained MyomakerscKO 8w mice do not exhibit an increase in strength. All measurements were obtained after the conclusion of the 8 week HIIT protocol. Data are presented as mean ± SD. Scale bar: 100 µm.
Figure 3—figure supplement 2
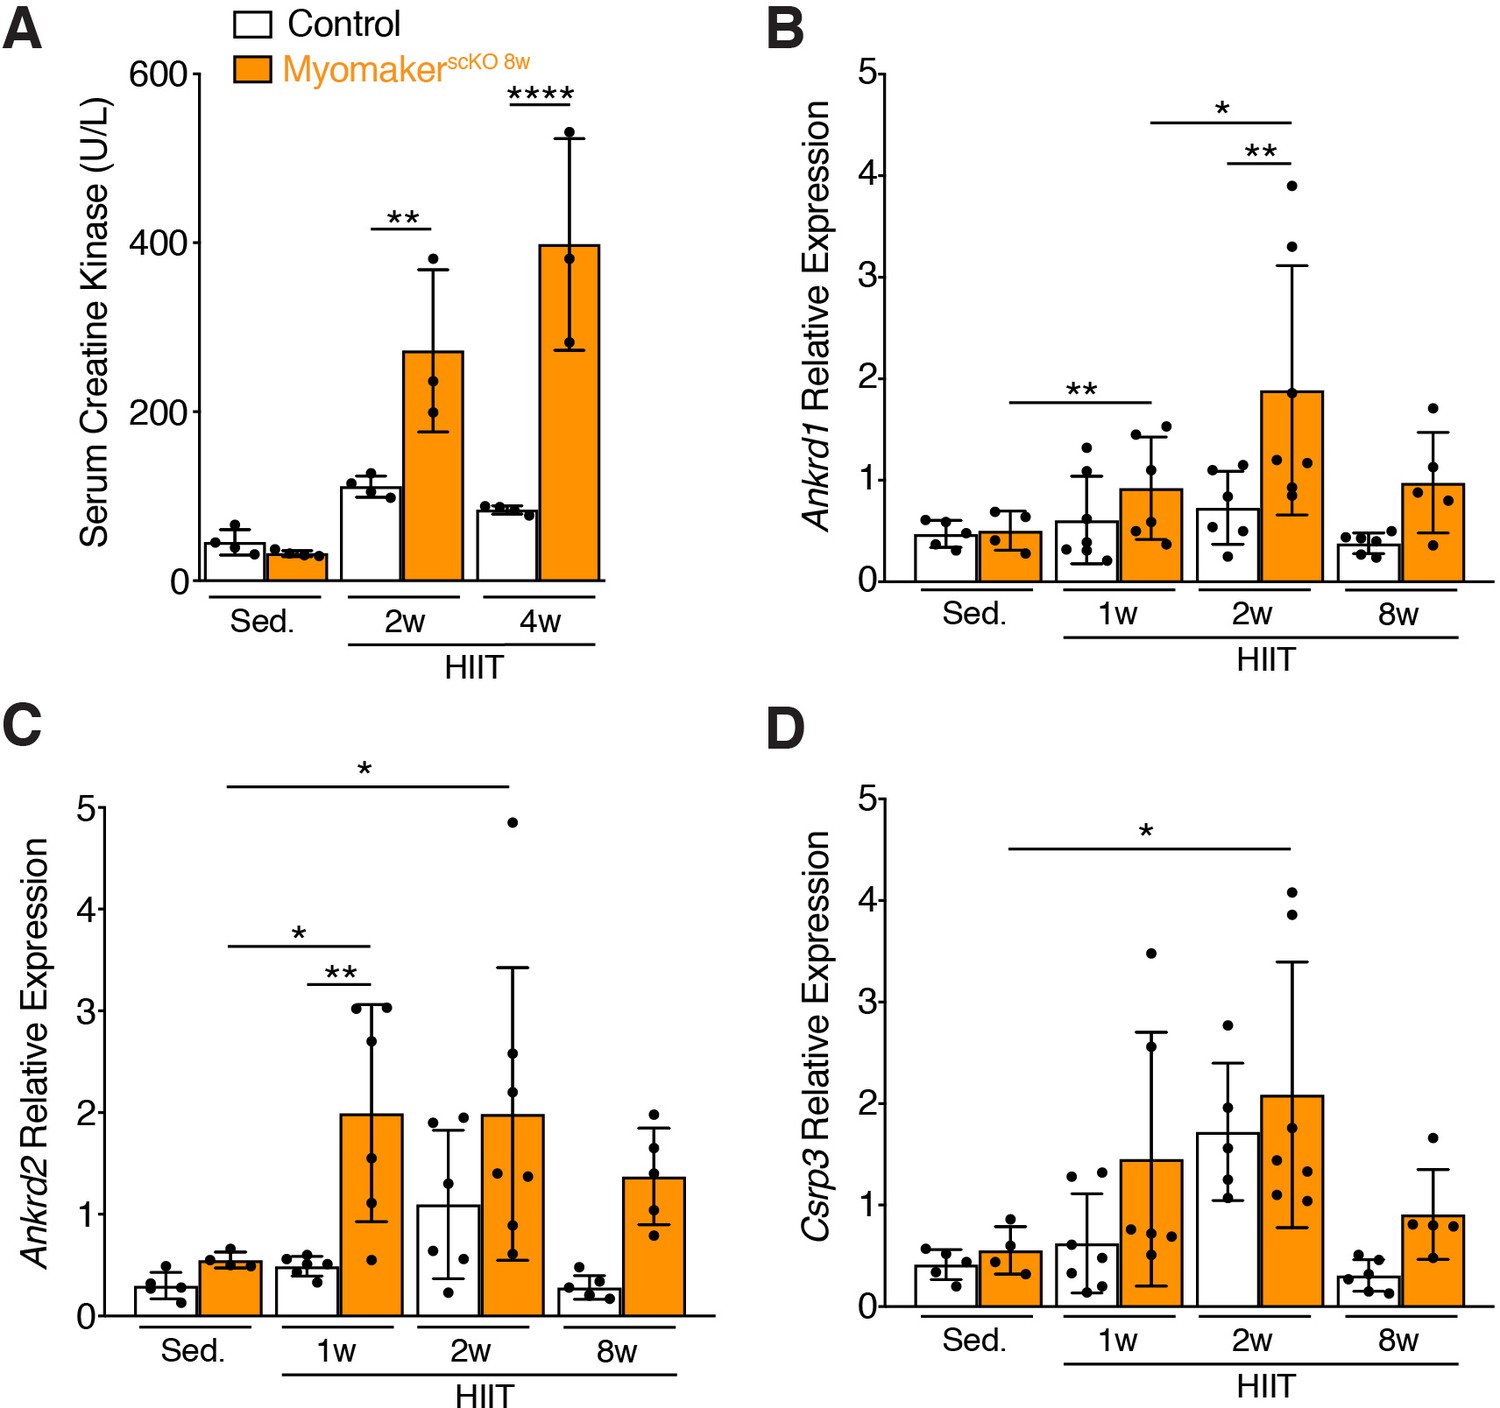
Muscle damage associated with HIIT fails to be resolved in MyomakerscKO 8w muscle.
(A) Levels of muscle creatine kinase in the serum from the indicated mice. Serum creatine kinase was assayed 1 day after the final day of exercise for the indicated week. (B) qPCR for Ankrd1, Ankrd2, and Csrp3 (genes associated with contractile stress) was performed on quadriceps of control and MyomakerscKO 8w mice after the indicated time points of HIIT. The qPCR analysis was performed on muscle harvested 3 days after the final day of exercise for the indicated week. Statistical analyses: (A), (B), (C), (D) 2-way ANOVA with a Bonferroni correction for multiple comparisons. Data are presented as mean ± SD. *p<0.05, **p<0.01,****p<0.0001.
Figure 4
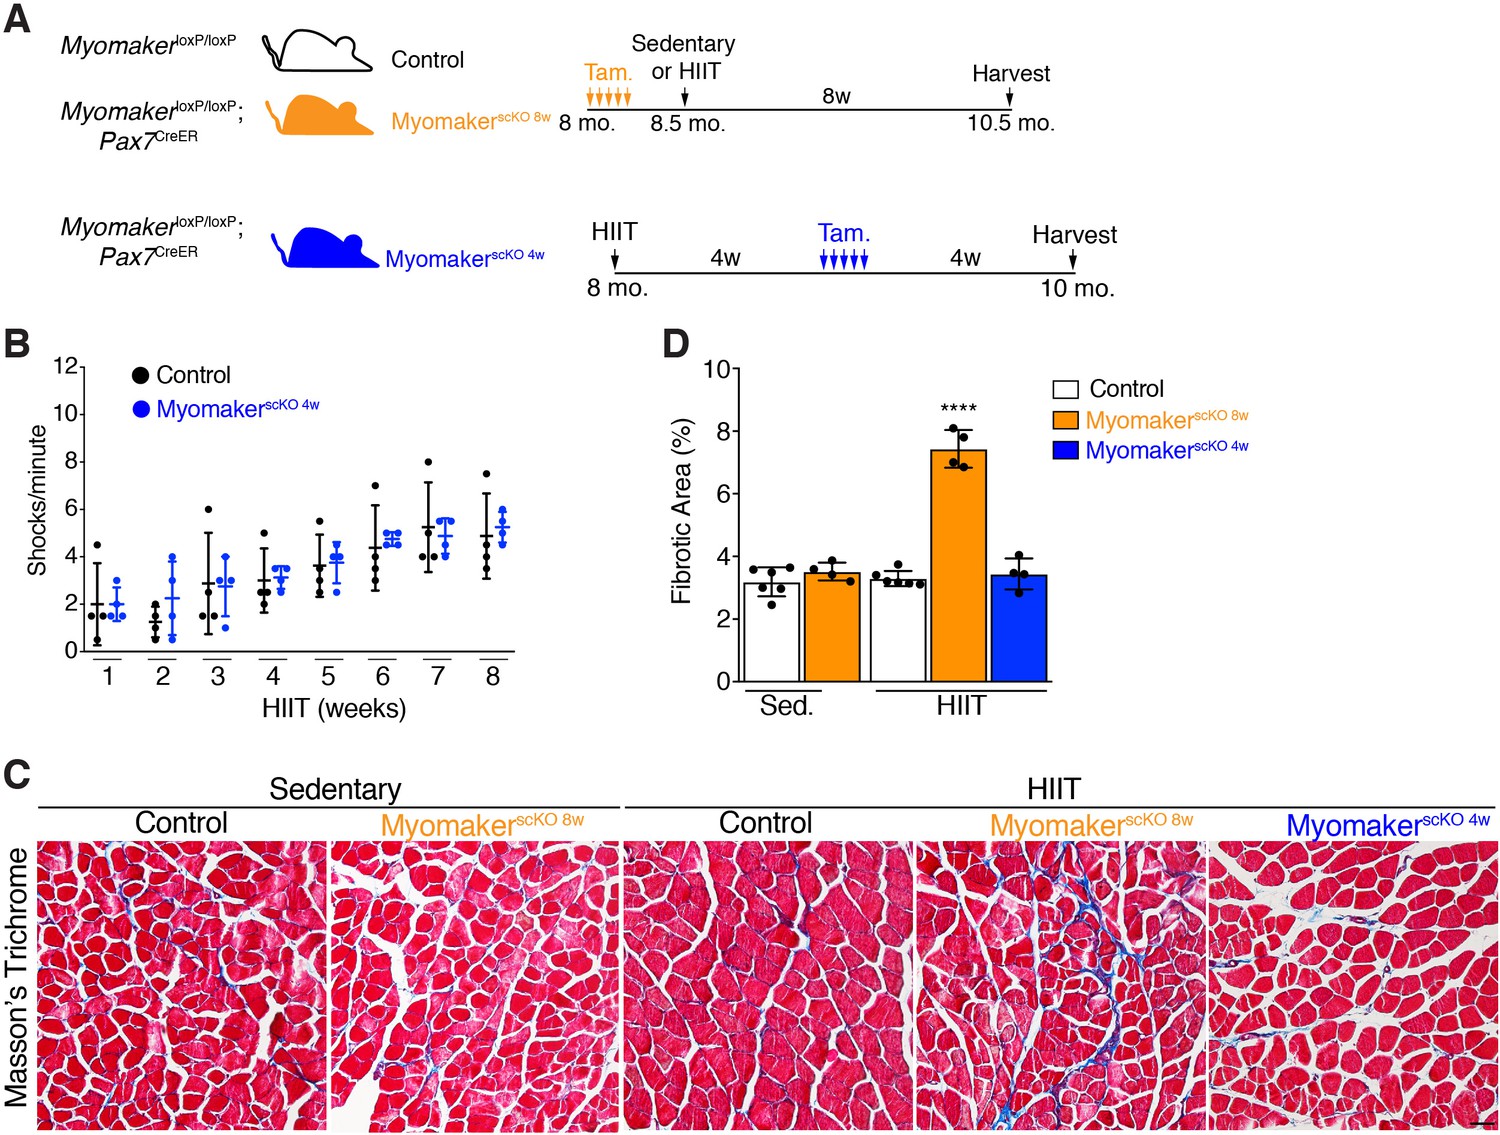
Loss of muscle progenitor fusogenic ability 4 weeks into HIIT does not affect exercise tolerance or result in maladaptive remodeling.
(A) Schematic showing two different timelines of Myomaker ablation during HIIT. (B) Assessment of number of shocks per minute in control and MyomakerscKO 4w mice, which reveals that loss of Myomaker 4 weeks into HIIT had no impact on exercise tolerance. (C) Masson’s trichrome staining shows that ablation of Myomaker at the beginning of HIIT (MyomakerscKO 8w) results in fibrosis indicating maladaptive remodeling. Evidence of fibrosis was not detected when Myomaker was deleted 4 weeks into HIIT (MyomakerscKO 4w). (D) Quantification of fibrotic area from the samples shown in (C). Data are presented as mean ± SD. Statistical analysis: (D) 1-way ANOVA with a Tukey correction for multiple comparisons. ****p<0.0001 compared to all other groups. Scale bar: 200 µm.
Figure 5 with 1 supplement

Myonuclei added over the final 4 weeks of HIIT are required for HIIT-induced hypertrophy.
(A) Schematic showing how MyomakerscKO 4w mice were generated. (B) Representative sections of gastrocnemius and quadriceps from control sedentary (Sed.), control HIIT, or MyomakerscKO 4w HIIT mice. Sections were immunostained with laminin antibodies and DAPI. (C) Quantification of myofiber CSA from the samples in (B) showing that MyomakerscKO 4w myofibers fail to hypertrophy. (D) Individual myofibers from EDL demonstrating that MyomakerscKO 4w HIIT mice do not recruit as many myonuclei as control HIIT mice. (E) Quantification of myonuclei per myofiber from the samples in (D). The dotted line indicates the average myonuclear number of nuclei in WT myofibers after 4 weeks of HIIT (from Figure 2A) demonstrating that MyomakerscKO 4w HIIT mice fail to add new myonuclei after this time. (F) Assessment of myofiber volume in isolated EDL myofibers confirms WT HIIT-trained muscle undergoes hypertrophy, but this does not occur in MyomakerscKO 4w mice. Data are presented as mean ± SD. Statistical analyses: (C), (F) 1-way ANOVA with a Tukey correction for multiple comparisons, (E) unpaired two-tailed Student’s t-test. *p<0.05, **p<0.01, ***p<0.001. Scale bars: 100 µm.
Figure 5—figure supplement 1
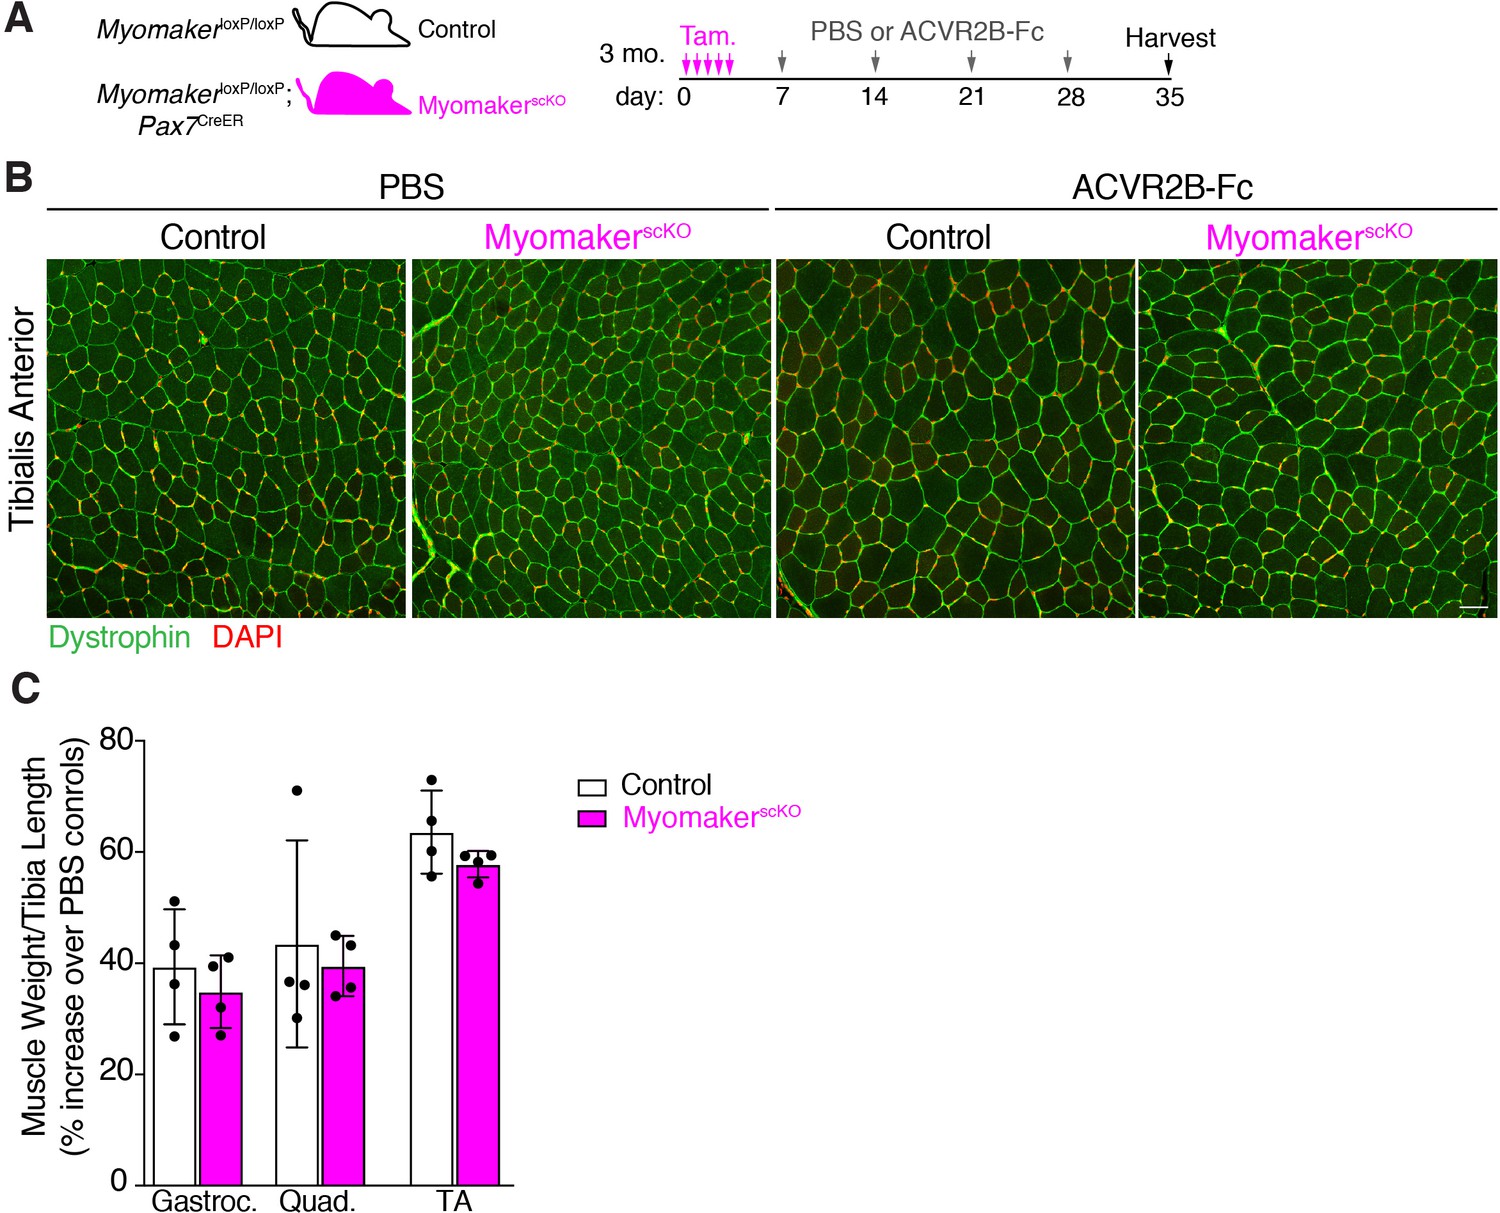
MyomakerscKO myofibers possess the ability to hypertrophy in response to a pharmacologic stimulus.
(A) Experimental protocol to delete Myomaker followed by weekly injections of ACVR2B-Fc or PBS as a control. (B) Representative histological sections of tibialis anterior from control and MyomakerscKO mice treated with either PBS or the hypertrophy-inducing ACVR2B-Fc. Both control and MyomakerscKO myofibers display an ability to hypertrophy. (C) Muscle weight to tibia length ratios from control and MyomakerscKO mice, shown as a percentage of their respective PBS controls, further indicated that MyomakerscKO muscle is not globally refractory to growth. Data are presented as mean ± SD. Scale bar: 50 µm.
Tables
Key resources table
| Reagent type (species) or resource | Designation | Source or reference | Identifiers | Additional information |
|---|---|---|---|---|
| Genetic reagent (M. musculus) | MymkloxP/loxP | Millay et al., 2014;Goh and Millay, 2017 | Dr. Douglas Millay (Cincinnati Children's Hospital Medical Center) | |
| Genetic reagent (M. musculus) | Pax7CreER | Lepper et al., 2009 | Dr. Chen-Ming Fan (Carnegie Science) | |
| Peptide, recombinant protein | ACVR2B-Fc | Lee et al., 2012 | Dr. Se-Jin Lee (The Jackson Laboratory) |
Additional files
-
Transparent reporting form
- https://doi.org/10.7554/eLife.44876.011
Download links
A two-part list of links to download the article, or parts of the article, in various formats.
Downloads (link to download the article as PDF)
Open citations (links to open the citations from this article in various online reference manager services)
Cite this article (links to download the citations from this article in formats compatible with various reference manager tools)
Myonuclear accretion is a determinant of exercise-induced remodeling in skeletal muscle
eLife 8:e44876.
https://doi.org/10.7554/eLife.44876


