Abstract

Allosteric interactions between the voltage-sensing domain (VSD), the Ca2+-binding sites, and the pore domain govern the mammalian Ca2+- and voltage-activated K+ (BK) channel opening. However, the functional relevance of the crosstalk between the Ca2+- and voltage-sensing mechanisms on BK channel gating is still debated. We examined the energetic interaction between Ca2+ binding and VSD activation by investigating the effects of internal Ca2+ on BK channel gating currents. Our results indicate that Ca2+ sensor occupancy has a strong impact on VSD activation through a coordinated interaction mechanism in which Ca2+ binding to a single α-subunit affects all VSDs equally. Moreover, the two distinct high-affinity Ca2+-binding sites contained in the C-terminus domains, RCK1 and RCK2, contribute equally to decrease the free energy necessary to activate the VSD. We conclude that voltage-dependent gating and pore opening in BK channels is modulated to a great extent by the interaction between Ca2+ sensors and VSDs.

https://doi.org/10.7554/eLife.44934.001

Introduction

Diverse cellular events involve calcium ions as a primary mediator in the signal transduction pathways triggering, among other signaling processes, Ca2+-activated conductances. Since the BK channels are regulated by cytosolic Ca2+ and depolarizing voltages (Marty, 1981; Pallotta et al., 1981; Latorre et al., 1982), they are integrators of physiological stimuli involving intracellular Ca2+ elevation and membrane excitability. BK channels are modular proteins in which each module accomplishes a specific function. Thus, different modules harbor voltage and Ca2+ sensors that communicate allosterically with the channel gate (Cox et al., 1997; Horrigan and Aldrich, 1999; Horrigan and Aldrich, 2002; Horrigan et al., 1999; Rothberg and Magleby, 1999; Rothberg and Magleby, 2000; Cui and Aldrich, 2000). Functional BK channels are formed by homotetramers of α-subunits (Shen et al., 1994), each comprising a transmembrane voltage-sensing domain (VSD) and an intracellular Ca2+-sensing C-terminal domain (CTD) that can independently modulate the ion conduction gate in the pore domain (PD) (Latorre et al., 2017). The CTDs consist of two non-identical regulators of the conductance of K+ domains (RCK1 and RCK2) arranged in a ring-like tetrameric structure dubbed the gating ring (Wu et al., 2010; Yuan et al., 2010; Yuan et al., 2012; Hite et al., 2017; Tao et al., 2017). Each RCK domain contains distinct ligand-binding sites capable of detecting Ca2+ in the micromolar range (Schreiber and Salkoff, 1997; Bao et al., 2002; Xia et al., 2002).

In the absence of Ca2+, the activation of the VSD decreases the free energy necessary to fully open the BK channels in an allosteric fashion (Horrigan and Aldrich, 1999; Horrigan et al., 1999). With 0 Ca2+, very positive membrane potentials are required to drive all voltage sensors to their active conformations (Cui et al., 1997; Stefani et al., 1997; Horrigan et al., 1999; Contreras et al., 2012), ultimately leading to near-maximal BK activation. Thus, in cells such as neurons, an appreciable open probability of BK channels at physiologically relevant voltages necessarily requires the activation of the Ca2+ sensors on the gating ring. The allosteric interplays established between the functional and structural modules (VSD-PD, CTD-PD, and CTD-VSD) are key for enabling BK channels to operate over a wide dynamic range of internal Ca2+ and voltage, thereby fine-tuning the channel’s gating machinery. Therefore, understanding the structure-functional bases that underlie the Ca2+ and voltage activation mechanisms interrelationship becomes essential to unveil how the channel behaves under different physiological conditions.

The voltage dependence of Ca2+-dependent gating ring rearrangements (Miranda et al., 2013; Miranda et al., 2018) and RCK1 site occupancy (Sweet and Cox, 2008; Savalli et al., 2012; Miranda et al., 2018) as well as the perturbation of VSD movements by Ca2+ binding (Savalli et al., 2012) support the idea that the energetic interaction between both specialized sensors may be crucial for BK channel activation. The physical CTD-VSD interface has been suggested to provide the structure capable of mediating the crosstalk between these sensory modules and their synergy in activating the pore domain (Yang et al., 2007; Sun et al., 2013; Tao et al., 2017; Zhang et al., 2017). However, the strength of the interaction between voltage and Ca2+ sensors and their relevance to BK channel activation is still debated (cf. Horrigan and Aldrich, 2002; Carrasquel-Ursulaez et al., 2015). Also, the functional role that each of the high-affinity Ca2+-binding sites plays in the CTD-VSD allosteric interaction is an open question. The RCK1 and RCK2 Ca2+-binding sites have distinct functional properties conferred by their different molecular structures and relative positions within the gating ring (Wu et al., 2010; Yuan et al., 2010; Yuan et al., 2012; Hite et al., 2017; Tao et al., 2017). Thus, the RCK sites differ in their Ca2+ binding affinities (Bao et al., 2002; Xia et al., 2002; Sweet and Cox, 2008), divalent cations selectivity (Oberhauser et al., 1988; Schreiber and Salkoff, 1997; Zeng et al., 2005; Zhou et al., 2012), voltage dependence (Sweet and Cox, 2008; Savalli et al., 2012; Miranda et al., 2018) and in their contribution to allosteric gating mechanisms (Yang et al., 2010; Yang et al., 2015). In particular, only the RCK1 site appears to be involved in communicating the Ca2+-dependent conformational changes towards the membrane-spanning VSD (Savalli et al., 2012; Miranda et al., 2018). Recently, the Aplysia BK structure has revealed that the N-lobe of the RCK1 domain is in a non-covalent contact with the VSD and the S4-S5 linker that connects the voltage sensor to the pore domain. This RCK1-VSD interaction surface is rearranged when comparing the liganded and Ca2+-free structures (Hite et al., 2017; Tao et al., 2017). In fact, it has been hypothesized that any Ca2+-induced rearrangements of the gating ring should ultimately be transmitted to the pore domain via the VSD (Hite et al., 2017; Zhou et al., 2017). Thereby, defining the extent to which Ca2+ binding influences to VSD is central for determining the importance of the crosstalk between sensors in decreasing the free energy necessary to open the BK channel.

Here, we examined the Ca2+-dependence of the VSD activation by estimating the allosteric coupling between the Ca2+ and voltage sensors. By analyzing gating currents under unliganded and Ca2+-saturated conditions, we found a strong energetic influence of Ca2+-binding on voltage sensor equilibrium in a manner that is independent of channel opening. These findings show that a major component in the synergistic Ca2+ and voltage activation of BK channels resides in the strong coupling between Ca2+ binding and the voltage sensor activation. We also found that the Ca2+-dependence of voltage sensor activation is consistent with a CTD-VSD allosteric coupling that occurs through a concerted interaction scheme in which each Ca2+ bound to one subunit affects all voltage sensors in the BK tetramer equally. Notably, we found that the two distinct RCK1 and RCK2 Ca2+ sensors contribute equally to the VSD activation via independent allosteric pathways.

Results

Allosteric coupling between Ca2+-binding and voltage sensor activation is strong

We characterized the effects of Ca2+-binding on voltage sensor activation in BK channels by analyzing the gating currents measured in inside-out patches of Xenopus laevis oocyte membrane. The amount of gating charge displaced (QC) at each Ca2+ concentration was obtained by integrating the initial part of the decay of the ON-gating current (IG-ON), which was fitted to a single exponential (fast ON-gating; see MaterialsĀ andĀ methods). As we show below, we determined only the gating charge displaced before the opening of the BK channel. Figure 1A–B show representative IG-ON records in response to 160 mV voltage step in the nominal absence of Ca2+ (ā€˜zero’ Ca2+) and in saturating Ca2+ concentration (100 µM Ca2+). In Figure 1A–B, we also show the initial time courses of the corresponding macroscopic K+ current (IK) activation at the same voltage and internal Ca2+ conditions. The IG-ON relaxation exhibits an almost complete decay before the IK achieves an exponential time course in 0 Ca2+ conditions (Figure 1A). Thus, the time constant of the IK activation (~3.4 ms at 160 mV) following a delay ofĀ ~160 µs is consistent with the movement of the voltage sensors preceding channel opening. Under saturating internal Ca2+ conditions, the IG-ON time course develops 20 times faster than the exponential kinetic of the IK activation (Ļ„IGāˆ’ONĀ Ā =Ā 30 µs and Ī”tIK = 660 µs at 160 mV) and is also almost complete within the time interval comprised by the IK delay (Ī”tIKĀ (100 μMĀ )Ā =Ā 84 µs) (Figure 1B). Thus, the fast IG-ON relaxation reflects the movement of the gating charge in the channel’s closed conformation, regardless of internal Ca2+ concentration.

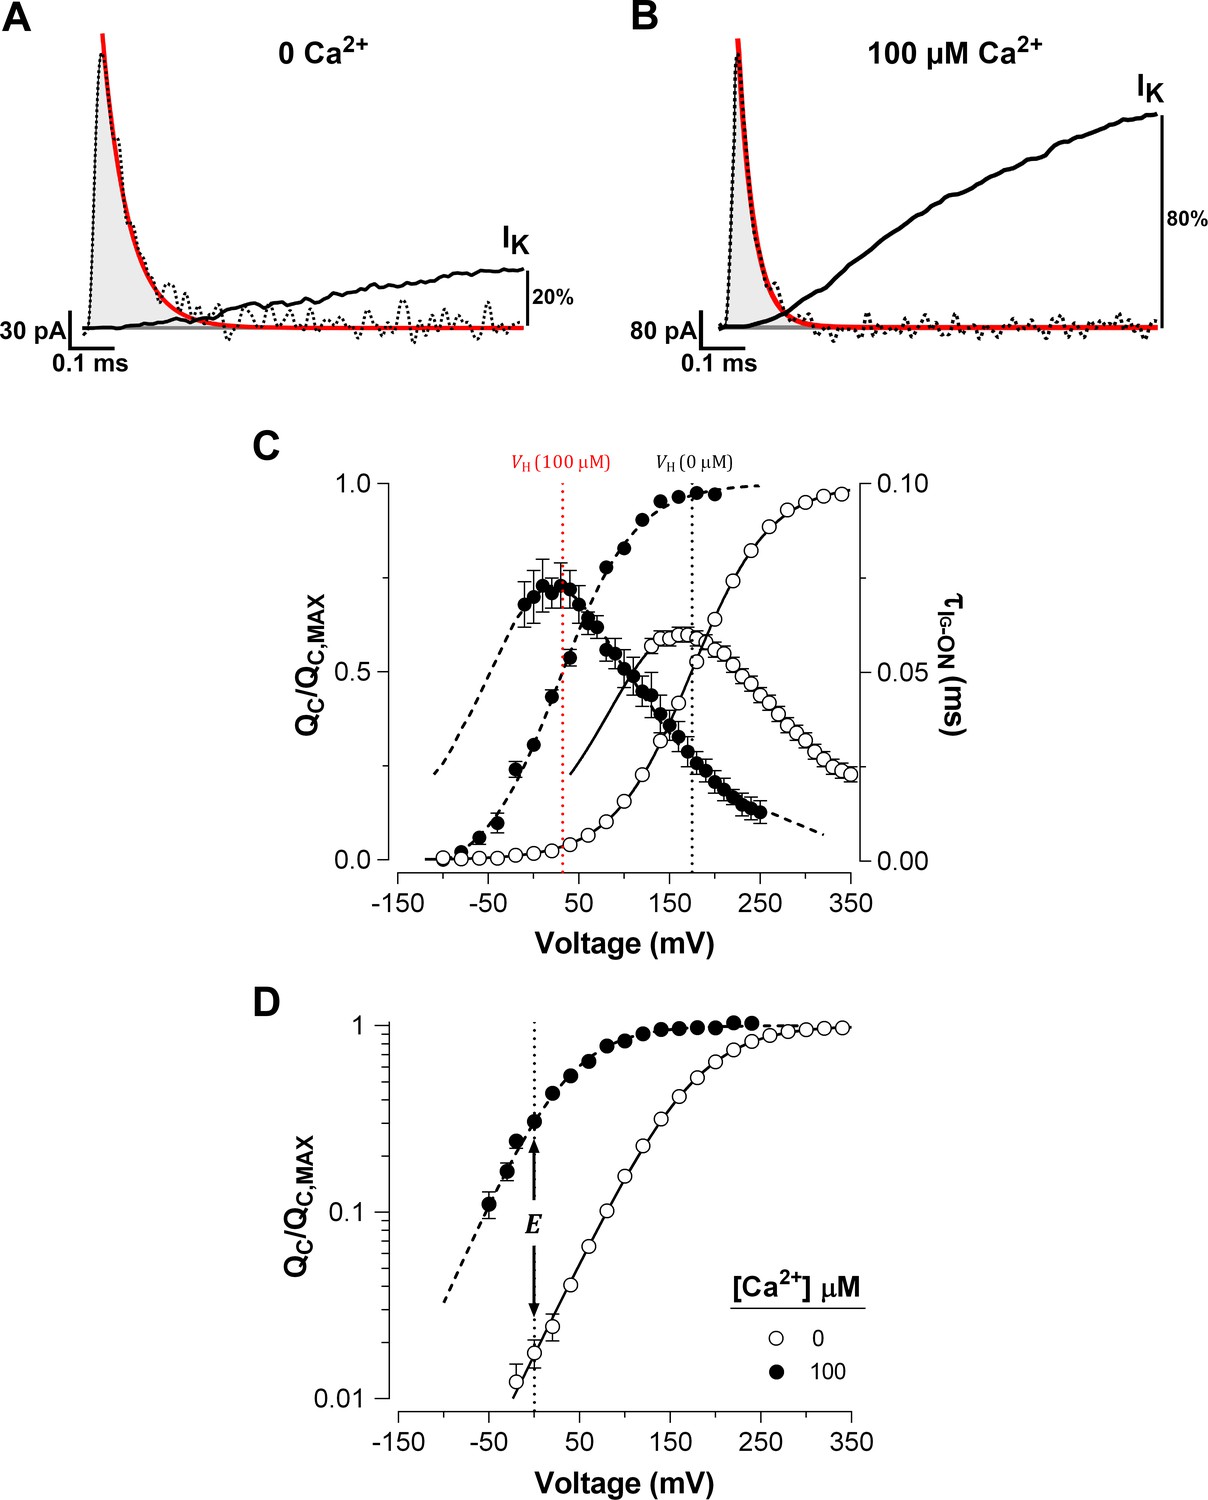
Ca2+ binding strongly affects the activation of VSD in BK channels.

(A–B) Fast component of the ON-gating current (IG-ON) at 0 and 100 μM internal Ca2+ concentration, respectively. The representative IG-ON records were evoked by applying a 160 mV voltage step of 1 ms duration. The first 100 µs of the IG-ON were fitted to a single exponential function (red line; Ļ„IGāˆ’ONĀ (0Ā Ca2+)Ā = 58 µs and Ļ„IG-ON 100 μM = 30 µs). The area under the curve described by the monoexponential fit (gray areas) was integrated to obtain the charge displaced between closed states (QC). For comparison, the initial time course of the macroscopic K+ current (IK) activation (solid black line) obtained at 0 and 100 μM Ca2+ were superimposed on the IG-ON under the same internal Ca2+ conditions. The IK were evoked by a 15 ms pulse to 160 mV. The IK is described by an exponential function with initial delay: Ī”tIKĀ (0Ā Ca2+)Ā = 0.16 ms and Ļ„IK 0 Ca2+ = 3.37 ms at 0 Ca2+; and Ī”tIKĀ (100 μMĀ ) = 0.08 ms and Ļ„IK 100 μM = 0.66 ms at 100 μM Ca2+. After 1 ms, the IK increased to about 20% and 80% of its steady-state amplitude in 0 Ca2+ and 100 μM Ca2+, respectively. (C) Voltage-dependence of the QC and of the gating current time constants (Ļ„IG-ON) at 0 Ca2+ (open circles) and 100 μM Ca2+ (filled circles). Gating charge-voltage relationships (QC(V)/QC,Ā MAX) were obtained by integrating the fast component for each ON IG trace (from āˆ’90 mV to 350 mV). Boltzmann fitting to the experimental data (mean ± SEM) is indicated by solid line at ā€˜zero’ Ca2+ (VH Ā =Ā 174.5 ± 2.4 mV, zQĀ = 0.60 ± 0.01, nĀ = 25) and by a dashed line at 100 µM Ca2+ (VHĀ =Ā 31.9 ± 4.5 mV, zQĀ = 0.66 ± 0.01, nĀ = 7). Right ordinate shows the time constants data (mean ± SEM) of the exponential decays of IG-ON (Ļ„IG-ON) plotted against the voltage. The best fit to a two-state model of the VSD activation where the zJ was constrained to the values found for the QCV relation (zQ) is indicated by solid lines at ā€˜zero’ Ca2+ (α0Ā =Ā 3.73 msāˆ’1, β0Ā = 76.10 msāˆ’1 and Γ = 0.29) and dashed line at 100 µM Ca2+ (α0Ā =Ā 7.28 msāˆ’1, β0Ā = 6.98 msāˆ’1 and Γ = 0.36). The corresponding VH at each internal Ca2+ concentration is indicated by a vertical line. (D) Semi-logarithmic plot of the QC(V)/QC,Ā MAX curves at 0 Ca2+ and saturating Ca2+ concentration (100 µM). The allosteric parameter EĀ determines the vertical displacement of the 0 mV intercept (dashed vertical line) of the QC(V)/QC,Ā MAX curve at 100 µM Ca2+ relative to the 0 Ca2+ condition.

https://doi.org/10.7554/eLife.44934.002

The QC was determined over a wide range of membrane potentials at low and high internal (100 μM) Ca2+ concentration. Increasing the Ca2+ concentration promoted a large leftward shift (āˆ†VHĀ = -142.6 ± 4.5 mV) of the normalized QC (QC(V)/QC,Ā MAXĀ curves) (Figure 1C). In spite of with the large leftward shift of the QC at high Ca2+ concentrations, we found no appreciable slow component in IG-ON (cf. Horrigan and Aldrich, 2002; see also Figure 2—figure supplement 1A). As expected, a large Ca2+-dependent leftward shift was also observed in the time constants of the exponential decays of IG-ON (Ļ„IG-ON). The Ļ„IG-ON(V) curves were fitted to a two state model (Ļ„(V)=1/(α(V)+β(V)) where the forward (α) and backward (β) rate constants represent the resting-active (R-A) transitions of the voltage sensors, that determine the equilibrium constant of the VSD activation (J(V)=α(V)/β(V)). The predominant effect of Ca2+-binding on VSD activation appears to cause a decrease in the backward rate constant at zero voltage (β0; see MaterialsĀ andĀ methods). β0Ā decreases from 76 msāˆ’1 at 0 Ca2+ to 7 msāˆ’1 at 100 μM Ca2+, which results in a shift in the equilibrium of the voltage sensors towards their active conformation. Such a large shift (Ī”VHĀ = -142.6 ± 4.5 mV) implies that Ca2+ binding to the RCK Ca2+-binding sites alters the VSD equilibrium, which in consequence causes a decrease in the free energy (ΔΔGVCa) that defines the voltage sensor R-A equilibrium (J) by ~8 kJ/mol (ΔΔGVCa= -7.98 ± 0.27 kJ/mol). In terms of the allosteric gating scheme (Horrigan and Aldrich, 2002), this result means that the JĀ equilibrium constant of VSD becomes amplified by an allosteric factor EĀ equal to 26.4 at Ca2+-saturated conditions (Figure 1D), revealing a strong allosteric coupling between Ca2+-binding sites and voltage sensors.

Families of gating currents (IG) were evoked at different intracellular Ca2+ concentrations ([Ca2+]i) ranging from 0.1 to 100 µM in K+-free solution (Figure 2A). For all experiments, we first measured IG in 'zero' Ca2+ condition and then perfused the internal side with solutions containing different concentrations of Ca2+. The increase in internal Ca2+ promoted a leftward shift of the QC versus voltage (QC(V)) curves (Figure 2B-C), which indicates that Ca2+-binding facilitates the activation of the voltage sensor, being more prominent as Ca2+-binding site occupancy increases.

Figure 2 with 2 supplements see all
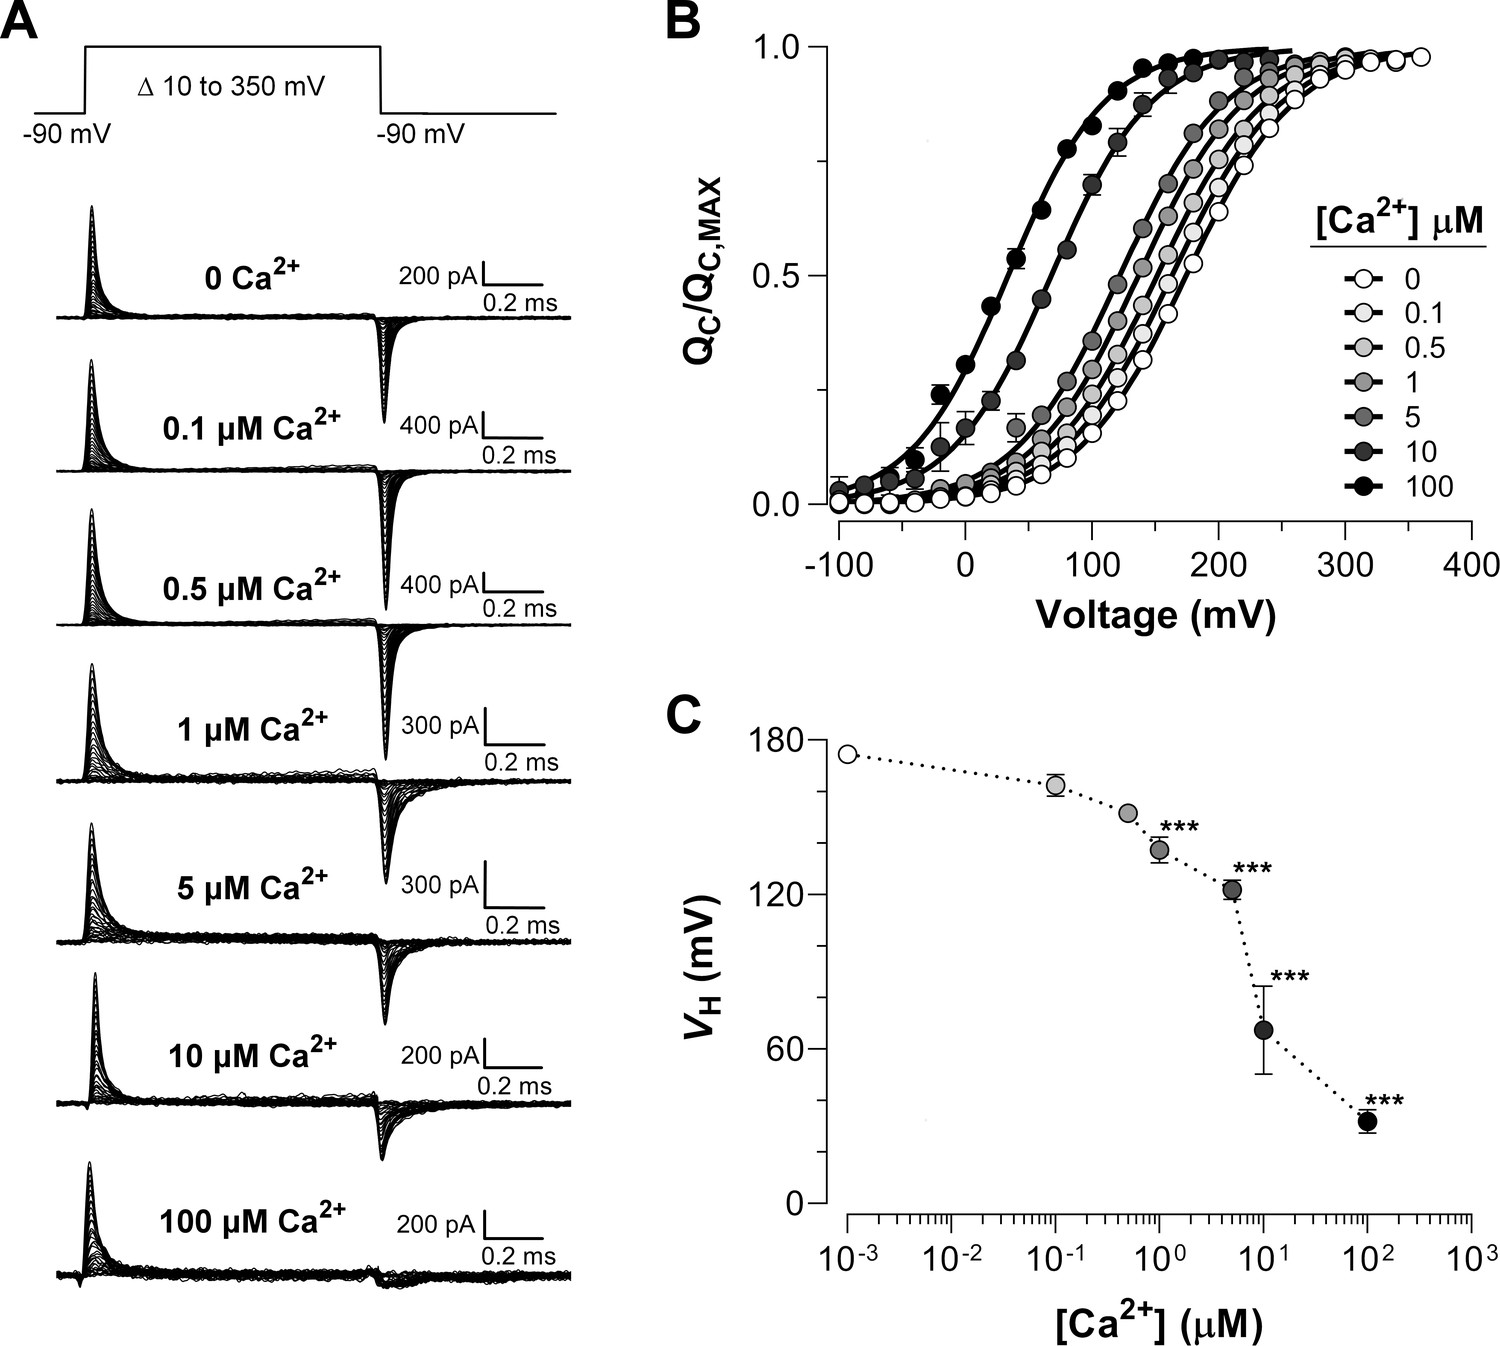
Ca2+-dependent effects on VSD activation in BK channels.

(A) Representative gating current (IG) recordings at different internal Ca2+ concentrations (from 0 to 100 μM). IG was evoked by the indicated voltage protocol of 1 ms duration. Representative gating current records are from different patches with the exception of 0 and 100 μM Ca2+. (B) Gating charge-voltage relationships (QC(V)) were obtained by integrating the fast component for each ON IG trace. Normalized gating charge data (QC(V)/QC,Ā MAX) (mean ± SEM) were fitted using a single Boltzmann function (solid lines). The fit parameters are as follows: ā€˜zero’ Ca2+ (VH Ā =Ā 174.5 ± 2.4 mV, zQĀ = 0.60 ± 0.01, nĀ = 25); 0.1 µM Ca2+ (VHĀ =Ā 162.4 ± 4.2 mV, zQĀ = 0.59 ± 0.01, nĀ = 5); 0.5 µM Ca2+ (VHĀ =Ā 151.6 ± 1.3 mV, zQĀ = 0.60 ± 0.01, nĀ = 5); 1 µM Ca2+ (VHĀ =Ā 137.1 ± 5.1 mV, zQĀ = 0.61 ± 0.01, nĀ = 5); 5 µM Ca2+ (VHĀ =Ā 121.9 ± 3.8 mV,Ā zQĀ =Ā 0.63 ± 0.01, nĀ = 5); 10 µM Ca2+ (VHĀ =Ā 67.3 ± 17.1 mV,Ā zQĀ =Ā 0.64 ± 0.08, nĀ = 4); 100 µM Ca2+ (VHĀ =Ā 31.9 ± 4.5 mV, zQĀ = 0.66 ± 0.01, nĀ = 7). (C) VHĀ obtained from the QC(V) curves as a function of Ca2+ concentration (mean ± SEM). Ca2+ binding produces a leftward shift inĀ Ā VH(Ī”VH): 0.1 µM Ca2+ (Ī”VHĀ =Ā āˆ’12.1 ± 3.5 mV); 0.5 µM Ca2+ (Ī”VHĀ =Ā āˆ’22.9 ± 1.8 mV); 1 µM Ca2+ (Ī”VHĀ =Ā āˆ’37.1 ± 3.5 mV); 5 µM Ca2+ (Ī”VHĀ =Ā āˆ’50.3 ± 4.7 mV); 10 µM Ca2+ (Ī”VHĀ =Ā āˆ’107.1 ± 17.1 mV); 100 µM Ca2+ (Ī”VHĀ =Ā āˆ’142.6 ± 4.5 mV). One-way ANOVA followed by Dunnett’s post-hoc test analysis was used to assess statistical significance of the Ca2+-induced shifts in VH (***p<0.001).

https://doi.org/10.7554/eLife.44934.003

Figure 2A shows that the OFF-gating current was dramatically modified becoming smaller in amplitude and with slower kinetics as the internal Ca2+ concentration was increased (see also Figure 2—figure supplement 1A and Figure 2—figure supplement 2A). At least two components (fast and slow components) could be resolved in the OFF gating current decay in 'zero' and 10 µM internal Ca2+ conditions (Figure 2—figure supplement 1B-C). In Figure 2—figure supplement 1D, we fitted Ļ„IG-ON(V) data for 0 and 10 µM internal Ca2+ to a two-state R-A model. Figure 2—figure supplement 1D shows that the time constants of the fast relaxation of the IG-OFF evoked at -90 mV (open and closed orange circles) are in reasonable agreement with the time constants values extrapolated to the same voltage from the two-state model of the IG-ON kinetic. The change in the time constant of the fast component of OFF-gating current detected at 10 µM Ca2+ relative to 'zero' Ca2+ condition agrees with a Ca2+-induced effect primarily on the backward rate of the R-A transition (β0Ā decreases from 76 msāˆ’1 at 0 Ca2+ to 10.6 msāˆ’1 at 10 μM Ca2+, seeĀ Figure 2—figure supplement 1D), which is consistent with the large QC(V) shift observed (Ī”VHĀ (10 μM)Ā Ā = -107.1 ± 17.1 mV). On the other hand, the relative contribution of the slower component increasing as internal Ca2+ is increased, reflecting an increase in the open probability of the channel (Figure 2—figure supplement 1E-F). This kinetic behavior recapitulates the effect described on gating charge displacement as a function of the depolarizing pulse duration (Horrigan and Aldrich, 2002; Carrasquel-Ursulaez et al., 2015; Contreras et al., 2012), and confirms that this phenomenon is associated with the time course of channel opening revealing the allosteric interaction between voltage sensors and the pore gate (Horrigan and Aldrich, 2002).

Since the OFF gating charge cannot be accurately estimated from the OFF gating current recorded at -90 mV, we performed two experiments using 100 µM internal Ca2+ concentration and recorded the OFF gating currents at -150 mV and -200 mV (Figure 2—figure supplement 2A). At these applied voltages, the charge displaced in the ON is recovered in the OFF (Figure 2—figure supplement 2B). As expected from the large shift to the left along the voltage axis of QC at saturating internal Ca2+ concentrations, there was no difference between the QC curve and the gating charge-voltage curves obtained from the OFF gating currents 2 ms after the onset of the voltage pulse, for applied voltages of -150 or -200 mV (Figure 2—figure supplement 2C).

Ca2+ binding to a single α-subunit affects the R-A voltage sensor equilibrium of all four subunits equally

Taking advantage of the dose-dependent effect of Ca2+ on voltage sensor activation we investigated the underlying mechanism of the communication between the Ca2+ binding and voltage sensors in the context of the well-established Horrigan-Aldrich (HA) allosteric gating model (Horrigan and Aldrich, 2002). Two different mechanisms were proposed by Horrigan and Aldrich for the interaction between the Ca2+-binding sites and voltage sensors. The first mechanism proposes that Ca2+ binding to one α-subunit only affects the VSD in the same subunit (Scheme I) (Figure 3A), whereas the second mechanism proposes that the Ca2+ binding affects all four VSD equally (Scheme II) (Figure 3B). It should be noted that the standard HA model makes two simplifying assumptions. First, the model considers that there is a single Ca2+-binding site per α-subunit. Second, the model assumes the Scheme I as the Ca2+ binding-VSD interaction scheme underlying the general gating mechanism of BK channel (Horrigan and Aldrich, 2002).

Figure 3 with 2 supplements see all
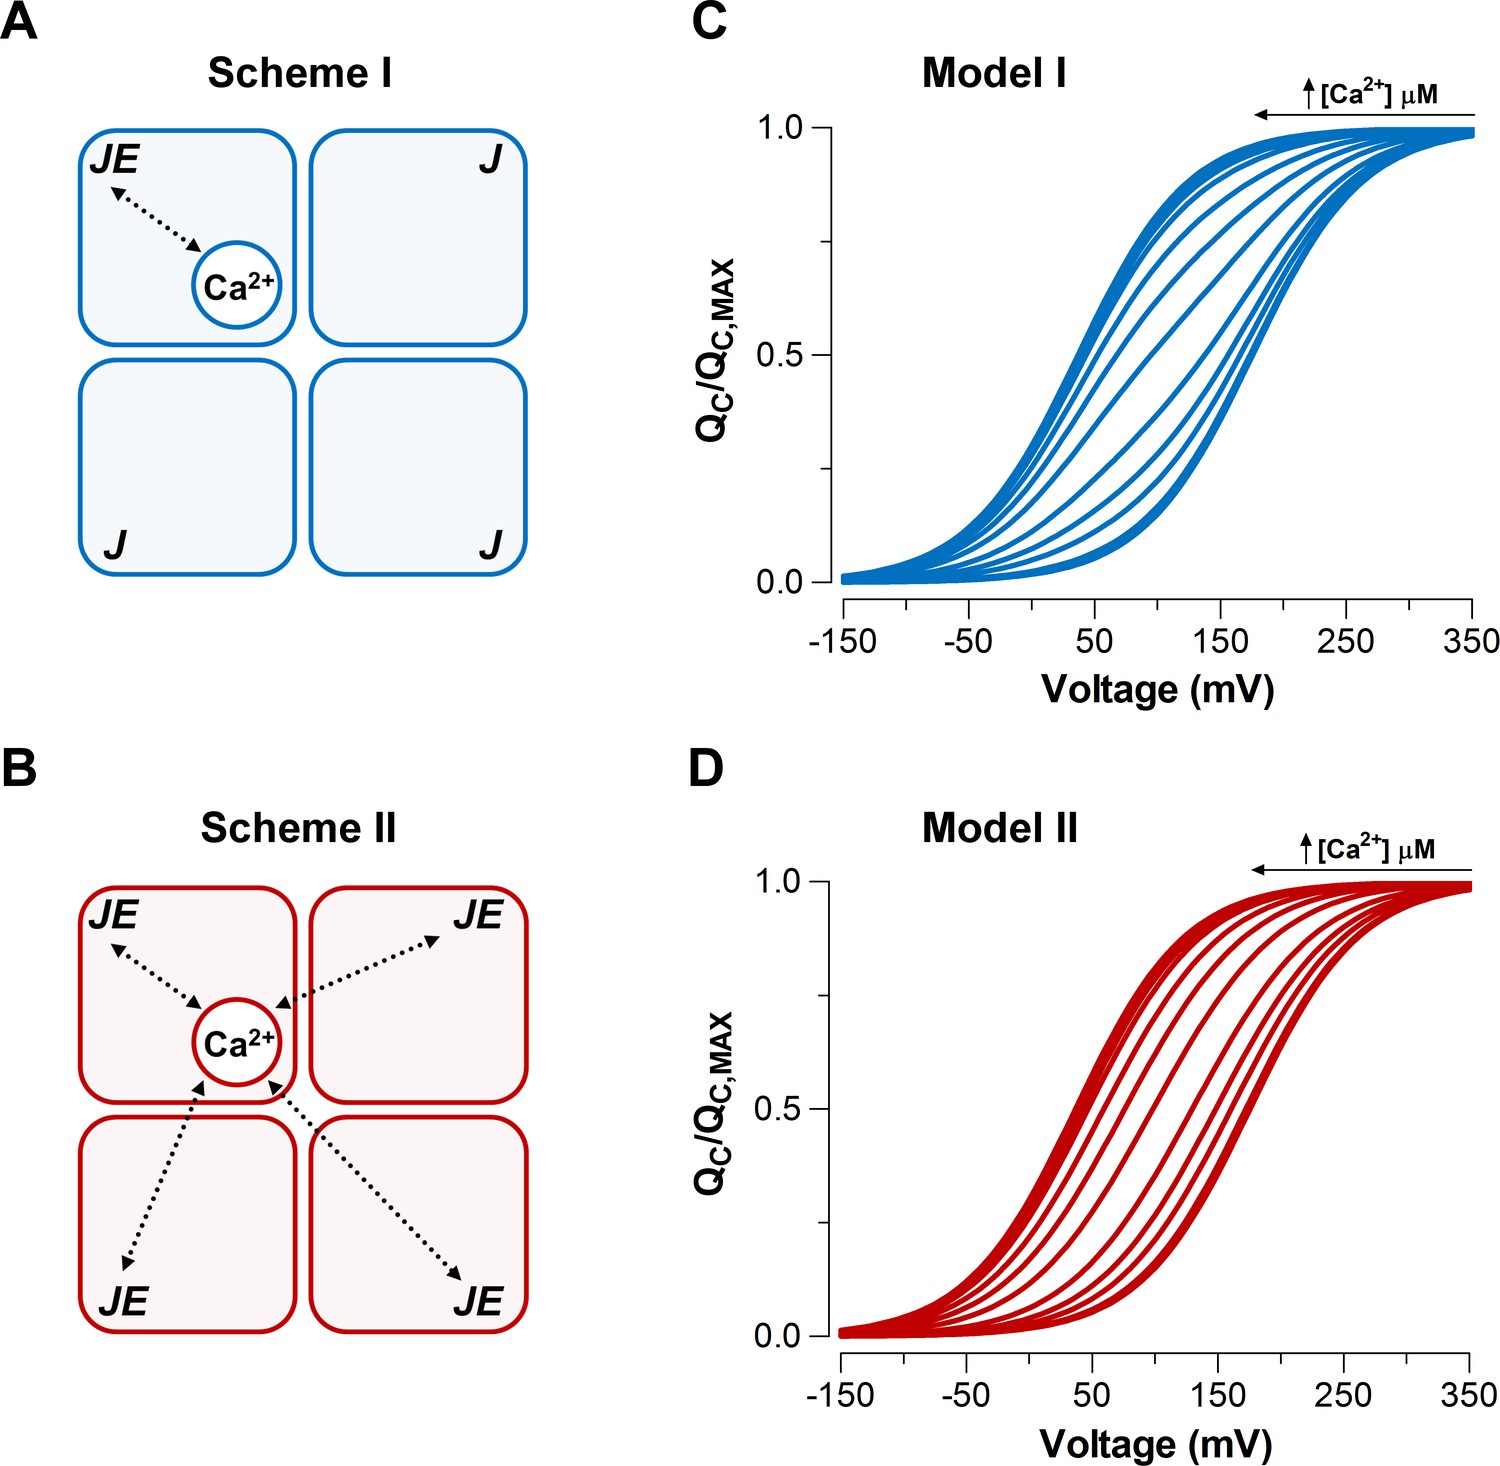
Model-dependent behavior of the QC(V) curves based on the CTD-VSD interaction mechanisms according to the fractional occupancy of Ca2+-binding sites.

(A–B) Cartoons representing two interaction schemes between voltage sensors and Ca2+-binding sites (modified from Horrigan and Aldrich, 2002). Scheme I (A) assumes that Ca2+-binding only affects the voltage sensor of one α-subunit (EM1), whereas Scheme II (B) predicts that binding of Ca2+ to one α-subunit will affect VSD in all subunits equally, increasing the voltage sensor equilibrium constants (J) EM2-fold in all four subunits (EM24, when the four Ca2+ sites are occupied). In both schemes, a single Ca2+-binding site is considered in each α-subunit. (C–D) Predictions of QC(V) relationships at different internal calcium concentration (from 0 to 10 mM) by two distinctive interaction mechanisms between Ca2+-binding sites and voltage sensors (Scheme I and Scheme II), respectively. QC(V)Ā curves were generated using Equation 4 (blue: Model I) or Equation 6 (red: Model II), and the following set of parameters: zJĀ = 0.58, J0Ā = 0.018, KDĀ = 11 µM and EM1 = EM24 = 25.

https://doi.org/10.7554/eLife.44934.006

We simulated the normalized QC(V) curves over a wide range of Ca2+ concentrations (from 0 to 10 mM) for each Ca2+-VSD interaction scheme (Figure 3C-D). We assumed that the fast gating currents measured correspond to the charge displaced by the R-A transitions and does not include the charge associated with the transition between the activated states (see Figure 3—figure supplement 1B-C). In other words, Equations 4 and 6 given in the Appendix describing the QC(V) relationships for Schemes I and II are based on the assumption that channels equilibrate between Ca2+-bound states while the channel is closed and voltage sensors are not activated. We further assume that this distribution is not altered when gating current is measured because Ca2+ binding is slower than voltage-sensor activation. These assumptions are reasonable since the Ca2+-binding rate constant estimated for BK is 1.8 x 10⁸ Māˆ’1sāˆ’1 (Hou et al., 2016) implying that at 10 µM internal Ca2+ (the highest non-saturating Ca2+ concentration tested) the time constant of the Ca2+ binding is ~300 µs, while the VSD activates with a time constant of ~60 μs at VĀ = VH (see the Appendix for details of the simulations).

At extreme conditions of low (0.03 to 0.1 µM) and high (≄100 µM) internal Ca2+, VSD activation behaves in a mechanism-independent manner since all voltage sensors are in the same functional state (unliganded or saturated). However, the distinctive effects on QC(V) curves at intermediate Ca2+ concentrations (1-10 µM) provide useful signatures to distinguish between the two mechanisms. Indeed, Scheme I predicts two functional states of the VSD depending on the occupancy status of the Ca2+ site (Ca2+ bound and unbound) such that the QC(V) curve is described by the fractional distribution of the unliganded and Ca2+-saturated functional states like an all-or-none allosteric effect (Figure 3C; Figure 3—figure supplement 1B and Equation 4 in Appendix). By contrast, the Ca2+-binding effect on the VSD activation according to Scheme II is characterized by a five-component Boltzmann function (Figure 3—figure supplement 1C and Equation 6 in Appendix). Each component represents a single functional state determined by the number of Ca2+ bound to the channel (from 0 to 4). In such a case, the QC(V) curves resulting from a distribution of functional states are equivalent to a single Boltzmann function, leftward shifted by an incremental allosteric effect (from EĀ toĀ E4) as the number of Ca2+ bound to the channel increases (Figure 3D). The experimental leftward shift of the QC(V) curves occur with constant slope (zQ) (Figure 2B), which is consistent with Model II. It can be argued that Scheme I can produce single Boltzmann curves without a change in zQ if Ca2+ re-equilibration is fast enough. However, Figure 3—figure supplement 2 demonstrates that to recover the experimental zQ requires a Ca2+ binding rate constant that is 100-fold faster than the one reported by Hou et al. (2016) exceeding the diffusion limit constraint. Therefore, we can conclude that Ca2+-binding is slow enough to safely ignore calcium re-equilibration during the 100 μs it takes to measure the gating charges.

To further elucidate the mechanism by which Ca2+ and voltage sensors interact, we performed fits of the QC(V) data using the two different models represented by Scheme I and Scheme II (Figure 4A-B). The allosteric factor EĀ that accounts for the coupling between the Ca2+-binding sites and the voltage sensors was constrained to values calculated from the experimental data for the QC(V) shift at Ca2+ saturating conditions (100 µM) in relation to the same curve in the absence of Ca2+. TheĀ zJ, J0Ā and KD parameters obtained during the fitting procedure were very similar for each model (Table 1). The fitted values for the affinity constant (KDĀ = 6 µM) agree with previous reports (Horrigan and Aldrich, 2002; Cox et al., 1997) although they are slightly smaller than those estimated for the closed conformation of the channel (KDĀ = 11 µM). Based on the Akaike Information Criterion (AIC) (Akaike, 1974), the model that fits to the QC(V,Ca2+) data best is Model II, whereas the probability of the Model I being the best model is negligible (wiĀ = 10āˆ’47) (Table 1). Both models generates a VH-log⁔Ca2+ curve that accounts reasonably well for the dose-response experimental data (Figure 4C). However, Model I predicts a pronounced decrease in the zQ parameter of the QC(V) curves at intermediate Ca2+ conditions which differs markedly from the experimental values (Figure 4D). This prediction is a consequence of the fractional distribution of two very distinctive functional states of the voltage sensors (unliganded and Ca2+-saturated, see above). Additionally, the behavior of QC(V) curves at intermediate Ca2+ concentrations (1-10 µM) is qualitatively consistent with the phenotype exhibited by the Ca2+-VSD scheme II (Figure 3D and Figure 4B). Thus, the experimental dose-dependent effect of Ca2+ on voltage sensor activation suggests that Ca2+-binding to a single α-subunit of BK channels increases E-fold the equilibrium constant JĀ that defines the equilibrium between resting and active conformations of the voltage sensors in all four subunits.

Figure 4 with 1 supplement see all
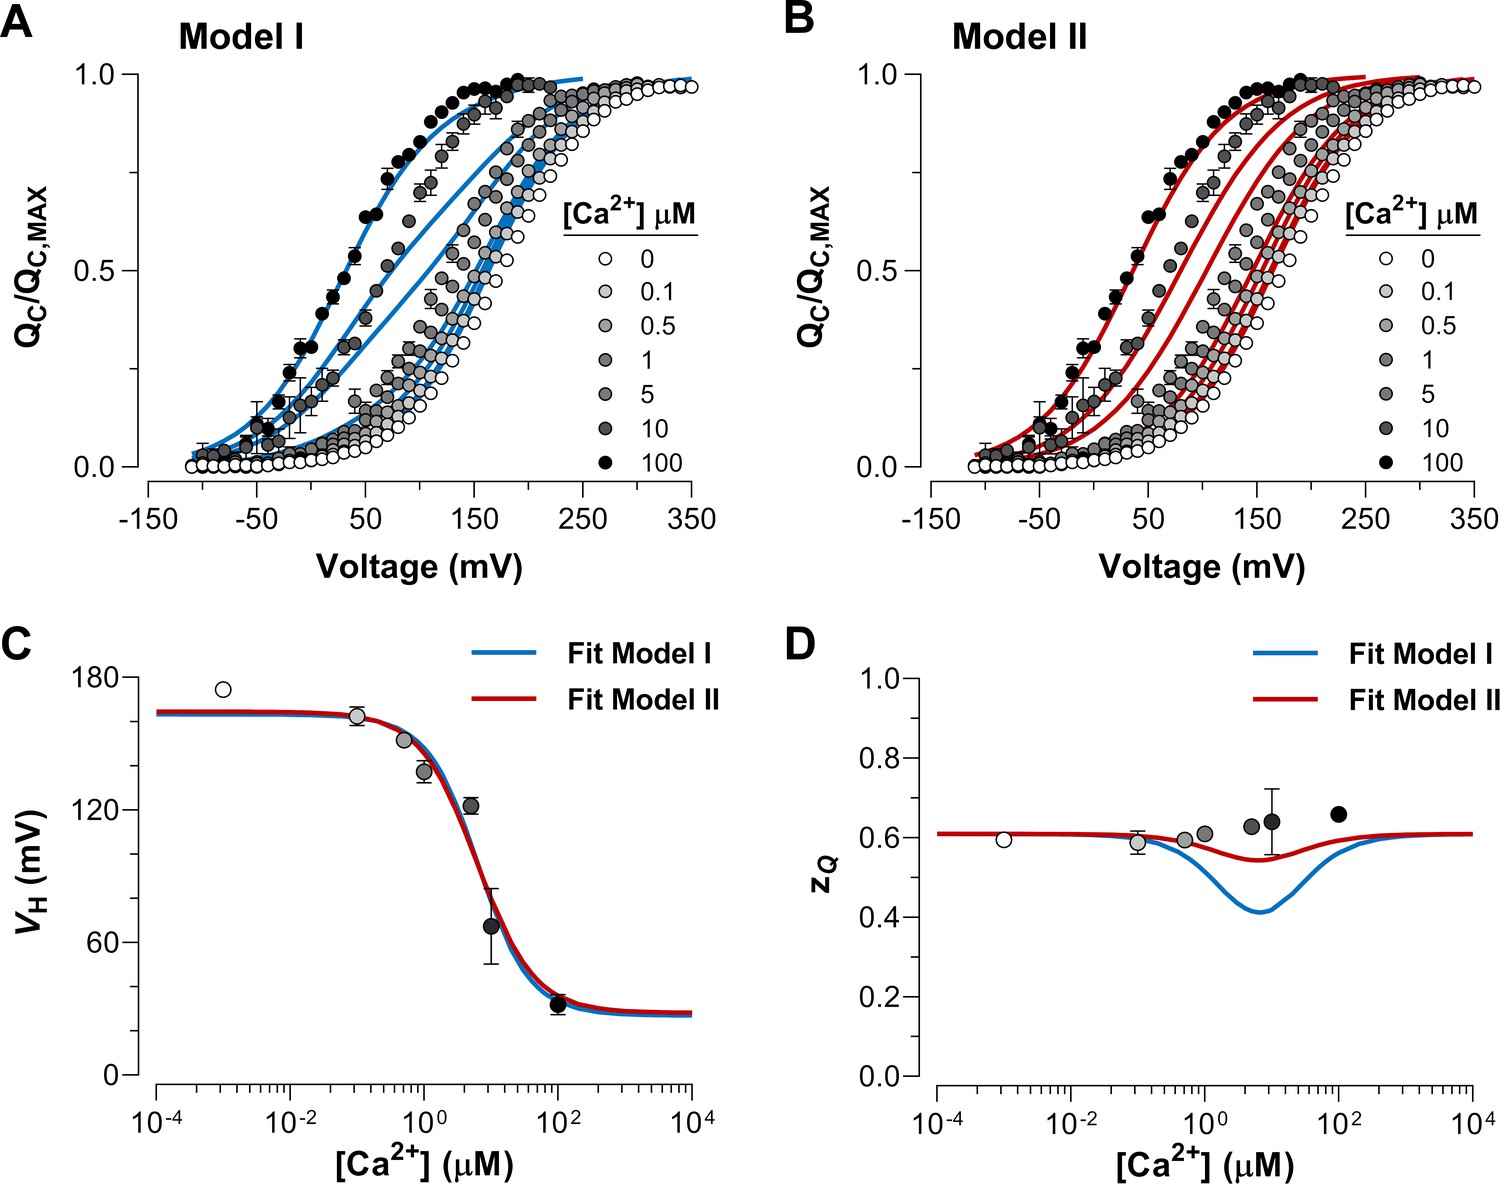
Dose-dependent effect of Ca2+ on voltage sensor activation is predicted by a Ca2+-VSD interaction mechanism in which Ca2+-binding affects equally the VSD in all four α-subunits.

(A–B) The experimental QC(V) data were fitted using the two possible allosteric interaction mechanisms between voltage and calcium sensors described by Scheme I and Scheme II. The blue and red lines represent the global fits by Model I and Model II, respectively. The allosteric factor EĀ (EM1Ā andĀ EM2) was constrained to the value obtained from the individual fitting of the QC(V)/QC,Ā MAX curves at 0 and 100 µM Ca2+ (experimental EĀ (Eexp) equal to 26.4, see Table 1). TheĀ zJ, J0Ā and KD parameters were allowed to vary freely. Note that the allosteric factor EĀ for Model I (EM1) and Model II (EM2) have different interpretations, since EM1=Eexp whereas EM2=Eexp4 given that the four voltage sensor will be altered in 2.3-fold (EM2Ā =Ā 2.27) with each additional Ca2+ bound. (C–D) The Ca2+-dependence of zQ-QC(V) (C) and VH-QC(V) (D) curves are superimposed with the zQ and VH values predicted by Model I (blue line) and Model II (red line).

https://doi.org/10.7554/eLife.44934.009

High-affinity Ca2+-binding sites in RCK1 and RCK2 domains contribute equally to the allosteric coupling between Ca2+ and voltage sensors

Under physiological conditions, the RCK1 and RCK2 high-affinity Ca2+-binding sites are responsible for all the calcium sensitivity of the activation of BK channel (Schreiber and Salkoff, 1997; Bao et al., 2002; Bao et al., 2004; Xia et al., 2002). However, distinct physiological roles of the RCK1 Ca2+-sensor and Ca2+ bowl may be based on their functionally and structurally distinctive properties (Zeng et al., 2005; Sweet and Cox, 2008; Yang et al., 2010; Savalli et al., 2012; Tao et al., 2017). We next asked what the energetic contribution to VSD equilibrium was of the two high-affinity Ca2+-binding sites contained in the RCK1 and RCK2 domains.

To elucidate the effect of each Ca2+-sensor on the VSD activation we used mutations that selectively and separately abolish the function of the two different RCK Ca2+-sites. Disruption of the RCK1 Ca2+-sensor by the double mutant D362A/D367A (Xia et al., 2002) significantly reduced (48%, Ī”VH(D362A/D367A) = -74.9 ± 4.7 mV) the leftward shift of the QC(V) curves at 100 μM Ca2+ compared with that for the wild-type (WT) BK channel (Figure 5A, C). We also examined the effect of the mutant M513I (Bao et al., 2002) which has been shown to eliminate the Ca2+ sensitivity mediated by the RCK1 site (Bao et al., 2002; Bao et al., 2004; Zhang et al., 2010). In this mutant, the 100 µM Ca2+-induced shift in VH of the VSD activation curve was also considerably smaller compared to that for the WT channel (about 54%, Ī”VH(M513I) = -65.4 ± 2.6 mV) (Figure 6). Therefore, both mutations affect the Ca2+-induced enhancement of the activation of the voltage sensor very similarly through the RCK1 site (Figure 6C), although their mechanisms of action could be quite different. The M513 residue appears to participate in the stabilization of the proper conformation of the RCK1 Ca2+-site whereas D367 is a key residue in the coordination of Ca2+ ions (Wu et al., 2010; Zhang et al., 2010; Tao et al., 2017). On the other hand, neutralization of the residues forming part of the Ca2+ bowl (Schreiber and Salkoff, 1997) (5D5A mutant, see MaterialsĀ andĀ methods) on the RCK2 domain decreased the leftward shift of the QC(V) curve by approximately 54% (Ī”VH(5D5A) = -65.7 ± 4.7 mV) when Ca2+ was increased up to 100 μM (Figure 5B, D). The effect of Ca2+ binding on āˆ†VH contributed by each high-affinity Ca2+ site is roughly half that for WT channels with both sites intact (Figure 5E). Therefore, both high-affinity Ca2+-binding sites contribute approximately equally to the decrease in free energy that is necessary to activate the VSD. Indeed, the change of free energy of the resting-active equilibrium of the voltage sensor in response to Ca2+-binding at RCK2 site is ~ -4 kJ/mol (ΔΔGVCa(D362A/D367A) = -4.2 ± 0.3 kJ/mol and ΔΔGVCa(M513I) = -3.6 ± 0.5 kJ/mol) (Figure 5C and Figure 6C). Similarly, the occupation of the RCK1 Ca2+-binding site decreased the free energy necessary to activate the VSD in -3.8 ± 0.4 kJ/mol (ΔΔGVCa(5D5A)). Remarkably, these findings reveal an additive effect of Ca2+-binding to the RCK1 and Ca2+ bowl sites on the VSD activation, which suggest independent allosteric pathways through which they exert their modulation on the VSD.

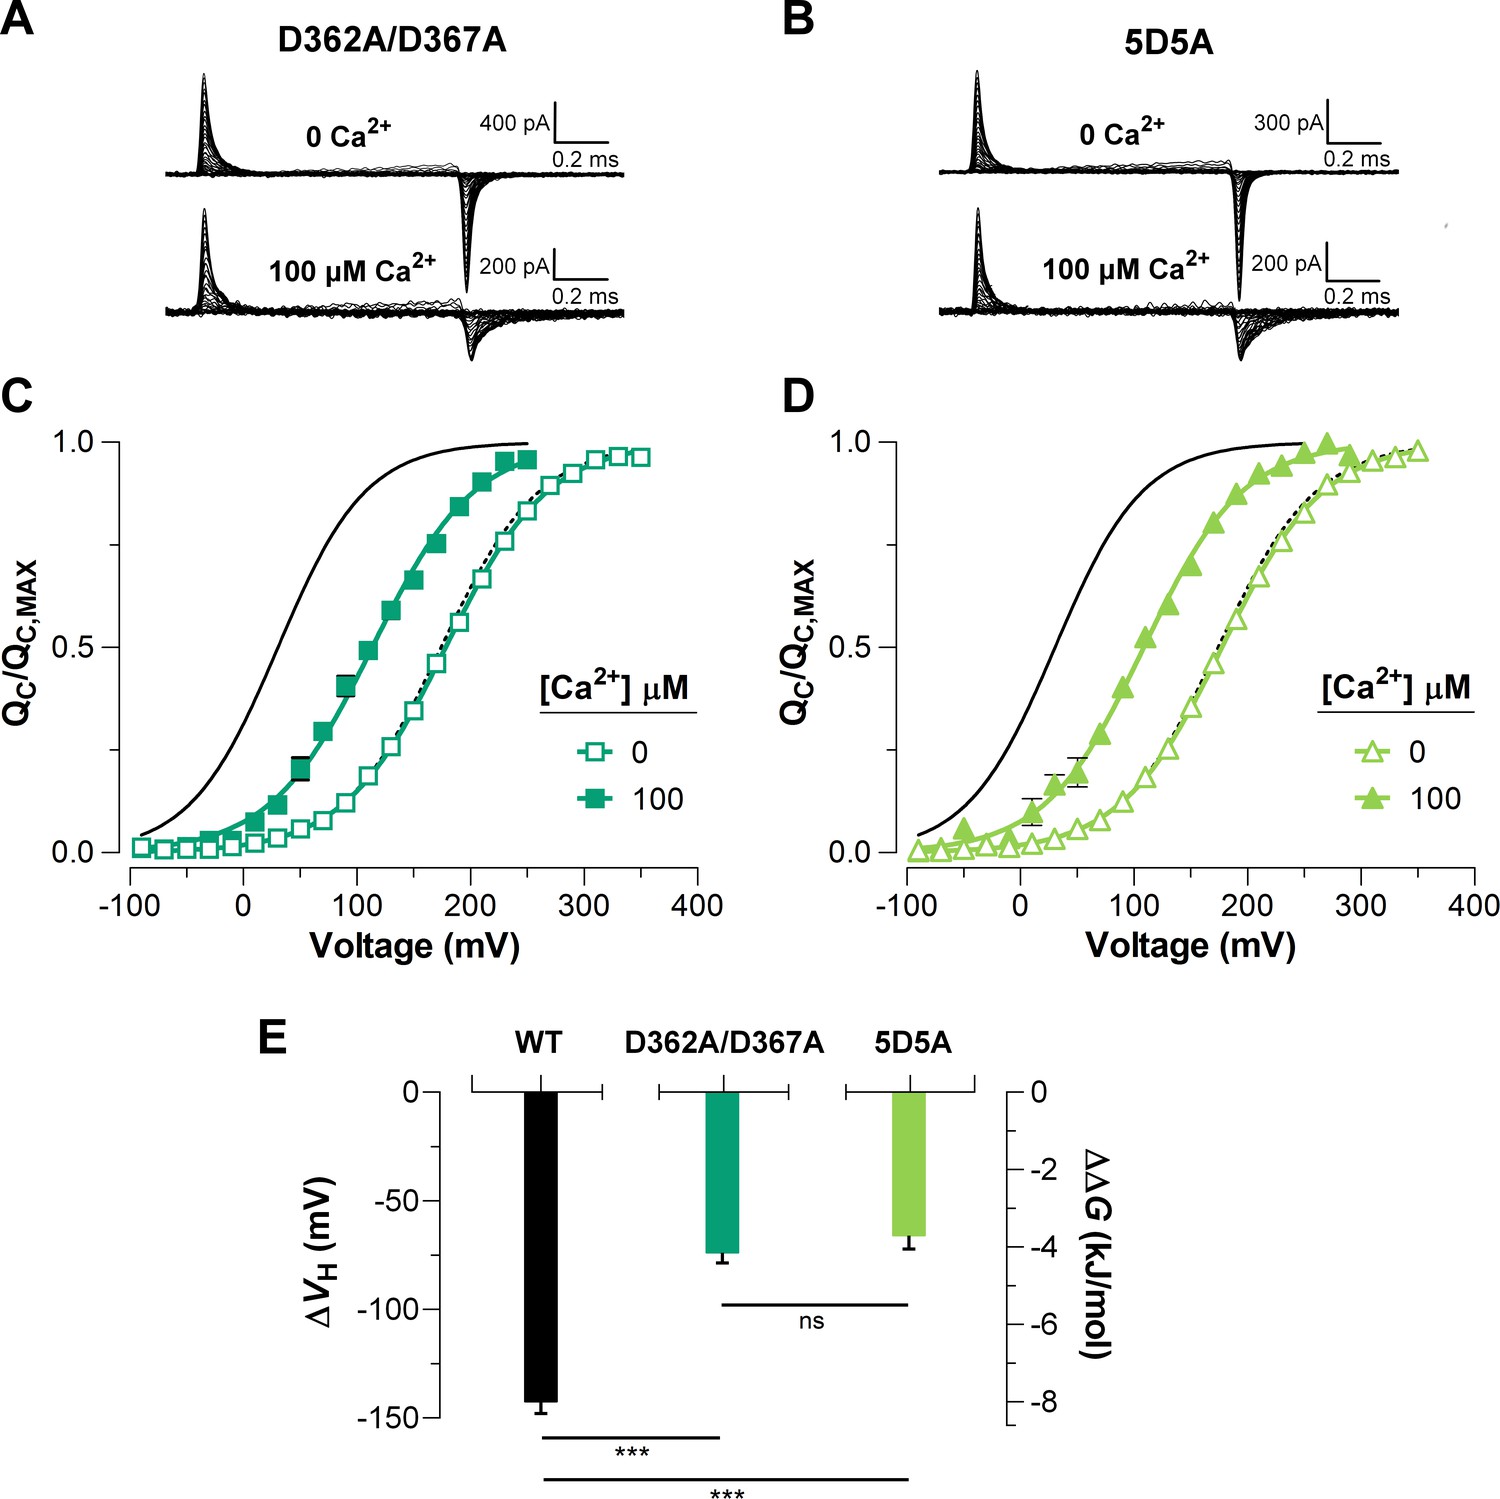
The high-affinity Ca2+-binding sites contribute equally to the allosteric coupling between calcium and voltage sensors in BK channels.

(A–B) Representative gating current (IG) recordings at 0 and 100 μM of [Ca2+]i for the RCK1 site mutant (D362A/D367A) and the RCK2 site mutant (5D5A), respectively. (C–D) Gating charge-voltage curves (QC(V)) were obtained at 0 Ca2+ (open symbols) and 100 μM Ca2+ (filled symbols) for D362A/D367A and 5D5A mutants, respectively. Boltzmann fitting to the experimental data (mean ± SEM) is indicated by solid lines (VH(D362A/D367A)Ā =Ā 178.0 ± 2.7 mV, zQĀ = 0.58 ± 0.01, nĀ = 12 and VH(5D5A)Ā =Ā 176.4 ± 4.6 mV, zQĀ = 0.58 ± 0.01, nĀ = 17 at ā€˜zero’ Ca2+; VH(D362A/D367A)Ā =Ā 104.2 ± 7.3 mV, zQĀ = 0.56 ± 0.02, nĀ = 7 and VH(5D5A)Ā =Ā 110.8 ± 6.7 mV, zQĀ = 0.58 ± 0.02, nĀ = 6 at 100 µM Ca2+). For comparison, all QC(V) plots include the Boltzmann fit of the QC(V) curves for WT at 0 Ca2+ (dashed black line) and 100 μM Ca2+ (solid black line). (E) Quantification of the VH shift (Ī”VH) in the QC(V) curves and the free energy change (ΔΔGVCa) induced by 100 μM Ca2+. The non-parametric t-test was used to evaluate statistical significances between WT BK channel and the RCK sites mutants (***p<0.001).

https://doi.org/10.7554/eLife.44934.011
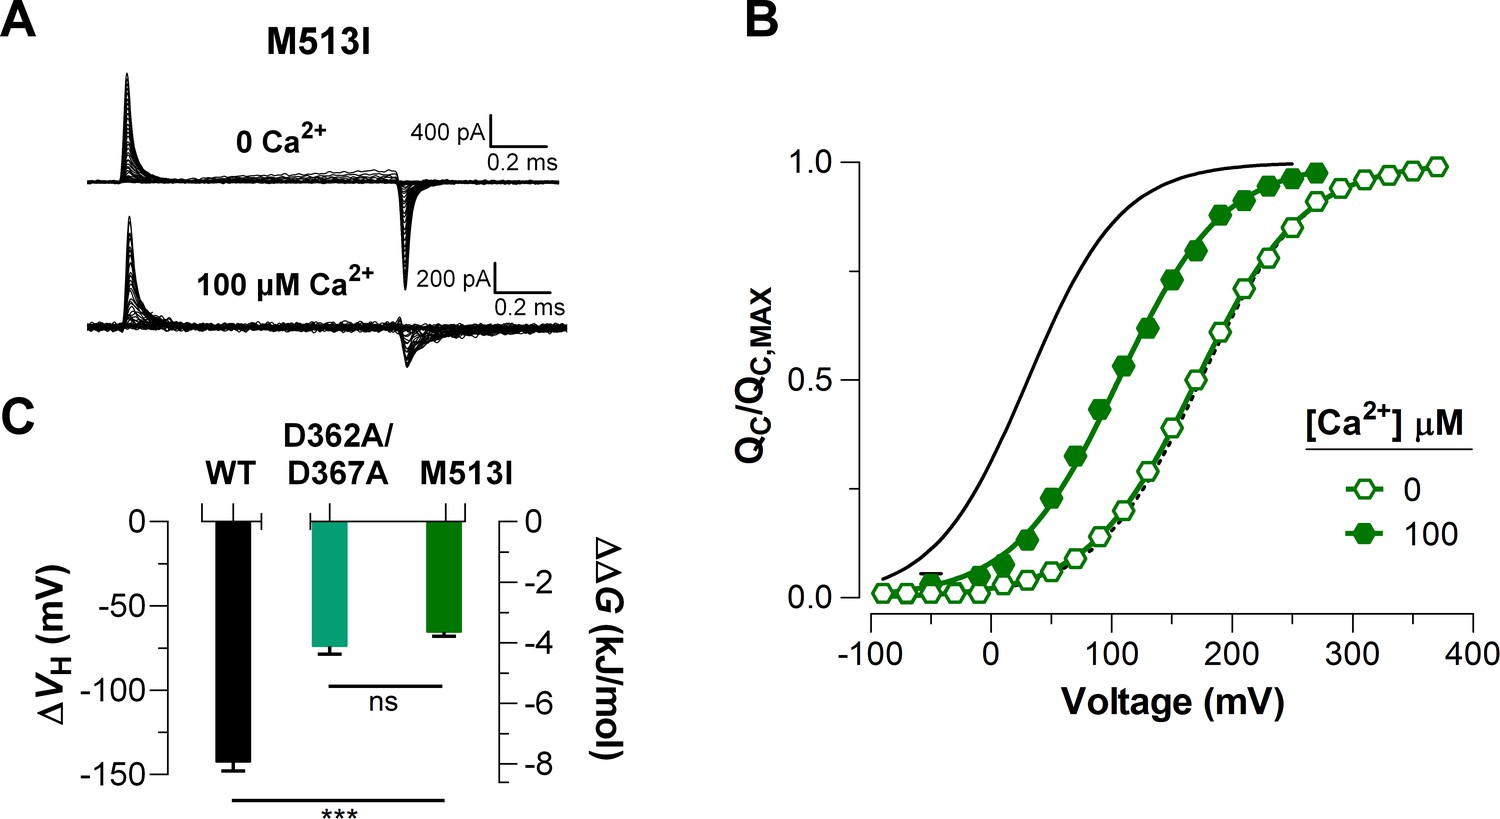
Mutations abolishing Ca2+-sensing by the RCK1 binding-site reduce the Ca2+-induced effect on voltage sensors activation similarly.

(A) Representative gating current (IG) recordings at 0 and 100 μM [Ca2+]i for the RCK1 site mutant M513I. (B) Gating charge-voltage curves QC(V) were obtained at 0 Ca2+ and 100 μM Ca2+ (open and filled symbols) for the M513I mutant. Boltzmann fit to the experimental data (mean ± SEM) is indicated by solid lines (VH(M513I)= 170.4 ± 4.4 mV, zQ = 0.58 ± 0.01, nĀ = 17 at ā€˜zero’ Ca2+ and VH(M513I)= 105.0 ± 6.3 mV, zQĀ = 0.62 ± 0.03, nĀ = 4 at 100 µM Ca2+). For comparison, the QC(V) plot includes the Boltzmann fit of the QC(V) curves for WT at 0 Ca2+ and 100 μM Ca2+ (dashed and solid black line). (C) Quantification of the VHĀ shiftĀ (Ī”VH)Ā in the QC(V) curves and the free energy change induced by 100 μM Ca2+(ΔΔGVCa). A non-parametric t-test was used to compare WT and RCK1-site mutants BK channels (***p<0.001).

https://doi.org/10.7554/eLife.44934.012

Taking these results into account, we expanded the Ca2+-VSD interaction models considering the energetic contribution of the two kinds of Ca2+ sensors on the VSD per α-subunit (EWT=ES1*ES2) (Figure 3—figure supplement 1D). As described in the above model fittings, the allosteric factors EĀ for each one RCK1 and RCK2 sites (ES1Ā andĀ ES2) were constrained to values equivalent to the Ca2+-induced energetic perturbations of the voltage sensor equilibrium for the 5D5A and D362A/D367A mutants, respectively. The inclusion of two Ca2+ sites per subunit in the Ca2+-VSD interaction schemes increases the functional states of the VSD for both models (Figure 3—figure supplement 1E). Therefore, it becomes difficult to discriminate between different models based on the phenotype of the QC(V) curves at intermediate Ca2+ concentrations (Figure 4—figure supplement 1A-B). However, according to the AIC criteria (compare AICs for the models in Table 1), Model II - Two Ca2+ sites is the model that best describes the QC(V,Ca2+) data (wi= 0.99). As mentioned when describing the one Ca2+ site models, the goodness of the different models can be better appreciated by the Ca2+-dependence of the zQ parameter (Figure 4—figure supplement 1C-D). The fractional distribution of the distinct functional states of the VSDs defined by Model I -Two Ca2+ sites (unliganded, RCK1 site occupied, RCK2 site occupied, and the two sites occupied; see Figure 3—figure supplement 1E) produce a zQ-log⁔Ca2+ curve with a pronounced minimum when the Ca2+ concentration is close to the KD value (Figure 4—figure supplement 1C). Thus, Model I -Two Ca2+ sites predicts a prominent Ca2+- dependence of the zQ whereas as we found experimentally, the zQ predicted by Modell II is essentially independent of the Ca2+ concentration. The slight apparent increase in zQ data observed in Figure 4—figure supplement 1C as the Ca2+ concentration is increased is not statistically significant.

We note here that when the intrasubunit cooperativity factor (G) is allowed to vary freely, Model II produces estimates of the KD parameters that are out the range relative to the apparent Ca2+ affinities previously reported in the literature for the Ca2+-binding sites (KD(RCK1) = 13 - 24 µM and KD(RCK2) = 3 - 5 µM) (Sweet and Cox, 2008; Bao et al., 2002; Xia et al., 2002). In addition, Model II reaches better estimates of the KD parameters (Table 1) if we consider non cooperative interactions between the Ca2+-binding sites. However, although the KD value for the RCK2 Ca2+-binding site is in agreement with previous reports, Model II underestimates the value for KD(RCK1).

Discussion

Recent functional and structural studies have revealed the existence of a major interplay between voltage- and Ca2+-sensing modules in the BK channel (Yuan et al., 2010; Savalli et al., 2012; Miranda et al., 2013; Miranda et al., 2016; Miranda et al., 2018; Carrasquel-Ursulaez et al., 2015; Hite et al., 2017; Tao et al., 2017; Zhang et al., 2017), which offer a new perspective on our understanding of its multimodal gating mechanism. However, the details of the CTD-VSD allosteric coupling as well its molecular nature have yet to be firmly established since their direct assessment is experimentally challenging. Based on the functional independence of the distinct structural domains involved (PD, CTD, and VSD), the energetic relationship between the sensory modules can be directly defined by comparing the change in the equilibrium of the voltage sensor under two extreme Ca2+ conditions: unliganded and saturated (Horrigan and Aldrich, 2002).

Thus, by characterizing the voltage dependence of charge movement in the virtual absence of internal Ca2+ and at Ca2+ concentrations that saturate the Ca2+ high-affinity sites, this work directly establishes that Ca2+-binding significantly facilitates VSD activation through direct energetic contribution to the R-A equilibrium (Ī”VHĀ = -142.6 ± 4.5 mV and ΔΔGVCa = -7.98 ± 0.27 kJ/mol). Although this result is in agreement with previous reports from our laboratory (Ī”VHĀ = -140 mV and ΔΔGVCa = -7.9 kJ/mol; at [Ca2+]i = 100 µM) (Carrasquel-Ursulaez et al., 2015), it is at odds with the smaller leftward shift obtained by Horrigan and Aldrich (2002) at saturating Ca2+ concentration (Ī”VHĀ = -33 mV and ΔΔGVCa = -1.9 kJ/mol; at [Ca2+]i = 70 µM). The reason for the contradictory findings is not clear to us. At this stage, we can only identify two differences between the experimental procedures followed by Horrigan and Aldrich (2002) and by us. First, there is a difference in the BK channel clones used (hSlo1 vs mSlo1). Since mBK channels share a high degree of identity with hBKs (96%), it seems unlikely that the differences in Ca2+ binding and voltage sensor coupling are due to different BK clones. Second, Horrigan and Aldrich did all their experiments at 0 and 70 μM Ca2+ in HEK cells. Here, one can argue that the strength of coupling between Ca2+ binding and the voltage sensor may be different in distinct expression systems (e.g., differential modulation) but this is something that is outside the scope of the present paper. Moreover, even if we assume that the calcium effect on VSD is underestimated at 70 µM Ca2+ (Horrigan and Aldrich, 2002) compared to 100 µM (our work), we observed a significantly greater effect of Ca2+ concentrations (1, 5 and 10 µM, Figure 2) when less than 50% of the Ca2+ sensors are occupied (KDĀ = 11 µM; Horrigan and Aldrich, 2002; Cox et al., 1997).

Fluorescence studies that optically track the motion of the voltage sensor or of the gating ring provide two lines of evidence that support the present findings. First, conformational rearrangements of the voltage sensors detected using voltage-clamp fluorometry can be provoked by Ca2+-binding to the high-affinity sites. A sudden rise in intracellular [Ca2+] caused by a UV flash induced-photolysis of caged Ca2+ prompts a leftward shift in both conductance-voltage (GV) and fluorescence-voltage (FV) relationships. These results suggest that functional activation of the gating ring is propagated to the VSD, leading to structural perturbations of voltages sensors, thereby favoring its active conformation (Savalli et al., 2012). Second, the structural rearrangement of the gating ring in response to Ca2+ has a voltage dependence (Miranda et al., 2013; Miranda et al., 2018) attributable to the operation of the voltage sensor. The origin of these voltage-dependent motions has recently been established via modifications of the voltage-sensing function of the BK channel using the patch-clamp fluorometry technique (Miranda et al., 2018). Both mutations of the charged residue on the S4 transmembrane segment (R210, R213, and E219) and the co-expression of the β1-subunit with BKα channel, modify the conformational changes of the gating ring triggered by depolarization in correspondence to the observed GV shift measured for these channel constructs. In contrast, perturbations of pore opening equilibrium (e.g. through the F315A mutation or the assembly of BKα channel with γ1-subunit) does not modify the voltage-dependent reorganization of the gating ring (Miranda et al., 2018).

Mechanistically, how might the CTD-VSD coupling occur in manner that is independent of channel opening? Taking into account the homotetrameric configuration of the BK channel, Horrigan and Aldrich (2002) defined the general gating scheme of BK channel considering the simplest CTD-VSD interaction model in which voltage sensors and Ca2+-binding sites interact solely within the same subunit. However, the VSD movement at non-saturating Ca2+ conditions observed here, which entail distinct functional states of the Ca2+-binding sites (unliganded and liganded), unveiled that the standard HA model is unable to explain the mechanistic interaction governing the allosteric coupling between the Ca2+ and voltage sensors. Assuming that Ca2+-sensors are independent and they modify the voltage sensor in the same subunit only, Scheme I would predict QC(V) curves characteristic of an all-or-none model showing two well-distinguishable Boltzmann components corresponding to the fractions of unliganded and Ca2+-saturated BK channels (Figure 4A). Conversely, an energetic effect of each Ca2+-site on all the voltage sensors of the tetramer would lead to an equivalent functional status of each VSD, so that the QC(V) curves would shift as the occupancy of the Ca2+ sites increased. Proposing that the VSD and Ca2+ sites interact in the manner described by Scheme II reproduces reasonably well the behavior of the Ca2+-dependent gating charge movement observed in our experiments (Figure 4B–D). This concerted CTD-VSD communication may underlie a mechanism analogous to the mechanical strategy of interaction between the homooctameric ring of RCK domains and the pore module described for bacterial K+ channels (Jiang et al., 2002; Ye et al., 2006; Lingle, 2007; Pau et al., 2011; Smith et al., 2012; Smith et al., 2013). In both MthK and BK channels the Ca2+-site occupancy triggers a conformational change corresponding to a symmetric overall rearrangement of the cytosolic tetrameric structure that is ultimately propagated to the transmembrane regions (TMD) via C-linker and in the BK channel, also via the protein-protein interfaces between the gating ring and the TMD (Jiang et al., 2002; Jiang et al., 2003; Ye et al., 2006; Yuan et al., 2010; Yuan et al., 2012; Pau et al., 2011; Smith et al., 2012; Tao et al., 2017). Thus, we can speculate that each Ca2+-binding event produces a gradual conformational expansion of the gating ring affecting the four voltage sensors in each step through the progressive perturbations within the protein-protein interfaces.

As mentioned above, the communication pathway through which the Ca2+-driven conformational changes are propagated to the voltage sensors appears to reside on the CTD-VSD interface that involves non-covalent interactions between RCK1 N-lobe and S0-S4 transmembrane segments (Yang et al., 2007; Yang et al., 2008; Yang et al., 2010; Sun et al., 2013; Hite et al., 2017; Tao et al., 2017). Although it is not possible at present to dismiss the possibility that the Ca2+ binding effect on the VSD workings is, at least in part, mediated by the covalent pulling of the C-linker, we recall that the VSDs are domain-swapped with RCK domains in the gating ring (Tao et al., 2017). Therefore, binding of Ca2+ makes the RCK1 N-lobe pull on the S6 helix from its subunit whereas the modification of the contact surface between the RCK1 N-lobe with the voltage sensor of an adjacent subunit induces an outward displacement of the voltage sensor (Hite et al., 2017). These structural arguments make us favor the non-covalent interaction between the CTD and the VSD as the source of the coupling between these two structures. Scanning mutagenesis of RCK1-N terminal subdomain indicates that residues on the βA-αC region are involved in the allosteric connection of the Ca2+-dependent activation mediated by RCK1 site occupancy (Yang et al., 2010). In line with this study, the selective activation of the RCK1 domain was identified as being responsible for the Ca2+-induced VSD rearrangement (Savalli et al., 2012) and the voltage dependence of the Ca2+-driven motions of gating ring (Miranda et al., 2016; Miranda et al., 2018), suggesting that CTD-VSD allosteric coupling is primarily determined by the RCK1 site (Sweet and Cox, 2008). However, our results are inconsistent with this picture. The constructs D362A/D367A and 5D5A (D894A-D898A) selectively impair the Ca2+-sensitivity of the RCK1- and RCK2-sensors, respectively, by neutralizing the residues that are involved in contributing to Ca2+-coordination (Zhang et al., 2010; Tao et al., 2017). Comparing the fast gating charge movement at 0 Ca2+ and saturating Ca2+ conditions reveals that the energetic effect of Ca2+-binding on voltage sensor equilibrium is practically identical (~ āˆ’4 kJ/mol) for both the D362A/D367A and the 5D5A mutations (Figure 5). Thus, our findings establish that the RCK2-driven contribution to CTD-VSD energetic coupling is quite similar to the RCK1-driven contribution. The functional role of the RCK2-sensor on Ca2+-sensitivity of VSD activation was further corroborated using the M513I mutation (Figure 6). This point mutation hinders the Ca2+-dependent activation associated with the RCK1-sensor, presumably by disrupting the structural integrity of the binding site and the transduction pathway through the βA-αC region (Zhang et al., 2010). Thus, another residue involved in the BK Ca2+-dependent activation mediated by the RCK1 Ca2+-binding site but not forming part of the site itself, decreases the QC(V) leftward shift almost in the same amount as does the D362A/D367A mutant.

We found that the energetic contribution of each RCK site to the voltage sensor equilibrium is the same and its combination mimics the VSD Ca2+-sensitivity of the fully occupied sites. These findings remind us of early reports showing that mutations in each RCK site shift the Ca2+-dependent GVĀ by approximately one-half relative to the effect seen for WT channels (Bao et al., 2002; Xia et al., 2002). Thus, our results suggest that the two RCK-sensors contribute independently to the modulation on the VSD, although we cannot eliminate the possibility of some cooperativity between them. Indeed, various lines of evidence indicate that there is some, albeit modest, cooperativity between the two high-affinity Ca2+-binding sites although its nature is still unclear (Qian et al., 2006; Savalli et al., 2012; Sweet and Cox, 2008). Intra and intersubunit structural connectivity supports the putative cooperative interactions between the Ca2+ sensors at the gating ring (Hite et al., 2017; Yuan et al., 2012). In fact, a recent functional study of the intrasubunit connections between the RCK1 site and Ca2+ bowl (R514-Y904/E902 interactions) has shown that such connections are potential candidates for the structural determinants underlying a cooperative mechanism between the RCK1- and RCK2-sensor. These interactions are involved in either the preservation of the integrity of RCK1 Ca2+-binding site or define the allosteric propagation pathway of the chemical energy induced by Ca2+ binding towards transmembrane domains (Kshatri et al., 2018). On the basis of the cryo-EM structure of Aplysia californica BK channel, (Hite et al., 2017) proposed that there should be a positive cooperativity between the Ca2+-binding at RCK1 site and the Ca2+ bowl since the Ca2+-induced conformational change of the RCK1-N lobes from closed to open configuration depends on the functional state (unliganded and liganded) of both RCK sites.

Our analysis based on the CTD-VSD interaction model can not specify likely cooperative relations among the two high-affinity Ca2+ sites within the same α-subunit. In fact, the analysis of our gating current data when using cooperativity between the two high-affinity sites (Table 1) produced a result at odds with previous reports. Based on the structural information of the BK channels, it could be considered that cooperative interactions between the Ca2+ sensors of the different α-subunits (Hite et al., 2017) can also account, in part, for the Ca2+-dependent behavior of the VSDs. However, functional studies point out a more relevant role of the intrasubunit cooperativity (albeit modest) than the intersubunit cooperativity between the RCK Ca2+ sites (Niu and Magleby, 2002; Qian et al., 2006). Thus, although a concerted CTD-VSD model (Scheme II) gives better explanation than an independent CTD-VSD model (Scheme I) to the allosteric communication of the calcium and voltage sensors, more work is required to explore improved models able to reproduce more accurately the properties of the interaction CTD-VSD mechanism in BK channel.

Table 1
Parameters for the best fits of the QC(V) data using different Ca2+-VSD interaction models.
https://doi.org/10.7554/eLife.44934.013
One Ca2+-site per α-subunitTwo Ca2+-sites per α-subunit
Model IModel IIModel IModel II
ParametersParametersWith cooperativityWithout cooperativityWith cooperativityWithout cooperativity
zJ0.610.61zJ0.610.610.610.61
J00.0200.018J00.0190.0190.0210.019
E26.4*2.27*ES14.57*1.46*
ES25.35*1.52*
KD (µM)6.46.1KD1 (µM)3.24.9837.75.9
KD2 (µM)631.76.96.65.9
G56.11*120.41*
AICāˆ’948.4āˆ’1150.9āˆ’1088.9āˆ’1090.3āˆ’1162.0āˆ’1147.5
Li4*10āˆ’470.0041*10āˆ’163*10āˆ’1617*10āˆ’4
wi4*10āˆ’470.0041*10āˆ’163*10āˆ’160.9950.001
  1. *Fixed parameters in the model fitting. AIC values correspond to Akaike Information Criterion to select the best fit model. ā„’i and wi are the relative likelihood and the weight of each model within the set of candidate models.

In conclusion, our results depict a remarkable, and direct energetic interplay between the specialized sensory modules (VSD and CTD) of the BK channel. Our findings together with the emerging structural-functional information establish a new paradigm about how stimuli integration (depolarization and intracellular Ca2+) modulates this channel’s activation and its relevance within a physiological context. Notable and unexpected is the equivalent contribution of the distinct ligand-binding sites in the cytosolic domain to the allosteric regulation of voltage sensing. Additional studies to discern the molecular bases underlying the Ca2+ and voltage propagation pathways and the cooperative interactions of the RCK1 and RCK2 regulatory domains may provide new clues about the dual gating mechanism of BK channel.

Materials and methods

Channel expression

Request a detailed protocol

Xenopus laevis oocytes were used as a heterologous system to express BK channels. The cDNA coding for the human BK α-subunit (U11058) was provided by L. Toro (University of California, Los Angeles, CA). The cDNA coding for independent mutants of each two high-affinity Ca2+ site from BK channel, the double mutant D362A/D367A (Xia et al., 2002), the mutant M513I (Bao et al., 2002) in the RCK1 Ca2+-binding site, and the mutant 5D5A (Schreiber and Salkoff, 1997) (D894A/D895A/D896A/D897A/D898A) in the RCK2 Ca2+-binding site or calcium bowl, were kindly provided by M. Holmgren (National Institutes of Health, Bethesda, MD). The cRNA was prepared using mMESSAGE mMACHINE (Ambion) for in vitro transcription. Xenopus laevis oocytes were injected with 50 ng of cRNA and incubated in an ND96 solution (in mM: 96 NaCl, 2 KCl, 1.8 CaCl2, 1 MgCl2, 5 HEPES, pH 7.4) at 18°C for 4–8 days before electrophysiological recordings.

Electrophysiological recordings

Request a detailed protocol

All recordings were made by using the patch-clamp technique in the inside-out configuration. Data were acquired with an Axopatch 200B (Molecular Devices) amplifier and the Clampex 10 (Molecular Devices) acquisition software. Gating current (IG) records were elicited by 1 ms voltage steps from āˆ’90 to 350 mV in increments of 10 mV. Both the voltage command and current output were filtered at 20 kHz using an 8-pole Bessel low-pass filter (Frequency Devices). Current signals were sampled with a 16-bit A/D converter (Digidata 1550B; Molecular Devices), using a sampling rate of 500 kHz. Linear membrane capacitance and leak subtraction were performed based on a P/4 protocol (Armstrong and Bezanilla, 1974).

Borosilicate capillary glasses (1B150F-4, World Precision Instruments) were pulled in a horizontal pipette puller (Sutter Instruments). After fire-polishing, pipette resistance was 0.5–1 MĪ©. The external (pipette) solution contained (in mM): 110 tetraethylammonium (TEA)-MeSO3, 10 HEPES, 2 MgCl2; pH was adjusted to 7.0. The internal solution (bath) contained (in mM): N-methyl-D-glucamine (NMDG)-MeSO3, 10 HEPES, and 5 EGTA for ā€˜zero Ca2+’ solution (∼0.8 nM, based on the presence of ∼10 μM contaminant [Ca2+] (Cui et al., 1997). An agar bridge containing 1 M NaMES connected the internal solution to a pool of the external solution grounded with an Ag/AgCl electrode. The calculated bridge/bath junction potential wasĀ ~0.8 mV. For test solutions at different Ca2+ concentrations (0.1–100 μM), CaCl2 was added to reach the desired free [Ca2+], and 5 mM EGTA (0.1–0.5 μM) or HEDTA (1–10 μM) was used as calcium buffer. No Ca2+ chelator was used in 100 µM Ca2+ solutions. Free calcium concentration was estimated using the WinMaxChelator Software and checked with a Ca2+-electrode (Hanna Instruments). All experiments were performed at room temperature (20–22°C). To measure IG at different Ca2+ concentrations in the same oocyte, the patch was excised and washed with an appropriate internal solution using at least 10 times the chamber volume.

Data analysis

Request a detailed protocol

All data analysis was performed using Clampfit 10 (Molecular Devices, RRID:SCR_011323), Matlab (MathWorks, RRID:SCR_001622) and Excel 2007 (Microsoft, RRID:SCR_016137). The first 50-100 µs of the ON-gating currents were fitted to a single exponential function and the area under the curve (Figure 1A-B) was integrated to obtain the charge displaced between closed states (QC) (Horrigan and Aldrich, 1999; Horrigan and Aldrich, 2002; Carrasquel-Ursulaez et al., 2015; Contreras et al., 2012). QC(V) data for each [Ca2+]i were fitted using a Boltzmann function:

QC(V)=Ā QC,Ā MAX1+e(āˆ’zQF(Vāˆ’VH)RT)

where QC,Ā MAX is the maximum charge, zQĀ is the voltage dependence of activation, VHĀ is the half-activation voltage, TĀ is the absolute temperature (typically 295 K), FĀ is the Faraday’s constant, and RĀ is the universal gas constant.Ā QC,Ā MAX, VH, and zQ were determined using least square minimization. QC(V)Ā curves were aligned by shifting them along the voltage axis by the mean Ī”V=(⟨VHāŸ©āˆ’VH) to generate a mean curve that did not alter the voltage dependence (Horrigan et al., 1999). All error estimates are SEM.

For each experiment, the time constants obtained from exponential fits to ON-gating currents were shifted along the voltage axis by ΔV to determine the mean τIG-ON (V) relationships. τIG-ON (V) data were fitted to a two-states process described by

Ļ„(V)=1/α(V)+β(V)

where α(V)=α0e(zJΓFV/RT) and β(V)=β0e(zJ(Γ-1)FV/RT) are, respectively, the forward and backward rate constants which determine the equilibrium constant J of the voltage sensor (see below). The parameter Γ is the electrical distance at which the peak of the energy barrier that separates the two resting (R)-active (A) states of the voltage sensor is located, and zJ is the number of gating charges displaced during the R-A transition.

The Ca2+-induced effect on VSD activation was quantified as the VH shift relative to 'zero' Ca2+ condition:Ā Ī”VH=VHĀ ([Ca2+]i)āˆ’VHĀ (0Ā [Ca2+]i). For wild-type (WT) BK channel and the RCK Ca2+-sensor mutants (D362A/D367A, M513I and 5D5A), the energetic contribution of Ca2+-binding on resting-active (R-A) equilibrium of the voltage sensor was calculated as changes in Gibbs free energy of VSD activation induced by 100 µM Ca2+:

ΔΔGVCa=FĀ (Ā zQĀ (100 μMĀ [Ca2+]i)Ā VHĀ (100 μMĀ [Ca2+]i)āˆ’Ā zQĀ (0Ā [Ca2+]i)Ā VHĀ (0Ā [Ca2+]i))

Model fitting

Request a detailed protocol

We fit the QC(V,Ca2+) experimental data using two distinct interaction mechanisms between Ca2+-binding sites and voltage sensor (see Scheme I and Scheme II in the Figure 3A-B) within the framework of Horrigan-Aldrich (HA) general allosteric model (Horrigan and Aldrich, 2002). Assumptions and considerations for the equations that describe each one of the Ca2+-VSD interaction schemes are given in the Appendix. In terms of the HA allosteric mechanisms, the voltage sensor R-A equilibrium is defined by the equilibrium constant JĀ according to the relation:

J=ezJF(Vāˆ’VH)RT=Ā J0ezJFVRT

where J0 is the zero voltage equilibrium constant and zJ the gating charge displacement per voltage sensor. Thus, the fraction of the total charge displaced essentially between closed states, QCV/QC, MAXĀ in the absence of calcium can be written as:

QC(V)/QC,Ā MAXĀ (Ca2+ ≪ KD)=11+Ā Jāˆ’1

where KD is the dissociation constant of the high-affinity calcium-binding site with all voltage sensors at rest and the channel closed. In the presence of saturating Ca2+ (100 µM), the equilibrium of the R-A transition J becomes amplified by the allosteric factor E, which defines the coupling between Ca2+-binding sites and voltage sensors, being

QC(V)/QC,Ā MAXĀ (Ca2+ ≫ KD)=11+Ā (JE)āˆ’1

and

JE= J0eRTln⁔(E)+zJFVRT

The QC(V)/QC,Ā MAX measured in the presence of high [Ca2+] and 'zero Ca2+' condition at the same voltage (so that JĀ be canceled out) but in the limit where (JE)-1≫1 is:

QC(V)/QC,Ā MAXĀ (Ca2+ ≫ KD)QC(V)/QC,Ā MAXĀ (Ca2+ ≪ KD)Ā (limJEāˆ’1≫1)Ā =Ā JEJĀ =Ā E

Thus, the Gibbs free energy perturbation of the voltage sensor R-A equilibrium when the high-affinity binding sites are approximately 100% occupied by Ca2+ (100 µM) is a straightforward measure of the allosteric factor:Ā E=eāˆ’Ī”Ī”GVCa/RT.

Based on these conditions, the values of the allosteric parameter EĀ were calculated and introduced in each of the two Ca2+-VSD interaction models as a fixed parameter. Once EĀ was obtained, the families of QC(V,Ca2+) curves were simultaneously fitted to Equation 4 and Equation 6 (see Appendix) and estimating theĀ zJ, J0Ā and KD parameters for each model by minimizing least-square values. To select the best Ca2+-VSD interaction scheme that describes the experimental data, the fits provided by each model were compared according to their Akaike Information Criterion (AIC) values (Akaike, 1974), calculated asĀ AICi=2pi-2ln⁔Li, where pi is the number of free parameters and ln⁔Li is the maximum log-likelihood of the modelĀ i. The best fit being the one that achieves the lowest AICi value. Minimum AICi (AICMIN) values were used as model selection criteria. Using the AICi weights (wi), we estimated the probability of model iĀ is the best model given the data and the set of candidate models. wiĀ are based on the relative likelihood of each tested model iĀ which is a function of the difference in AICi score and the best model:Ā Ī”AICi=AICiāˆ’AICMIN (Anderson and Burnham, 2002). From the Ī”AICi we obtained an estimate of the relative likelihood of modelĀ i (ā„’i) by the simple transform:Ā Li=expĀ (āˆ’12Ā Ī”AICi). wiĀ is calculated normalizing the ā„’i for each model:Ā wi= ā„’i/āˆ‘k=1Kā„’k, where KĀ is the number of candidate models.

The models for the Ca2+-VSD interaction schemes were extended including two high-affinity Ca2+-binding sites per α-subunit (Figure 3—figure supplement 1D-E). The contribution of each Ca2+-binding site to the free energy of the voltage sensor equilibrium may be split in two, such asĀ E=ES1āˆ—ES2=eāˆ’(ΔΔGVCa(S1)Ā + ΔΔGVCa(S2))/RT, where ES1 and ES2 are the allosteric factors EĀ for the RCK1 and RCK2 sites. Thus, for the global fit of the QC(V,Ca2+) curves, we constrained the allosteric parameter ES1 and ES2 obtained experimentally for the RCK2 Ca2+-sensor mutant (5D5A) and RCK1 Ca2+-sensor mutant (D362A/D367A), respectively, as described above. The rest of the parametersĀ zJ, J0, KD1, KD2, andĀ G, where KD1 and KD2 are the dissociation constants of the RCK1 and RCK2 sites and GĀ is a cooperativity factor between the two sites within the same α-subunit of the BK channel, were allowed to vary freely.

Appendix 1

Assumptions and model testing

We assumed that the four voltage sensors act independently, transiting between two states, resting (R) and active (A), governed by the voltage-dependent equilibrium constantĀ J. The R–A equilibrium is displaced toward the active state by membrane depolarization, generating a fast gating charge movement (QC) before channel opening. Additionally, the Ca2+-binding to high-affinity sites shifts the voltage sensor equilibrium toward its active configuration through an allosteric coupling described by the factor EĀ (Figure 3—figure supplement 1A). By assuming the simplified standard model for the BK channels (Horrigan and Aldrich, 2002), where each α-subunit has a single Ca2+-binding site, we established the possible states and their connections through which each voltage sensor transits in the presence of Ca2+ (Figure 3—figure supplement 1B–C) following the CTD-VSD interaction mechanisms described by Scheme I and II (Figure 3A–B).

For Scheme I, in which Ca2+-binding sites and voltage sensors interact within the same α-subunit, the activation of each VSD can occur through the R0-A0 or R1-A1 transitions according to the functional state of the Ca2+ site (unbound or Ca2+ bound). The equilibrium of such transitions is governed by JĀ andĀ JEM1, respectively (Figure 3—figure supplement 1B). In the case of Scheme II, in which binding of Ca2+ to a single α-subunit affects all four voltage sensors equally, the R-A equilibrium for each VSD would be affected by the number of Ca2+ bound in the channel (0-4) depicted in the model (Model II) as five possible R-A transitions. According to this model, the JĀ constant increase EM2-fold for each Ca2+ site occupied (Figure 3—figure supplement 1C). For both schemes, the horizontal transitions R-R and A-A represent the Ca2+-binding equilibrium (KĀ orĀ KE) when the VSD is in the resting and active conformation, respectively. The equilibrium constant KĀ is defined as the bound/unbound probability ratio for each Ca2+-binding site and depends on Ca2+ concentration ([Ca2+]) and the Ca2+ dissociation constant (KD):Ā K=Ca2+/KD.

Here, we assumed that the voltage sensor movement at ON-gating currents is in equilibrium relative with the binding of Ca2+. The assumption is reasonable since the Ca2+-binding rate constant estimated for BK channel is 1.8 x 10⁸ Māˆ’1sāˆ’1 (Hou et al., 2016) implying that at 10 µM internal Ca2+ the association time constant is 340 µs. Thus, Ca2+ binding at this Ca2+ concentration proceeds with a time constant about six-fold longer than does the movement of the voltage sensor (~60 μs). Based on this consideration, the R-A transitions in the models would be predominant transitions whose proportion would be determined by the [Ca2+] andĀ KD. Therefore, predictions of the QC(V) curves at different Ca2+ concentrations for Model I and Model II were based on a given fractional occupancy of Ca2+ sites established by the probability of Ca2+ bound b and unbound 1-b for each Ca2+-sensor, and the energetic contribution to VSD equilibrium.

Simulations of the QC(V) curves using the Scheme I (Model I) were obtained using the equation

(1) QC(V)QC,Ā MAX=(1āˆ’b)(11+Jāˆ’1)+b(11+(JEM1)āˆ’1);

where

(2) b=Ā 11+Kāˆ’1Ā =Ā 11+KD[Ca2+]Ā =Ā [Ca2+][Ca2+]+KD;

and

(3) J=J0ezJFVRT

Substituting bĀ and JĀ into Equation 1, the Ca2+-dependent voltage sensor activation for Model I is given by the equation

(4) QC(V)QC,Ā MAX=(KD[Ca2+]+KD)(11+eāˆ’zJFVRTJ0)+([Ca2+][Ca2+]+KD)(11+eāˆ’zJFVRTJ0EM1)Ā Ā Ā Ā Ā Ā 

Thus, the QCV curves are determined by the proportion of two functional VSD populations with a distinctive effect (unliganded effect or Ca2+-saturated effect). Consequently, the QCV curves are represented by a weighted sum of two Boltzmann functions.

Meanwhile, for the concerted CTD-VSD interaction Scheme II (Model II), the QC(V, Ca2+) curves would be determined using the general equation:

(5) QC(V)QC,Ā MAXĀ =Ā āˆ‘x=0n(nx)(1āˆ’b)nāˆ’xbx(11+(JEM2x)āˆ’1)

The expression in the first bracket represents the fraction of VSD belonging to a channel with xĀ (0 to 4) Ca2+ bound, according to a binomial probability distribution. Thus, the QCV curves result in a weighted sum of five distinct Boltzmann functions corresponding to the five possible R-A transitions (Figure 3—figure supplement 1C). By setting n=Ā 4 because the tetrameric symmetry of the channels, and substituting bĀ and JĀ into the previous equation (Equation 5) we have

(6) QC(V)QC,Ā MAX=āˆ‘x=04(4x)(KD[Ca2+]+KD)4āˆ’x([Ca2+][Ca2+]+KD)x(11+eāˆ’zJFVRTJ0EM2x)

It should be noted that at limiting Ca2+ conditions, both schemes become equivalent where the VSD activation is characterized by a single Boltzmann function. At zero Ca2+, the QCV curves are described by

QC(V)QC,Ā MAX=(11+eāˆ’zJFVRTJ0),

whereas Ca2+ saturating concentration JĀ is multiplied by the allosteric factorĀ E, where E=EM1=EM24Ā depending on the model (Model I or Model II):

QC(V)QC,Ā MAX=(11+eāˆ’zJFVRTJ0E)

Given that each α-subunit has two Ca2+-binding sites, we expanded the CTD-VSD interaction schemes (Figure 3—figure supplement 1C) considering the existence of two Ca2+-binding sites (Figure 3—figure supplement 1D-E). The Model I and II include the energetic contribution of RCK1 and RCK2 Ca2+-sites to the VSD activation. The factor E=ES1*ES2Ā where ES1 and ES1 are the allosteric coupling between the VSD and the RCK1 Ca2+-site and RCK2 Ca2+-site, respectively. The K1 and K2 constants define the bound/unbound transition for each RCK1 and RCK2 sites with K1=Ca2+/ KD1 andĀ K2=Ca2+/ KD2. Assuming that the Ca2+ sensors of distinct α-subunit do not interact, we only consider intrasubunit cooperativity between the RCK1 and RCK2 sites defined by the factorĀ G. Thus, the occupancy of one RCK site will affect Ca2+-binding equilibrium to the other RCK site in the α-subunit (GK1Ā andĀ GK2) (Figure 3—figure supplement 1E). Note that for Model II the equilibrium JĀ of the VSD increase ES1-fold and ES2-fold for each Ca2+ bound to the RCK1 and RCK2 sites, respectively, reaching JES14ES24Ā when the eight Ca2+ sites are occupied.

Data availability

All data generated or analysed during this study are included in the manuscript and supporting files.

References

Decision letter

  1. Richard Aldrich
    Senior and Reviewing Editor; The University of Texas at Austin, United States

In the interests of transparency, eLife includes the editorial decision letter and accompanying author responses. A lightly edited version of the letter sent to the authors after peer review is shown, indicating the most substantive concerns; minor comments are not usually included.

Thank you for submitting your article "Calcium-driven regulation of voltage-sensing domains in BK channels" for consideration by eLife. Your article has been reviewed by three peer reviewers, and the evaluation has been overseen by a Reviewing Editor and Richard Aldrich as the Senior Editor. The reviewers have opted to remain anonymous.

The reviewers have discussed the reviews with one another and the Reviewing Editor has drafted this decision to help you prepare a revised submission.

The reviewers are in agreement that this paper represents an important contribution pertinent to the issue of how ligand-binding in BK channels may couple to channel activation. There is consensus that the results mainly embodied in Figure 1 are important and perhaps appropriate for eLife. However, the reviews together raise multiple, substantive points that can largely be broken into two categories. First, there are aspects of the data and analysis which require further elaboration. Second, to the extent the results challenge previous results, a rigorous, scholarly assessment of potential reasons for differences between the present results and those of Horrigan and Aldrich is required.

Regarding the first point, details are given in the reviewers' comments, perhaps most clearly from reviewer #1, but all reviewers are in agreement on these issues. Here, some of the major concerns are summarized. The individual reviews elaborate on several important major issues. They are included below.

1) It would be helpful to elaborate more clearly on how QC is determined, perhaps with examples, particularly at high Ca2+. The concern is that QC may not be adequately distinguished from QSS, which is known to shift substantially with increases in Ca2+. In this regard, it would also be valuable to have examples of the time course of current activation under identical conditions of higher Ca2+ to provide assurance that QC is not being affected by channel opening. These concerns are extensively developed particularly in the comments from reviewer #1.

2) All reviewers note the apparent reduction in gating current amplitude at higher Ca2+. Although this may have a trivial explanation, some comment on this point should be provided. What was the time between each test step in the overall gating current protocol at a given Ca2+? Is QC,MAX changing with Ca2+? Does QOFF=QON, as expected? Is each example in Figure 1A from a separate patch?

3) The shift in the QC /V relationship might also be expected to be associated with changes in kinetics, but this analysis was not done.

4) The attempt to test various models by which Ca2+ binding might be coupled to effects on the voltage-sensor equilibrium focus on models with one Ca2+ binding site per subunit. Although the 4 Ca2+ site formulation appears to provide an ability to discriminate between Model I and II, it seems likely that an 8 site formulation might not discriminate as well between the two categories of model. As such, the conclusions from the considerations in Figure 2 and 3 seem less strongly based than one would like.

5) There are various details in the results which are not mentioned. Why in some patches is there a non-zero offset during the gating current measurement? Was this dependent on Ca2+?

Finally, although the conclusions are not qualitatively novel and interaction between Ca binding and VSD activation has previously been incorporated in the HA model, the conclusion that the interaction is "strong" rather "weak" is an important distinction and its implications e.g. for the HA model are incompletely explored. For example, if QC(V) is greatly shifted without a corresponding change in kinetics, then it suggests voltage-sensor activation cannot be described by a 2-state model. If the QC(V) relation is strongly shifted by Ca but QO-V is not then then VSD/Gate coupling (D) must be Ca-dependent (since D is defined by the difference between QC and QO). Horrigan and Aldrich concluded that QO is not very Ca-dependent because the limiting slope of the Po-V relation (i.e. QA-V) is only slightly shifted by Ca. We believe this is a result that has been essentially replicated by other labs. So trying to reconcile a large Ca-dependent shift in QC(V) with previous data about the Ca-dependence of Po would likely require fundamental changes in mechanistic assumptions that are not addressed.

Regarding the assessment of the implications of the present results in comparison to Horrigan and Aldrich, it is not sufficient to simply claim the issue is resolved since the present results confirm earlier results from this same lab. That is ignoring the issue. Some assessment of whether there might be technical or analytical differences in each study would be minimally required. Taking both sets of results at face value, it would be helpful to provide readers with an objective comparison of the similarities and differences in what each group was measuring and how the gating current was determined. Although it may seem an unlikely explanation, there is also species difference and a difference in expression system. Although hSlo1 and mSlo1 are almost identical, there are unusual cases where single residue differences account for profound species differences. That can probably be discounted here, but it wouldn't hurt to mention it. Overall, the idea that there is some interaction between the cytosolic domain and the voltage sensor is not a new idea, but the question is the extent of the coupling. It should be kept in mind that, although the Aplysia structures have focused attention on this topic, the liganded aSlo1 structure included both high Mg and high Ca, and it is not unexpected that in the presence of Mg some interaction between the CTD and VSD would be observed. But structural information has not yet revealed that Ca alone may stabilize linkages between the cytosolic domain and the voltage-sensor.

Overall, it is anticipated that the issues above can largely be addressed without new experiments, and it is hoped that some of the requested analysis may already be available. The reviewers feel that the observations in this paper are of merit, although currently difficult to interpret mechanistically. It is hoped that the requested changes will place this work on a stronger foundation that will help guide future work.

Reviewer #1:

This study examines the functional interaction between Calcium binding and voltage-sensor activation in BK channels, by measuring gating current at different [Ca2+] in the presence and absence of Ca2+ binding site mutations in RCK1 or RCK2 domains. The subject is timely given recent structural evidence that interactions between the cytoplasmic and voltage-sensor domains of Slo1 are modulated by Ca binding, and speculation that such interaction could make important contributions to Ca-dependent activation. Indeed, the authors conclude that direct interaction between Ca binding and voltage-sensor activation is strong, producing a ~26-fold increase in the equilibrium constant for voltage-sensor activation in saturating Ca2+. In addition, they find that Ca-binding to RCK1 and RCK2 make comparable and independent contributions to voltage sensor activation, and that the binding of Ca2+ to one subunit or site alters activation of all 4 voltage-sensors in a concerted manner. These conclusions have potentially important implication for understanding of BK channel gating mechanisms, with the caveat that some conclusions also appear to contradict previous studies making it more difficult to assess their significance.

The manuscript is generally well written, and the data are clearly described and appear to be of high quality. However, I think some additional analysis may be needed to help clarify differences between these and previous gating current results, and to better define the extent to which the data can discriminate between various models of interaction between Ca2+ binding sites and voltage sensors.

1) Charge movement equilibria and kinetics:

The authors find that saturating Ca produces a -143 mV QC(V) shift, similar to a previous report from the same lab (Carrasquel-Ursulaez et al., 2015), but much larger than that reported by Horrigan and Aldrich (2002). Since there is no obvious explanation for these contradictory findings, the claim that "this result resolves a previous debate regarding the magnitude of the Ca2+-driven shift…" does not appear reasonable. While I am not certain what criteria could resolve such a debate, for the authors' merely to replicate their previous findings does not seem sufficient in the absence of a clear source of error. Perhaps the best that can be done at this stage is to provide a detailed description of the data and analysis so that the results of the two groups can be adequately compared. Therefore, I think it is important to see a more complete description of the gating current kinetics including their voltage-dependence. One reason is simply that QC is estimated by fitting the ON current with an exponential function. Thus, it is conceivable that the kinetic analysis could contribute to differences in QC; and it would therefore be helpful to see examples of fits used to determine QC in the presence and absence of Ca2+. It also would be interesting to know whether a slow component of ON current and a slow increase in OFF charge with pulse duration (Qp) are observed in saturating Ca2+. Horrigan and Aldrich reported a large difference between QC(V) and the steady state Q-V relationship (QSS-V) in 70 μm Ca and prominent slow components of ON current and Qp (when measured at voltages near VH), consistent with a transition between QC and QSS when channels open. In the present study, however, if QC(V) is strongly shifted by Ca2+ then one might expect less difference between QC and QSS and little or no slow components of ON current and Qp. Another expectation is that if Ca produces a large QC(V) shift then it should also produce large changes in the time constant of fast charge movement (Ļ„fast). Therefore, it would be helpful to compare Ļ„fast(V) relations in the presence and absence of Ca. Horrigan and Aldrich observed a small Ca-dependent shift in the Ļ„fast(V) curves, comparable to that of QC(V), mainly due to an ~2-fold slowing of OFF charge movement. Surprisingly, the present study also describes small changes in kinetics including little effect of Ca on ON kinetics and a 2.5-fold slowing of the fast component of OFF kinetics in 10 μm Ca at -90 mV (Figure 2—figure supplement 1). How can these effects be reconciled with the propose 26-fold change in equilibrium constant? Do the shapes of the Ļ„fast(V) curves provide any clues? Addressing these questions would help support the conclusions and gating models.

2) Gating Models:

Whether Ca binding to one subunit promotes activation of a single voltage sensor (Scheme I) or all 4 voltage-sensors through a concerted mechanism (Scheme II) is tested by comparing the ability of the corresponding gating schemes to fit QC(V) curves in different Ca. Importantly QC(V) curves shift with little change in shape. Therefore, Scheme I, which predicts a double-Boltzmann QC(V) at intermediate Ca is qualitatively inconsistent with the data while Scheme II, which predicts a sum of 5 Boltzmanns, can better account for the shape of the curves. However, I don't think this is an adequate test of the two mechanisms. Both models incorporate a single Ca site per subunit, inconsistent with the conclusion from Figure 4 that both sites contribute equally to voltage sensor activation. An extended version of scheme I with 2 binding sites would predict QC(V) curves that are essentially a sum of 3 Boltzmann functions and should therefore better fit the data. The question that should be addressed is whether the data can discriminate between versions of Schemes I and II with two binding sites per subunit.

A related issue that should be clarified is the criteria used to discriminate between fits. The authors indicate that "The best model fitting is that achieving the lowest AIC values". However, they conclude that the extended version of Scheme II "does not produce better fits to š‘„C(š‘‰, [Ca2+]) according to the AIC criteria" – even though the extended version appears to produce lower AIC values (Table 2) than the original version (Table 1). Presumably this is considered an insignificant difference. But there is no explanation of how to determine what is a significant difference.

3) Modeling assumptions:

As I understand it, the equations (4 and 6) describing the QC(V) relations for Schemes I and II are based on the assumption that channels equilibrate between Ca-bound states while the channel is closed and voltage sensors are not activated – and that this distribution is not altered when gating current is measured because Ca binding is slower than voltage-sensor activation. While I agree that this is probably a reasonable assumption, I have some concern that it might not be. The authors argue "the Ca2+-binding rate constant estimated for BK channel is about 108 M-1s-1(Hou et al., 2016) implying that at 10 μM internal Ca2+ the association time constant is 1 ms. Thus, Ca2+ binding at this Ca2+ concentration proceeds at a pace about 33-fold slower than the voltage sensor movement (~30 μs)." I think this is an oversimplification and not accurate. First, the time-constant for Ca equilibration is also going to depend on the dissociation rate (~1560 s-1 for the low affinity site). Second, in the case of Scheme II, where subunits cannot be treated independently, the forward rate constant between Ca bound states is not simply equal to the association rate for a single binding site (1000 s-1) – e.g. it would be 4000 s-1 for the transition from zero to one Ca bound. So taken together, I think Ca-equilibration may only be ~4-5 slower than voltage-sensor movement. Is that enough of a difference?

Reviewer #2:

This manuscript shows a tour de force measurement of voltage dependence of gating charge movement (Q-V) during BK channel activation at various Ca concentrations ([Ca]). The large shift of the Q-V relation (-150 mV) in response to [Ca] increase from 0 to saturation (100 µM) suggests that Ca binding to the cytosolic gating ring alters voltage sensor activation. The authors conclude that the binding of Ca in each of the four subunits alters voltage sensor activation in all four subunits by fitting Q-V relations to different models. Mutational ablation of either of the two high affinity Ca2+ binding sites in each subunit reduces Ca2+ dependent shift of the Q-V relation by ~50%, suggesting that Ca2+ binding to either site contributes an equal amount of free energy in affecting voltage sensor activation. The authors made some conclusions based on these striking data, which are discussed as follows.

1) Results section: "In this manner, we determine only the gating charge displaced before the BK channel opening." This statement could be supported by showing ionic currents along with gating currents at the same voltages. The comparison in high [Ca] (≄10 µM) would be particularly helpful.

2) Figure 1 seems to show that as [Ca] increases the size of gating currents becomes smaller. Does this suggest that the total amount of fast charge movement diminishes at high [Ca]? What is the reason for this phenomenon and how is this related to the Ca-dependent shift of Q-V?

3) The authors interpret their data based on the Horrigan and Aldrich (HA) allosteric model of voltage and Ca2+ dependent activation, despite a larger Q-V shift in response to [Ca] increase is observed than that by HA. As the authors point out, while this study suggests that Ca2+ binding to either of the RCK1 site or Ca Bowl affects VSD equally, previous studies showed that Ca2+ binding only to the RCK1 site affects voltage dependence of ionic currents (G-V). Do these differences in experimental observation suggest any novel mechanism of BK channel gating that requires a modification of the HA model? In fact, although the authors suggest that HA Model II in Figure 2 fits their data better than HA Model I, it seems that neither model fits the data well (Figure 3).

4) Ca binding in one subunit equally affects all subunits, which suggests an allosteric interaction between Ca2+ binding and voltage sensor activation. It is not clear if Ca binding in one subunit alters all 4 cytosolic domains such that the entire gating ring interacts with all 4 VSD, or Ca binding in one subunit alters one VSD, which in turn affects all three other VSD's. There is also no evidence to distinguish if such an allosteric mechanism for Ca2+ binding to affect VSD activation is mediated by the covalent pulling of the C-linker or non-covalent interaction between the top of CTD and the bottom of VSD. Although based on previously published cryo-EM structures the authors favor the mechanism of the non-covalent VSD-CTD interactions, the present data seems not sufficient to exclude the contribution by the other mechanism.

Reviewer #3:

This is an important paper that addresses the issue of how Ca2+ binding to the cytosolic gating ring structure of BK channels allosterically couples to the voltage-sensor domains of BK channels, thereby ultimately influencing channel activation. One of the earlier papers on this topic (Horrigan and Aldrich, 2002) presented evidence that Ca2+ binding had only weak effects on voltage sensor equilibrium. More recent work has suggest that this may not be the case, and structures of the Aplysia Slo1 channel have supported the idea that there may be important links between the cytosolic domain and the voltage-sensors. Here, the authors present compelling evidence that Ca-binding to the cytosolic domain does allosterically influence VSD equilibrium and, furthermore, that each of the two Ca binding sites on a single BK α subunit independently, and largely additively, influence the VSD equilibrium.

The authors undertake an analysis of a potential mechanism explaining their data and reveal that occupancy of any binding site allosterically influences the VSD equilibrium of all subunits (their Scheme II), rather than only a single associated VSD (Scheme I). This requires that binding to any individual site exerts some concerted effect through all four VSDs.

Overall, the manuscript is clearly written and the data and analyses are solid. There are a few places that some clarifications in language are required. Also, a potential alternative conception of how 0-4 Ca2+ (actually, 0-8) may incrementally influence VSD equilibrium is mentioned, which the authors might want to consider.

[Editors' note: further revisions were requested prior to acceptance, as described below.]

Thank you for resubmitting your work entitled "Calcium-driven regulation of voltage-sensing domains in BK channels" for further consideration at eLife. Your revised article has been favorably evaluated by Richard Aldrich (Senior Editor), a Reviewing Editor, and three reviewers.

The manuscript has been improved but there are some remaining issues that need to be addressed before acceptance, as outlined below:

Details regarding the remaining concerns were initially developed in the comments from reviewer #1, but all reviewers were in agreement that, if these concerns are addressed, it will greatly improve the paper and provide a better framework for evaluating the implications of the present work without the context of earlier work. As a general comment, several of the arguments developed in the responses to the initial reviews would be useful in clarifying for readers what was done in this paper, and the rationale for various inferences (point 4 below). In particular, both figures that were included in the response to reviewers would be valuable additions as supplementary figures. Similarly, although the new manuscript includes the analysis from the two-high-affinity binding site model in Table 1, readers may find it odd that fits from these models are not included on main figures (or at least in figure supplements) in the paper. In particular, as reviewer #1 notes, although Table 1 supports the view that Model II does better than Model I, even for the two Ca site formulation, visually comparing these in fits to the Q-V and VH-Ca curves would give us a better feel for how well the data may discriminate between Model I and Model II (point 2 below). We therefore recommend including comparisons of fits on relevant panels, either in the main figures or, if that seems too cluttered, perhaps in supplementary figures.

There are four main categories of concern/recommendations corresponding to the itemization of reviewer #1.

1) Although the new information regarding gating current decay time constants is a valuable addition to the paper, there are aspects of this data that maintain the concern that Ca-equilibration with subunits with active voltage sensors may impact on the gating current decay time course, particularly at intermediate Ca. In particularly, the separation of calculated Ca equilibration rates and the observed time constants may not be as distinct as one might like. This might potentially impact the steepness of the VH-Ca relationship. I would recommend that the figure included in the rebuttal that plots the zāˆ‚ and residuals as a function of ratio of Ļ„Ca binding/Ļ„gating currents be made into a supplementary figure, but with the addition that the analysis be done both using the first 30 μs and also the first 100 μs for comparison. Reviewer #1 also includes an additional suggestion for such a figure. Please also check whether the discontinuity in the plot of residuals observed at Ļ„ ratios of about 4 and 5 is a feature of the simulation or something else. Such a discontinuity seems a bit odd for a simulated data.

Also pertinent to this issue, two reviewers point out that the example gating current decay time constants from the new Figure 1A and 1B may not be fully consistent with the averaged data in Figure 1C. E.g., the time constant in 1B is above 0.8 of that in 1A, while at +160 mV in 1C, the time constants at 100 μM are about 0.5 that at 0 μM.

2) Showing the fits to the two Ca binding site formulation needs to be included, as mentioned above. Even if Model I and Model II give fits that extensively overlap, it is useful to know this. Similarly, a comparison of how much different the fits are with single site and two site Ca binding formulations would be helpful.

3) There appear to be some discrepancies in the properties of OFF gating current time constants that need to be addressed.

4) As stated at the outset, there is information in the response to reviewers that should be included in the manuscript to help guide readers.

Overall, all of these issues can presumably be addressed without new experiments. We hope the authors will agree that these recommendations will strengthen an interesting paper and better help the intended audience place this work within the context of previous work on BK channel gating.

Reviewer #1:

The authors' response and modifications to the manuscript are helpful and address many of my questions. However, there are still some issues that require clarification.

1) Appendix, subsection ā€œAssumptions and model predictionsā€, third paragraph: "Ca2+ binding at this Ca2+ concentration proceeds at a pace about 33-fold slower than the voltage sensor movement (~30 μs)."

The new kinetic data (Figure 1C) indicates that the gating current time constant is actually as slow as 75 μs near VH (i.e. slower than 0 Ca). That, and the simulated effect of Ca-binding kinetics in response to my previous review, have increased concerns about the assumption that Ca binding does not re-equilibrate during gating current measurements at intermediate [Ca], and I think this issue requires some additional analysis. This assumption is critical for modeling the Ca-dependence of the Q-V data and distinguishing between Schemes I and II. The simulation indicates that if Ca binding can re-equilibrate, then Q-Vs predicted by Scheme I will become more Boltzmann-like, potentially making it more difficult to distinguish Schemes I and II. In addition, I wonder if re-equilibration could contribute to the remarkable steepness of the VH-Ca relation between 5 and 10 μm Ca – a feature that is not well described by any of the models. That is, re-equilibration should increase the VH shift (since voltage-sensor activation will enhance Ca-binding) and if Ca re-equilibration is faster at higher [Ca] then it would tend to increase the steepness of the curve

The 75 μs gating current time constant in Figure 1C increases my concern because it is potentially closer to the time constant of Ca binding. For example, at the [Ca] used in the simulation (15 μM), the on-rate at a single binding site would be 1500 s-1, or 6000 s-1 for the transition from zero to one Ca bound with 4 binding sites, implying a time constant less than 166 μs (depending on off-rate). Thus, it seems possible that Ca-binding could be only ~2 fold slower than voltage sensor activation under some conditions. The simulation seems to suggest this is probably not a problem since there is little change in the Q-V fit parameters when the Ca-binding time constant is 3-fold or more slower than gating current. However, I have two concerns about the simulation analysis: (1) the Q-Vs were measured by fitting the first 30 μs of the simulated gating current, whereas the experimental data were measured from the first 100 μs. This could lead the simulation to underestimate the potential contribution of Ca re-equilibration to the data. (2) It doesn't seem reasonable to fit the simulated Q-Vs with a single Boltzmann function if the assumption to be tested (no re-equilibration) predicts a double-Boltzmann Q-V. In other words, although the simulation shows little change in the Q-V fit parameters when the Ca-binding time constant is 3-fold or more slower than gating current, I wonder if this indicates that there is no change in the Q-V over this range, or merely that the fits to a single Boltzmann function are all equally bad. I think the simulation analysis should be repeated by fitting the initial 100 μs of the gating current, and fitting the resulting Q-Vs to the prediction when there is no re-equilibration of Ca (i.e. double Boltzmann). Presumably, such fits, or showing the actual Q-Vs, would better define the conditions under which the model assumptions are valid. Plotting VH might also be useful.

2) Although I accept the conclusion, based on Table 1, that Scheme II fits the data better than Scheme I even with 2 binding sites per subunit, I think it would be good to show the fits for the 2-site models, at least in the supplement. One reason, as I suggested in my initial review, is that I don't think it is reasonable to dismiss Scheme I based on the qualitative difference in Q-V shape for a one-site model, when such a model is model is inconsistent with the data in Figure 5. That is simply a "straw man" argument. But, mainly, as noted by another reviewer, none of the models fit very well, suggesting neither Schemes are the final answer. In such a situation, I think it is important to show the fits for future reference.

3) The authors partially addressed my question about gating current kinetics with Figure 1C. The time constants for the ON currents do appear to shift along the voltage-axis in response to Ca, consistent with the Q-V. But they didn't address my question regarding the relatively small 2.5-fold Ca-dependent change in OFF kinetics in Figure 2—figure supplement 1. The authors suggest, based on Figure 1C that the main effect Ca is to slow OFF kinetics, but Figure 2—figure supplement 1 isn't consistent with that prediction. Presumably if ON time constants are decreased ~2-fold by Ca then OFF time constants should increase ~10 fold to account for the large E-factor. Are the data representative? Can OFF kinetics included in the time constant plot?

4) Finally, many of the responses to reviewers are fine, but should be incorporated in the manuscript. Requests for clarification generally refer to issues that need to be better explained not only to the reviewers but also to the intended audience of the paper. For example, when I requested clarification in the Materials and methods section regarding the grounding scheme, I meant that such details should be included in the Materials and methods section. Similarly, the author's clarification that representative traces in Figure 2A are from different patches with the exception of 0 and 100 Ca is helpful, but should be described in the figure legend.

Reviewer #2:

The revised manuscript is improved, and all my questions are addressed.

Reviewer #3:

The authors have responded in generally satisfactory fashion to many of the major issues raised by the reviewer. The includes the kinetics of QCactivation, how QCwas measured, the apparent Ca2+-dependence of gating current amplitude, the impact of including 2 types of Ca2+ binding sites in the model fitting, and a more balanced consideration of how the present results fit with previous work.

The manuscript and new changes still suffer from abundant English usage errors, including some where the meaning of the phrasing is not clear.

The new Figure 1 nicely addresses the issue of what is actually being measured and whether the QCmeasurements might include contamination from later voltage sensor movements. Furthermore, the figure address the topic of the Ca2+ dependent of QCkinetics. There is one issue that persists in this data. The time constant in 1A (0 Ca2+) is 52 μs, while in 1B (100 μM) it is 42 μs, both at +160 mV. Examination of the averaged data in panel C show that at +160 mV, μIG-ON is a bit larger than 0.06 ms for 0 Ca2+, generally consistent with the trace in 1A, while for 100 μM it appears to be a little above 0.025 ms. The values for the displayed example at 100 μM seems to be well outside the error bars, than one might expect. Perhaps something needs to be checked here.

[Editors' note: further revisions were requested prior to acceptance, as described below

Thank you for resubmitting your work entitled "Calcium-driven regulation of voltage-sensing domains in BK channels" for further consideration at eLife. Your revised article has been favorably evaluated by Richard Aldrich (Senior Editor), a Reviewing Editor, and three reviewers.

The manuscript has been improved but there a few remaining issues that need to be addressed before acceptance, as outlined below:

Please address reviewer #1's concerns about the off gating charge and correct the minor language issues. I believe that these will be easy for you to address.

Reviewer #1:

The revised manuscript is improved and adequately addresses most of my concerns. However, the authors expressed some confusion over my questions regarding the apparent discrepancy in OFF gating current kinetics, which I will attempt to clarify.

"We are somewhat confused about the reviewer 1 comment 3. As stated in Results the šœšŗāˆ’š‘‚š‘(š‘‰) curves were fitted to a two-state model (šœ(š‘‰)=1/(š›¼(š‘‰)+š›½(š‘‰)) where the forward (š›¼) and backward (š›½) rate constants represent the resting-active (R-A) transitions of the voltage sensors determining the equilibrium constant of the VSD activation (š½(š‘‰)=š›¼(š‘‰)š›½(š‘‰)). Our statement that the main effect of Ca2+ is to slow down the OFF kinetics is based on the determination of š›¼(š‘‰) and š›½(š‘‰) using the values of šœš¼šŗāˆ’š‘‚š‘(š‘‰) and J(V). This calculation indicates that š›½(š‘‰) increase 10.9-fold when the Ca2+ concentration is increased to 100 μM (see legend in Figure 1), in a reasonable agreement with the large allosteric factor E. It is unclear to us why the reviewer is referring to Figure 2—figure supplement 1, a figure that is not directly comparable to Figure 1C."

My questions about gating current kinetics (Comments #3 in previous review, #1 in original review) relate in large part to the data in Figure 2—figure supplement 1. I asked whether the difference in gating current kinetics shown for 0 and 10 μm Ca in Figure 2—figure supplement 1 are consistent with a large Q-V shift (as observed in 10 Ca). In particular, I noted that there is a relatively small change from 0 to 10 Ca in the time constant of the fast component of OFF current at -90 mV, which doesn't seem compatible with a large Q-V shift. The fast OFF component at -90 mV should be a relatively direct measure of the backward rate β (i.e. Ļ„~=1/β). If there is a small change in ON kinetics and large Q-V shift, then there should be a large change in β and hence OFF kinetics. The authors make essentially the same prediction based on their fits to the ON kinetics in Figure 1C. But they do not include OFF data to directly confirm the prediction or address my concern.

"We would like to include the OFF time constant plot requested by the reviewer, but these kind of experiments are in extremely difficult to do at high Ca2+,.…"

I do not think that measurements of OFF kinetics at multiple voltages are necessary. Measurements at a single voltage like -90 mV should suffice. If OFF kinetics have not or cannot be measured at 100 Ca, then I suggest adding the ON kinetics at 10 Ca to Figure 1C together with OFF data at -90 mV for 0 and 10 Ca. Based on Figure 2—figure supplement 1, such data already exists.

Reviewer #2:

The authors took the suggestions of the last review and the revised manuscript includes more complete data and balanced description. I have no further comments.

Reviewer #3:

Overall, the authors have addressed most or all of the issues that have been raised in previous reviews. It is still unclear why the results here differ from those of Horrigan and Aldrich, but the present paper now thoroughly documents the results, and provides more detailed consideration of the assumptions and analysis that lead the authors to their conclusions. Furthermore, the paper now addresses the unresolved issues in a generally more scholarly fashion. Although questions remain, this paper provides a valuable contribution to the issue of CTD-VSD coupling in BK channels.

https://doi.org/10.7554/eLife.44934.017

Author response

Reviewer #1:

[…]

1) Charge movement equilibria and kinetics:

The authors find that saturating Ca produces a -143 mV QC(V) shift, similar to a previous report from the same lab (Carrasquel-Ursulaez et al., 2015), but much larger than that reported by Horrigan and Aldrich, 2002. Since there is no obvious explanation for these contradictory findings, the claim that "this result resolves a previous debate regarding the magnitude of the Ca2+-driven shift…" does not appear reasonable. While I am not certain what criteria could resolve such a debate, for the authors' merely to replicate their previous findings does not seem sufficient in the absence of a clear source of error. Perhaps the best that can be done at this stage is to provide a detailed description of the data and analysis so that the results of the two groups can be adequately compared. Therefore, I think it is important to see a more complete description of the gating current kinetics including their voltage-dependence. One reason is simply that QC is estimated by fitting the ON current with an exponential function. Thus, it is conceivable that the kinetic analysis could contribute to differences in QC; and it would therefore be helpful to see examples of fits used to determine QC in the presence and absence of Ca2+.

During the last Biophysical Meeting, one of us (RL) has the opportunity to discuss at length with Frank Horrigan the possible reasons regarding the discrepancies between the HA 2002 results and ours. There are two differences between the experimental procedures followed by HA 2002 and ours. First, HA used the mouse BK clone, and we worked with the human BK; and second, the expression systems are different. HEK transfected cells in the case of HA and RNA injection into Xenopus oocytes in our case. Since the mBK share a high degree of identity (96%), it is difficult to reconcile the differences in Ca2+ binding and voltage sensor coupling based in the fact that we used to different BK clones. The possibility that the strength of coupling is different in different expression systems (e.g., differential modulation) is a possibility, however, outside the scope of the present communication. Taking the advice of the Senior Editor, we have added a paragraph in the Discussion indicating the possible sources of the differences between the HA 2002 results and the results presented here.

We are now stressing the point that although we cannot give a plausible explanation to these differences, the data presented in this paper were analyzed in deep and showed no hints of possible artifacts that can obscure their interpretation.

Below, we would like to convince reviewer #1 by giving a detailed analysis of our results that indeed we are estimating only the gating charge displaced between closed states (QC).

As requested by reviewer #1, in Figure 1A-B we now show that both in the absence and in the presence of 100 µM Ca2+ the macroscopic K+ currents activate with a delay that is approximately 160 µs and 84 µs, respectively. In our experiments, we have isolated the gating charge corresponding to voltage sensor activation while BK channels are closed (QC) by fitting the first 100 µs with an exponential function. We argue that since during that period the channels are closed regardless of the internal Ca2+ concentration, we are determining the direct interaction between Ca2+ binding and the voltage sensor.

It also would be interesting to know whether a slow component of ON current and a slow increase in OFF charge with pulse duration (Qp) are observed in saturating Ca2+. Horrigan and Aldrich reported a large difference between QC(V) and the steady state Q-V relationship (QSS-V) in 70 μm Ca and prominent slow components of ON current and Qp (when measured at voltages near VH), consistent with a transition between QC and QSS when channels open. In the present study, however, if QC(V) is strongly shifted by Ca2+ then one might expect less difference between QC and QSS and little or no slow components of ON current and Qp.

We agree with the reviewer, and our data fulfil their prediction. As can be appreciated in the new Figure 1B there is no appreciable slow component in IG-ON at high internal Ca2+ concentration. However, Figure 1B shows that after one ms with the voltage held at 160 mV about 80% of the BK channels are open and as shown in Figure 2A the OFF gating current recorded at -90mV are slowed considerably in agreement with the prediction of the allosteric model in which the OFF response should exhibit a time course similar to that of the time constant of the channel deactivation process. In the Figure 2—figure supplement 2 we compared QC and QOFF at low and high internal Ca2+. Since the OFF gating charge cannot be well estimated from the OFF gating current recorded at -90mV, we obtained two experiments at 100 µM internal Ca2+ concentration and recorded the OFF gating current at -150mV and -200mV. As expected from the large shift to the left along the voltage axis of QC at saturating internal Ca2+ concentrations, there is no difference between these two curves measuring the OFF gating current 2 ms after the onset of the voltage pulse.

Another expectation is that if Ca produces a large QC(V) shift then it should also produce large changes in the time constant of fast charge movement (Ļ„fast). Therefore, it would be helpful to compare Ļ„fast(V) relations in the presence and absence of Ca. Horrigan and Aldrich observed a small Ca-dependent shift in the Ļ„fast(V) curves, comparable to that of QC(V), mainly due to an ~2-fold slowing of OFF charge movement. Surprisingly, the present study also describes small changes in kinetics including little effect of Ca on ON kinetics and a 2.5-fold slowing of the fast component of OFF kinetics in 10 μm Ca at -90 mV (Figure 2—figure supplement 1). How can these effects be reconciled with the propose 26-fold change in equilibrium constant? Do the shapes of the Ļ„fast(V) curves provide any clues? Addressing these questions would help support the conclusions and gating models.

The fast time constants together with their respective QC(V) curves are now plotted in Figure 1C. Note that the τfast(V) curve at high Ca2+ concentration is leftward shifted and it maximum coincides with the half voltage of the Q(V) as expected from a two-state model describing the resting-active equilibrium of the voltage sensor.

2) Gating Models:

Whether Ca binding to one subunit promotes activation of a single voltage sensor (Scheme I) or all 4 voltage-sensors through a concerted mechanism (Scheme II) is tested by comparing the ability of the corresponding gating schemes to fit QC(V) curves in different Ca. Importantly QC(V) curves shift with little change in shape. Therefore, Scheme I, which predicts a double-Boltzmann QC(V) at intermediate Ca is qualitatively inconsistent with the data while Scheme II, which predicts a sum of 5 Boltzmanns, can better account for the shape of the curves. However, I don't think this is an adequate test of the two mechanisms. Both models incorporate a single Ca site per subunit, inconsistent with the conclusion from Figure 4 that both sites contribute equally to voltage sensor activation. An extended version of scheme I with 2 binding sites would predict QC(V) curves that are essentially a sum of 3 Boltzmann functions and should therefore better fit the data. The question that should be addressed is whether the data can discriminate between versions of Schemes I and II with two binding sites per subunit.

To answer this query, we have now included both types of models with one Ca2+ per subunit and two Ca2+ per subunit in Table 1. As the reviewer can appreciate the likelihood of Model II (one Ca2+ affects all voltage sensors) is always orders of magnitude larger (see values of ā„’i and wi) than that of the Model I. We conclude that the data can discriminate between versions of Models I and II with two binding sites per subunit.

A related issue that should be clarified is the criteria used to discriminate between fits. The authors indicate that "The best model fitting is that achieving the lowest AIC values". However, they conclude that the extended version of Scheme II "does not produce better fits to š‘„C(š‘‰, [Ca2+]) according to the AIC criteria" – even though the extended version appears to produce lower AIC values (Table 2) than the original version (Table 1). Presumably this is considered an insignificant difference. But there is no explanation of how to determine what is a significant difference.

The data of the new Table 1 shows that the Model II with two Ca2+-sites per subunit with or without cooperativity is slightly better than Model II with one Ca2+-site per subunit. However, we think that this difference is nor statistically significant.

3) Modeling assumptions:

As I understand it, the equations (4 and 6) describing the QC(V) relations for Schemes I and II are based on the assumption that channels equilibrate between Ca-bound states while the channel is closed and voltage sensors are not activated – and that this distribution is not altered when gating current is measured because Ca binding is slower than voltage-sensor activation. While I agree that this is probably a reasonable assumption, I have some concern that it might not be. The authors argue "the Ca2+-binding rate constant estimated for BK channel is about 108 M-1s-1 (Hou et al., 2016) implying that at 10 μM internal Ca2+ the association time constant is 1 ms. Thus, Ca2+ binding at this Ca2+ concentration proceeds at a pace about 33-fold slower than the voltage sensor movement (~30 μs)." I think this is an oversimplification and not accurate. First, the time-constant for Ca equilibration is also going to depend on the dissociation rate (~1560 s-1 for the low affinity site). Second, in the case of Scheme II, where subunits cannot be treated independently, the forward rate constant between Ca bound states is not simply equal to the association rate for a single binding site (1000 s-1) – e.g. it would be 4000 s-1 for the transition from zero to one Ca bound. So taken together, I think Ca-equilibration may only be ~4-5 slower than voltage-sensor movement. Is that enough of a difference?

Yes, calcium binding time constant 4-5 times slower than the gating current time constant is slow enough to consider that calcium binding equilibrium does not change during the time the gating currents are measured (see Author response image 1). To answer this question, we performed simulations of the gating currents using the model that assumes that Ca2+-binding sites and voltage sensors can only interact within the same subunit. The results shown in Author response image 1 indicates that the calcium binding is slow enough to safely assume that the calcium equilibrium is not altered during the short time it takes to measure the gating currents. The figure shows that if we assume that Ca2+ only affects the voltage sensor of the same subunit, we would have expected a measurable change in the Q(V) curve slope (zΓ) something that is not detected experimentally.

Author response image 1
Boltzmann sigmoidal curve fits of the Q(V) curves simulated for a BK model where the occupancy of the calcium binding site of one subunit alters the voltage sensor of only the same subunit.

Using the on binding rate constant of Hou et al., 2016 kb = 1.81ā‹…108 M-1s-1 and the unbinding rate constant ku = 650 s-1, calculated from the calcium dissociation constant of 3.6ā‹…10-6. We fitted the simulated the gating current at 15 μM Ca2+ to a single exponential using the first 30 μs of the gating current decay. Q(V) data obtained by integration of the area under the exponential function were fitted using a Boltzmann function. The sum of squared residual indicates that the fit is good for the calcium-binding time constant one hundred times shorter than gating current time constant. Also, we recover the zd value (0.58) we used for the simulation, only when the Ca2+ binding is 20 to 200 times faster than the voltage sensor kinetics. The high sum of squared residuals and the low zĪ“ value obtained for calcium binding time constant three or more times slower than the gating currents time constant (pointed with arrows) indicates that the Q(V) curve is not a simple Boltzmann sigmoidal function.

Reviewer #2:

This manuscript shows a tour de force measurement of voltage dependence of gating charge movement (Q-V) during BK channel activation at various Ca concentrations ([Ca]). The large shift of the Q-V relation (-150 mV) in response to [Ca] increase from 0 to saturation (100 µM) suggests that Ca binding to the cytosolic gating ring alters voltage sensor activation. The authors conclude that the binding of Ca in each of the four subunits alters voltage sensor activation in all four subunits by fitting Q-V relations to different models. Mutational ablation of either of the two high affinity Ca2+ binding sites in each subunit reduces Ca2+ dependent shift of the Q-V relation by ~50%, suggesting that Ca2+ binding to either site contributes an equal amount of free energy in affecting voltage sensor activation. The authors made some conclusions based on these striking data, which are discussed as follows.

1) Results section: "In this manner, we determine only the gating charge displaced before the BK channel opening." This statement could be supported by showing ionic currents along with gating currents at the same voltages. The comparison in high [Ca] (≄10 µM) would be particularly helpful.

The data requested by the reviewer is now included in Figure 1A-B. In it, gating and macroscopic current records are compared at low and high internal (100 μM) Ca2+ concentration. As the reviewer can appreciate the gating current time course develops and is almost complete in both cases in the time interval comprised by the macroscopic current delay. Please see also the answer to the first comment of reviewer #1.

2) Figure 1 seems to show that as [Ca] increases the size of gating currents becomes smaller. Does this suggest that the total amount of fast charge movement diminishes at high [Ca]? What is the reason for this phenomenon and how is this related to the Ca-dependent shift of Q-V?

We understand the confusion of the reviewer since the experiments in Figure 1 (now is Figure 2) were badly described and the current gating records shown were not the most representative of the average at a given Ca2+ concentration. Actually, the records shown at the different Ca2+ concentrations are not from a single experiment. However, at all the Ca2+ concentrations shown in Figure 2, the control was always 0 Ca2+. So to answer the reviewer’s query, we did not find any decrease in gating current when going form 0 Ca2+ to the different Ca2+ concentrations tested. Accordingly, we have now included a new Figure 2 where the records obtained at 0 and 100 μM Ca2+ are from the same experiment.

3) The authors interpret their data based on the Horrigan and Aldrich (HA) allosteric model of voltage and Ca2+ dependent activation, despite a larger Q-V shift in response to [Ca] increase is observed than that by HA. As the authors point out, while this study suggests that Ca2+ binding to either of the RCK1 site or Ca Bowl affects VSD equally, previous studies showed that Ca2+ binding only to the RCK1 site affects voltage dependence of ionic currents (G-V). Do these differences in experimental observation suggest any novel mechanism of BK channel gating that requires a modification of the HA model? In fact, although the authors suggest that HA Model II in Figure 2 fits their data better than HA Model I, it seems that neither model fits the data well (Figure 3).

A modification of the HA model is not required. The importance of the results we are presenting resides in that they allow to distinguish between the two alternative models proposed in the HA 2002 paper something not possible without the gating current data obtained at different Ca2+ concentrations. Regarding the goodness of the fitting, we argue here that Model II statistically fits the data much better taking into account that the AIC = 2p – 2ln(L) and the shape of the Q(V)s approach at all Ca2+ concentrations a simple Boltzmann function. Given that the number of parameters in both models is the same, the likelihood (L) of Model II is orders of magnitude larger than the likelihood of Model I. Please see new Table 1 and answer to comment 2 of reviewer #1.

4) Ca binding in one subunit equally affects all subunits, which suggests an allosteric interaction between Ca2+ binding and voltage sensor activation. It is not clear if Ca binding in one subunit alters all 4 cytosolic domains such that the entire gating ring interacts with all 4 VSD, or Ca binding in one subunit alters one VSD, which in turn affects all three other VSD's. There is also no evidence to distinguish if such an allosteric mechanism for Ca2+ binding to affect VSD activation is mediated by the covalent pulling of the C-linker or non-covalent interaction between the top of CTD and the bottom of VSD. Although based on previously published cryo-EM structures the authors favor the mechanism of the non-covalent VSD-CTD interactions, the present data seems not sufficient to exclude the contribution by the other mechanism.

We think that the gating ring can be considered as a single structure where the four C-terminal domain interacts through non-covalent interactions. So, it is more parsimonious to think that binding of one Ca2+ should increase the whole gating ring diameter affecting all four voltage sensors. The reviewer is right, however, in calling our attention about possible alternative mechanisms intervening in producing the gating current results we are reporting. It is not possible at present to say how much are contributing gating ring-VSD non-covalent interactions and conformational changes mediated by the pulling of the C-linker mediated by the gating ring to the leftward shift of the Q(V) curved induced by increasing internal Ca2+ concentration. However, we recall here the fact that in BK channels voltage sensors are not domain-swapped concerning the pore domain as in voltage-dependent K+ channels, but the VSDs are domain-swapped with RCK domains in the gating ring. Therefore, binding of Ca2+ makes the RCK1 N-lobe pull on the S6 helix from its subunit whereas the modification of the contact surface between the RCK1 N-lobe with the voltage sensor of an adjacent subunit induces and outward displacement of the voltage sensor (Hite et al., 2017). These structural arguments make us favour the non-covalent interaction between the CTD and the VSD as the source of the coupling between these two structures. The reviewer is right, however, in that we cannot say for certain how much of this coupling is mediated by the C-linker in the same subunit. We have rewritten this section treating the subject more gingerly and discussing possible mechanisms that can explain how Ca2+ binding to one subunit may affect the voltage sensors in all subunits.

Reviewer #3:

This is an important paper that addresses the issue of how Ca2+ binding to the cytosolic gating ring structure of BK channels allosterically couples to the voltage-sensor domains of BK channels, thereby ultimately influencing channel activation. One of the earlier papers on this topic (Horrigan and Aldrich, 2002) presented evidence that Ca2+ binding had only weak effects on voltage sensor equilibrium. More recent work has suggest that this may not be the case, and structures of the Aplysia Slo1 channel have supported the idea that there may be important links between the cytosolic domain and the voltage-sensors. Here, the authors present compelling evidence that Ca-binding to the cytosolic domain does allosterically influence VSD equilibrium and, furthermore, that each of the two Ca binding sites on a single BK α subunit independently, and largely additively, influence the VSD equilibrium.

The authors undertake an analysis of a potential mechanism explaining their data and reveal that occupancy of any binding site allosterically influences the VSD equilibrium of all subunits (their Scheme II), rather than only a single associated VSD (Scheme I). This requires that binding to any individual site exerts some concerted effect through all four VSDs.

Overall, the manuscript is clearly written and the data and analyses are solid. There are a few places that some clarifications in language are required. Also, a potential alternative conception of how 0-4 Ca2+ (actually, 0-8) may incrementally influence VSD equilibrium is mentioned, which the authors might want to consider.

[Editors' note: further revisions were requested prior to acceptance, as described below.]

Reviewer #1:

The authors' response and modifications to the manuscript are helpful and address many of my questions. However, there are still some issues that require clarification.

1) "Ca2+ binding at this Ca2+ concentration proceeds at a pace about 33-fold slower than the voltage sensor movement (~30 μs)."

The new kinetic data (Figure 1C) indicates that the gating current time constant is actually as slow as 75 μs near VH (i.e. slower than 0 Ca). That, and the simulated effect of Ca-binding kinetics in response to my previous review, have increased concerns about the assumption that Ca binding does not re-equilibrate during gating current measurements at intermediate [Ca], and I think this issue requires some additional analysis. This assumption is critical for modeling the Ca-dependence of the Q-V data and distinguishing between Schemes I and II. The simulation indicates that if Ca binding can re-equilibrate, then Q-Vs predicted by Scheme I will become more Boltzmann-like, potentially making it more difficult to distinguish Schemes I and II. In addition, I wonder if re-equilibration could contribute to the remarkable steepness of the VH-Ca relation between 5 and 10 μm Ca – a feature that is not well described by any of the models. That is, re-equilibration should increase the VH shift (since voltage-sensor activation will enhance Ca-binding) and if Ca re-equilibration is faster at higher [Ca] then it would tend to increase the steepness of the curve

The 75 μs gating current time constant in Figure 1C increases my concern because it is potentially closer to the time constant of Ca binding. For example, at the [Ca] used in the simulation (15 μM), the on-rate at a single binding site would be 1500 s-1, or 6000 s-1 for the transition from zero to one Ca bound with 4 binding sites, implying a time constant less than 166 μs (depending on off-rate). Thus, it seems possible that Ca-binding could be only ~2 fold slower than voltage sensor activation under some conditions. The simulation seems to suggest this is probably not a problem since there is little change in the Q-V fit parameters when the Ca-binding time constant is 3-fold or more slower than gating current. However, I have two concerns about the simulation analysis: (1) the Q-Vs were measured by fitting the first 30 μs of the simulated gating current, whereas the experimental data were measured from the first 100 μs. This could lead the simulation to underestimate the potential contribution of Ca re-equilibration to the data. (2) It doesn't seem reasonable to fit the simulated Q-Vs with a single Boltzmann function if the assumption to be tested (no re-equilibration) predicts a double-Boltzmann Q-V. In other words, although the simulation shows little change in the Q-V fit parameters when the Ca-binding time constant is 3-fold or more slower than gating current, I wonder if this indicates that there is no change in the Q-V over this range, or merely that the fits to a single Boltzmann function are all equally bad. I think the simulation analysis should be repeated by fitting the initial 100 μs of the gating current, and fitting the resulting Q-Vs to the prediction when there is no re-equilibration of Ca (i.e. double Boltzmann). Presumably, such fits, or showing the actual Q-Vs, would better define the conditions under which the model assumptions are valid. Plotting VH might also be useful.

As suggested by reviewer #1 we have redone the simulation analysis considering the first 100 μ s of the gating current and 10 μM Ca2+ (please see new Figure 3—figure supplement 2). We have confirmed our previous conclusion that Ca2+ binding time constants 5-fold slower than the gating time constant suffice to consider that there is not Ca2+ re-equilibration during the time it takes to measure the gating currents. Figure 3—figure supplement 2 and the text are now included in the Appendix.

We performed a single Boltzmann curve fit in our simulations: Model I predicts that, at calcium concentrations close to the dissociation constant, the Q/V curves should have a minimum in the zQ parameter and be poorly described with a sigmoidal Boltzmann function. However, as is observed in Figure 4, the Q/V curves are well described with a sigmoidal Boltzmann function and that the parameter zJ is the same for all calcium concentrations. It can be argued that this result is compatible with the Model I if it is accepted that the equilibrium kinetics of calcium is rapid. To estimate how fast this equilibrium has to be to produce well-described Q/V curves with a Boltzmann with invariant zQ, we performed the simulations shown in Figure 3—figure supplement 2. We found that to recover the experimental zQ, the calcium-binding rate constant needs to be 100 times faster than that reported by Hou et al., 2016 exceeding the diffusion limit constraint. We conclude that the good fit to a single Boltzmann sigmoidal function to our experimental Q/V curves is not due to fast calcium re-equilibration but due to the failure of Model I to describe our data. This conclusion is the same for analysis based on the first 30 μs or the first 100 μs of the simulated gating currents. VH results are not included in the figure since they would not contribute to discriminate between the alternative interpretations of our findings.

2) Although I accept the conclusion, based on Table 1, that Scheme II fits the data better than Scheme I even with 2 binding sites per subunit, I think it would be good to show the fits for the 2-site models, at least in the supplement. One reason, as I suggested in my initial review, is that I don't think it is reasonable to dismiss Scheme I based on the qualitative difference in Q-V shape for a one-site model, when such a model is model is inconsistent with the data in Figure 5. That is simply a "straw man" argument. But, mainly, as noted by another reviewer, none of the models fit very well, suggesting neither Schemes are the final answer. In such a situation, I think it is important to show the fits for future reference.

As requested by the reviewer, Figure 4—figure supplement 1 now shows the fits of the data using the 2-site models, and parameters are provided in the new Table 1. Figure 4—figure supplement 1 is described and discussed in the Results (subsection ā€œHigh-affinity Ca2+-binding sites in RCK1 and RCK2 domains contribute equally to the allosteric coupling between Ca2+ and voltage sensorsā€) and the Discussion section, respectively, of the new version of the manuscript. It is evident from the new fittings that due to the increases in the numbers of parameters – when using the two-site models, the differences between models are attenuated compared to the fitting to the data using a single Ca2+ site. However, Table 1 shows that the AIC values greatly favor Model II-two Ca2+ sites. The goodness of the different models can be better appreciated by plotting of zJ vs. Ca2+ (Figure 4D). Note that in Model I-two Ca2+ sites, reflecting the proportion of unliganded and Ca2+-saturated channels, zJ is Ca2+ dependent, reaching a minimum when the Ca2+ concentration is ~ 10 μM (Figure 4D and Figure 4—figure supplement 1C-D), whereas as found experimentally, zJ in Model II-Two Ca2+ sites zJ is independent of the Ca2+ concentration (Figure 4D).

We should note here that in revising all the Q(V)s at the different Ca2+ concentration, we have found that some of the data for 5 and 10 μM Ca2+ were not adequately analyzed and some of the Q(V)s were statistical outliers. Taking into account the five and four remaining Q(V) curves at 5 and 10 μM Ca2+, we found that the VH undergoes a slight rightward shift from 115.7 ± 6 to 121.9 ± 3.8 mV and zQ from 0.67 ± 0.04 to 0.63 ± 0.01 for 5 μM Ca2+; whilst for 10 μM Ca2+ VH is shifted from 46.5 ± 14 to 67.3 ± 17 mV and zQ from 0.71 ± 0.07 to 0.64 ± 0.08. The main consequence of this new analysis is that now the Model II fits the data better according to the AIC criteria value (see Table 1).

3) The authors partially addressed my question about gating current kinetics with Figure 1C. The time constants for the ON currents do appear to shift along the voltage-axis in response to Ca, consistent with the Q-V. But they didn't address my question regarding the relatively small 2.5-fold Ca-dependent change in OFF kinetics in Figure 2—figure supplement 1. The authors suggest, based on Figure 1C that the main effect Ca is to slow OFF kinetics, but Figure 2—figure supplement 1 isn't consistent with that prediction. Presumably if ON time constants are decreased ~2-fold by Ca then OFF time constants should increase ~10 fold to account for the large E-factor. Are the data representative? Can OFF kinetics included in the time constant plot?

We are somewhat confused about the reviewer 1 comment 3. As stated in Results the Ļ„IG-ONV curves were fitted to a two-state model (Ļ„(V)=1/(α(V)+β(V)) where the forward (α) and backward (β) rate constants represent the resting-active (R-A) transitions of the voltage sensors determining the equilibrium constant of the VSD activation (JV = αVβV). Our statement that the main effect of Ca2+ is to slow down the OFF kinetics is based on the determination of αV and β(V) using the values of Ļ„IG-ONV and J(V). This calculation indicates that β(V) increase 10.9-fold when the Ca2+ concentration is increased to 100 μM (see legend in Figure 1), in a reasonable agreement with the large allosteric factor E. It is unclear to us why the reviewer is referring to Figure 2—figure supplement 1, a figure that is not directly comparable to Figure 1C.

We would like to include the OFF time constant plot requested by the reviewer, but these kind of experiments are in extremely difficult to do at high Ca2+, and we cannot anticipate the time we will spend in them.

4) Finally, many of the responses to reviewers are fine, but should be incorporated in the manuscript. Requests for clarification generally refer to issues that need to be better explained not only to the reviewers but also to the intended audience of the paper. For example, when I requested clarification in the Materials and methods section regarding the grounding scheme, I meant that such details should be included in the Materials and methods section. Similarly, the author's clarification that representative traces in Figure 2A are from different patches with the exception of 0 and 100 Ca is helpful, but should be described in the figure legend.

The grounding scheme is now in Materials and methods and the clarification requested by the reviewer regarding the traces in Figure 2A is now included in the legend of the figure.

Reviewer #3:

The authors have responded in generally satisfactory fashion to many of the major issues raised by the reviewer. The includes the kinetics of QCactivation, how QCwas measured, the apparent Ca2+-dependence of gating current amplitude, the impact of including 2 types of Ca2+ binding sites in the model fitting, and a more balanced consideration of how the present results fit with previous work.

The version of the manuscript which used red-fonts to highlight changes seemed to include only some of the passages that were altered, particularly since consideration of models that included 2 types of Ca binding sites were, in some cases, not highlighted by red.

The manuscript and new changes still suffer from abundant English usage errors.

We hope that, this time, language errors have been fixed.

The new Figure 1 nicely addresses the issue of what is actually being measured and whether the QCmeasurements might include contamination from later voltage sensor movements. Furthermore, the figure address the topic of the Ca2+ dependent of QCkinetics. There is one issue that persists in this data. The time constant in 1A (0 Ca2+) is 52 μs, while in 1B (100 μM) it is 42 μs, both at +160 mV. Examination of the averaged data in panel C show that at +160 mV, μIG-ON is a bit larger than 0.06 ms for 0 Ca2+, generally consistent with the trace in 1A, while for 100 μM it appears to be a little above 0.025 ms. The values for the displayed example at 100 μM seems to be well outside the error bars, than one might expect. Perhaps something needs to be checked here.

This issue was also raised by reviewer #1. We agree with reviewer #3 that we made a bad choice of gating current records in Figure 1 A-B. We reviewed our results and the gating current recordings presented in the new Figure 1A-B are representative of the average gating current records.

[Editors' note: further revisions were requested prior to acceptance, as described below

Reviewer #1:

The revised manuscript is improved and adequately addresses most of my concerns. However, the authors expressed some confusion over my questions regarding the apparent discrepancy in OFF gating current kinetics, which I will attempt to clarify.

"We are somewhat confused about the reviewer 1 comment (3). As stated in Results the šœš¼šŗāˆ’š‘‚š‘(š‘‰) curves were fitted to a two-state model (šœ(š‘‰)=1/(š›¼(š‘‰)+š›½(š‘‰)) where the forward (š›¼) and backward (š›½) rate constants represent the resting-active (R-A) transitions of the voltage sensors determining the equilibrium constant of the VSD activation (š½(š‘‰)=š›¼(š‘‰)š›½(š‘‰)). Our statement that the main effect of Ca2+ is to slow down the OFF kinetics is based on the determination of š›¼(š‘‰) and š›½(š‘‰) using the values of šœš¼šŗāˆ’š‘‚š‘(š‘‰) and J(V). This calculation indicates that (š‘‰) increase 10.9-fold when the Ca2+ concentration is increased to 100 μM (see legend in Figure 1), in a reasonable agreement with the large allosteric factor E. It is unclear to us why the reviewer is referring to Figure 2—figure supplement 1, a figure that is not directly comparable to Figure 1C."

My questions about gating current kinetics (Comments #3 in previous review, #1 in original review) relate in large part to the data in Figure 2—figure supplement 1. I asked whether the difference in gating current kinetics shown for 0 and 10 μm Ca in Figure 2—figure supplement 1 are consistent with a large Q-V shift (as observed in 10 Ca). In particular, I noted that there is a relatively small change from 0 to 10 Ca in the time constant of the fast component of OFF current at -90 mV, which doesn't seem compatible with a large Q-V shift. The fast OFF component at -90 mV should be a relatively direct measure of the backward rate β (i.e. Ļ„~=1/β). If there is a small change in ON kinetics and large Q-V shift, then there should be a large change in β and hence OFF kinetics. The authors make essentially the same prediction based on their fits to the ON kinetics in Figure 1C. But they do not include OFF data to directly confirm the prediction or address my concern.

"We would like to include the OFF time constant plot requested by the reviewer, but these kind of experiments are in extremely difficult to do at high Ca2+,.…"

I do not think that measurements of OFF kinetics at multiple voltages are necessary. Measurements at a single voltage like -90 mV should suffice. If OFF kinetics have not or cannot be measured at 100 Ca, then I suggest adding the ON kinetics at 10 Ca to Figure 1C together with OFF data at -90 mV for 0 and 10 Ca. Based on Figure 2—figure supplement 1, such data already exists.

We have complied with the request of reviewer #1. The data the reviewer requested is now included in Figure 2—figure supplement 1 as Figure 2—figure supplement 1D. In Figure 2—figure supplement 1D we have followed the same strategy we employed in Figure 1C plotting in the same graph Ļ„IG-ON and QC/QC,MAX vs. voltage for 0 and 10 μM Ca2+. As you can see, the new figure shows that the difference in gating current kinetics shown for 0 and 10 μM Ca2+ in Figure 2—figure supplement 1C are consistent with a large Q-V shift that we obtained in 10 μM Ca2+. Please note that the change from 0 to 10 Ca2+ in the time constant of the fast component of OFF current at -90 mV is compatible with a large Q-V shift (orange circles).

https://doi.org/10.7554/eLife.44934.018

Article and author information

Author details

  1. Yenisleidy Lorenzo-Ceballos

    1. Doctorado en Ciencias Mención Neurociencia, Facultad de Ciencias, Universidad de Valparaíso, Valparaíso, Chile
    2. Centro Interdisciplinario de Neurociencia de ValparaĆ­so, Facultad de Ciencias, Universidad de ValparaĆ­so, ValparaĆ­so, Chile
    Contribution
    Conceptualization, Formal analysis, Validation, Investigation, Visualization, Methodology, Writing—original draft
    Competing interests
    No competing interests declared
    ORCID icon "This ORCID iD identifies the author of this article:" 0000-0003-4309-9314
  2. Willy Carrasquel-Ursulaez

    Centro Interdisciplinario de Neurociencia de ValparaĆ­so, Facultad de Ciencias, Universidad de ValparaĆ­so, ValparaĆ­so, Chile
    Contribution
    Conceptualization, Software, Formal analysis, Investigation, Writing—review and editing
    Competing interests
    No competing interests declared
  3. Karen Castillo

    Centro Interdisciplinario de Neurociencia de ValparaĆ­so, Facultad de Ciencias, Universidad de ValparaĆ­so, ValparaĆ­so, Chile
    Contribution
    Validation, Investigation, Methodology, Writing—review and editing
    Competing interests
    No competing interests declared
  4. Osvaldo Alvarez

    1. Centro Interdisciplinario de Neurociencia de ValparaĆ­so, Facultad de Ciencias, Universidad de ValparaĆ­so, ValparaĆ­so, Chile
    2. Departamento de BiologĆ­a, Facultad de Ciencias, Universidad de Chile, Santiago, Chile
    Contribution
    Conceptualization, Software, Formal analysis, Writing—review and editing
    Competing interests
    No competing interests declared
  5. Ramon Latorre

    Centro Interdisciplinario de Neurociencia de ValparaĆ­so, Facultad de Ciencias, Universidad de ValparaĆ­so, ValparaĆ­so, Chile
    Contribution
    Conceptualization, Resources, Data curation, Software, Formal analysis, Supervision, Funding acquisition, Validation, Investigation, Visualization, Methodology, Writing—original draft, Project administration, Writing—review and editing
    For correspondence
    ramon.latorre@uv.cl
    Competing interests
    No competing interests declared
    ORCID icon "This ORCID iD identifies the author of this article:" 0000-0002-6044-5795

Funding

AFOSR (No. FA9550-16-1-0384)

  • Ramon Latorre

FONDECYT (Grant No. 1180999)

  • Karen Castillo

CONICYT-PFCHA (Doctoral fellowship No. 63140149)

  • Yenisleidy Lorenzo-Ceballos

Chilean Ministry of Economy, Development, and Tourism (Millennium Scientific Initiative P029-022-F)

  • Yenisleidy Lorenzo-Ceballos
  • Willy Carrasquel-Ursulaez
  • Karen Castillo
  • Osvaldo Alvarez
  • Ramon Latorre

FONDECYT (Grant No. 1150273)

  • Ramon Latorre

FONDECYT (Grant No. 1190203)

  • Ramon Latorre

The funders had no role in study design, data collection and interpretation, or the decision to submit the work for publication.

Acknowledgements

We thank Dr. John Ewer for his comments on the manuscript and to Mrs. Luisa Soto (University of Valparaiso) for excellent technical assistance. This research was supported by FONDECYT Grant No. 1150273, FONDECYT Grant No. 1190203 and AFOSR No. FA9550-16-1-0384 to RL; CONICYT-PFCHA Doctoral fellowships No. 63140149 to YLC; FONDECYT Grant No. 1180999 to KC The Centro Interdisciplinario de Neurociencia de Valparaiso is a Millennium Institute supported by the Millennium Scientific Initiative of the Chilean Ministry of Economy, Development, and Tourism (P029-022-F).

Ethics

Animal experimentation: This study was performed in strict accordance with the recommendations in the Guide for the Care and Use of Laboratory Animals of the Ethics Committee for Animal Experimentation of the University of ValparaĆ­so. All of the animals were handled according to approved institutional animal care and use committee protocols (BEA031-14) of the University of Valparaiso. All surgery was performed under tricaine anesthesia, and every effort was made to minimize suffering.

Senior and Reviewing Editor

  1. Richard Aldrich, The University of Texas at Austin, United States

Version history

  1. Received: January 7, 2019
  2. Accepted: September 10, 2019
  3. Accepted Manuscript published: September 11, 2019 (version 1)
  4. Version of Record published: September 26, 2019 (version 2)

Copyright

Ā© 2019, Lorenzo-Ceballos et al.

This article is distributed under the terms of the Creative Commons Attribution License, which permits unrestricted use and redistribution provided that the original author and source are credited.

Metrics

  • 1,495
    Page views
  • 308
    Downloads
  • 8
    Citations

Article citation count generated by polling the highest count across the following sources: PubMed Central, Crossref, Scopus.

Download links

A two-part list of links to download the article, or parts of the article, in various formats.

Downloads (link to download the article as PDF)

Open citations (links to open the citations from this article in various online reference manager services)

Cite this article (links to download the citations from this article in formats compatible with various reference manager tools)

  1. Yenisleidy Lorenzo-Ceballos
  2. Willy Carrasquel-Ursulaez
  3. Karen Castillo
  4. Osvaldo Alvarez
  5. Ramon Latorre
(2019)
Calcium-driven regulation of voltage-sensing domains in BK channels
eLife 8:e44934.
https://doi.org/10.7554/eLife.44934

Further reading

    1. Neuroscience
    2. Structural Biology and Molecular Biophysics
    Megan M Cullinan, Robert C Klipp ... John R Bankston
    Research Article

    Acid-sensing ion channels (ASICs) are trimeric proton-gated sodium channels. Recent work has shown that these channels play a role in necroptosis following prolonged acidic exposure like occurs in stroke. The C-terminus of ASIC1a is thought to mediate necroptotic cell death through interaction with receptor interacting serine threonine kinase 1 (RIPK1). This interaction is hypothesized to be inhibited at rest via an interaction between the C- and N-termini which blocks the RIPK1 binding site. Here, we use two transition metal ion FRET methods to investigate the conformational dynamics of the termini at neutral and acidic pH. We do not find evidence that the termini are close enough to be bound while the channel is at rest and find that the termini may modestly move closer together during acidification. At rest, the N-terminus adopts a conformation parallel to the membrane about 10 ƅ away. The distal end of the C-terminus may also spend time close to the membrane at rest. After acidification, the proximal portion of the N-terminus moves marginally closer to the membrane whereas the distal portion of the C-terminus swings away from the membrane. Together these data suggest that a new hypothesis for RIPK1 binding during stroke is needed.

    1. Biochemistry and Chemical Biology
    2. Structural Biology and Molecular Biophysics
    Daniel MuƱoz-Reyes, Levi J McClelland ... Maria Jose Sanchez-Barrena
    Research Article

    The Neuronal Calcium Sensor 1, an EF-hand Ca2+ binding protein, and Ric-8A coregulate synapse number and probability of neurotransmitter release. Recently, the structures of Ric-8A bound to Ga have revealed how Ric-8A phosphorylation promotes Ga recognition and activity as a chaperone and guanine nucleotide exchange factor. However, the molecular mechanism by which NCS-1 regulates Ric-8A activity and its interaction with Ga subunits is not well understood. Given the interest in the NCS-1/Ric-8A complex as a therapeutic target in nervous system disorders, it is necessary to shed light on this molecular mechanism of action at atomic level. We have reconstituted NCS-1/Ric-8A complexes to conduct a multimodal approach and determine the sequence of Ca2+ signals and phosphorylation events that promote the interaction of Ric-8A with Ga. Our data show that the binding of NCS-1 and Ga to Ric-8A are mutually exclusive. Importantly, NCS-1 induces a structural rearrangement in Ric-8A that traps the protein in a conformational state that is inaccessible to Casein Kinase II-mediated phosphorylation, demonstrating one aspect of its negative regulation of Ric-8A-mediated G-protein signaling. Functional experiments indicate a loss of Ric-8A GEF activity towards Ga when complexed with NCS-1, and restoration of nucleotide exchange activity upon increasing Ca2+ concentration. Finally, the high-resolution crystallographic data reported here define the NCS-1/Ric-8A interface and will allow the development of therapeutic synapse function regulators with improved activity and selectivity.