A ribosome assembly stress response regulates transcription to maintain proteome homeostasis
- Institute of Genetics and Genomics of Geneva (iGE3), Switzerland
- Heidelberg University Biochemistry Center (BZH), Germany
- Université Paul Sabatier, France
Figures
Figure 1 with 1 supplement
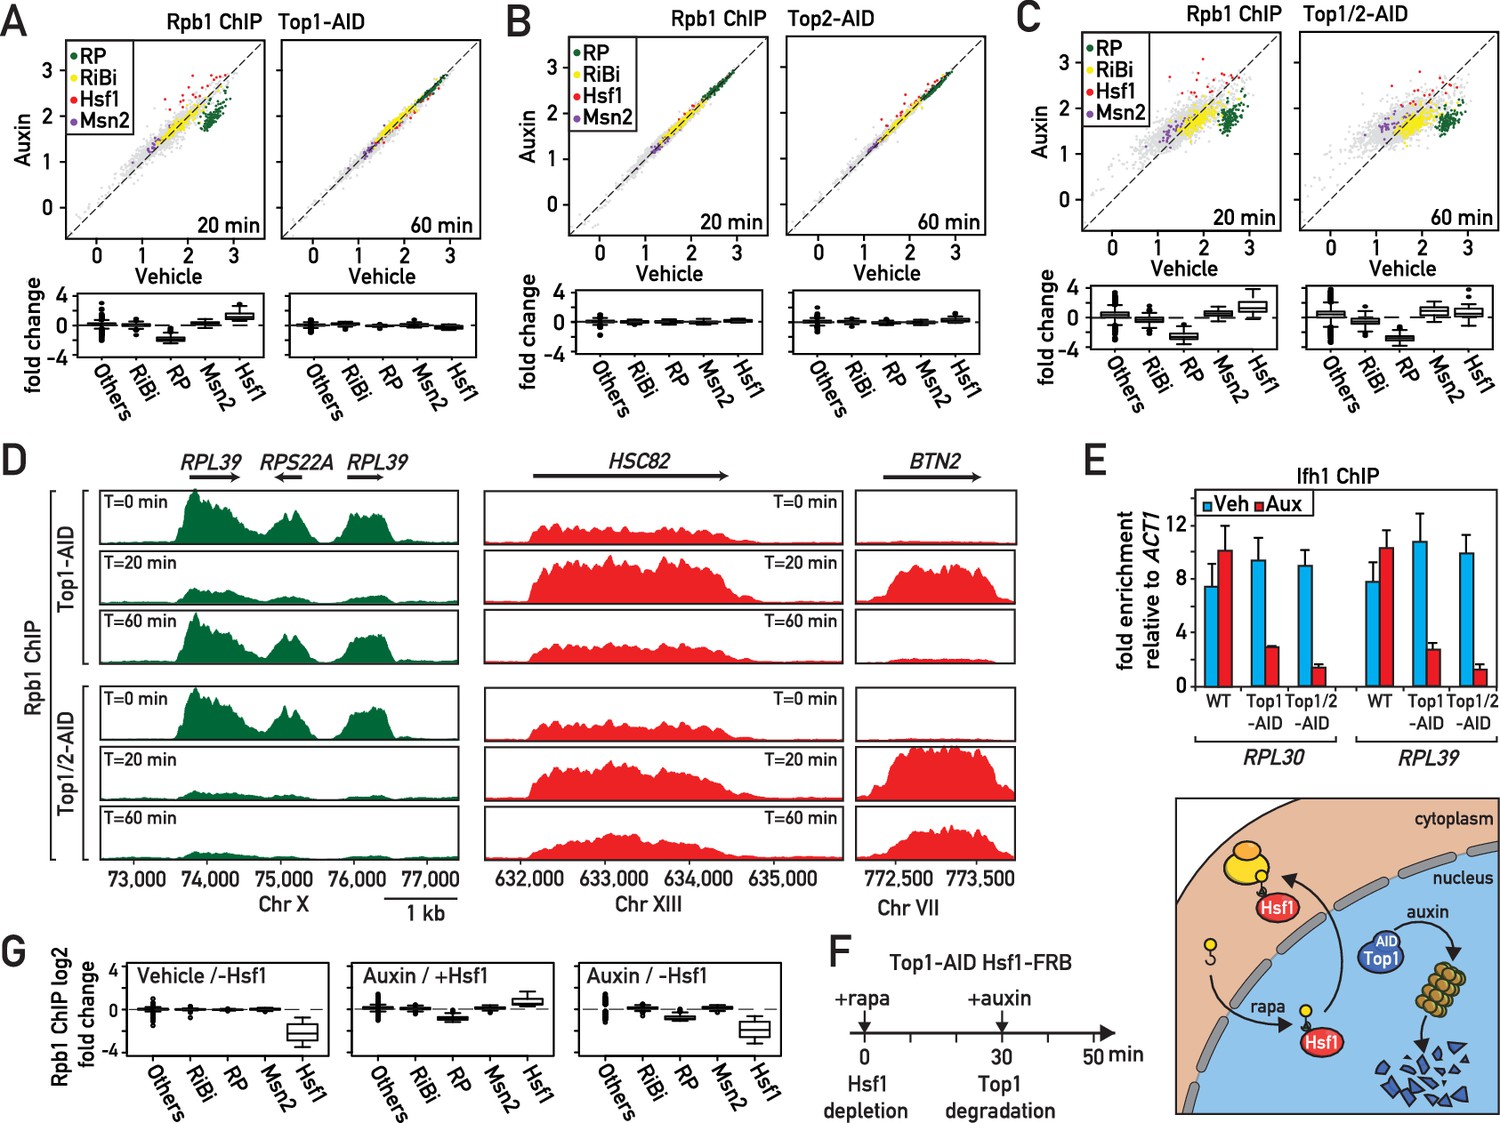
Rapid degradation of Topoisomerase 1 (Top1) induces a transient induction of Heat Shock Factor 1 (Hsf1) target genes and down-regulation of ribosomal protein (RP) genes.
(A, B, C) Scatter plots (top panels) and box plots (bottom panels) comparing RNAPII binding (as measured by Rpb1 ChIP-seq) in Top1-AID (A), Top2-AID (B) and Top1/2-AID (C) strains at the indicated times following either auxin or vehicle addition to the media. Indicated gene categories (RP, n = 138; ribosome biogenesis [RiBi], n = 229; Msn2 target genes, n = 45; and Hsf1 target genes, n = 19) are color-coded on the scatter plots and displayed separately on the box plots, together with all remaining genes as a fifth class (others, n = 4610). (D) Genome browser tracks showing RNAPII (Rpb1) ChIP-seq read counts at the indicated positions on chromosomes X, XIII and VII at 0, 20, or 60 min following auxin addition to Top1-AID (top panels) and Top1/2-AID (bottom panel) strains. Gene names and open reading frame (ORF) positions are shown above. (E) Ifh1 occupancy, measured by qPCR ChIP at the RPL30 and RPL39 promoters 20 min following auxin addition to cultures of Top1-AID and Top1/2-AID strains. Bar height indicates the average and error bars the range of n = 4 biological replicates. (F) Schematic representation of protocol for Hsf1-FRB nuclear depletion (anchor-away) induced by rapamycin (Rapa) followed by Top1-AID depletion. (G) Box plots showing RNAPII (Rpb1) ChIP-seq signal following Hsf1-FRB nuclear depletion by anchor-away (-Hsf1, left panel), Top1-AID degradation (auxin, middle panel) or both Hsf1-FRB and Top1-AID depletion (auxin / -Hsf1, right panel) for the five functional groups described in (A).
Figure 1—figure supplement 1
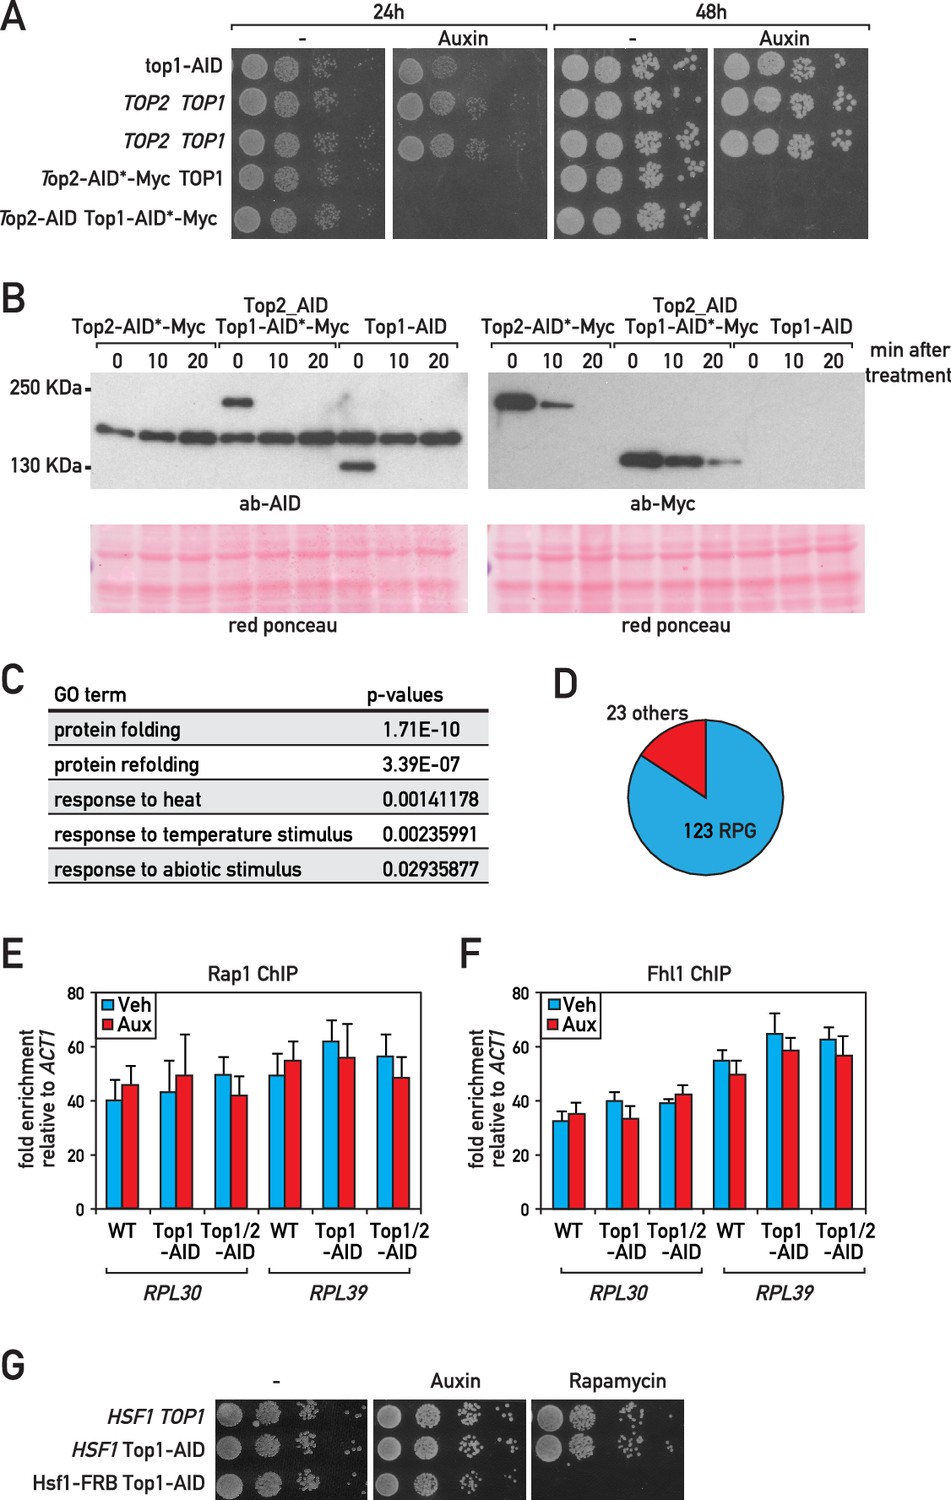
Characterization of Top1-AID, Top2-AID, Top1-AID Top2-AID and Top1-AID Hsf1-FRB strains.
(A) Tenfold serial dilution of Top1-AID or Top1/2-AID cells spotted onto rich medium and grown at 30°C for 24 or 48 hr with or without auxin treatment. (B) Top1 or Top2 tagged as indicated were detected by western blot using antibodies against Myc or AID antibody in a whole-cell extract. Ponceau red stain served as a loading control (bottom panel). (C) GO of genes that are upregulated (Rpb1-ChIP) more than two times following Top1 depletion. (D) Circle diagram showing number of RP genes in the 146 genes downregulated more than two times following Top1 depletion. (E–F) Rap1 (E) or Fhl1 (F) occupancy at the RPL30 and RPL39 promoters at 20 min following Top1 or Top1/2 depletion. (G) 10-fold serial dilution of anchor away cells background spotted onto rich medium and grown at 30°C for 40 hr with (Auxin, Rapamycin) or without treatment (vehicle).
Figure 2 with 1 supplement
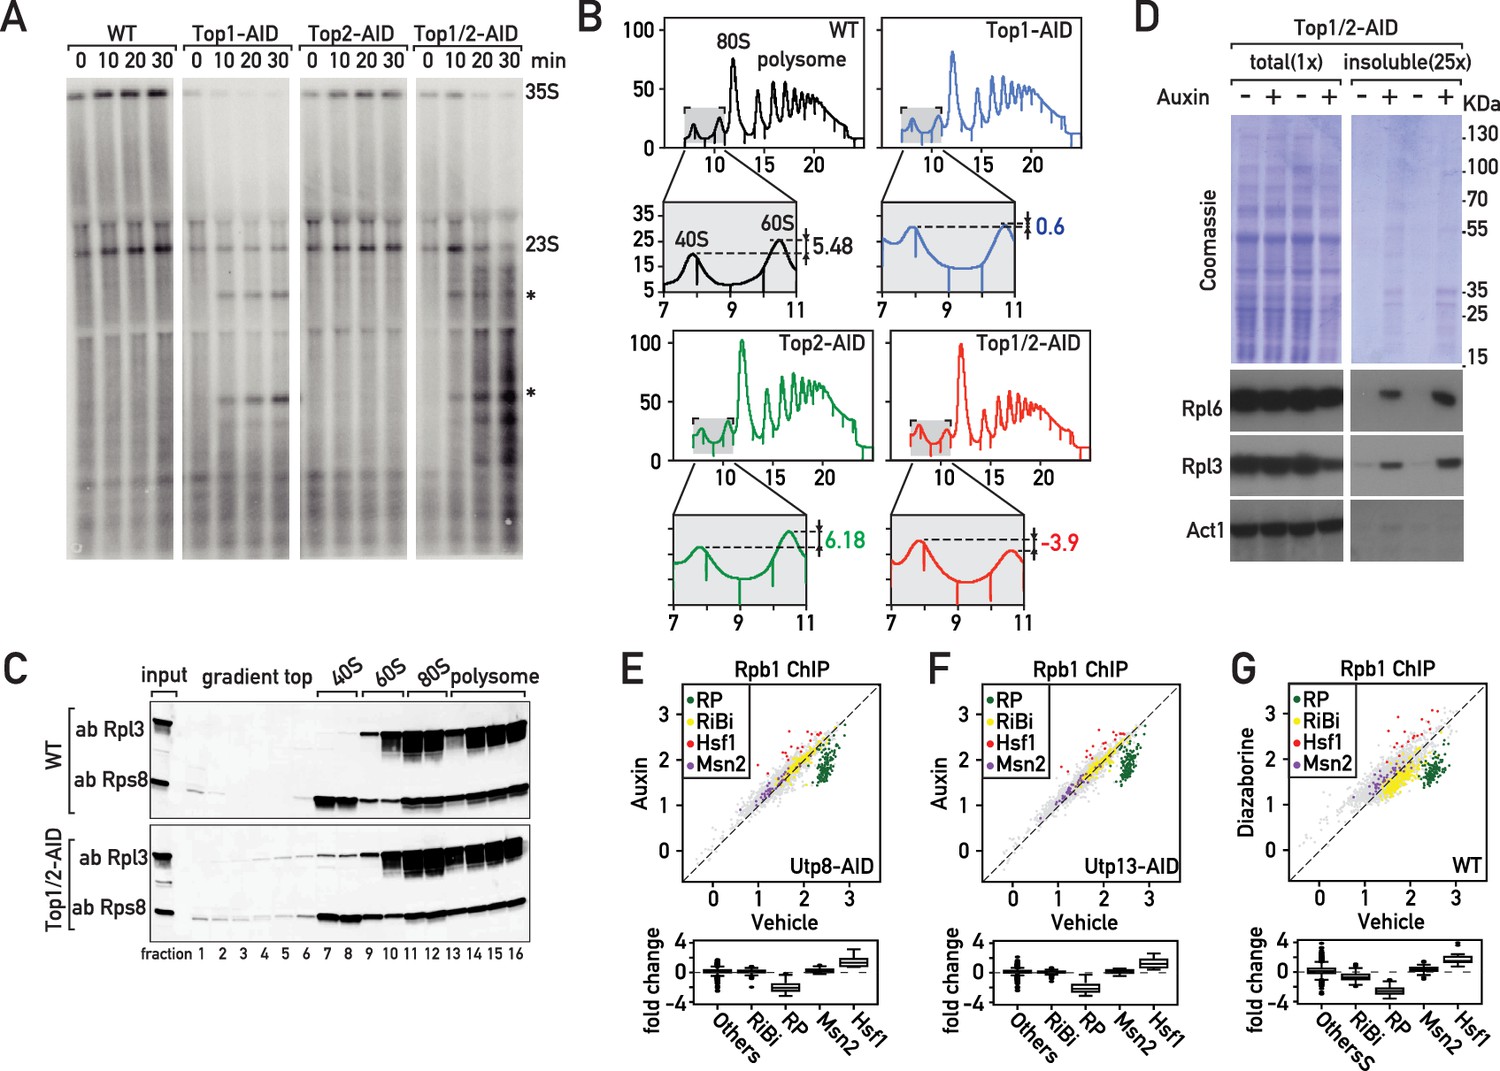
The effects of Top1 depletion on RNAPII regulation are linked to an underlying defect in ribosome biogenesis.
(A) Northern blot of 5’ETS1-containing rRNAs prepared from cultures of wild-type, Top1-AID, Top2-AID and Top1/2-AID cells that had been pulse-labeled for 2 min with [3H] adenine at the indicated times following addition of auxin to the media. Total RNAs were extracted and samples were separated on agarose gels, transferred to a nylon membrane and first directly autoradiographed to reveal pulse labeling of nascent rRNAs (see Figure 2—figure supplement 1C). The membrane was next hybridized with a 32P-labeled oligonucleotide probe allowing detection of all species containing 5’ETS1 (ACGACAAGCCT-ACTCGAATTCGT). Truncated pre-rRNA fragments, first identified in cells lacking Top1 (El Hage et al., 2010), are indicated (*). (B) Polysome sedimentation profiles (OD260) of WT, Top1-AID, Top2-AID, and Top1/2-AID strains 20 min following auxin treatment (large panels, as indicated). The top of each gradient (fractions 7 to 11), corresponding to 40S and 60S subunit peaks, is expanded below, where peak height differences (60S:40S ratio) are indicated. (C) Total cell extracts prepared from the indicated fractions of sedimentation profiles of WT and Top1/2-AID strains (from B) were TCA precipitated and analyzed by Western blot following SDS-PAGE, using an antibody against Rpl3 and Rps8, as indicated. (D) Total (left panels) and detergent-insoluble pellet (right panels) fractions isolated from lysates of Top1/2AID cells treated (+) or not (-) with auxin were analyzed by SDS-PAGE and Coomassie blue staining (top panels) or immunoblotting with the indicated antibodies (bottom panels). The pellet fraction is overloaded 25-fold compared to the total extract fractions. (E, F, G) Scatter plots (top panels) comparing RNAPII (Rpb1) ChIP-Seq read counts for individual genes in Utp8-AID (E) or Utp13-AID (F) cells after 20 min of auxin or vehicle treatment, or WT cells after 20 min of treatment with diazaborine or vehicle (G) (y-axis: auxin or diazaborine) for 20 min versus non-depleted cells (x-axis, Vehicle). Each dot represents a gene (5041 genes in total) and genes are color-coded according to functional groups, as in Figure 1A. Bottom panels display the corresponding box plots for the four indicated gene categories plus all other genes (others).
Figure 2—figure supplement 1

Protein localization and transcriptional effecs of Top1, Top2 and Top1/2 depletion.
(A) A Top1/2-AID strain expressing Btn2-eGFP and Nop1-mCherry was grown to exponential phase and cell samples were used for fluorescence microscopy analysis after 20 min of vehicle (Veh) treatment (mock depletion; top panels) or auxin (Aux) treatment (Top1/2 depletion; bottom panels). The number of Btn2-eGFP foci per cell was quantified and is presented in the panel to the right. 75–100 cells were quantified for each experiment, and the data are reported as averages from two experiments, with standard deviations indicated. (B) A Top1/2-AID strain expressing Pre6-eGFP and Nop56-mCherry was grown exponentially and cell samples were used for fluorescence microscopy analysis after 20 min of Top1/2 depletion by auxin treatment (Aux) or mock depletion (Veh). The number of cells where Pre6-eGFP showed a peri-nuclear localization was quantified and is presented as a percentage. 75–100 cells were quantified for each experiment, and the data are reported as averages from two experiments, with standard deviations indicated. (C) Yeast cells (either wild type, Top1-AID, Top2-AID or Top1/2-AID, as indicated) were grown synthetic glucose medium lacking adenine to mid-log phase at which point auxin was added (to 0.5 mM) and cells were then pulse labeled with [3H] adenine for 2 min at different time points after auxin addition (T = 0, 10, 20, 30 min). RNAs were extracted and samples were separated on agarose gels, transferred to a nylon membrane. After documenting 3H labeling by autoradiography, the same membrane was used for the Northern blot shown in Figure 2A. (D) RNAPII ChIP occupancy at the RPL30 and RPL39 promoters or at the SSA4 and HSP42 promoters at 20 min following Top1 and Top2 depletion.
Figure 3 with 1 supplement
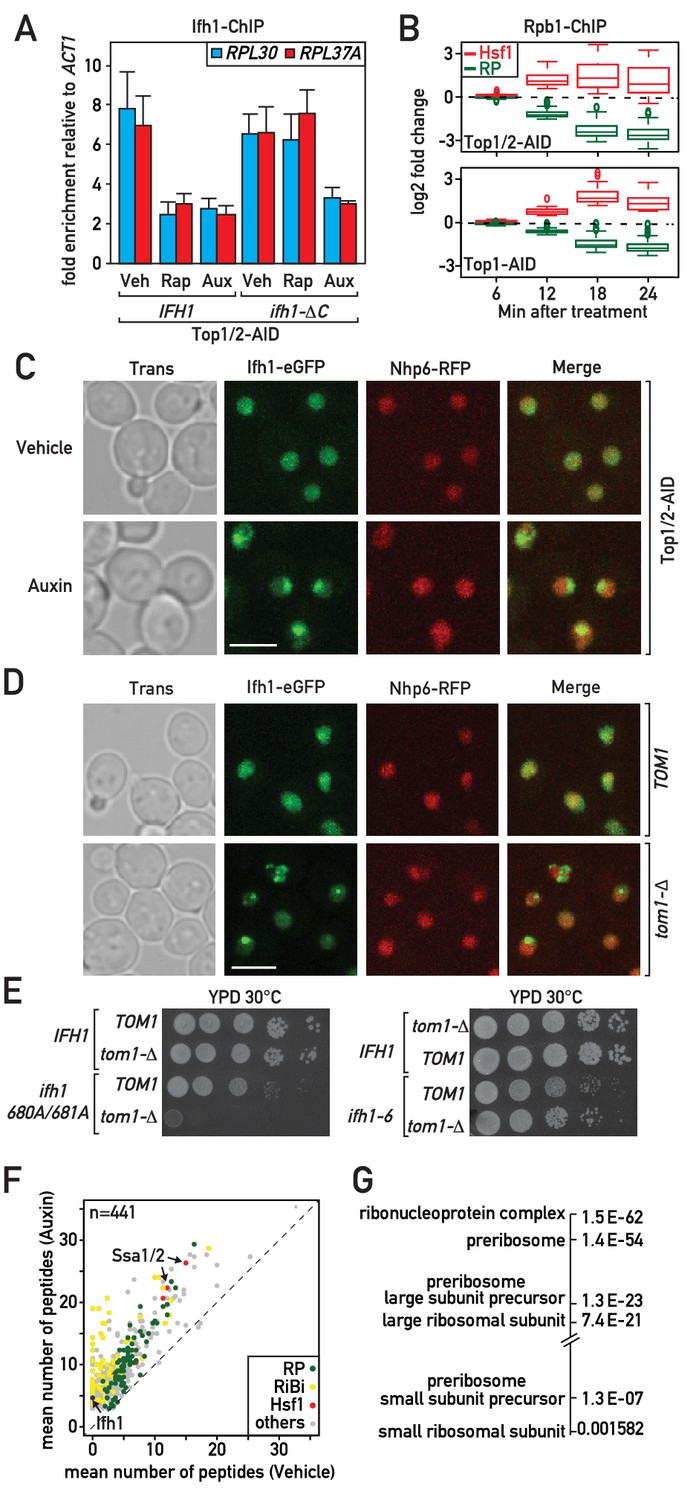
Evidence that Ifh1 is rapidly removed from RP gene promoters and sequestered in an insoluble nucleolar fraction pursuant to unassembled RP accumulation following RASTR initiation.
(A) Ifh1 occupancy at the RPL30 and RPL37A promoters 20 min following vehicle, rapamycin or auxin treatment of Top1/2-AID strains expressing either WT Ifh1 (IFH1) or a C-terminal truncated allele (ifh1-∆C). Bar height indicates the average and error bars the range of N = 4 biological replicates. (B) Box plots showing the kinetics of RNAPII ChIP-seq changes at Hsf1 target and RP genes at the indicated time points (minutes) following auxin treatment in Top1/2-AID (top panel) or Top1-AID (bottom panel) strains. (C) A Top1/2-AID strain expressing Ifh1-eGFP and Nhp6-mCherry was grown exponentially and cell samples were used for fluorescence microscopy analysis after 20 min of auxin (Aux) or vehicle (Veh) treatment. (D) TOM1 (top panels) and tom1-Δ (bottom panels) strains expressing Ifh1-eGFP and Nhp6-mCherry were grown exponentially and cell samples were used for fluorescence or transmission microscopy analysis, as indicated. (E) Tenfold serial dilutions of IFH1, ifh1-AA (ifh1 680A/681A) or ifh1-6 cells transformed in either TOM1 or tom1-Δ backgrounds (as indicated) were grown in YPD medium for 44 hr at 30°C before being photographed. (F) Scatter plot comparing average number of peptides purified in an insoluble fraction from Top1/2-AID cells treated for 20 min with either auxin (y-axis, Auxin) or vehicle (x-axis, Vehicle). Each dot represents a protein, color-coded according to functional group as above (green: RP, red: Hsf1 target gene product, yellow: RiBi protein, gray: others), with some specific proteins indicated by arrows. (G) Gene Ontology and p-values of protein groups that are the most enriched in the insoluble fraction following Top1/2-AID depletion (Δ > 3 peptides in insoluble fraction after topoisomerase depletion compared to vehicle in all experiments, n = 3 biological replicates).
Figure 3—figure supplement 1
Protein localization and transcriptional effecs of Top1, Top2 and Top1/2 depletion.
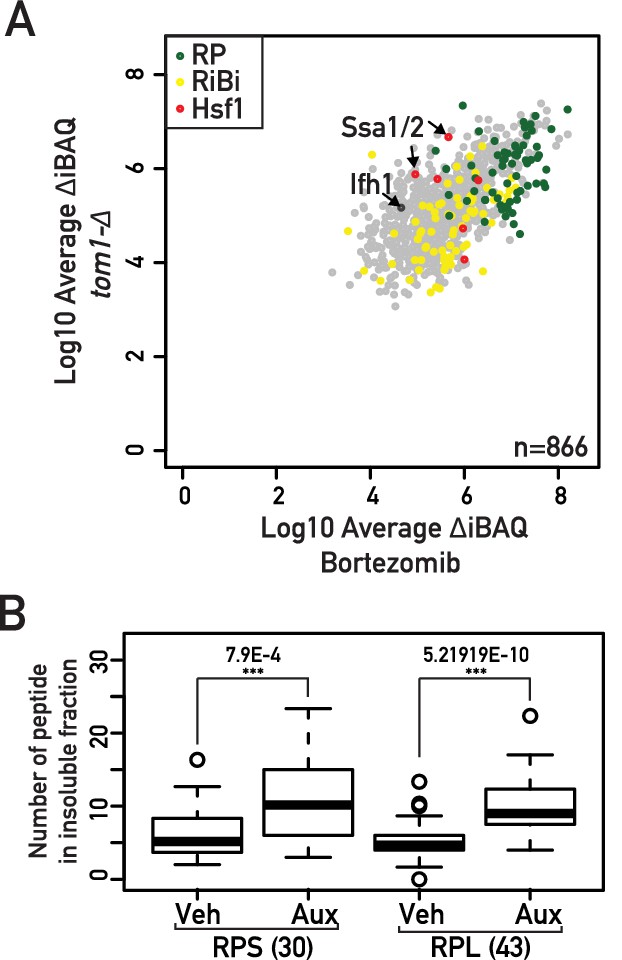
(A) Scatter plot comparing iBAQ abundances (Δ-iBAQ: intensity-Based Absolute Quantification) of peptides recovered from an insoluble fraction of bortezomib-treated wild type (x-axis) or tom1-Δ cells (y-axis). Each dot represents a protein, color-coded according to functional group as above (green: RP, red: Hsf1 target gene product, yellow: RiBi protein, gray: others), with some specific proteins indicated by arrows. Raw data are from Sung et al. (2016a); Sung et al. (2016b). (B) Box plot showing number of peptides corresponding to large (RPL) or small (RPS) ribosomal proteins recovered from insoluble fraction in cells treated for 20 min with either auxin (Aux) or vehicle (Veh).
Figure 4 with 1 supplement
Downregulation of RP gene expression by Ifh1 nuclear depletion prior to RASTR initiation strongly dampens Hsf1 target gene activation.
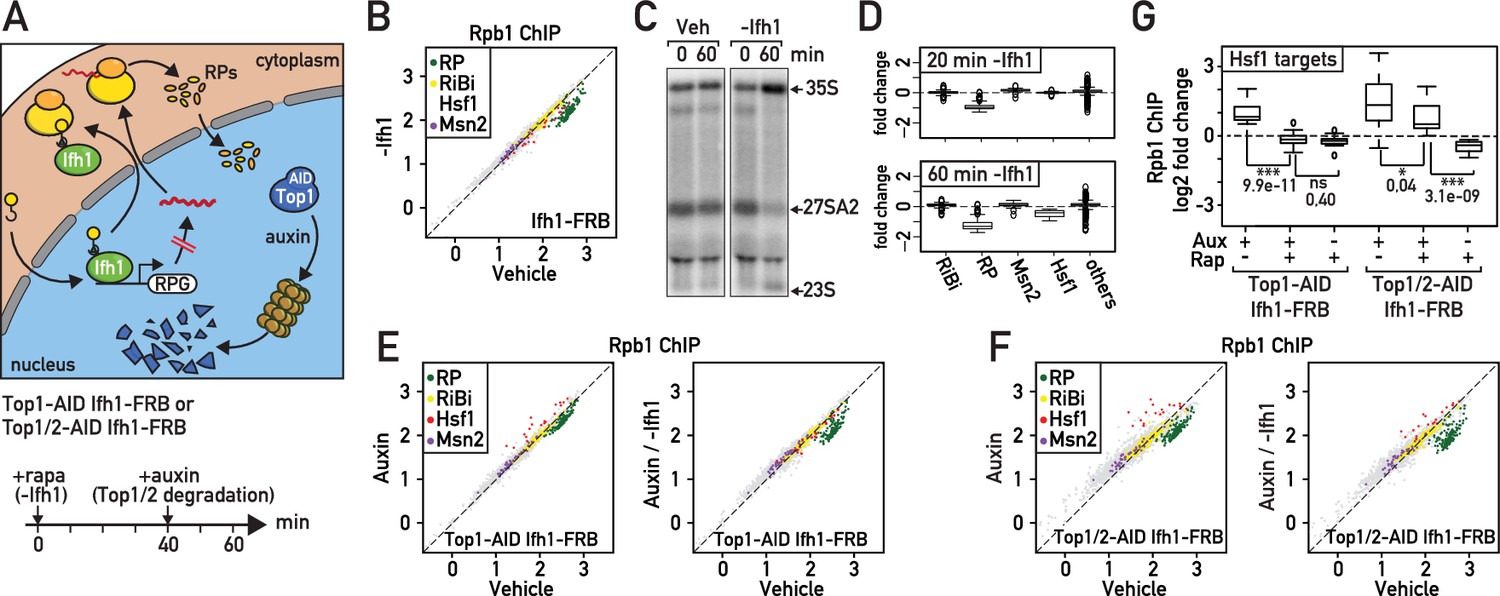
(A) Schematic of protocol for Ifh1-FRB nuclear depletion (0–60 min of rapamycin treatment) followed by Top1-AID or Top1/2-AID degradation (auxin treatment, 40–60 min). (B) Scatter plot comparing RNAPII (Rpb1) ChIP-seq in Ifh1-FRB cells either rapamycin-treated for 60 min (y-axis, -Ifh1, Ifh1-FRB nuclear depletion) or untreated (x-axis, Vehicle, no Ifh1-FRB depletion). Categorization and color coding of genes as above. (C) Northern blots of pre-rRNA after 0 or 60 min of Ifh1-FRB nuclear depletion by anchor-away (-Ifh1) or vehicle (Veh) treatment of Ifh1-FRB strain. (D) Box plots of the data shown in (B) for the indicated five gene categories, showing fold-change upon Ifh1-FRB nuclear depletion compared to mock-treated cells. (E) Scatter plots comparing RNAPII (Rpb1) ChIP-seq in Top1-AID Ifh1-FRB cells either auxin-treated (y-axis, Aux, left panel) or auxin- plus rapamycin-treated (y-axis, Aux / -Ifh1, right panel) treated, as described in (A), versus untreated cells (x-axis, vehicle, both panels). (F) As in (E), but for Top1/2-AID Ifh1-FRB cells. (G) Box plots showing RNAPII (Rpb1) ChIP-seq change after rapamycin and/or auxin treatment for Hsf1 target genes in Top1-AID Ifh1-FRB cells (left) or Top1/2-AID Ifh1-FRB cells (right). Asterisks show significant difference according to student’s t-test (*: p<0.05, ***: p<0.001, ns: Not significant), p-value is indicated.
Figure 4—figure supplement 1
Characterization of Ifh1-FRB Top1-AID Top2-AID and Ifh1-FRB Top1-AID strains, and binding of Ifh1at Hsf1 target and RP gene promoters.
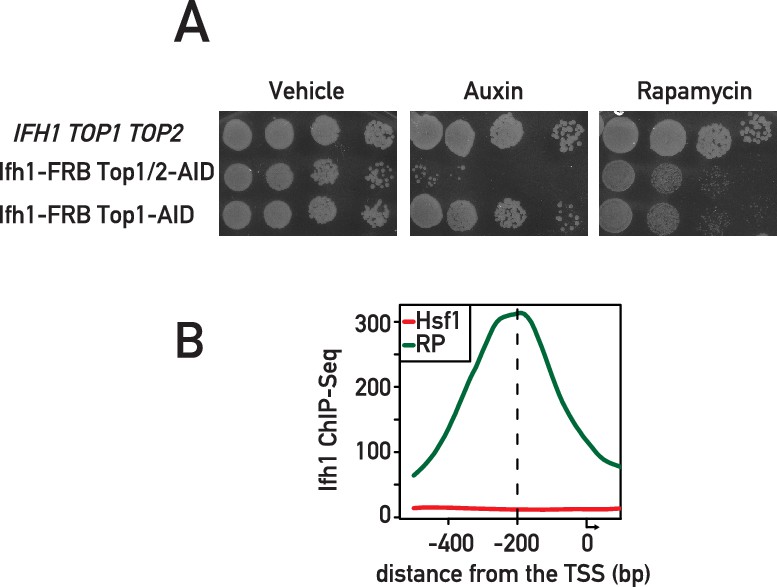
(A) Tenfold serial dilution of anchor away cells background spotted onto rich medium and grown at 30°C for 40 hr with (Auxin, Rapamycin) or without treatment (vehicle). (B) Average Ifh1 ChIP-seq signal related to the TSS at promoters of RP or Hsf1 genes.
Figure 5 with 1 supplement
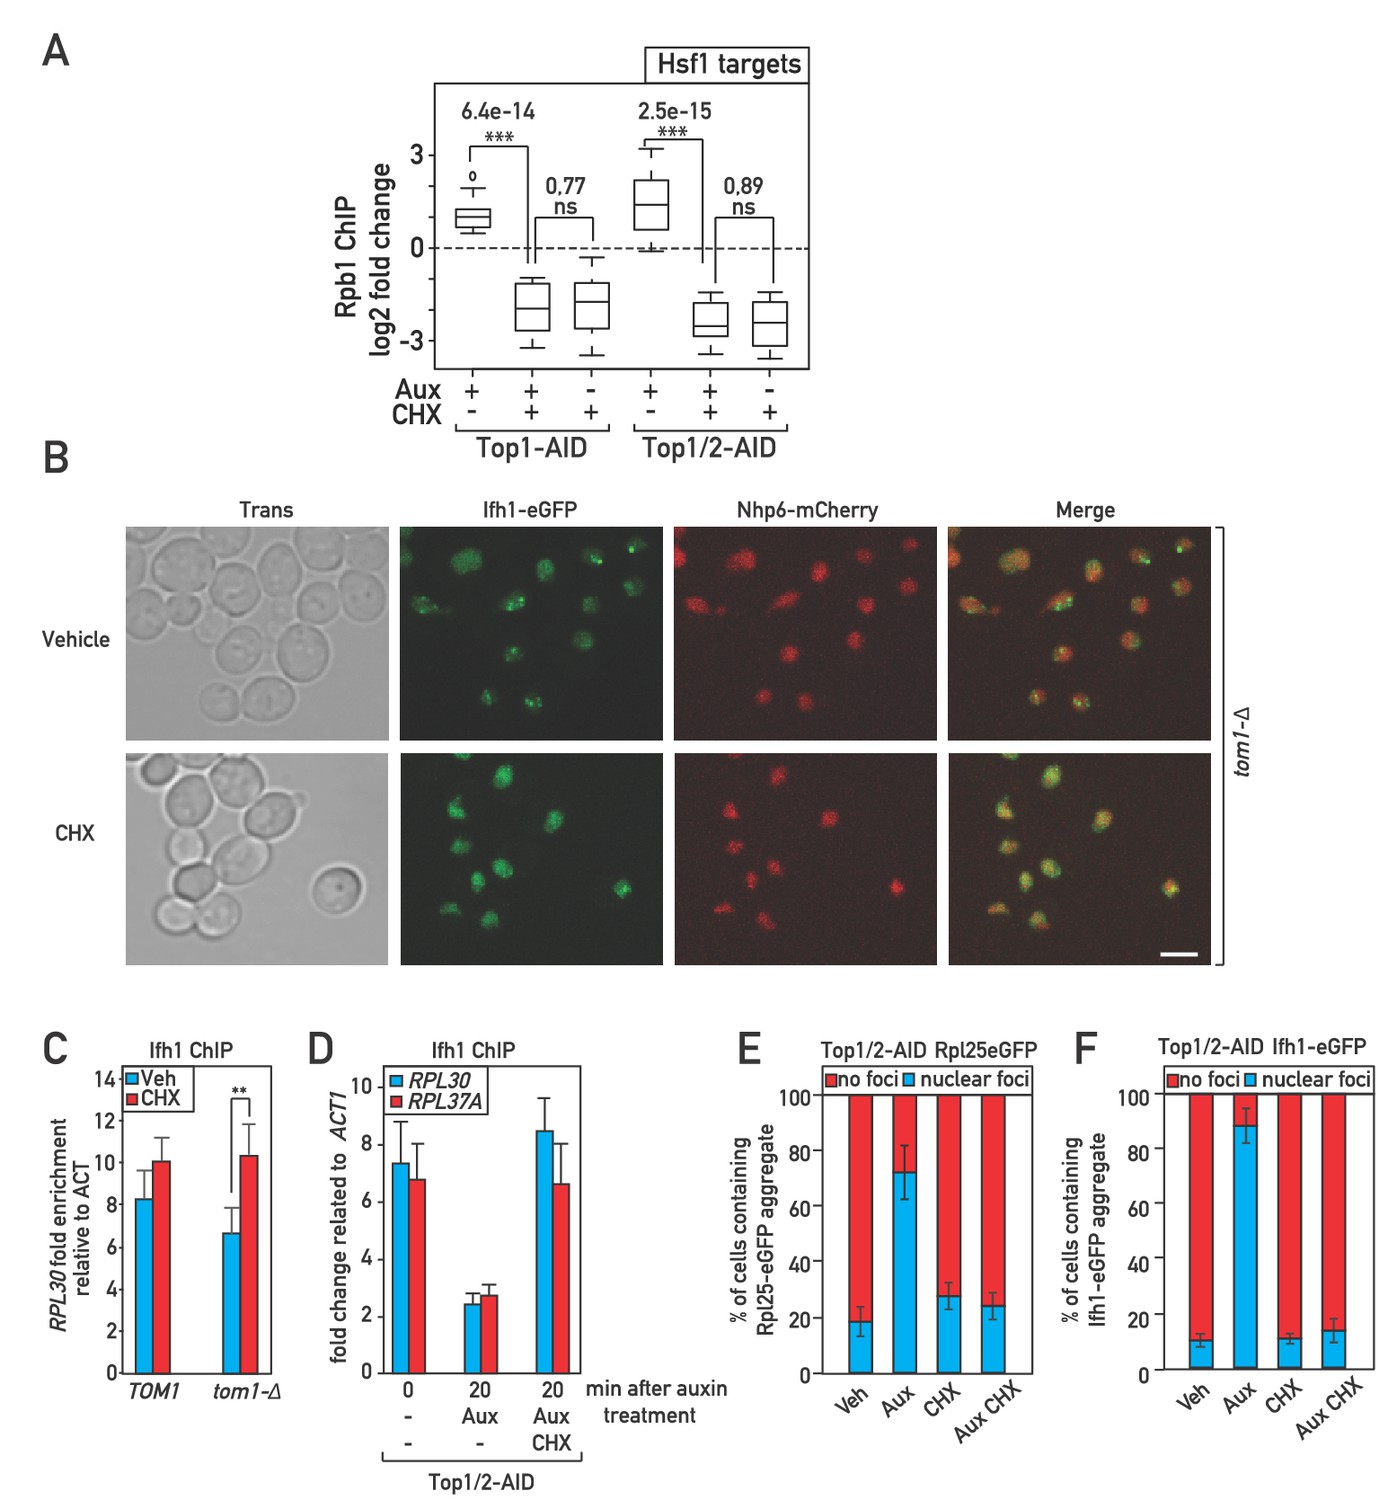
Cycloheximide treatment induces a rapid RNAPII transcriptional response opposite and epistatic to that of RASTR.
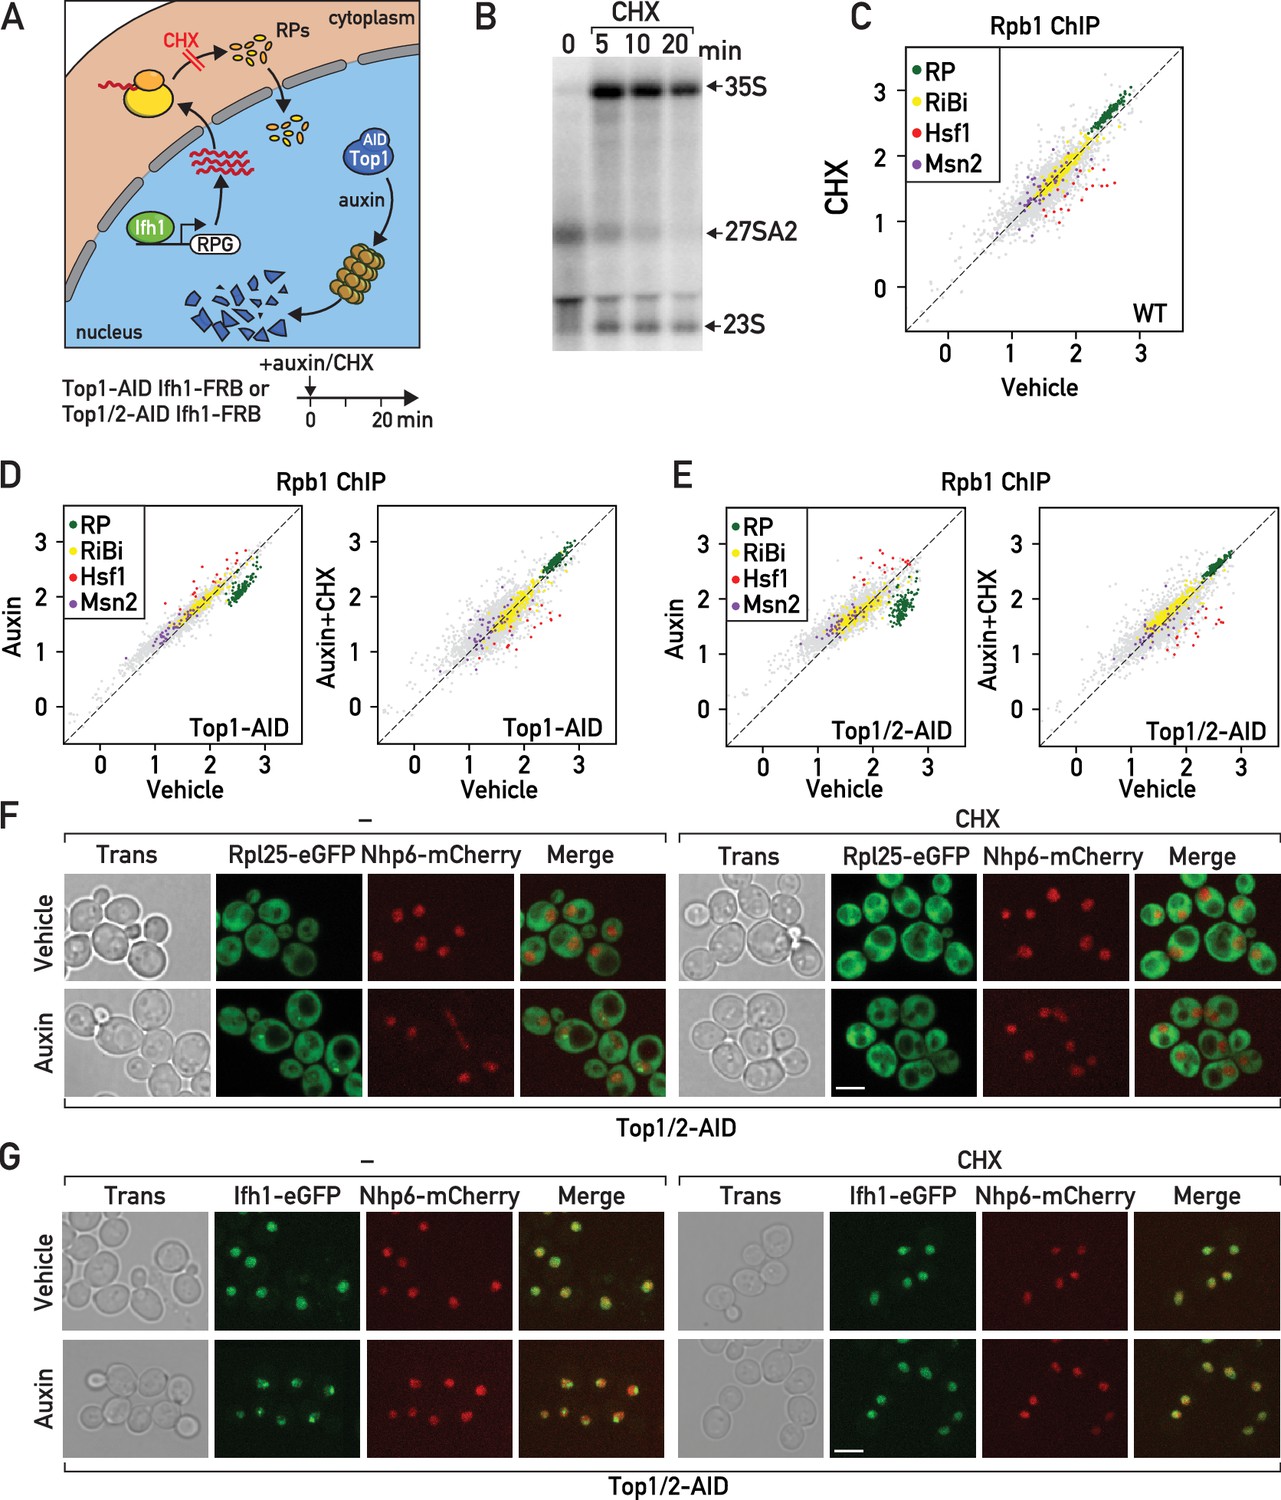
(A) Schematic related to experiments in subsequent panels describing the effect of cycloheximide treatment on de novo RP production and auxin treatment on Top1-AID (or Top1/2-AID) degradation. (B) Northern blots of pre-rRNA after 0, 5, 10, and 20 min of cycloheximide (CHX) treatment. (C) Scatter plot comparing RNAPII (Rpb1) ChIP-seq after 20 min of cycloheximide treatment (y-axis, CHX) to that of non-treated cells (x-axis, vehicle) at the indicated groups of target genes. (D) Scatter plots comparing RNAPII ChIP-seq in auxin-treated to untreated cells (left panel) and in auxin + cycloheximide (CHX)-treated to untreated cells (right panel). In both cases cells express Top1-AID. (E) Scatter plots comparing RNAPII ChIP-seq as in (D), but for Top1/2-AID cells. (F) Box plots showing RNAPII ChIP-seq fold-change for Hsf1 target genes after cycloheximide (CHX) and/or auxin (Aux) treatment of Top1-AID or Top1/2-AID cells, as indicated (data taken from experiments shown in D and E). p-Values are shown above the indicated comparisons together with significance according to student’s t-test (***: p<0.001, ns: not significant). (G–H) Top1/2-AID strains expressing Rpl25-eGFP (G) or Ifh1-eGFP (H) and Nhp6-mCherry were grown exponentially and samples were used for fluorescence microscopy analysis after 20 min of auxin (top) or vehicle treatment (bottom), in the absence (left) or presence (right) of cycloheximide (CHX).
Figure 5—figure supplement 1
Characterization of Ifh1-FRB Top1-AID Top2-AID and Ifh1-FRB Top1-AID strains; binding of Ifh1 at Hsf1 target and RP gene promoters.
(A) Box plots showing RNAPII ChIP-seq fold-change for Hsf1 target genes after auxin (Aux) and/or cycloheximide (CHX) treatment of Top1-AID or Top1/2-AID cells, as indicated. (B) A tom1-Δ strain expressing Ifh1-eGFP and Nhp6-mCherry was grown to mid-exponential phase and cell samples were used for fluorescence microscopy analysis following 20 min of vehicle (top panels) or cycloheximide (CHX; bottom panels) treatment. (C) Ifh1 occupancy at the RPL30 promoter 20 min following cycloheximide (CHX, red) or vehicle (Veh, blue) treatment in wild type (TOM1) or tom1-Δ cells. (D) Ifh1 occupancy at the RPL30 and RPL37A promoters 0 or 20 min following mock or Top1/2-AID depletion (- or Aux) in the presence (CHX) or absence (-) of cycloheximide. (E, F) Numbers of cells where Rpl25-eGFP (E) or Ifh1-eGFP (F) nuclear foci were identified, presented as a percentage. In each experiment 75–100 cells were used for the quantification. Data are reported as averages from two experiments, with standard deviations indicated.
Figure 6
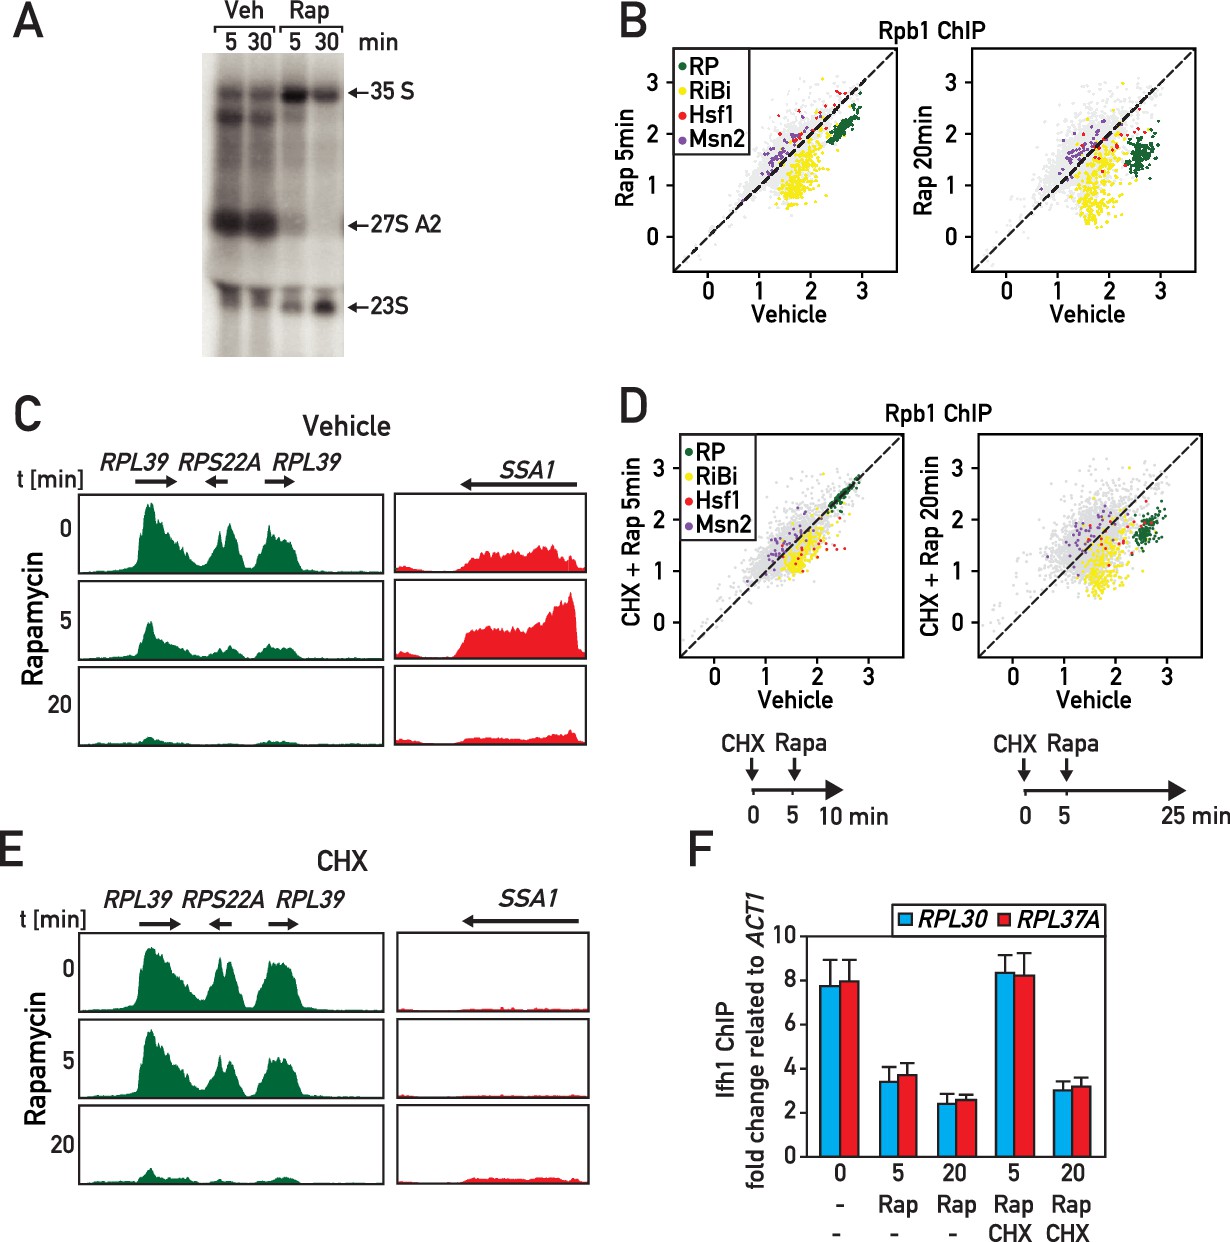
RASTR comprises the cycloheximide-sensitive component of the early RNAPII response to TORC1 inhibition.
(A) Northern blots of pre-rRNA from wild type cells after 5 or 30 min of vehicle (Veh) or rapamycin (Rap) treatment. (B) Scatter plots comparing RNAPII (Rpb1) ChIP-seq in cells after 5 (y-axis, left panel) or 20 min (y-axis, right panel) of rapamycin (Rap) treatment to non-treated cells (x-axis, vehicle). Gene groups are color-coded as indicated. (C) Genome browser tracks showing RNAPII ChIP-seq read counts for three consecutive RP genes on chromosome X (in green, left panel) or at the SSA1 gene on chromosome I (in red, right panel), following 0, 5, or 20 min (top, middle, bottom panels, respectively) of rapamycin treatment. Gene annotations (gene name, open reading frame and direction of transcription) are shown above the tracks. (D) Scatter plots comparing RNAPII ChIP-seq in cells pre-treated with cycloheximide (CHX) then treated for 5 (left panel) or 20 (right panel) minutes with rapamycin to cells untreated (x-axis, vehicle). Schematic representation of the experimental protocols is shown below each panel. Cells were collected for RNAPII ChIP-seq analysis after 5 (left panel) or 20 min (right panel) of rapamycin treatment. (E) Ifh1 occupancy at the RPL30 and RPL37A promoters following 5 or 20 min of rapamycin treatment (Rap) in cells pre-treated or not with cycloheximide (CHX) for 5 min. Bar height indicates the average and error bars the range of N = 4 biological replicates.
Figure 7
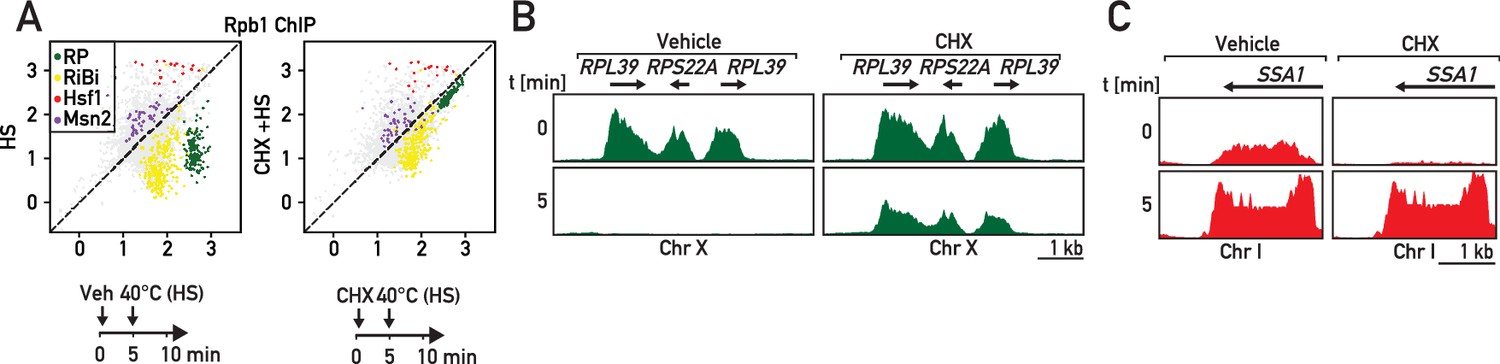
RP gene downregulation following heat shock is blocked by cycloheximide.
(A) Scatter plots comparing RNAPII ChIP-Seq in cells pre-treated or not with cycloheximide (CHX) followed by 5 min of heat shock (y-axis, HS) versus non-stressed cells (x-axis, no HS, no CHX). Schematic of the protocol for each experiment is shown below the data panels: mock pre-treatment (vehicle; 0–5 min) followed by heat shock (HS; 40°C, 5–10 min; left panel) or cycloheximide (CHX) pre-treatment (0–5 min) followed by heat shock (HS; 40°C, 5–10 min; right panel). Samples for ChIP-seq analysis of RNAPII association were taken at 10 min in both experiments. (B, C) Genome browser tracks showing RNAPII ChIP-Seq read counts for the experiments described in (A) on a region on chromosome X containing three consecutive RP genes (in green, B) or at the SSA1 gene on chromosome I (in red, C). Cells were either mock pre-treated (vehicle; left panels) or cycloheximide pre-treated (CHX; right panels) before heat shock (HS). Gene annotations (gene name, open-reading frame and direction of transcription) are shown above the tracks.
Figure 8
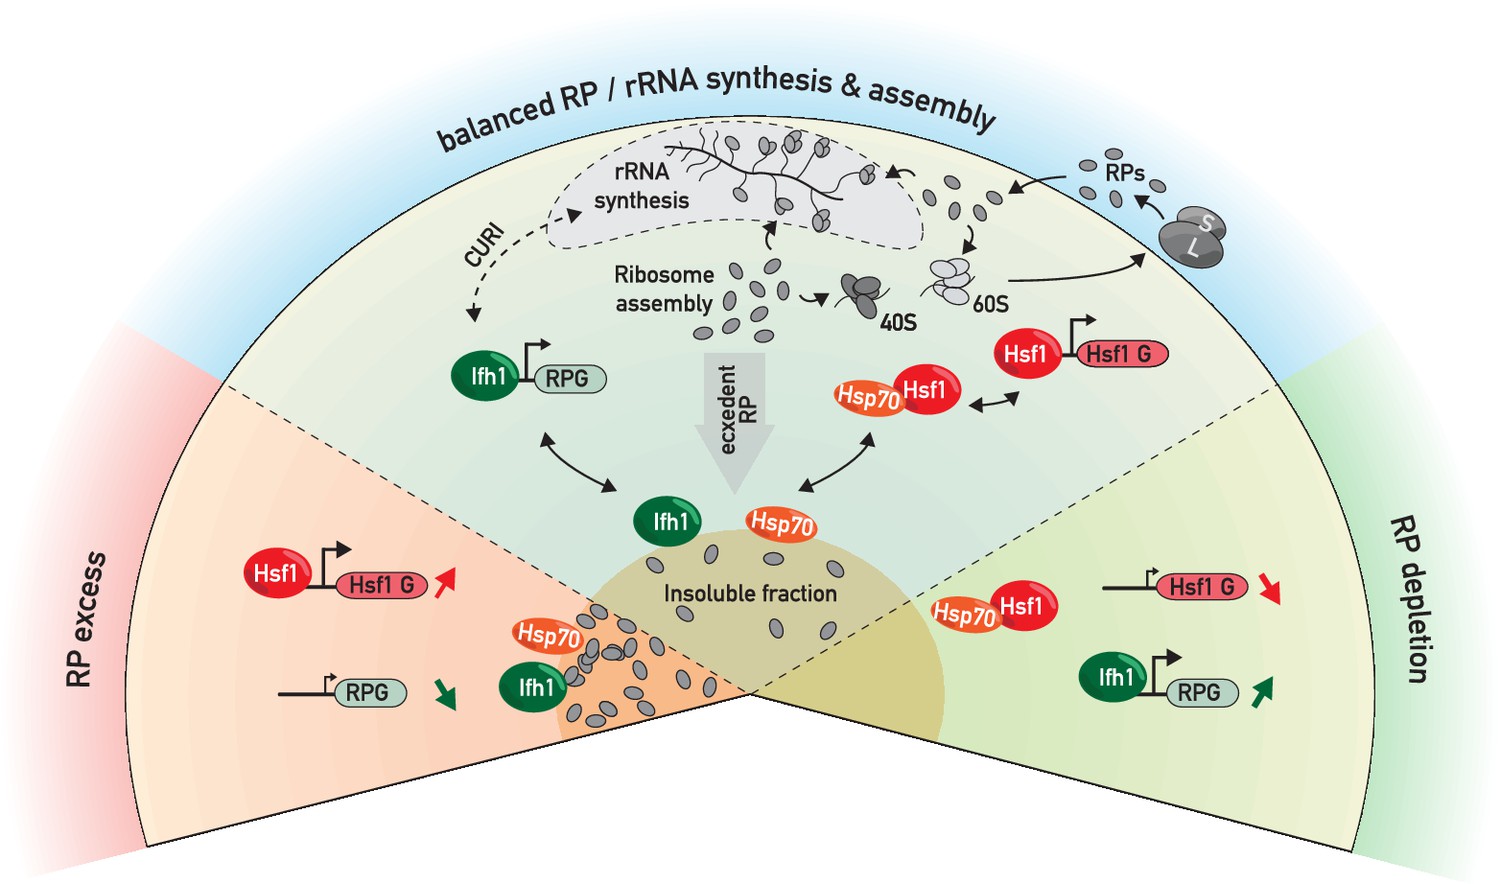
RP and Hsf1 target genes are regulated as a function of unassembled RP levels in both growing and stressed cells.
In rapidly growing, un-stressed cells, RNAPII initiation at RP and Hsf1 target genes is continuously adjusted according to the levels of un-assembled RPs (central sector). Under various stress conditions (including RASTR, heat shock, TORC1 inhibition, perhaps many others), levels of unassembled RPs increase dramatically, and RPs accumulate with nucleolar proteins, Ifh1 and chaperones in an insoluble nuclear or nucleolar fraction. This leads to the rapid upregulation of Hsf1 target genes (e.g. chaperones and proteasome components), presumably through Hsp70 titration, and to the coincident downregulation of RP genes, through Ifh1 sequestration (bottom left sector, ‘RP excess’). Conversely, a decrease in RP production (as provoked here by cycloheximide treatment) will lead to an opposite transcriptional response (bottom right sector, ‘RP depletion’). In summary, we propose that levels of unassembled nuclear RPs act to constantly adjust RP and Hsf1 target gene expression, allowing the cell to balance growth with protein homeostasis.
Tables
Key resources table
| Reagent type | Designation | Source or reference | Identifiers | Additional information |
|---|---|---|---|---|
| Chemical compound, drug | Cycloheximide | Sigma | C7698 | Materials and methods subsection: Yeast strains and growth |
| Chemical compound, drug | Rapamycin | Sigma | R8781 | Materials and methods subsection: Yeast strains and growth |
| Chemical compound, drug | Auxin | Sigma | 1288G | Materials and methods subsection: Yeast strains and growth |
| Chemical compound, drug | Diazaborine | Provided by H Bergler. Zisser et al., 2018 | PMID: 29294095 | Materials and methods subsection: Yeast strains and growth |
| Commercial assay or kit | TruSeq ChIP Sample Preparation Kit | Illumina | IP-202-9001DOC | |
| Antibody, rabbit polyclonal | Anti-RNA polymerase II CTD repeat YSPTSPS (phospho S5) | Abcam | ab5131 | Rabbit polyclonal; (1 ug per ChIP (50 ml OD = O0.5) |
| Antibody, rabbit polyclonal | Anti-Rap1 | N/A Schawalder et al., 2004 (PMID:15616569) | RRID: AB_2801428 | Rabbit polyclonal; (5 ul per ChIP (50 ml OD = O0.5) |
| Antibody | Anti-Rpl3 | Provided by Warner, 1977. | PMID: 9121443 | Results, Figure 5. Mouse monoclonal; 1:10 000 |
| Antibody | Anti-Rpl6 | Provided by O Gadal | Rabbit polyclonal; 1:10 000 | |
| Antibody | Anti-Rps8 | Provided by G Dieci | Rabbit polyclonal; 1:10 000 | |
| Antibody, rabbit polyclonal | antibody Ifh1 | N/A (Knight et al., 2014) PMID: 25085421 | AB_2801429 | Rabbit polyclonal (2 ul per ChIP (50 ml OD = O0.5) |
| Antibody, rabbit polyclonal | Antibody Fhl1 | N/A (Knight et al., 2014) PMID: 25085421 | AB_2801431 | Rabbit polyclonal (2 ul per ChIP (50 ml OD = O0.5) |
| Strain, strain background | Saccharomyces cerevisiae, W303 | W303: MATa/MATα leu2-3,112 trp1-1 can1-100 ura3-1 ade2-1 his3-11,15 | Thomas & Rothstein, 1989. PMID: 2645056. Experimental procedures, Strains. Table 1. | See Supplementary file 7 |
| Other | Primary sequence files | GEO | accession number GSE125226 | Materials and methods subsection: Plasmid construction |
| Recombinant DNA reagent | pFA6a-link-GFPEnvy-SpHis5 (plasmid) | Addgene | RRID: Addgene_60782 | Materials and methods subsection: Plasmid construction |
| Recombinant DNA reagent | RPL25-envyGFP-plasmid | This paper | Plasmid #1037 | Materials and methods subsection: Plasmid construction |
| Recombinant DNA reagent | pRS315-RPL25-eGFP | Milkereit et al. (2001) PMID: 11313466 | Materials and methods subsection: Plasmid constructions |
Additional files
-
Supplementary file 1
Rpb1 ChIP-seq at the indicated times following either auxin or vehicle addition to the media in Top1-AID, Top2-AID or Top1-AID Top2-AID strain.
- https://doi.org/10.7554/eLife.45002.016
-
Supplementary file 2
Rpb1 ChIP-seq at the indicated times following either auxin (Aux), vehicle (veh), diazaborine (Diaz), or cycloheximide (CHX) addition to the media.
- https://doi.org/10.7554/eLife.45002.017
-
Supplementary file 3
Number of peptides purified in an insoluble fraction from Top1/2-AID cells treated for 20 min with either auxin or vehicle.
- https://doi.org/10.7554/eLife.45002.018
-
Supplementary file 4
Rpb1 ChIP-seq in Top1-AID Ifh1-FRB or Top1-AID Top2-AID Ifh1-FRB cells following either auxin, auxin plus rapamycin, or rapamycin addition to the media.
- https://doi.org/10.7554/eLife.45002.019
-
Supplementary file 5
Rpb1 ChIP-seq in Top1-AID or Top1/2-AID cells following either auxin, auxin plus cycloheximide, or vehicle addition to the media.
- https://doi.org/10.7554/eLife.45002.020
-
Supplementary file 6
Rpb1 ChIP-seq in wild type cells following either Vehicle (Veh) or Rapamycin (Rap) addition, Cycloheximide pre-treatment (CHX), or Heat Shock at 40°C (Heat Shock).
- https://doi.org/10.7554/eLife.45002.021
-
Supplementary file 7
Yeast strains used in this study.
- https://doi.org/10.7554/eLife.45002.022
-
Supplementary file 8
DNA primers used in this study.
- https://doi.org/10.7554/eLife.45002.023
-
Transparent reporting form
- https://doi.org/10.7554/eLife.45002.024
Download links
A two-part list of links to download the article, or parts of the article, in various formats.
Downloads (link to download the article as PDF)
Open citations (links to open the citations from this article in various online reference manager services)
Cite this article (links to download the citations from this article in formats compatible with various reference manager tools)
A ribosome assembly stress response regulates transcription to maintain proteome homeostasis
eLife 8:e45002.
https://doi.org/10.7554/eLife.45002


