Impaired ABCA1/ABCG1-mediated lipid efflux in the mouse retinal pigment epithelium (RPE) leads to retinal degeneration
- University of Zurich, Switzerland
- Radboud University Medical Center, Netherlands
- University Hospital Zurich, Switzerland
- University of Florida, United States
- Roche Innovation Center Basel, F Hoffmann-La Roche Ltd., Switzerland
- University of Pennsylvania, United States
- University of Tübingen, Germany
Figures
Figure 1 with 2 supplements
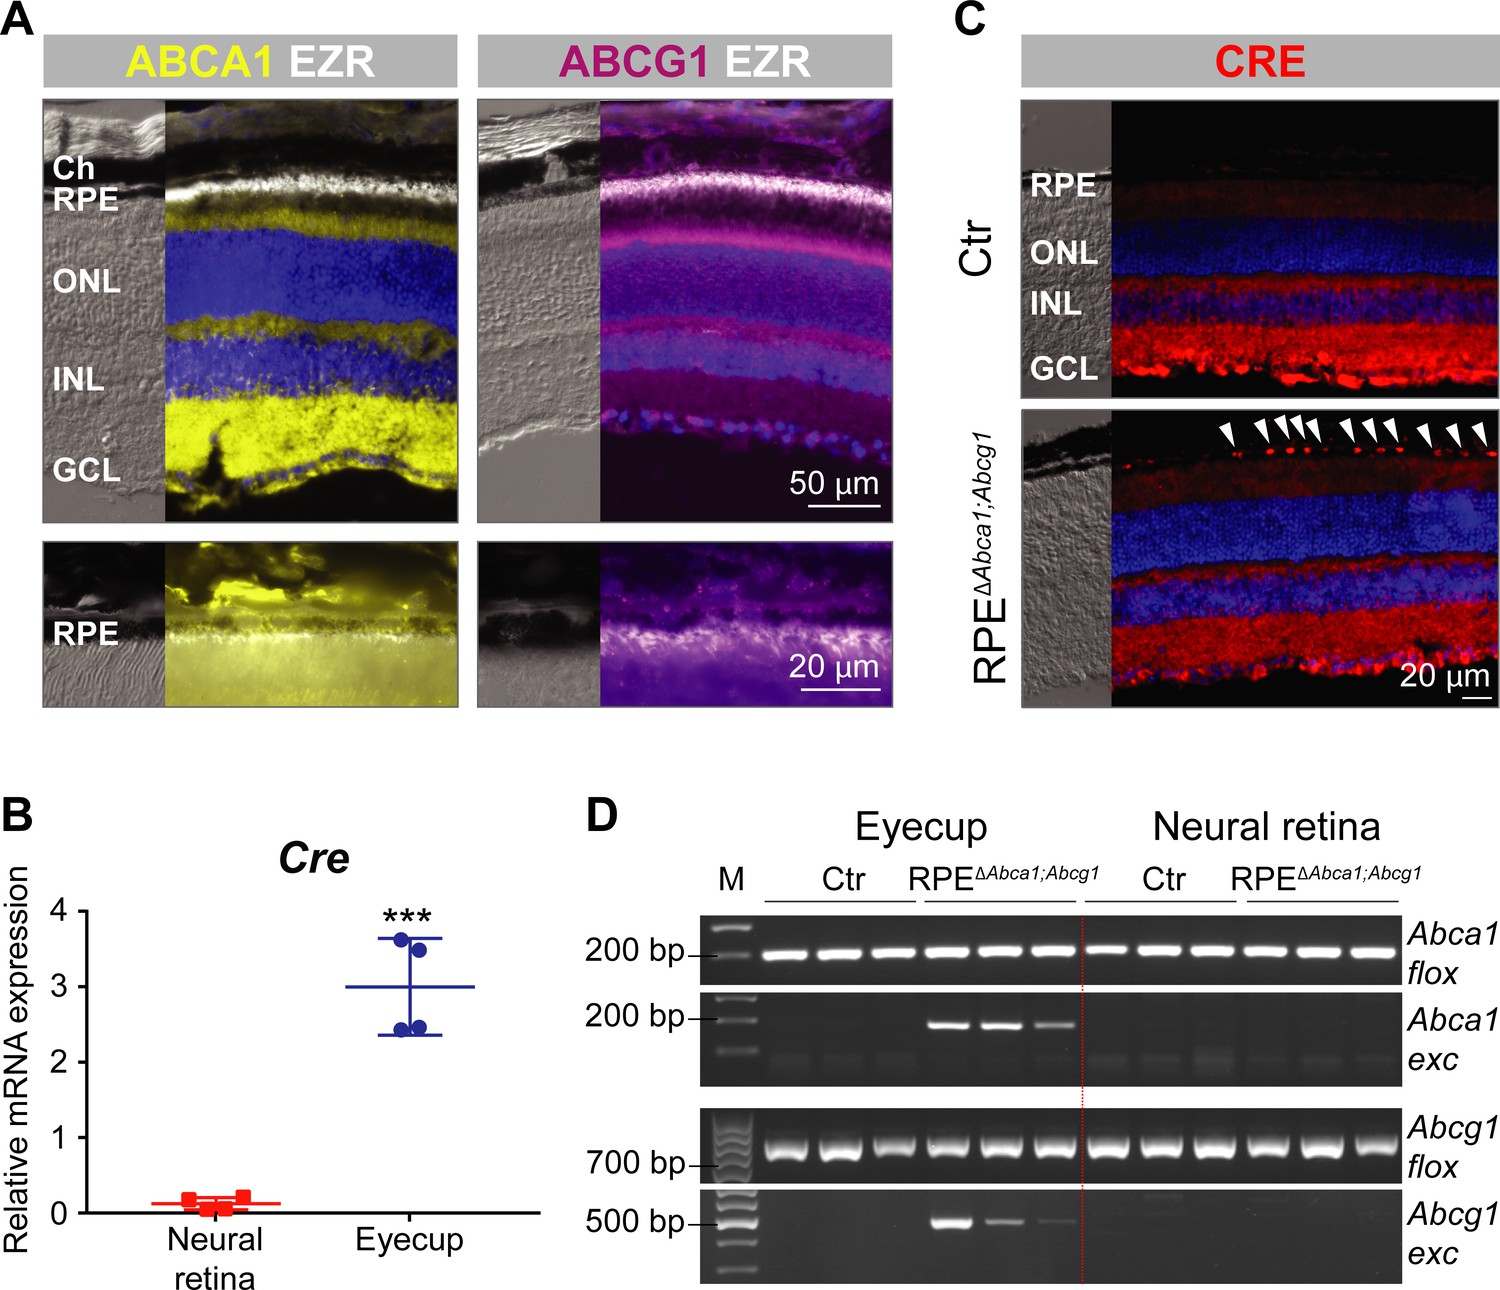
Generation of RPEΔAbca1;Abcg1 mice.
(A) IF staining for ABCA1 (yellow), ABCG1 (violet) and the RPE apical marker EZR (white) in retinas of 2-months-old wt mice. Lower panels show magnification of the RPE layer. Nuclei were counterstained with DAPI (blue). Ch: choroid; RPE: retinal pigment epithelium; ONL: outer nuclear layer; INL: inner nuclear layer; GCL: ganglion cell layer. (B) Cre mRNA levels were measured by semi-quantitative real-time PCR in neural retinas and eyecups (RPE/choroid) from 2-months-old RPEΔAbca1;Abcg1 mice. Shown are data from individual samples and means ± standard deviations (SD, N = 4). Statistics: Student’s t-test; ***: p<0.001. (C) IF staining for CRE (red) in retinal sections from 2-months-old Ctr and RPEΔAbca1;Abcg1 mice: white arrowheads indicate CRE-positive nuclei in the RPE of mutant mice. Nuclei were counterstained with DAPI (blue). Note the non-specific signal in the inner retina. Representative pictures of N = 6 mice. (D) Detection of CRE-mediated excision fragments in Abca1 and Abcg1 (Abca1/Abcg1 exc) by conventional PCR on genomic DNA from eyecups and neural retinas of Ctr and RPEΔAbca1;Abcg1 mice (N = 3). For this picture, animals showing heterozygous deletion of Abca1/Abcg1 in ear biopsies (see ‘Materials and methods’) were excluded in order to detect excision truly due to CRE expression in the eye. PCR for the floxed sequences (Abca1/Abcg1 flox) was performed as positive control. Shown are PCR products run on a 2% agarose gel and visualized with ethidium bromide. Note the lack of the excised fragment in the neural retina. M: DNA size marker, indicated fragment sizes are shown in base pairs (bp).
Figure 1—figure supplement 1
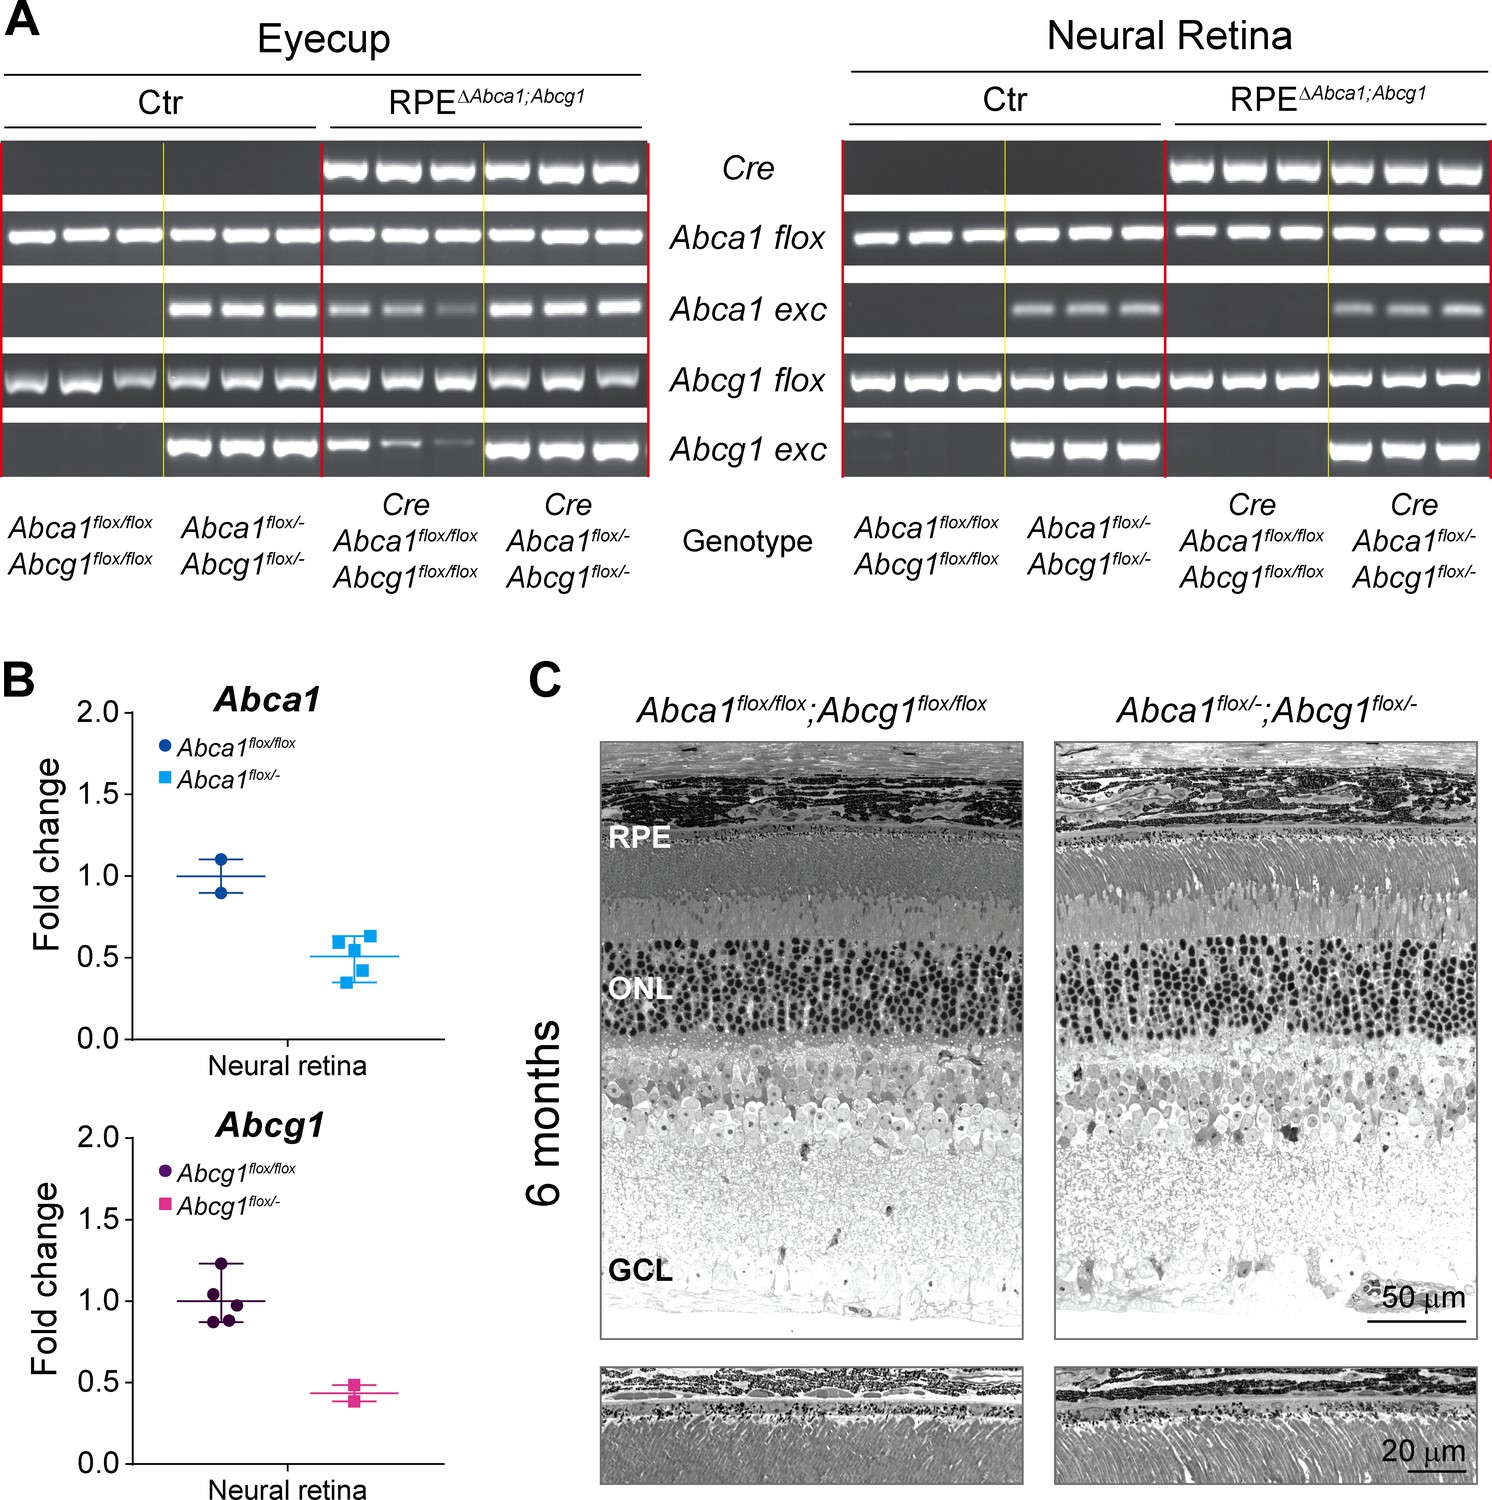
Genotyping and definition of the mouse models.
(A) PCRs for Cre transgene, Abca1 floxed (flox) and excised (exc) alleles, and Abcg1 floxed and excised alleles were performed on genomic DNA extracted from eyecups and neural retinas of 2-months-old Ctr and RPEΔAbca1;Abcg1 mice. Shown are PCR products run on a 2% agarose gel and visualized with ethidium bromide. Same results as for the neural retinas were obtained using ear biopsies (not shown), suggesting occasional presence of heterozygous systemic excision of Abca1 and Abcg1 floxed sequences. Definition of the genotypes is shown below the gel images (N = 3 per group). See Table 1 for definition of strain names based on the genotype. (B) Abca1 and Abcg1 mRNA levels were measured by semi-quantitative real-time PCR in neural retinas of 2-months-old flox/flox and flox/- mice. Shown are data from individual samples and means ± range of the fold change on flox/flox genotype average (N = 2–5). (C) Retinal morphology of 6-months-old Abca1floxflox;Abcg1flox/flox and Abca1flox/-;Abcg1flox/- mice. Lower panels show higher magnification images of the RPE. Shown are representative images of N = 3 animals per group. Abbreviations as in Figure 1.
Figure 1—figure supplement 2
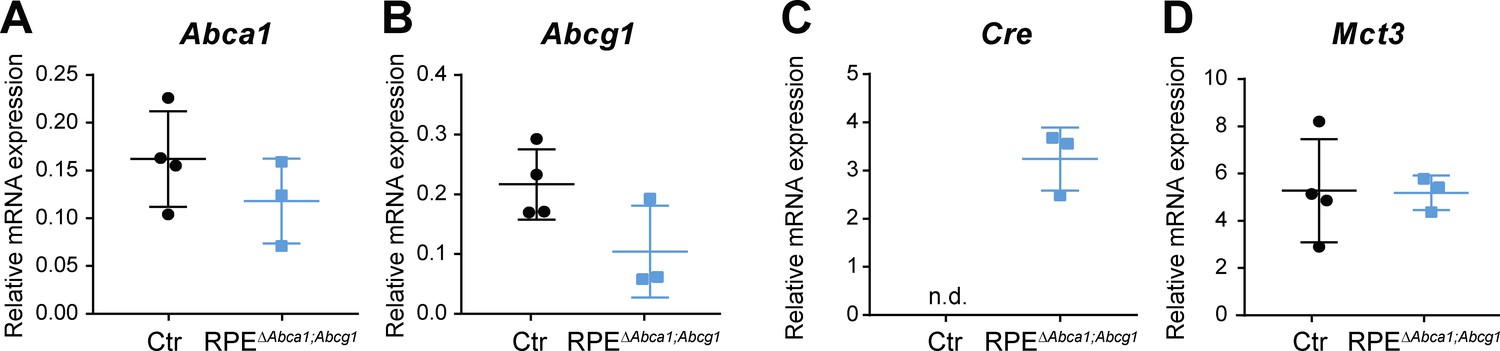
Gene expression in eyecups of Ctr and RPEΔAbca1;Abcg1 mice.
Abca1 (A), Abcg1 (B), Cre (C) and Mct3 (D) mRNA levels were measured by semi-quantitative real-time PCR in eyecups of 2-months-old Ctr and RPEΔAbca1;Abcg1 mice. Shown are data from individual samples and means ± SD (N = 3–4). n.d.: not detected.
Figure 2
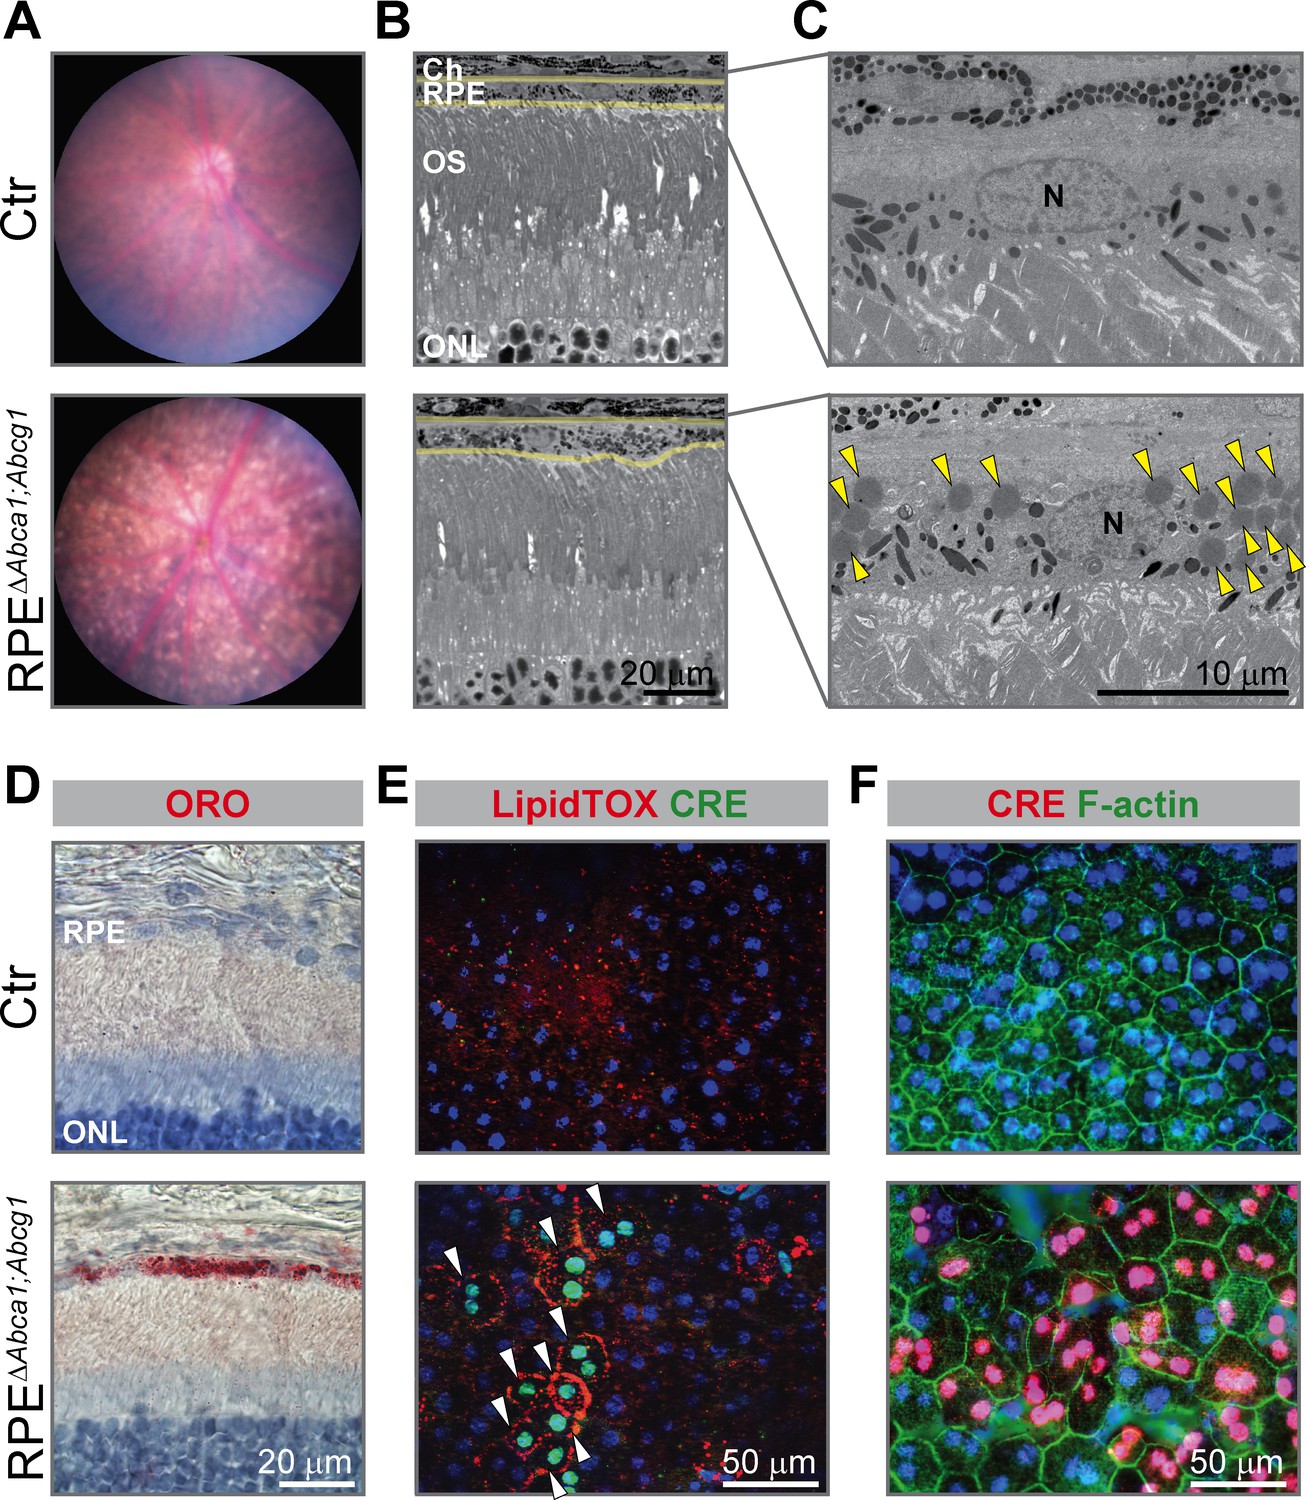
Early morphological alterations and intracellular lipid accumulation in RPEΔAbca1;Abcg1 mice.
(A) Fundus imaging of 2-months-old Ctr and RPEΔAbca1;Abcg1 mice showing altered pigmentation pattern in mutant mice. Corresponding retinal morphology analyzed by light (B) and electron (C) microscopy revealed alterations of the RPE in RPEΔAbca1;Abcg1 mice. Yellow lines in (B) indicate RPE borders. Yellow arrowheads in (C) indicate lipid droplets. OS: outer segments; N: nucleus. (D) Retinal sections were stained with ORO (red, dye for neutral lipids); nuclei were counterstained with hematoxylin (blue). RPE flat mounts were stained with LipidTOX (red, dye for neutral lipids) and anti-CRE (green) (E) or anti-CRE (red) and phalloidin (green, staining actin filaments) (F). Nuclei were counterstained with Hoechst. White arrowheads indicate CRE-positive cells showing lipid accumulation in mutant mice. Representative pictures of N ≥ 3 animals per group. Abbreviations as in Figure 1.
Figure 3 with 2 supplements
Effect of lipid accumulation in the ageing mouse RPE.
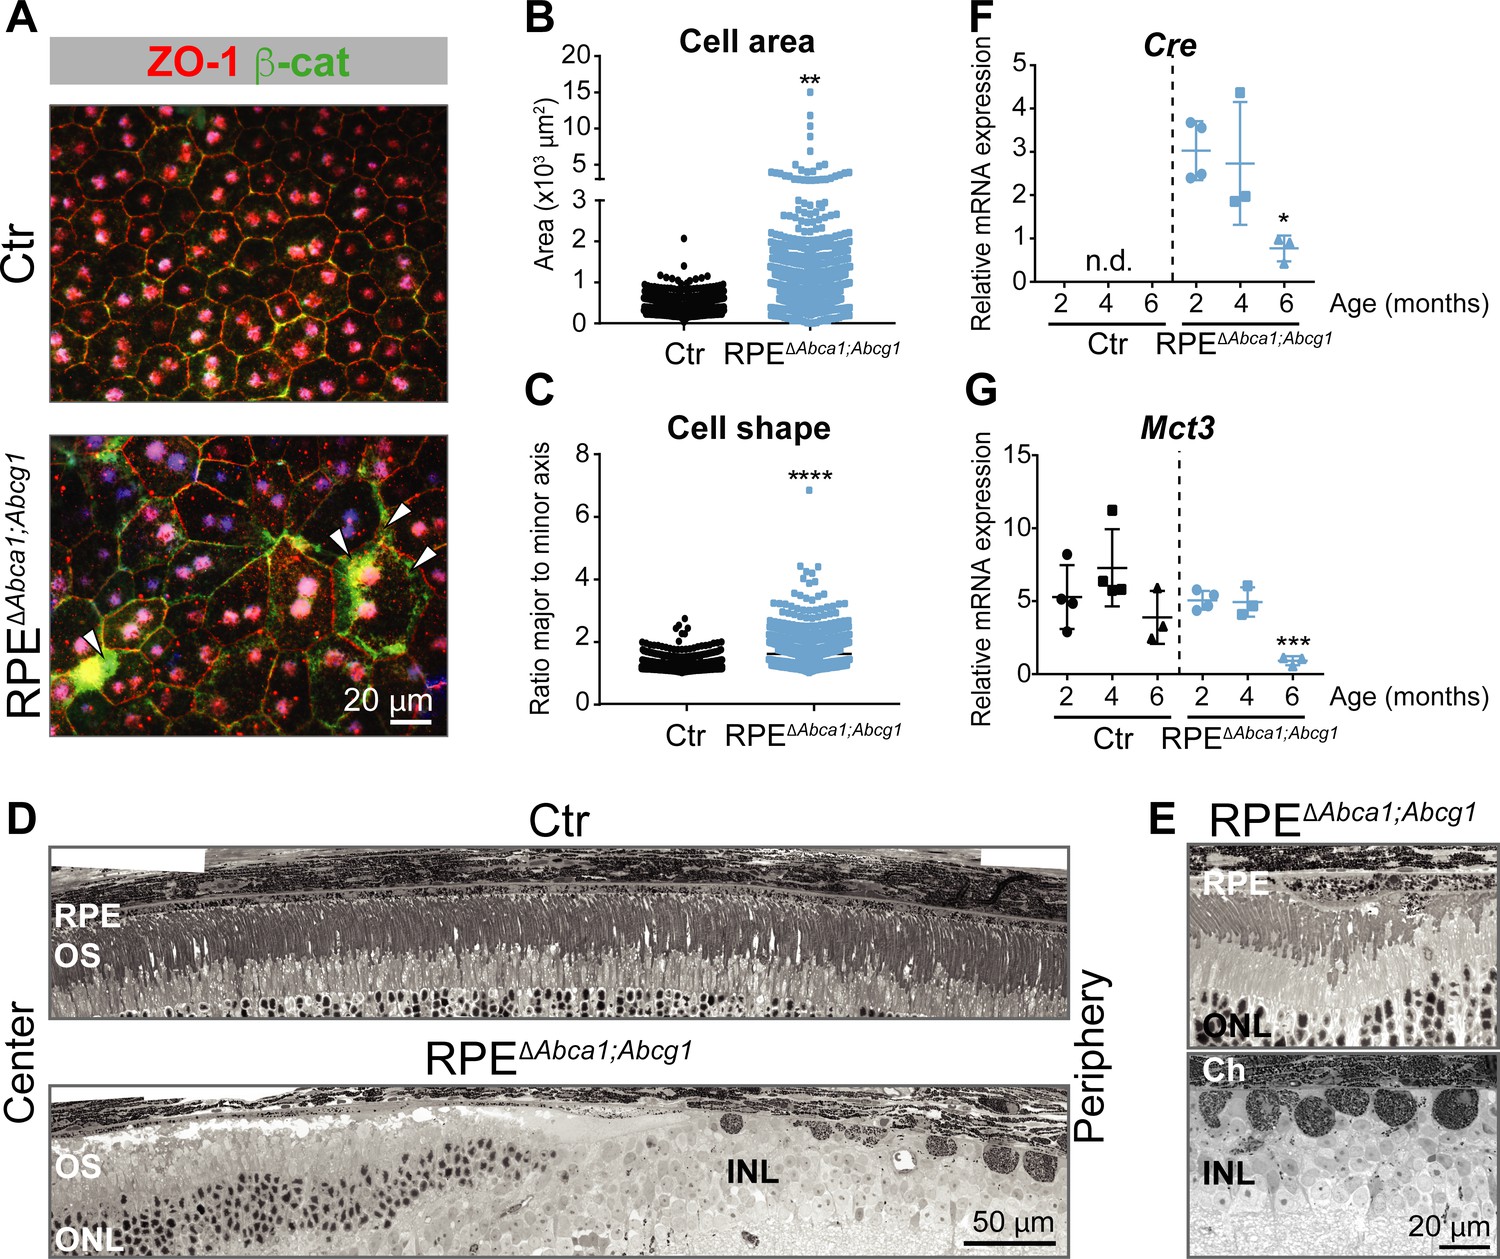
(A) RPE flat mounts from 4-months-old Ctr and RPEΔAbca1;Abcg1 mice were stained for ZO-1 (red) and β-cat (green). White arrowheads indicate loss of co-localization between ZO-1 and β-cat in mutant RPE. Nuclei were counterstained with Hoechst. Shown are representative images of N = 3 animals per group. Quantification of cell area (B) and cell shape (C) was performed using ImageJ on images from ZO-1 stained flat mounts. Corresponding measurements of single analyzed cell can be found in Figure 3—source data 1. Statistics: Mann-Whitney test; **: p<0.01, ****: p<0.0001. Light microscopy was used to visualize outer retinas of control and RPEΔAbca1;Abcg1 mice: shown are panoramas (D) and RPE at higher magnification (E). Representative images of N ≥ 3 animals per group. Cre (F) and Mct3 (G) mRNA levels were measured by semi-quantitative real-time PCR in eyecups from Ctr and RPEΔAbca1;Abcg1 mice at the indicated ages. Shown are data from individual samples and means ± SD (N = 3–4). Statistics: one-way ANOVA vs ‘2 months’ of the respective genotype; *: p<0.05, ***: p<0.001. n.d.: not detected. Abbreviations as in Figure 1.
-
Figure 3—source data 1
RPE cell Area and shape of RPE cells in RPE∆Abca1;Abcg1 and control mice.
- https://doi.org/10.7554/eLife.45100.010
Figure 3—figure supplement 1

Cre expression in RPEΔAbca1;Abcg1 and BEST1Cre mice.
Cre mRNA levels were measured by semi-quantitative real-time PCR in eyecups of 2- and 6-months-old RPEΔAbca1;Abcg1 and BEST1Cre mice. Shown are data from individual samples and means ± SD of the fold change on the corresponding "2 months" average (N = 3–4). Statistics: Student’s t-test vs ‘2 months’ of the respective genotype; **: p<0.01.
Figure 3—figure supplement 2
Absence of retinal phenotype in BEST1Cre mice up to 6 months of age.
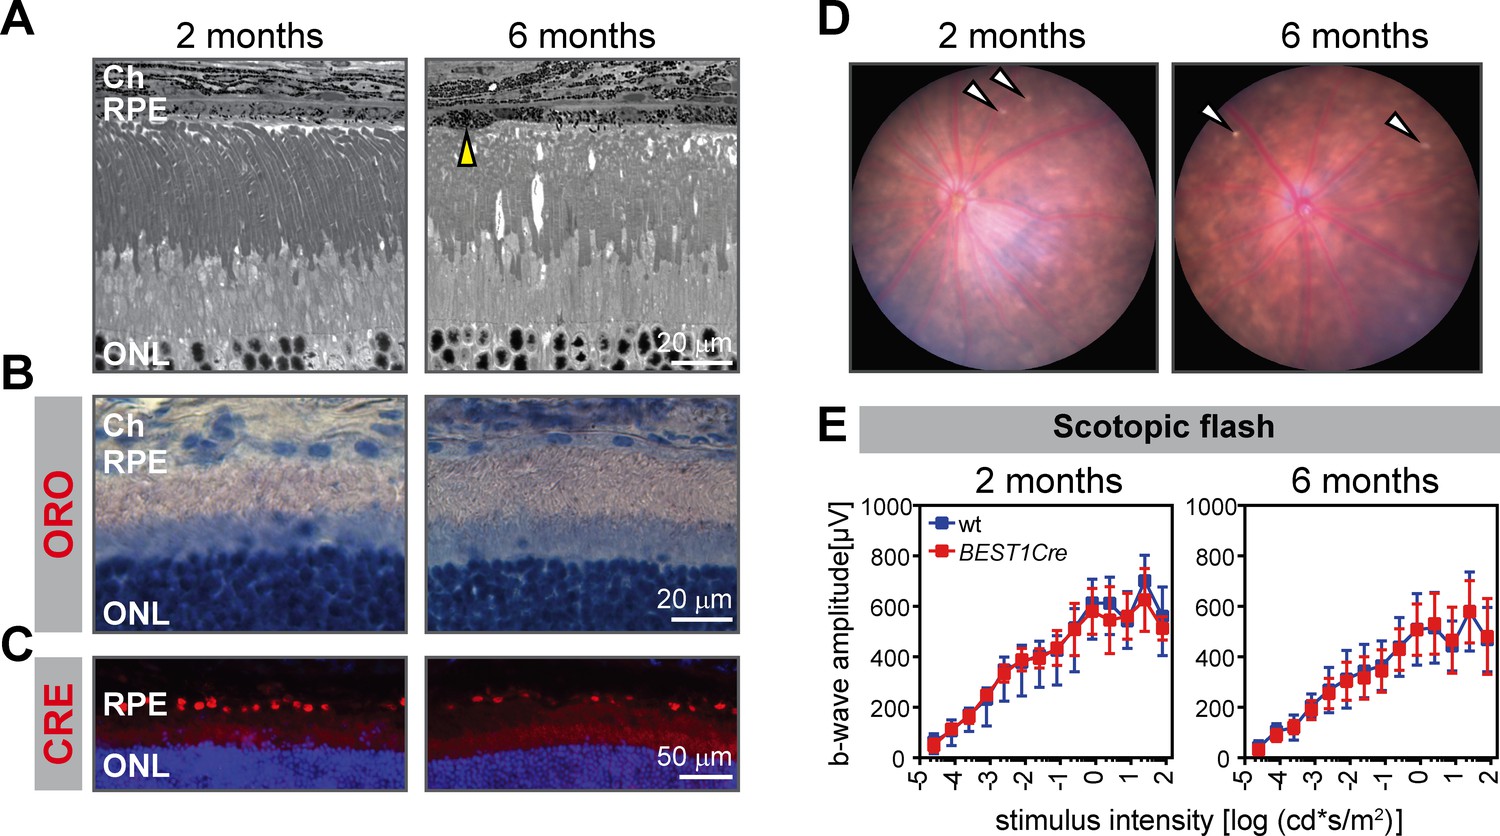
(A) Retinal morphology was analyzed by light microscopy in 2- and 6-months-old BEST1Cre animals. Yellow arrowhead indicates an example of occasionally observed minor alterations in the RPE. Retinal sections of BEST1Cre mice at indicated ages were stained for lipids (B) and CRE (C). Nuclei were counterstained with hematoxylin (B) or DAPI (C). (D) Occasional bright spots were observed in the fundus of BEST1Cre mice (indicated by white arrowheads). Representative images of N ≥ 3 animals per group. (E) ERG recordings of BEST1Cre and age-matched wild type animals. Shown are means ± SD (N = 3–9) of scotopic b-wave amplitudes. Abbreviations as in Figure 1.
Figure 4
Lipid accumulation after AAV-mediated excision of Abca1 and Abcg1 in adult RPE.
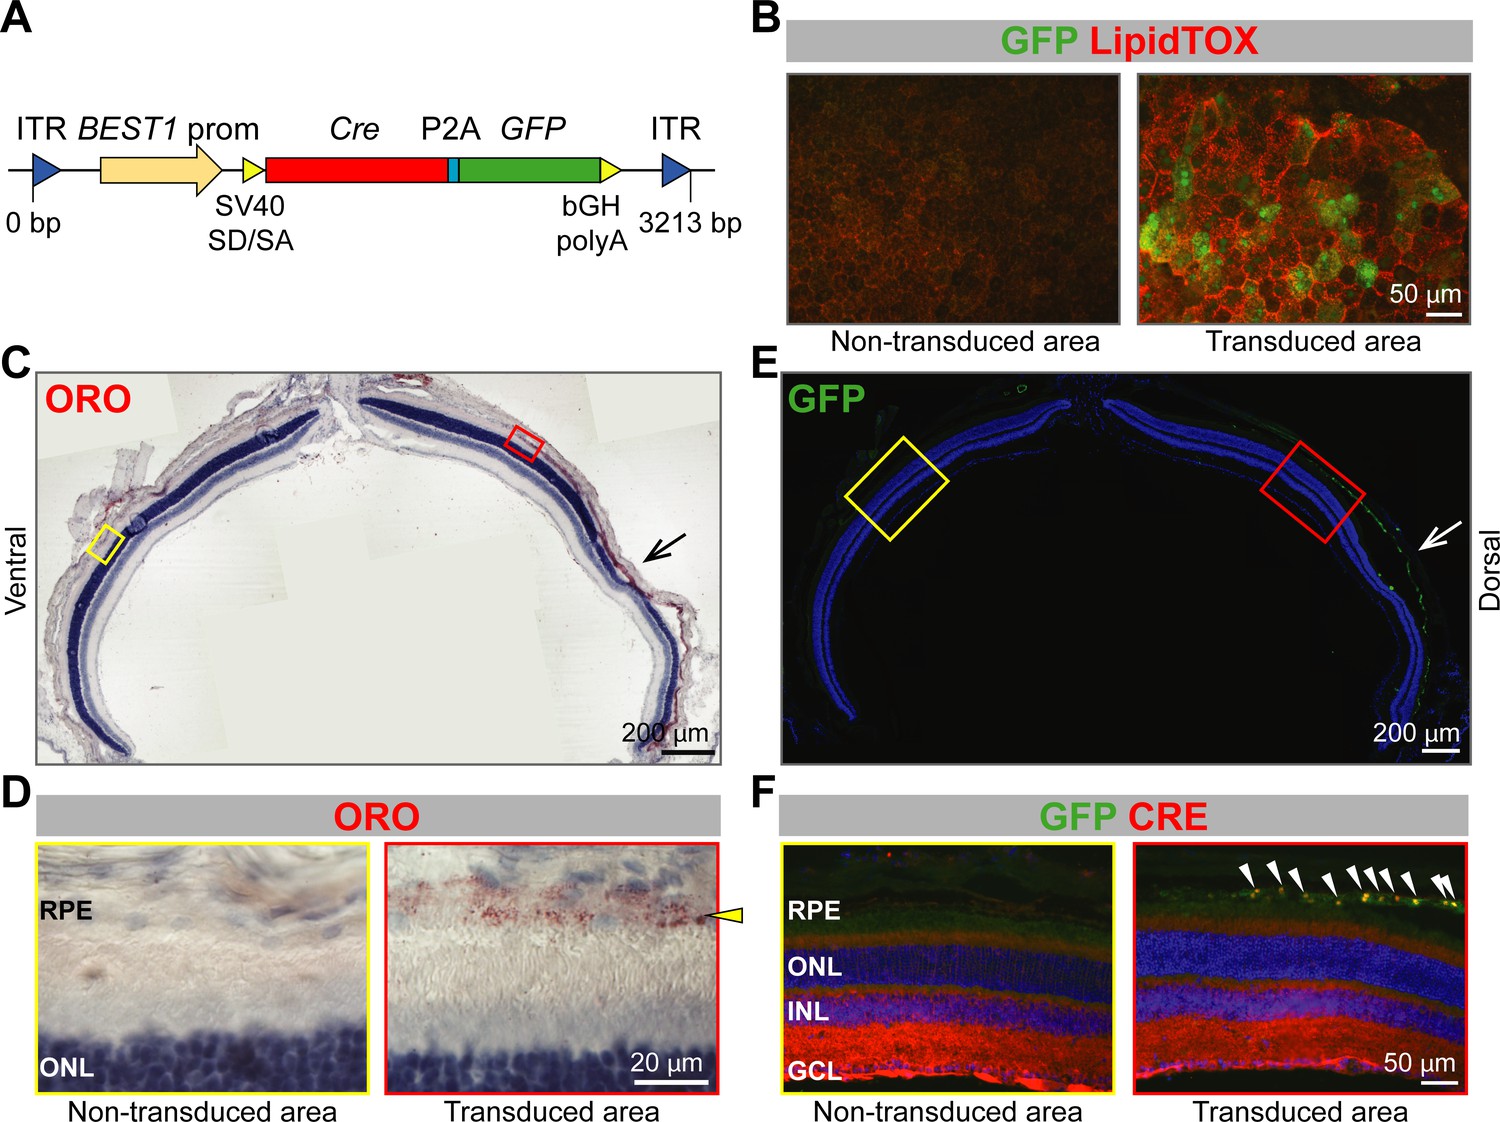
(A) Schematic representation of the vector packaged into AAV4 capsid in order to express Cre and GFP specifically in the RPE of Abca1flox/flox;Abcg1flox/flox mice. Length of the construct in base pairs is shown below the map. ITR: inverted terminal repeat; SV40 SD/SA: simian virus 40 splice donor/splice acceptor site; P2A: porcine teschovirus 2A; bGH polyA: bovine growth hormone polyadenylation tail. 10 weeks after sub-retinal injections, co-localization of AAV-mediated Cre/GFP expression and lipid accumulation was analyzed by IF in RPE flat mounts (B) and retinal sections (C–F). (B) RPE flat mounts were stained with LipidTOX (red); shown are representative images of a non-transduced and a transduced area. Dorsal-ventral retinal sections were stained with ORO: retina panorama is shown in (C) and magnified images of a non-transduced and a transduced area (corresponding to yellow and red rectangles in the panorama) are shown in (D). Yellow arrowhead indicates LDs in the transduced RPE. Nuclei were counterstained with hematoxylin (blue). Consecutive retinal sections were analyzed for AAV transduction by IF: retinal panorama is shown in (E) and magnified pictures of a non-transduced and a transduced area (corresponding to yellow and red rectangles in the panorama) are shown in (F), together with CRE staining. White arrowheads indicate CRE-positive nuclei in the transduced RPE. Nuclei were counterstained with DAPI (blue). Black (C) and white (E) arrows indicate the injection site. Representative pictures of N ≥ 3 animals per group. Abbreviations as in Figure 1.
Figure 5
Cholesteryl esters as main components of LDs in the RPE of RPEΔAbca1;Abcg1 mice.
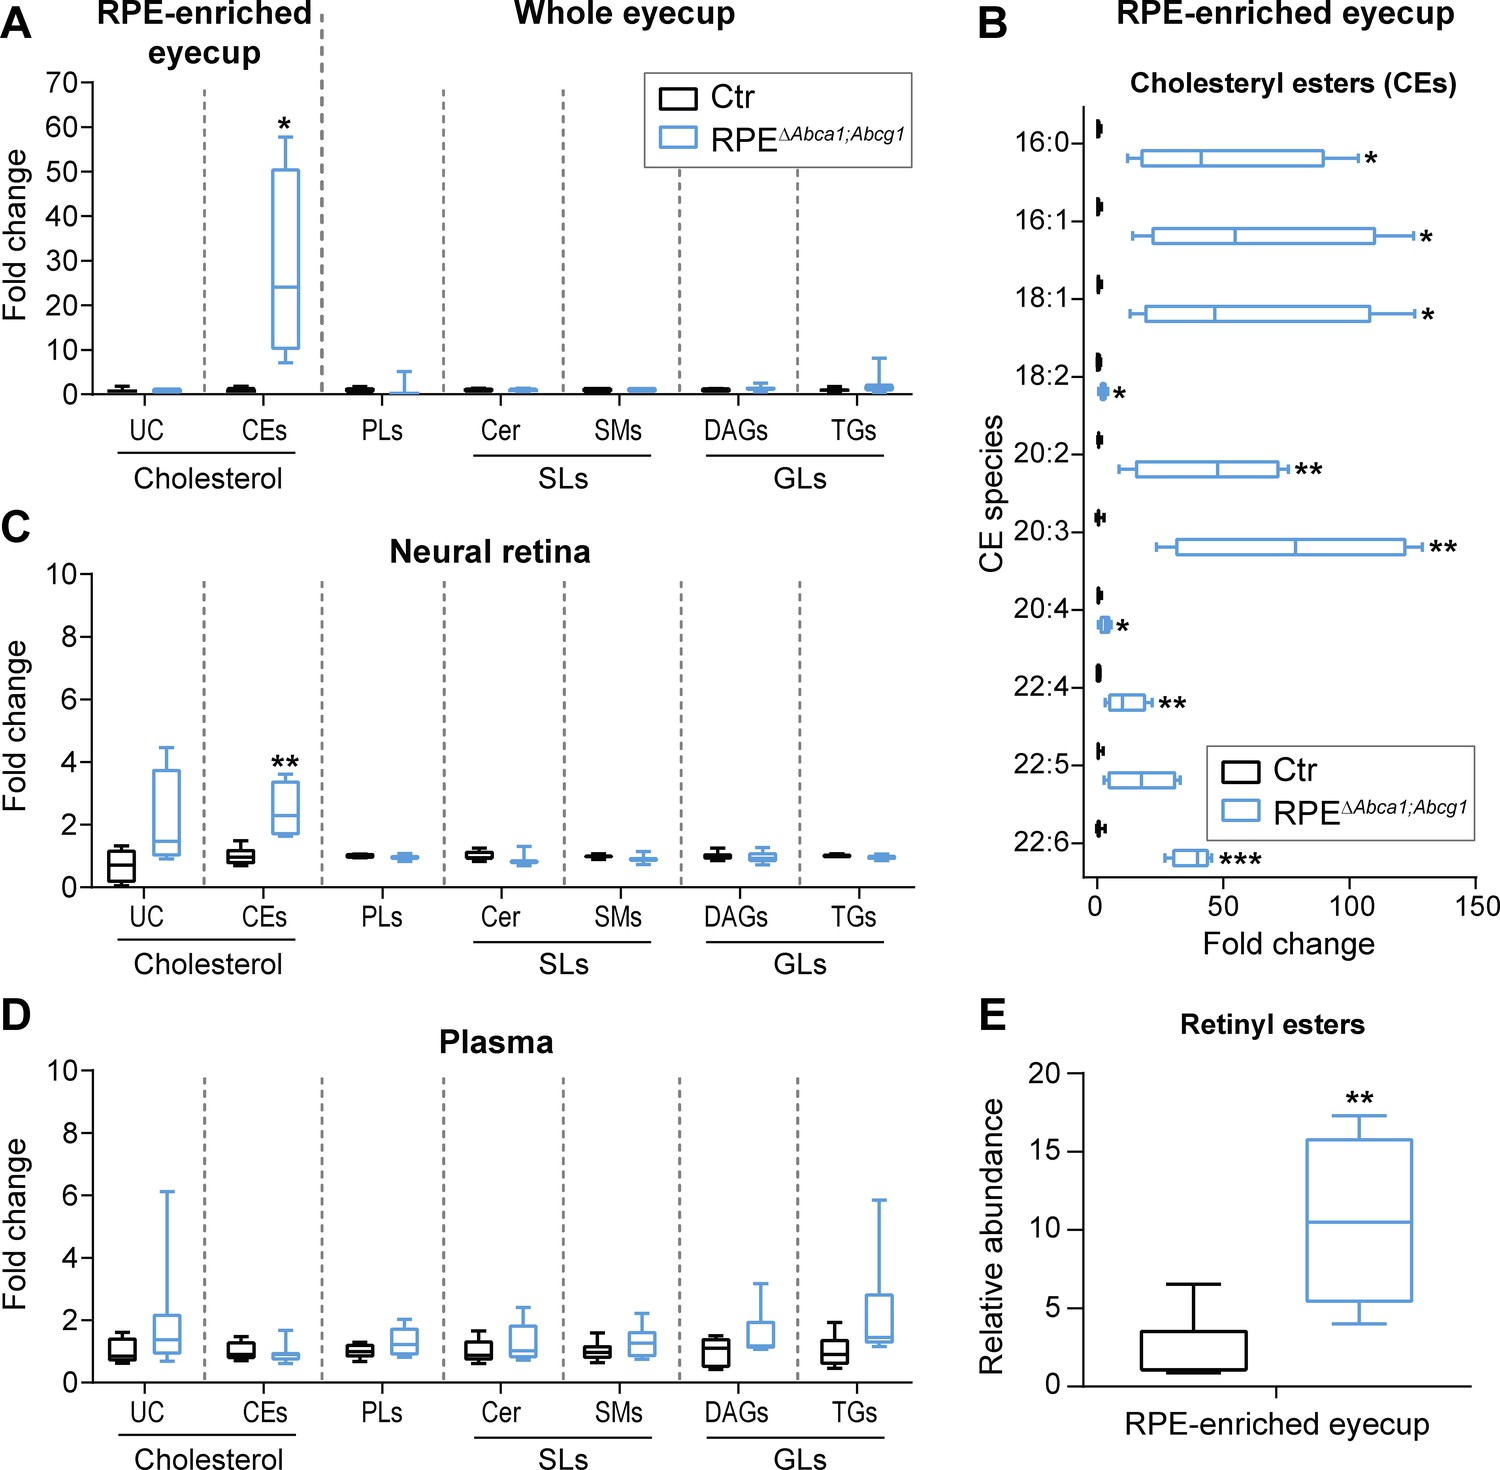
Lipid composition of eyecups (A), neural retinas (C) and plasma (D) from 2-months-old Ctr and mutant mice was measured by mass spectrometry-based methods. The following lipid classes were analyzed: cholesterol (un-esterified cholesterol, UC, and cholesteryl esters, CEs), phospholipids (PLs: sum of phosphatidylcholine, phosphatidylethanolamine, phosphatidylserine, phosphatidylinositol and phosphatidylglycerol), sphingolipids (SLs: ceramides, Cer, and sphingomyelins, SMs) and glycerolipids (GLs: diacylglycerols, DAGs, and triglycerides, TGs). (B) Cholesteryl esters species containing the indicated fatty acids were quantified in eyecups from the same animals. (E) Relative quantification of retinyl esters was performed in eyecups from 2-months-old Ctr and RPEΔAbca1;Abcg1 mice. Shown are box plots of folds on respective Ctr average, whiskers correspond to min and max values (N = 4–10). Lipid concentration values corresponding to fold changes in (A), (C) and (D) as well as single PL classes can be found in Supplementary file 1A. Please note that UC, CEs and REs were determined in RPE-enriched eyecups whereas PLs, SLs and GLs were determined in whole eyecups. Also, tissues from both eyes of the same animals were used for analysis of UC, CEs and REs, whereas tissues from single eyes were used for PLs, SLs and GLs (see ‘Materials and methods’). Statistics: Student’s t-test vs ‘Ctr’; *: p<0.05, **: p<0.01, ***: p<0.001.
Figure 6
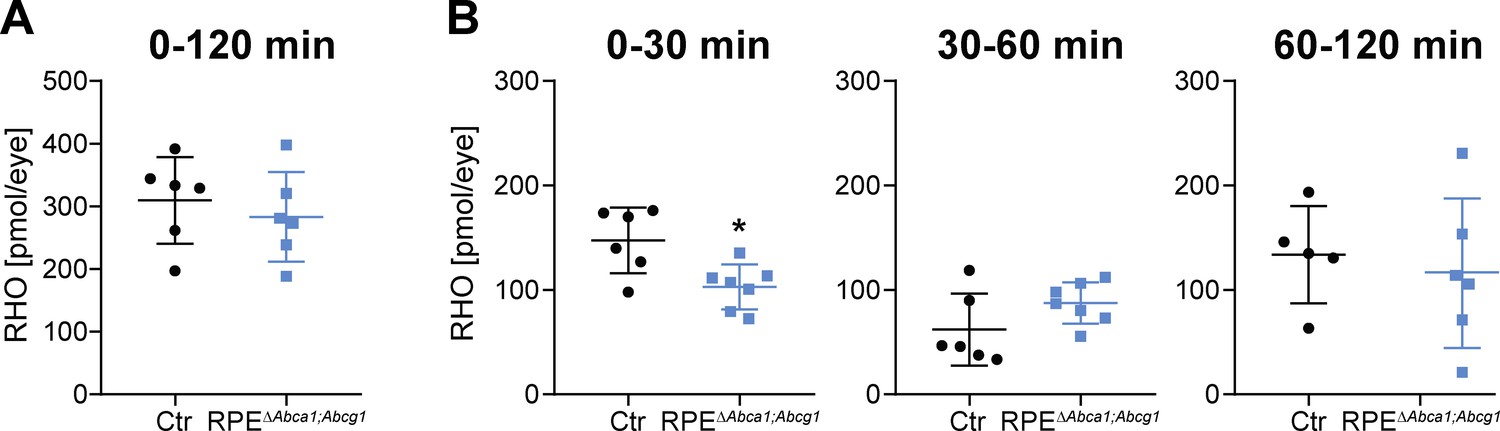
Delayed RHO regeneration in RPEΔAbca1;Abcg1 mice.
Dark-adapted 2-months-old Ctr and RPEΔAbca1;Abcg1 mice were exposed to 5’000 lux for 10 min and the RHO content was measured in each retina. Dark controls were kept in darkness for the entire procedure. RHO levels were measured in dark controls, immediately after bleach (0 min) and after 30, 60 and 120 min of recovery in darkness. (A) ‘Total’ amount of regenerated RHO after 120 min was calculated by subtracting the corresponding averaged RHO amount at ‘0 min’ from the RHO levels at ‘120 min’. (B) Amount of regenerated RHO during the indicated time intervals after bleaching were calculated by subtracting the corresponding averaged RHO amount at the early time point from the RHO levels measured at the later time point. Shown are data from individual samples and means ± SD (N = 4–8 eyes, corresponding to 2–4 mice). Statistics: Student’s t-test vs ‘Ctr’; *: p<0.05. Averages and SD of RHO content measurements can be found in Supplementary file 1B; single measurements per eye can be found in Figure 6—source data 1.
-
Figure 6—source data 1
Rhodopsin regeneration in RPE∆Abca1;Abcg1 and control mice.
- https://doi.org/10.7554/eLife.45100.014
Figure 7 with 1 supplement
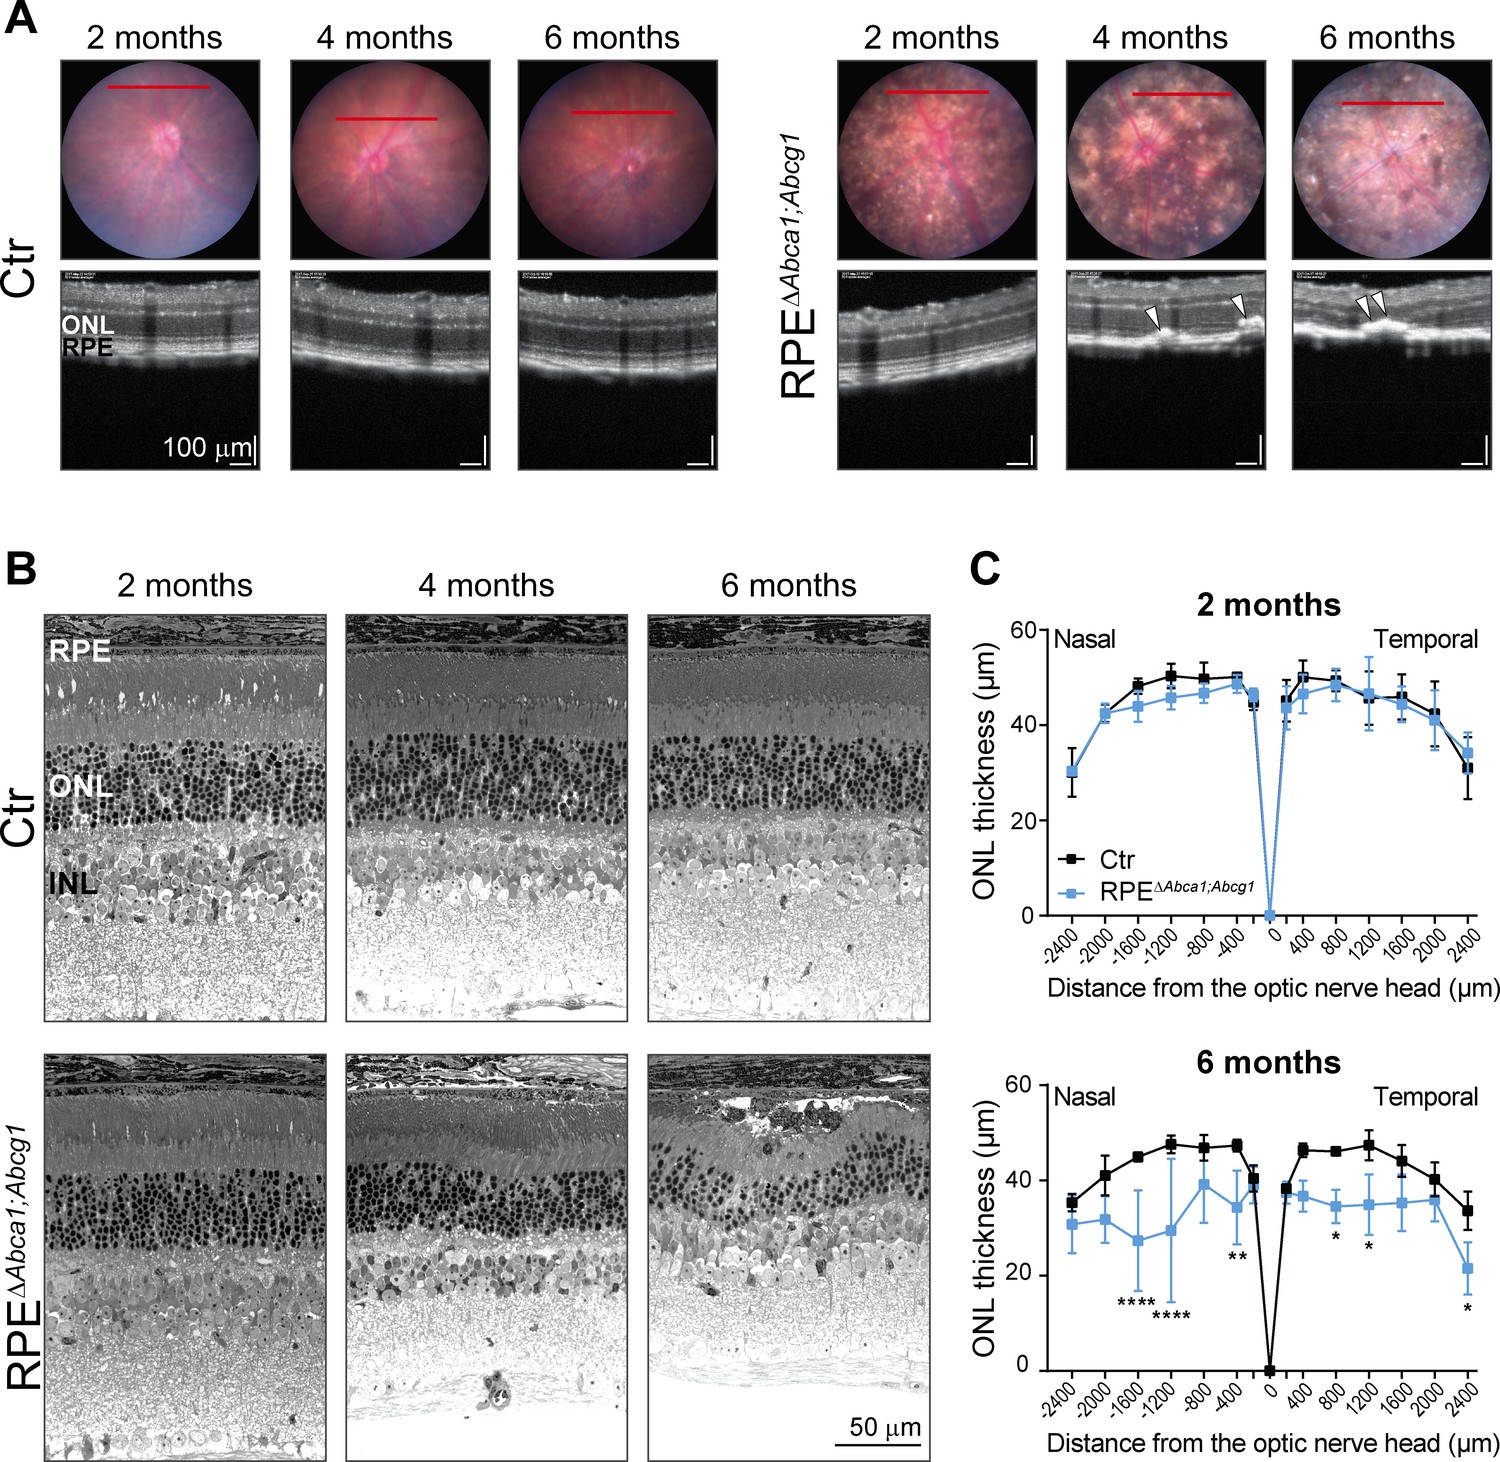
Age-dependent retinal degeneration in RPEΔAbca1;Abcg1 mice.
(A) Fundus images (upper panels) and OCT scans (lower panels, corresponding to red lines in fundus) of Ctr and RPEΔAbca1;Abcg1 mice at the indicated age. White arrowheads indicate sub-retinal hyper-reflective foci. Retinal morphology of the same animals was analyzed by light microscopy (B). Representative pictures of N ≥ 3 animals per group. ONL thickness was quantified from nasal-temporal panorama images at 2 and 6 months of age and presented as spidergrams (C): significant ONL thinning was detected in 6-months-old RPEΔAbca1;Abcg1 mice. Shown are means ± SD (N ≥ 3). Statistics: two-way ANOVA with Sidak’s multiple comparison test; *: p<0.05, **: p<0.01, ****: p<0.0001. Abbreviations as in Figure 1.
Figure 7—figure supplement 1
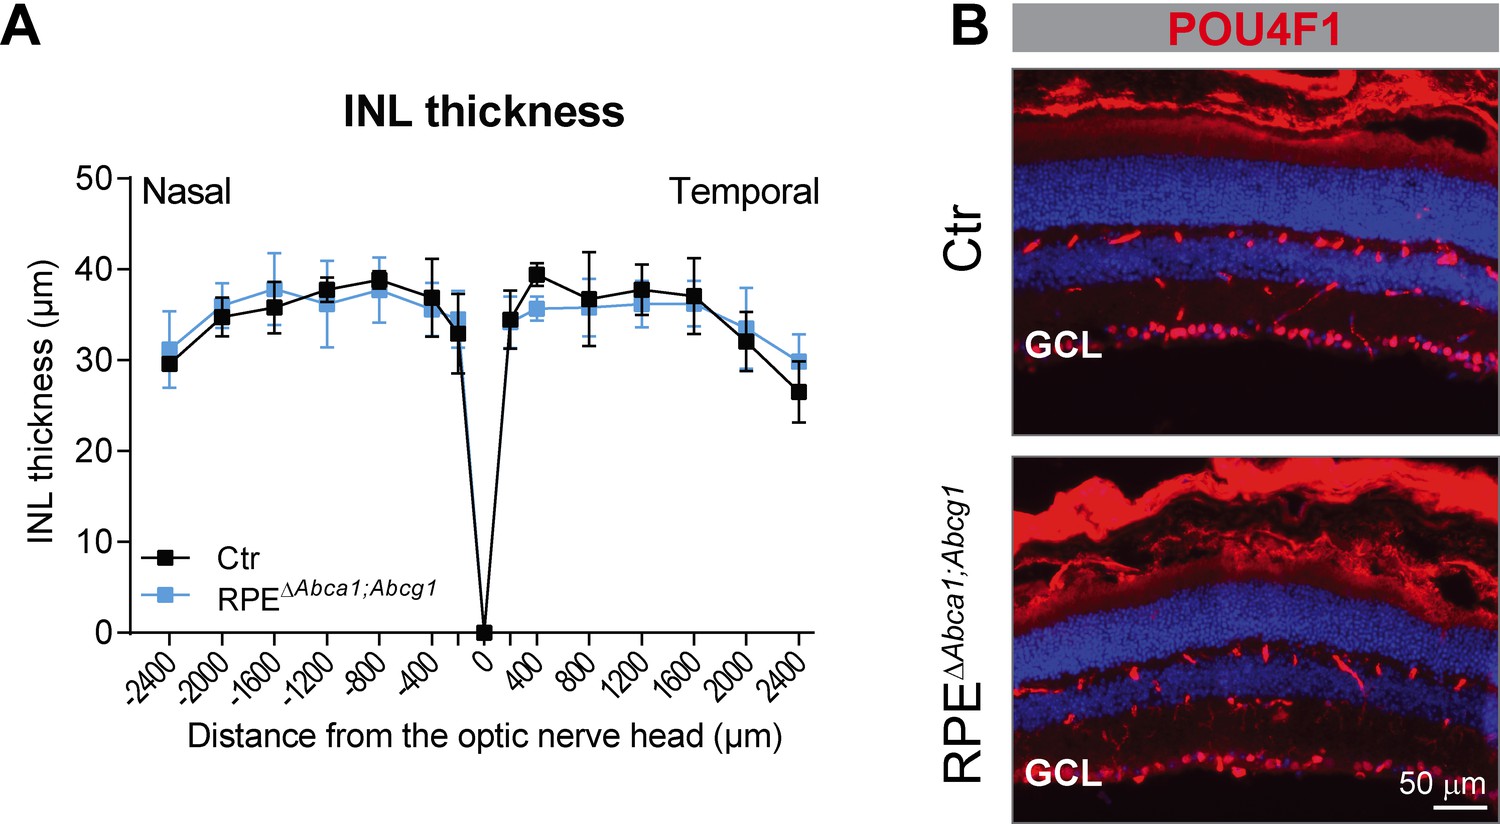
Absence of a phenotype in the inner retina of RPEΔAbca1;Abcg1 mice at 6 months of age.
(A) INL thickness was quantified from nasal-temporal panorama images at 6 months of age and presented as spidergram. Shown are means ± SD (N ≥ 3). Statistics: two-way ANOVA with Sidak’s multiple comparison test. (B) Retinal sections from 6-months-old Ctr (upper panel) and RPEΔAbca1;Abcg1 (lower panel) mice were stained for POU4F1 (red); nuclei were counterstained with DAPI. Note that the used secondary antibody was an anti-mouse and stained retinal blood vessels as well. Representative images of N = 3 animals per group. GCL: ganglion cell layer.
Figure 8
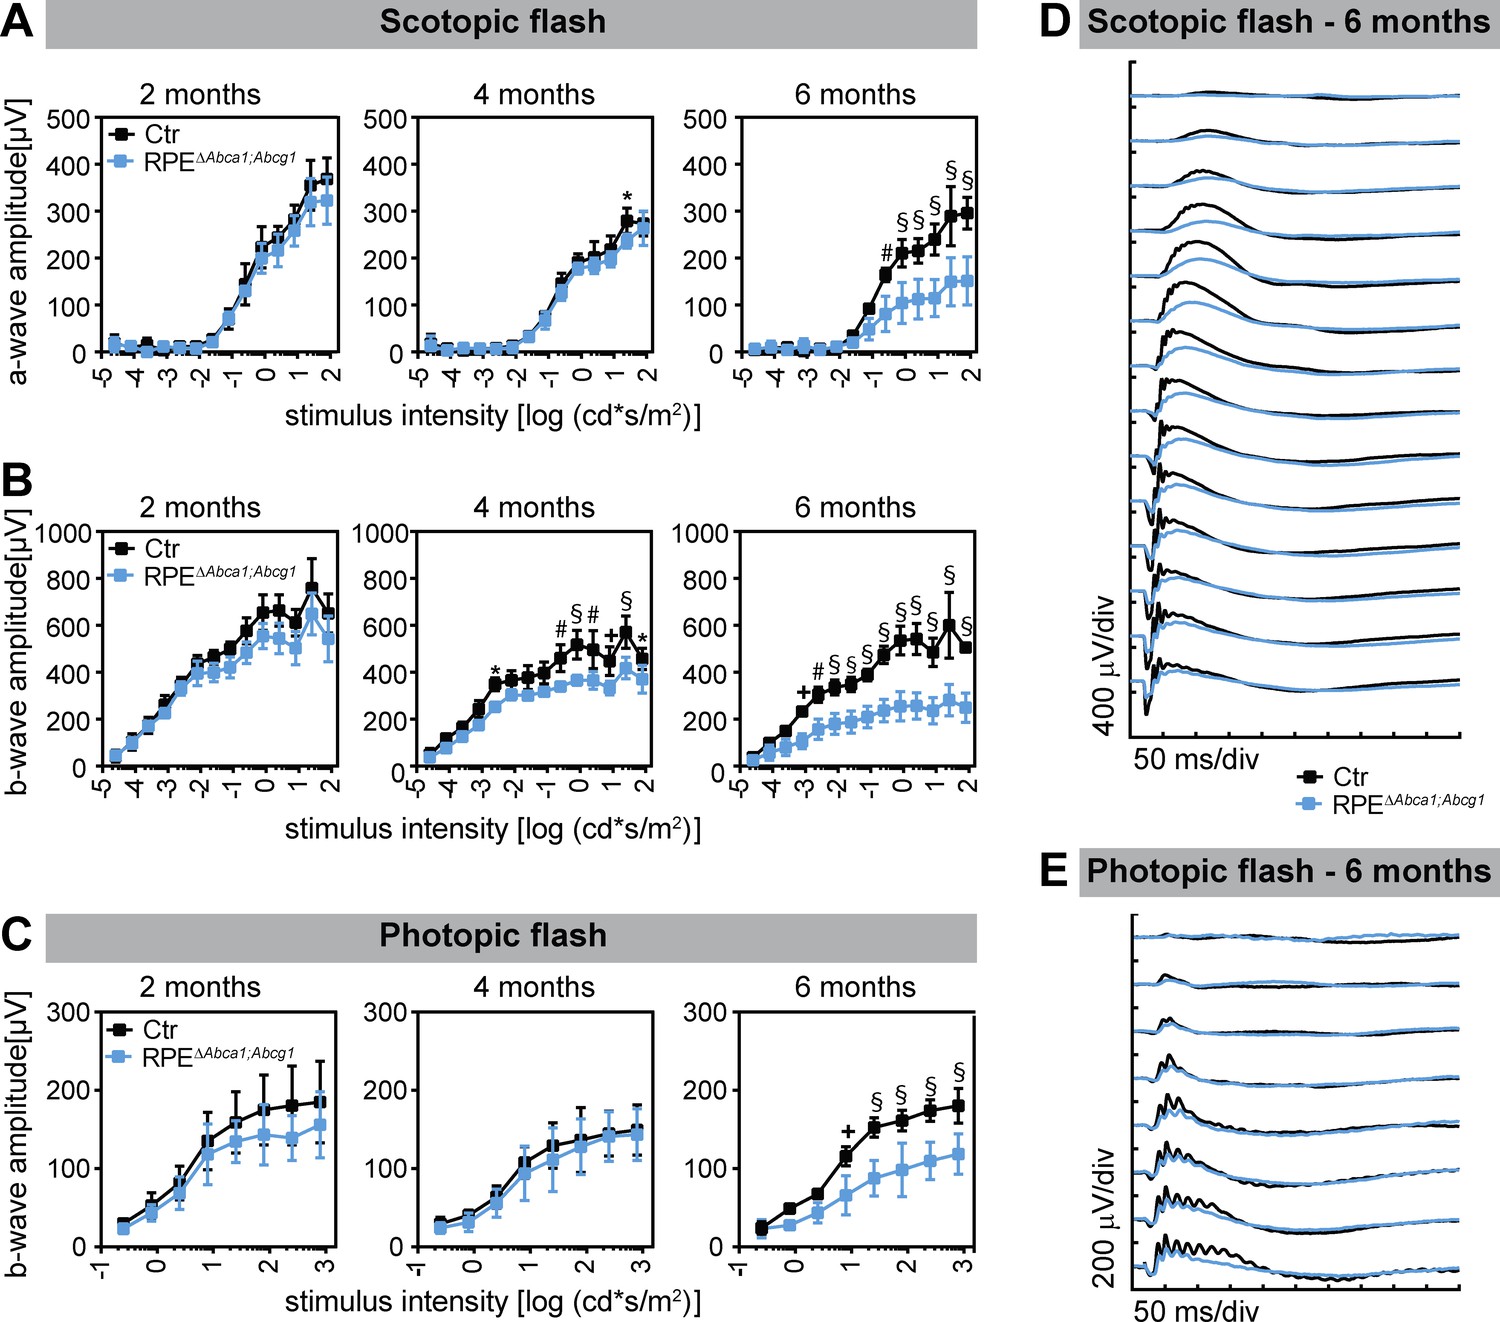
Decreased retinal function in aged RPEΔAbca1;Abcg1 mice.
Scotopic and photopic ERGs were recorded with increasing light intensities from dark-adapted Ctr and RPEΔAbca1;Abcg1 mice at the indicated ages. Shown are mean ± SD (N = 3–6) of scotopic a- (A) and b-wave (B) amplitudes as well as photopic b-wave (C) amplitudes. Average scotopic and photopic traces of 6-months-old animals are shown in (D) and (E), respectively. Statistics: two-way ANOVA with Sidak’s multiple comparison test; *: p<0.05, +: p<0.01, #: p<0.001, §: p<0.0001.
Figure 9
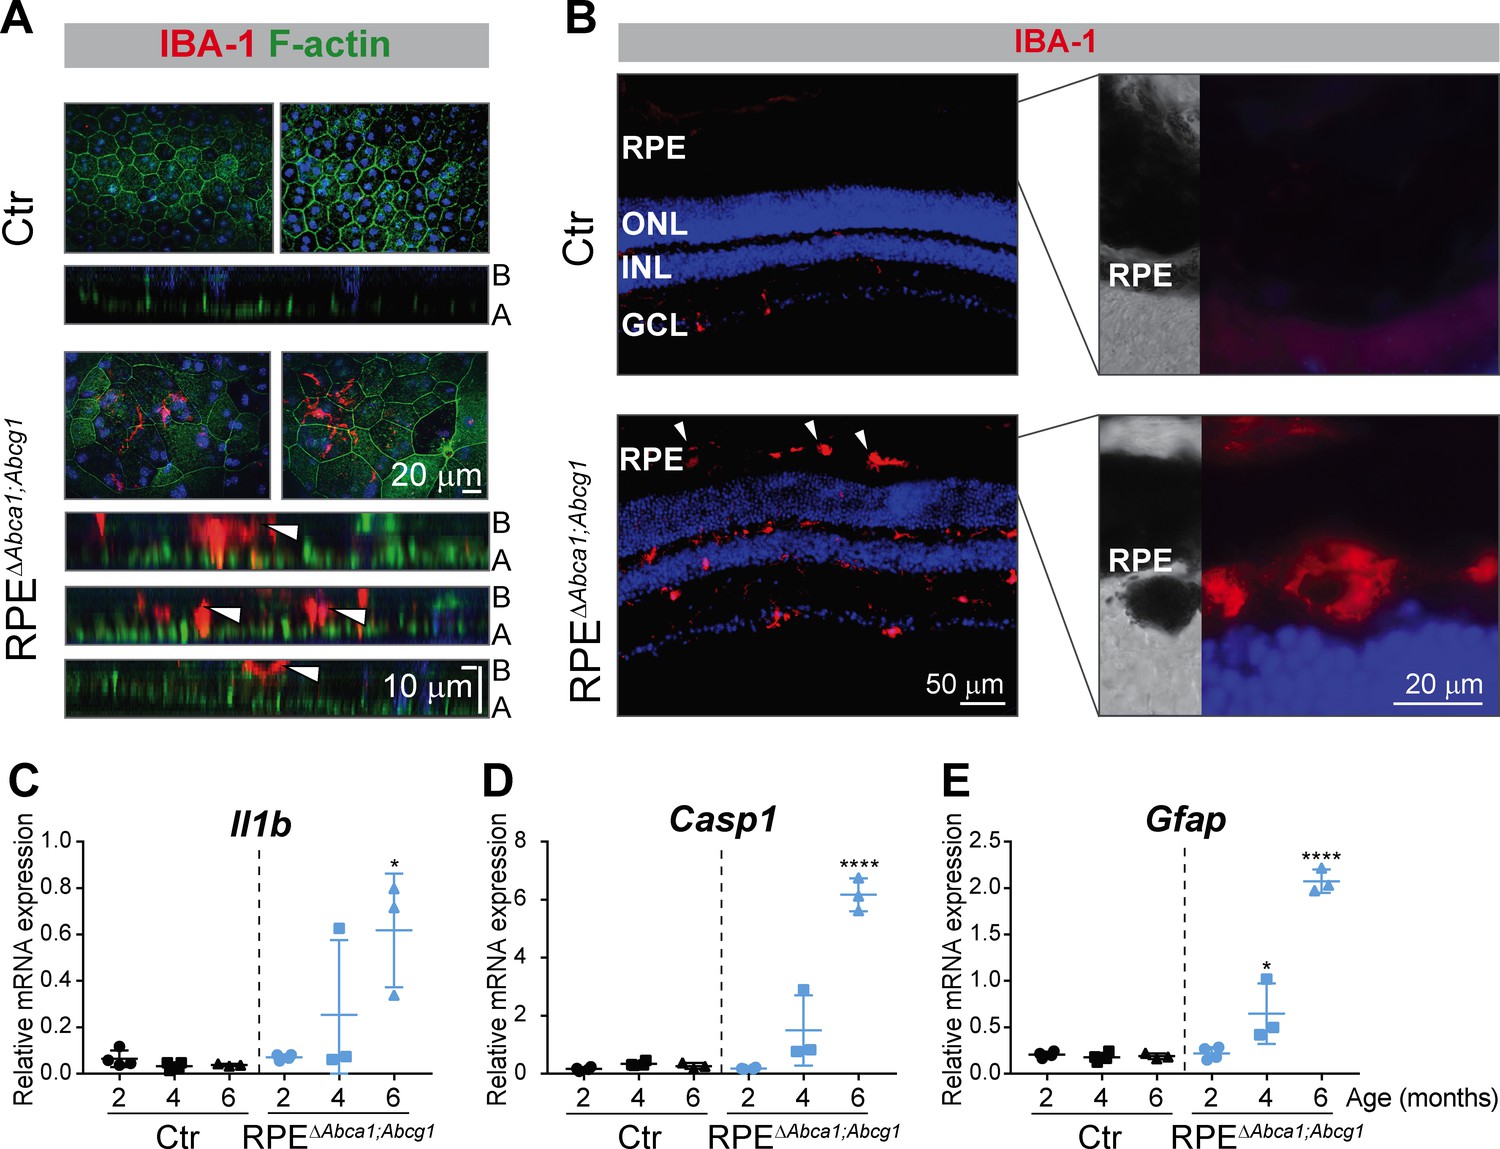
Inflammatory response in RPEΔAbca1;Abcg1 mice.
(A) RPE flat mounts from 4-months-old Ctr and RPEΔAbca1;Abcg1 mice were stained with phalloidin (green, staining actin filaments) and anti-IBA-1 (red). Shown are representative top-view images and cross-sections (A = apical side, B = basal side). White arrowheads indicate IBA-1-positive cells located inside or at the choroidal (basal) side of the mutant RPE. Nuclei were counterstained with Hoechst. (B) Retinal sections from 6-months-old mice were stained for IBA-1 (red): increased signal intensity and presence of sub-retinal macrophages/microglia was detected in RPEΔAbca1;Abcg1 mice (higher magnification images of the outer retina are shown in right panels). Nuclei were counterstained with DAPI. Representative images of N = 3 animals per group. Il1b (C), Casp1 (D) and Gfap (E) mRNA levels were measured by semi-quantitative real-time PCR in neural retinas from Ctr and RPEΔAbca1;Abcg1 mice. Shown are data from individual samples and means ± SD (N = 3–4). Statistics: one-way ANOVA vs ‘2 months’ of the respective genotype; *: p<0.05, ****: p<0.0001. Abbreviations as in Figure 1.
Figure 10
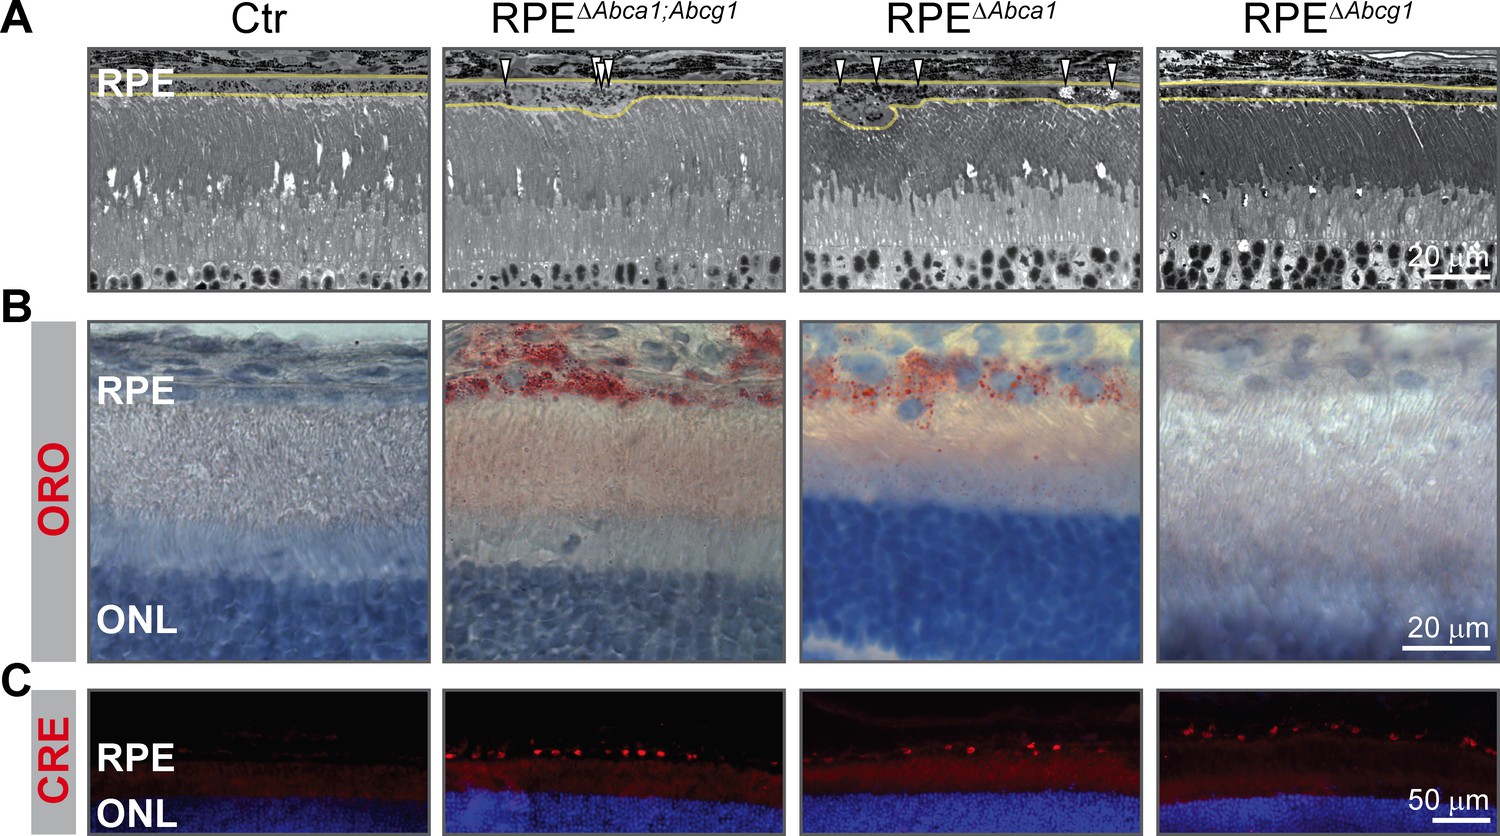
Early lipid accumulation in the RPE of single Abca1, but not Abcg1, KO mice.
2-months-old Ctr, double KO and single KO retinal sections were analyzed by light microscopy (A), ORO staining (B) and CRE IF (C). Single Abca1 mutant mice (RPEΔAbca1) showed an RPE phenotype comparable to double mutants (RPEΔAbca1;Abcg1), while single Abcg1 KO mice (RPEΔAbcg1) were undistinguishable from controls. Yellow lines in (A) indicate RPE borders. Nuclei were counterstained with hematoxylin (B) or DAPI (C). Representative pictures of N ≥ 3 animals per group. Abbreviations as in Figure 1.
Figure 11

ABCA1 expression in human LCLs.
LCLs derived from healthy individuals carrying the AMD decreased or increased risk ABCA1 genotypes were stimulated with an LXR agonist (1 μM) or DMSO vehicle control for 24 hr. (A) ABCA1 mRNA levels were measured by semi-quantitative real-time PCR. Shown are data from individual samples and means ± SD (N = 3, three technical replicates per cell line). Statistics: two-way ANOVA with Sidak’s multiple comparison test; *: p<0.05. ABCA1 protein levels were measured in LXR-stimulated cells by WB and normalized on ACTB levels. Shown are a representative WB (B) and the means ± SD of the band intensity quantification (N = 3, five technical replicates per cell line) (C). Statistics: Student’s t-test vs ‘decreased risk’.
Author response image 1

RNAseq data.
Clustering of RNAseq data. Retinas (left) and eyecups (right) of 4 control and 4 RPE∆Abca1;Abcg1 mice at 2 months of age were subjected to RNAseq analysis. Samples did not cluster according to their genotype (Cre-positive or Cre-negative).
Tables
Table 1
Mice genotypes and nomenclature.
flox/-: detection of floxed and excised (KO) allele in ear biopsy.
| Genotype | Name |
|---|---|
| Abca1flox/flox;Abcg1flox/flox | Cre-negative controls: Ctr |
| Abca1flox/-;Abcg1flox/flox | |
| Abca1flox/flox;Abcg1flox/- | |
| Abca1flox/-;Abcg1flox/- | |
| Abca1flox/flox;Abcg1flox/flox;BEST1Cre | RPE-specific double KOs: RPEΔAbca1;Abcg1 |
| Abca1flox/-;Abcg1flox/flox;BEST1Cre | |
| Abca1flox/flox;Abcg1flox/-;BEST1Cre | |
| Abca1flox/-;Abcg1flox/-;BEST1Cre | |
| Abca1flox/flox;Abcg1+/+;BEST1Cre | RPE-specific Abca1 single KOs: RPEΔAbca1 |
| Abca1flox/-;Abcg1+/+;BEST1Cre | |
| Abca1+/+;Abcg1flox/flox;BEST1Cre | RPE-specific Abcg1 single KOs: RPEΔAbcg1 |
| Abca1+/+;Abcg1flox/-;BEST1Cre | |
| Abca1+/+;Abcg1+/+;BEST1Cre | Cre-positive controls: BEST1Cre |
Table 2
LCLs and genotypes of the AMD-associated SNPs in human ABCA1 intron 2.
https://doi.org/10.7554/eLife.45100.021| LCL | SNP | Genotype |
|---|---|---|
| Decreased risk (n = 3) | rs1883025 | TT |
| rs2740488 | CC | |
| Increased risk (n = 3) | rs1883025 | CC |
| rs2740488 | AA |
Key resources table
| Reagent type (species) or resource | Designation | Source or reference | Identifiers | Additional information |
|---|---|---|---|---|
| Gene (Mus musculus) | Abca1 | NCBI gene ID: 11303 | ||
| Gene (Mus musculus) | Abcg1 | NCBI gene ID: 11307 | ||
| Strain, strain background (Mus musculus) | C57BL/6J (wt) | The Jackson Laboratory | RRID: IMSR_JAX:000664; The Jackson Laboratory: 000664 | |
| Strain, strain background (Mus musculus) | BEST1Cre | Iacovelli et al., 2011 | RRID:IMSR_JAX:017557 | Name at the Jackson Laboratory: C57BL/6-Tg (BEST1-cre)1Jdun/J |
| Strain, strain background (Mus musculus) | Abca1flox/flox; Abcg1flox/flox | The Jackson Laboratory | RRID:IMSR_JAX:021067 | Name at the Jackson Laboratory: B6.Cg-Abca1 tm1Jp Abcg1tm1Tall/J |
| Antibody | anti-ABCA1 (rabbit polyclonal) | Novus Biologicals | RRID:AB_10000630; Novus Biologicals: NB400-105 | (1:250 for IF, 1:200 for WB) |
| Antibody | anti-ABCG1 (rabbit monoclonal) | Abcam | RRID:AB_867471; Abcam: ab52617 | (1:100) |
| Antibody | anti-EZR (mouse monoclonal) | Santa Cruz Biotechnology | RRID:AB_783303; Santa Cruz: sc-58758 | (1:500) |
| Antibody | anti-CRE (rabbit polyclonal) | Merck | RRID:AB_10806983; Merck: 69050–3 | (1:300) |
| Antibody | anti-IBA1 (rabbit polyclonal) | Wako Fujifilm | RRID:AB_839504; Wako Fujifilm: 019–19741 | (1:500) |
| Antibody | anti-ZO1 (rabbit polyclonal) | Thermo Fisher Scientific | RRID:AB_2533456; Thermo Fisher Scientific: 40–2200 | (1:100) |
| Antibody | anti-βcatenin (mouse monoclonal) | BD Biosciences | RRID:AB_397554; BD Biosciences: 610153 | (1:300) |
| Antibody | anti-POU4F1 (mouse monoclonal) | Merck | RRID:AB_94166; Merck: MAB1585 | (1:100) |
| Recombinant DNA reagent | pTR-BEST1-Cre-P2A-GFP (AAV vector plasmid) | This paper | Constructed from AAV plasmid materials at the University of Florida, laboratory of S. Boye | |
| Sequence-based reagent | Random Primers | Promega | Promega: C1181 | |
| Peptide, recombinant protein | Phalloidin-Alexa488 | Thermo Fisher Scientific | RRID:AB_2315147; Thermo Fisher Scientific: A12379 | (1:100) |
| Commercial assay or kit | LipidTOX Red Neutral Lipid Stain | Thermo Fisher Scientific | Thermo Fisher Scientific: H34476 | (1:200) |
| Commercial assay or kit | Protease Inhibitos Cocktail | Sigma-Aldrich | Sigma-Aldrich: P2417 | |
| Commercial assay or kit | PowerUp Syber Green Master Mix | Thermo Fisher Scientific | Thermo Fishe rScientific: A25742 | |
| Commercial assay or kit | NucleoSpin RNA isolation kit | Macherey-Nagel | Macherey-Nagel: 740949.250 | |
| Chemical compound, drug | OilRedO (ORO) | Sigma-Aldrich | Sigma-Aldrich: O9755-25G | |
| Chemical compound, drug | Oxalic Acid | Sigma-Aldrich | Sigma-Aldrich: 75688 | |
| Chemical compound, drug | LXR agonist | Roche, Panday et al., 2006 | Roche: T0901317 | |
| Chemical compound, drug | SPLASH | Avanti Polar Lipids | Avanti Polar Lipids: 330707 | |
| Chemical compound, drug | d7-sphinganine (SPH d18:0) | Avanti Polar Lipids | Avanti Polar Lipids: 860658 | D-erythro-sphinganine-d7 |
| Chemical compound, drug | d7-sphingosine (SPH d18:1) | Avanti Polar Lipids | Avanti Polar Lipids: 860657 | D-erythro-sphingosine-d7 |
| Chemical compound, drug | Dihydroceramide (Cer d18:0/12:0) | Avanti Polar Lipids | Avanti Polar Lipids: 860635 | N-lauroyl-D-erythro -sphinganine |
| Chemical compound, drug | Ceramide (Cer d18:1/12:0) | Avanti Polar Lipids | Avanti Polar Lipids: 860512 | N-lauroyl-D-erythro- sphingosine |
| Chemical compound, drug | Glucosylceramide (GluCer d18:1/8:0) | Avanti Polar Lipids | Avanti Polar Lipids: 860540 | D-glucosyl-ß−1,1'-N -octanoyl-D-erythro -sphingosine |
| Chemical compound, drug | Sphingomyelin (SM d18:1/12:0) | Avanti Polar Lipids | Avanti Polar Lipids: 860583 | N-lauroyl-D-erythro -sphingosylphosphorylcholine |
| Chemical compound, drug | d7-sphingosine-1- phosphate (S1P d18:1) | Avanti Polar Lipids | Avanti Polar Lipids: 860659 | D-erythro-sphingosine -d7-1-phosphate |
| Chemical compound, drug | Methanol | Honeywell | Honeywell: 34860 Riedel-de Haen | |
| Chemical compound, drug | MTBE | Sigma-Aldrich | Sigma-Aldrich: 20256 | tert-Butyl methyl ether |
| Chemical compound, drug | Chloroform | Sigma-Aldrich | Sigma-Aldrich: 650498 | |
| Chemical compound, drug | Acetonitrile | Sigma-Aldrich | Sigma-Aldrich: 534851 | |
| Chemical compound, drug | Isopropanol | Sigma-Aldrich | Sigma-Aldrich: 59300 | |
| Software, algorithm | ImageJ Tissue Cell Geometry macro | Institute for Research in Biomedicine, Barcelona, Spain | http://adm.irbbarcelona.org/image-j-fiji | |
| Software, algorithm | Relative Quantification Software | Thermo Fisher Cloud | https://www.thermofisher.com/uk/en/home/digital-science/thermo-fisher-connect/all-analysis-modules.html | |
| Software, algorithm | GraphPad Prism, version 7 | GraphPad | RRID:SCR_002798 | |
| Software, algorithm | Tracefinder Clinical 4.1 | Thermo Fisher Scientific | ||
| Other | transcend TLX I eluting pump | Thermo Fisher Scientific | ||
| Other | Q-Exactive | Thermo Fisher Scientific | ||
| Other | Mini-PROTEAN Precast Gels, 4–15% polyacrylamide | BioRad | BioRad: 4561086DC | |
| Other | C30 Accucore LC column | Thermo Fisher Scientific | Thermo Fisher Scientific: 7826–152130 | 150 mm * 2.1 mm * 2.6 µm |
Additional files
-
Supplementary file 1
Supplementary tables.
(A) Absolute concentrations of analyzed lipid classes from 2-months-old Ctr and RPEΔAbca1;Abcg1 mice. (B) RHO measurements from 2-months-old Ctr and RPEΔAbca1;Abcg1 neural retinas. (C) Primers used for genotyping. (D) Primers used for gene expression analysis.
- https://doi.org/10.7554/eLife.45100.022
-
Transparent reporting form
- https://doi.org/10.7554/eLife.45100.023
Download links
A two-part list of links to download the article, or parts of the article, in various formats.
Downloads (link to download the article as PDF)
Open citations (links to open the citations from this article in various online reference manager services)
Cite this article (links to download the citations from this article in formats compatible with various reference manager tools)
Impaired ABCA1/ABCG1-mediated lipid efflux in the mouse retinal pigment epithelium (RPE) leads to retinal degeneration
eLife 8:e45100.
https://doi.org/10.7554/eLife.45100


