Dynamic change of electrostatic field in TMEM16F permeation pathway shifts its ion selectivity
- University of California, San Francisco, United States
- Howard Hughes Medical Institute, United States
Figures
Figure 1 with 5 supplements
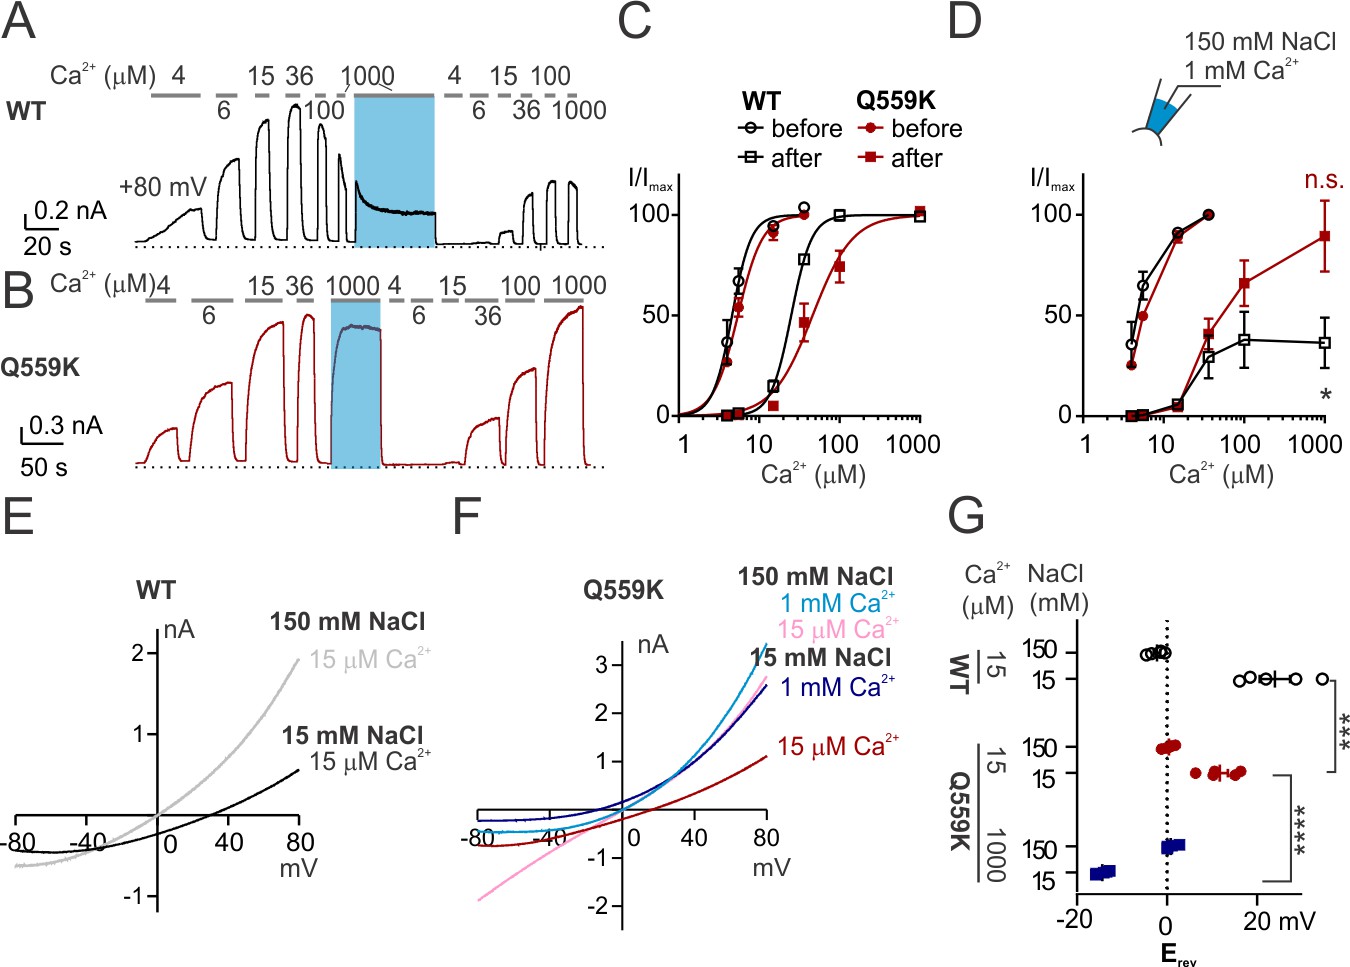
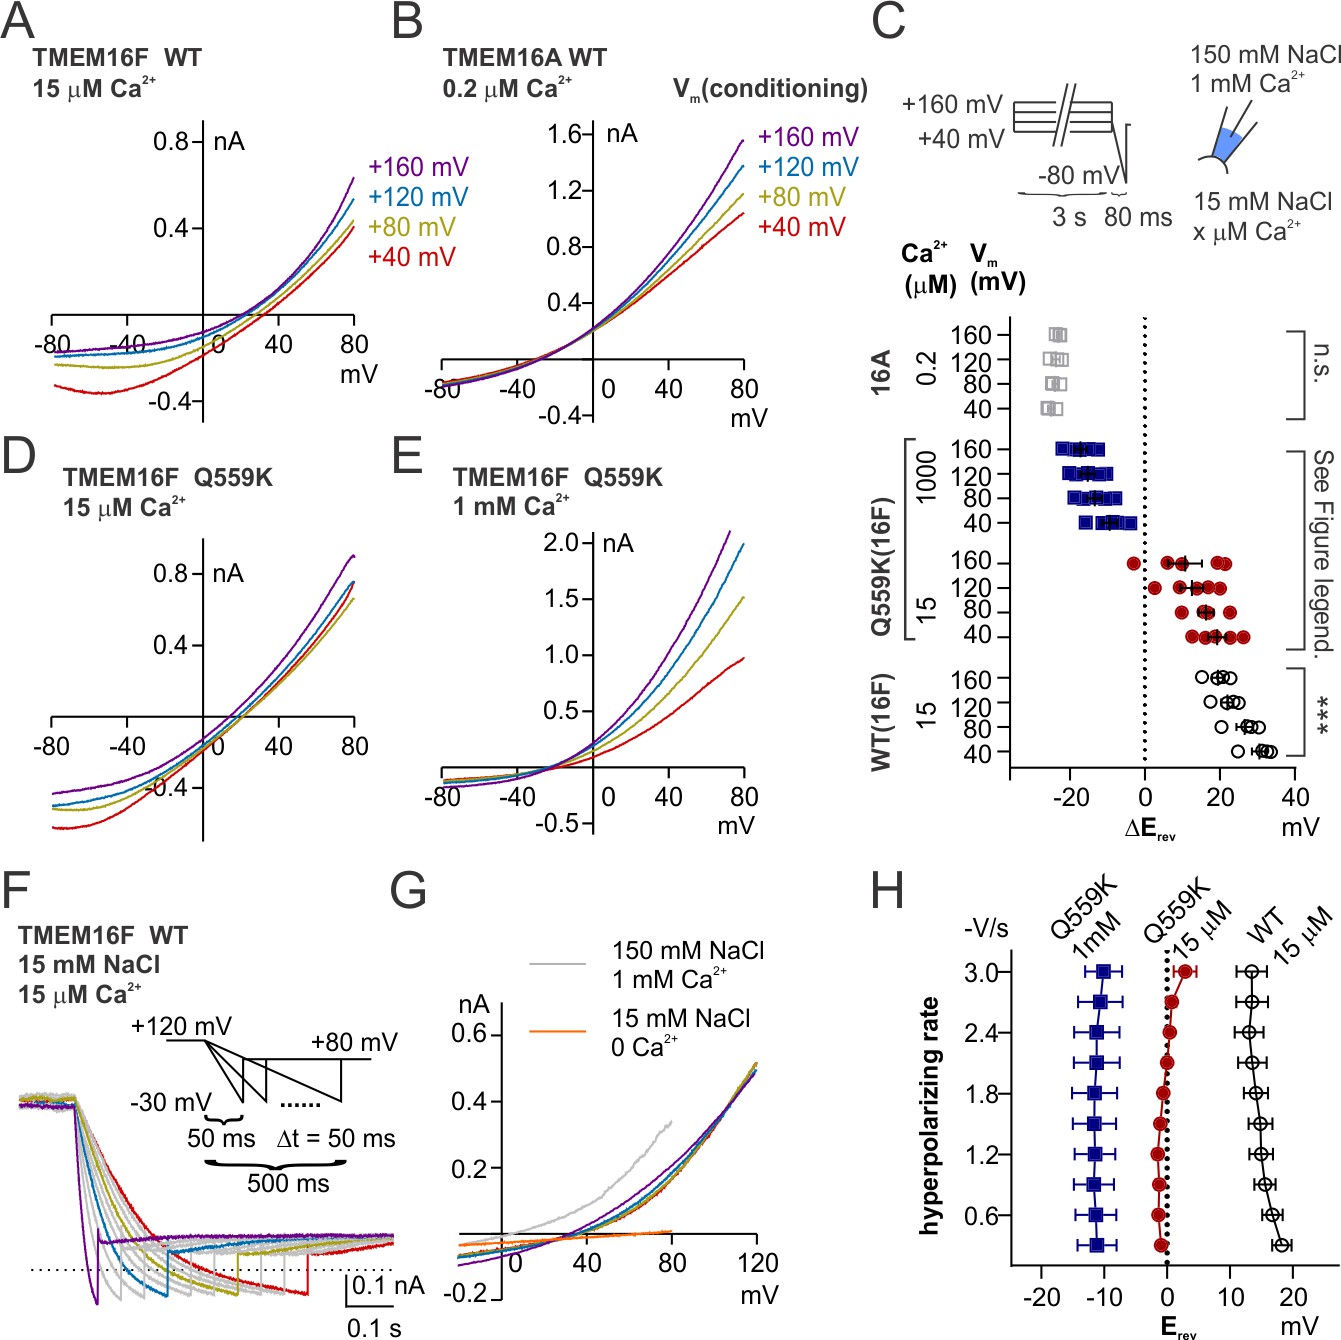
TMEM16F Q559K shifts its reversal potential in response to change of intracellular Ca2+ concentration.
(A, B) Representative recordings of TMEM16F wild type (WT) and Q559K in different Ca2+ concentrations. Traces were recorded from transfected HEK293 cells and the inside-out patches were held at +80 mV. The shades illustrate 1 min treatment with 1 mM Ca2+ that catalyzes PIP2 degradation by membrane-tethered phospholipase. (C) Dose-response curves for Ca2+-activation of WT and Q559K before and after 1 mM Ca2+ treatment, respectively. Currents before and after 1 mM Ca2+ were separately fitted to the Hill equation and normalized to their respective maximal amplitudes. (D) Change of current magnitudes of WT and Q559K. The currents were normalized to the maximal magnitudes before 1 mM Ca2+ for each cell. *p<0.05 (one sample t test against hypothetical value ‘1’). (E, F) Representative I-V relationships of WT and Q559K recorded in indicated conditions. The traces were recorded with a hyperpolarizing ramp from +80 mV to −80 mV (−1 V/s) following holding at +80 mV. (G) Scatter plot of reversal potentials (Erev) obtained from traces as in E and F without background correction. p-Values were determined with Sidak's multiple comparisons following two-way ANOVA.
Figure 1—figure supplement 1
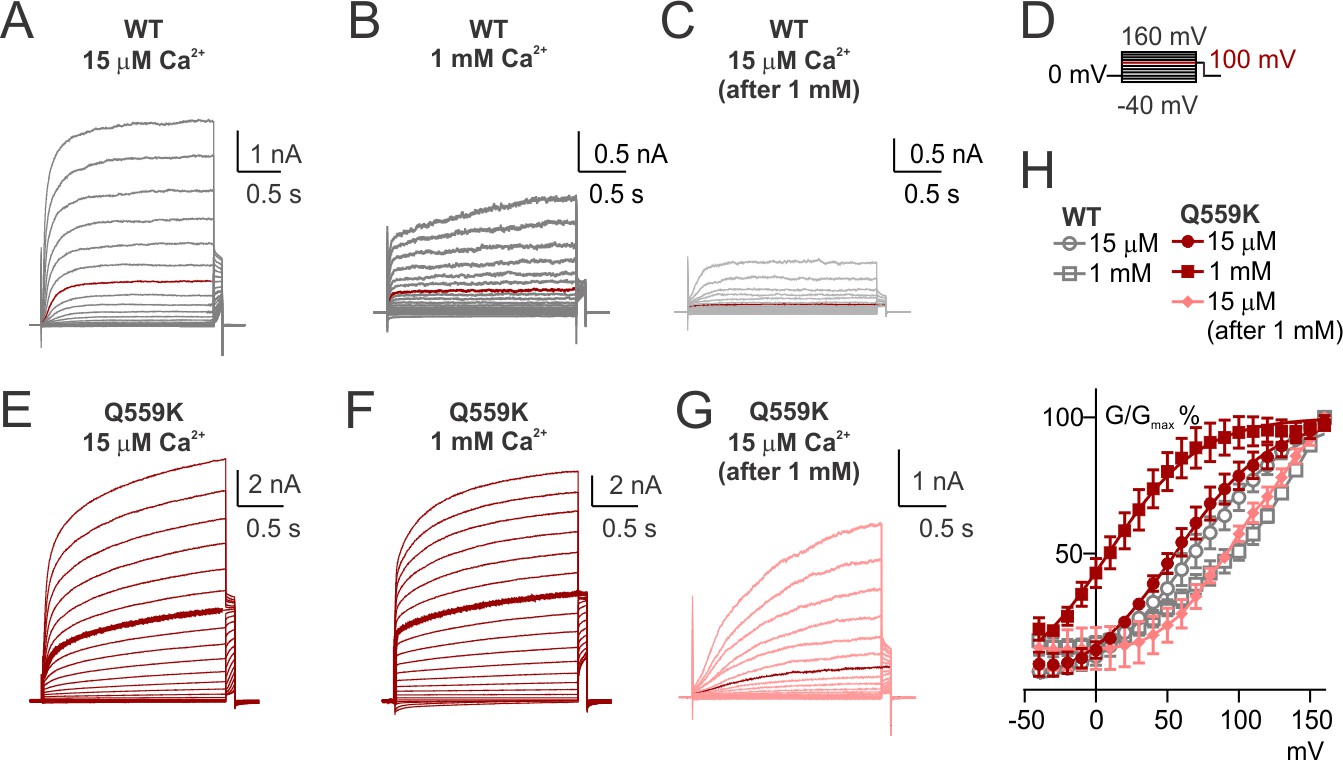
Voltage-dependence of TMEM16F WT and Q559K steady-state activation.
(A, B, C, E, G, F) Representative traces recorded with a voltage family protocol from −40 mV to +160 mV with 10 mV increments followed by holding at +100 mV, as in (D). The traces recorded at +100 mV are highlighted for comparison. (H) Averaged G-V relationships of the currents recorded in indicated conditions. Tail current (at +100 mV) magnitudes were measured from traces as in A ~ C, E ~ G. For WT and Q559K in 15 µM Ca2+ and Q559K in 1 mM Ca2+. Tail current magnitudes of each recording were fitted to the Hill equation against voltage, and they were subsequently normalized to the respective maximal values. We chose to use Hill equation since it provides a simplified estimation for the kinetics of voltage activation (Yifrach, 2004). Averaged G/Gmax values were calculated at the end for each group. For the other conditions, the tail current magnitudes were directly normalized to those following +160 mV for each recording, and the averaged G/Gmax values for each group were calculated at the end.
Figure 1—figure supplement 2
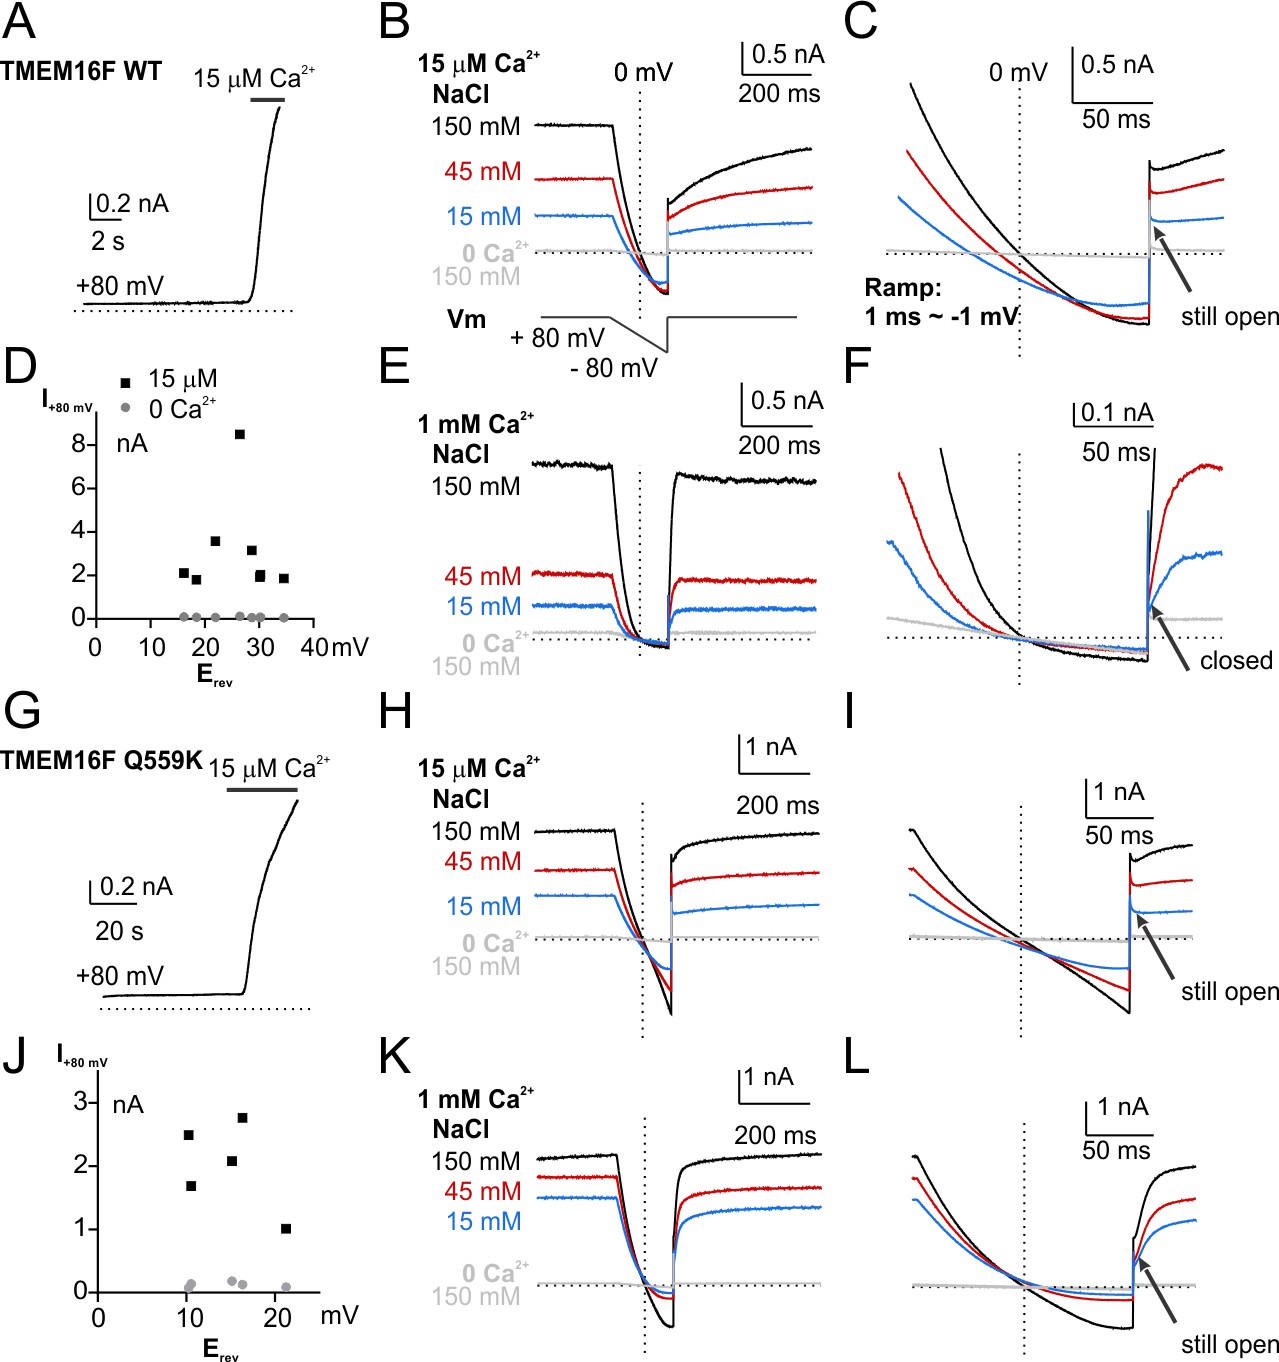
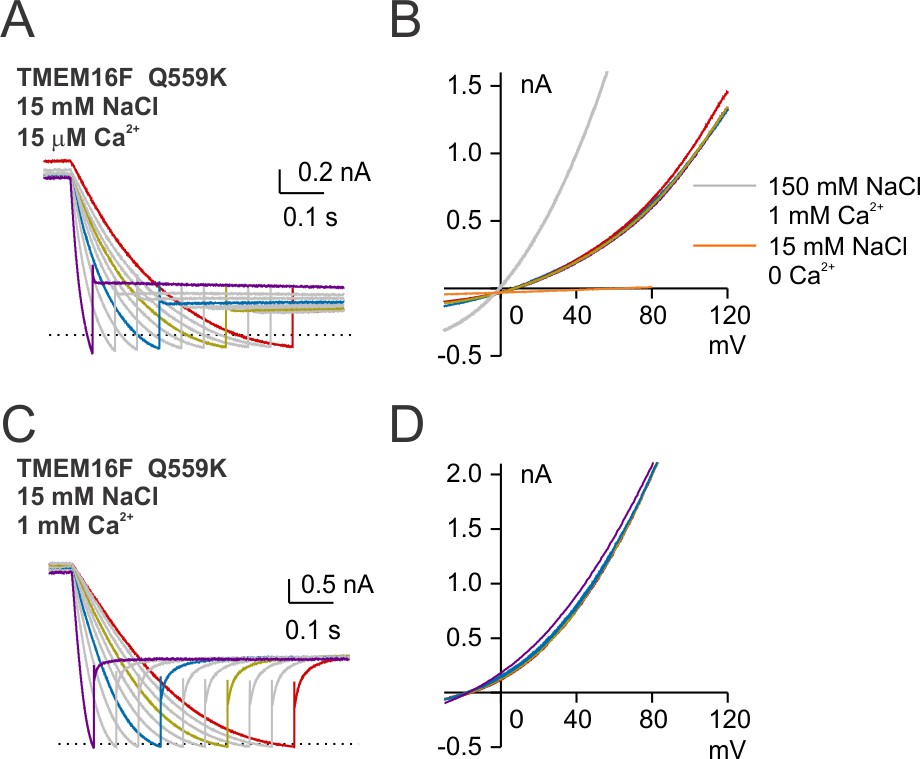
Recordings in indicated conditions with a hyperpolarizing ramp protocol.
(A,G) Time courses of TMEM16F WT and Q559K activation by 15 µM Ca2+ in 150 mM NaCl. The currents were recorded when the patches were held at +80 mV. (B, E, H, K) Recordings of reversal potential with a hyperpolarizing ramp protocol following constant holding at +80 mV. For the demonstrated traces, the solutions were applied in the order of 150 mM, 45 mM and 15 mM NaCl, and back to 150 mM NaCl (not shown). Ca2+-free solution was applied at the end to confirm the seal. (C, F, I, L) Detail amplification showing tail currents in B, E, H, K recorded at +80 mV following the hyperpolarizing ramp. Note that in F, the tail current is not significantly bigger than endogenous current (gray trace), excluding the feasibility to calculate Erev out of it. (D, J) Current magnitudes activated by 15 µM Ca2+ in 150 mM NaCl were plotted against the Erev values measured with 15 mM NaCl intracellular solution, indicating that there is no correlation.
Figure 1—figure supplement 3
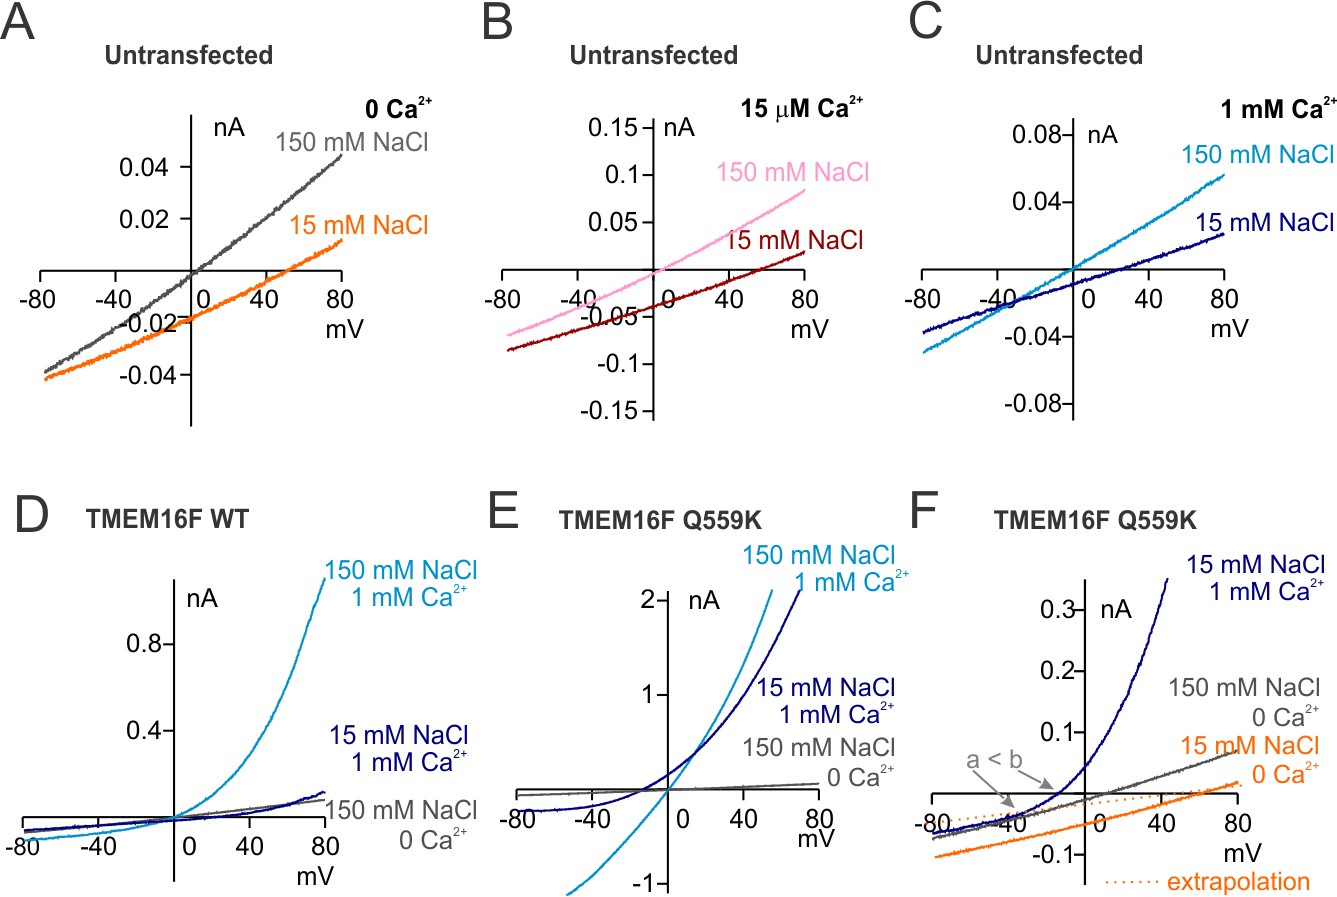
Additional control experiments for Figure 1.
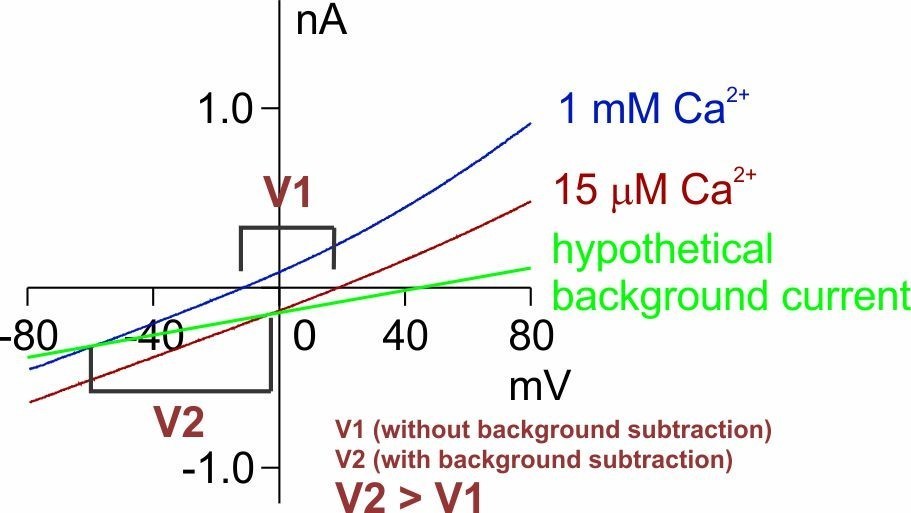
(A ~ D) Representative I-V relationships of currents recorded in indicated conditions. The recording protocol was the same as in Figure 1E,F. Wild-type TMEM16F current in 1 mM Ca2+ is not distinguishable from HEK293 cell endogenous currents. (E) Representative I-V relationships of TMEM16F Q559K current to show the Erev in 1 mM Ca2+. Ca2+-free solution was applied at the end to confirm the seal. (F) One example of TMEM16F Q559K recorded in 1 mM Ca2+ to illustrate the challenge of background subtraction. Note that the trace of the current recorded in Ca2+-free 15 mM NaCl solution (orange solid trace) did not cross with that in 1 mM Ca2+ 15 mM NaCl (blue trace), attributable to the inhibition of endogenous current by 1 mM Ca2+, shown in C. Extrapolation (orange dotted trace) indicates that the current after background subtraction (a) should reverse at a more negative potential than that without subtraction (b), justifying our ‘safer’ step of not performing background subtraction (using b) for comparison involving recordings in 1 mM Ca2+.
Figure 1—figure supplement 4
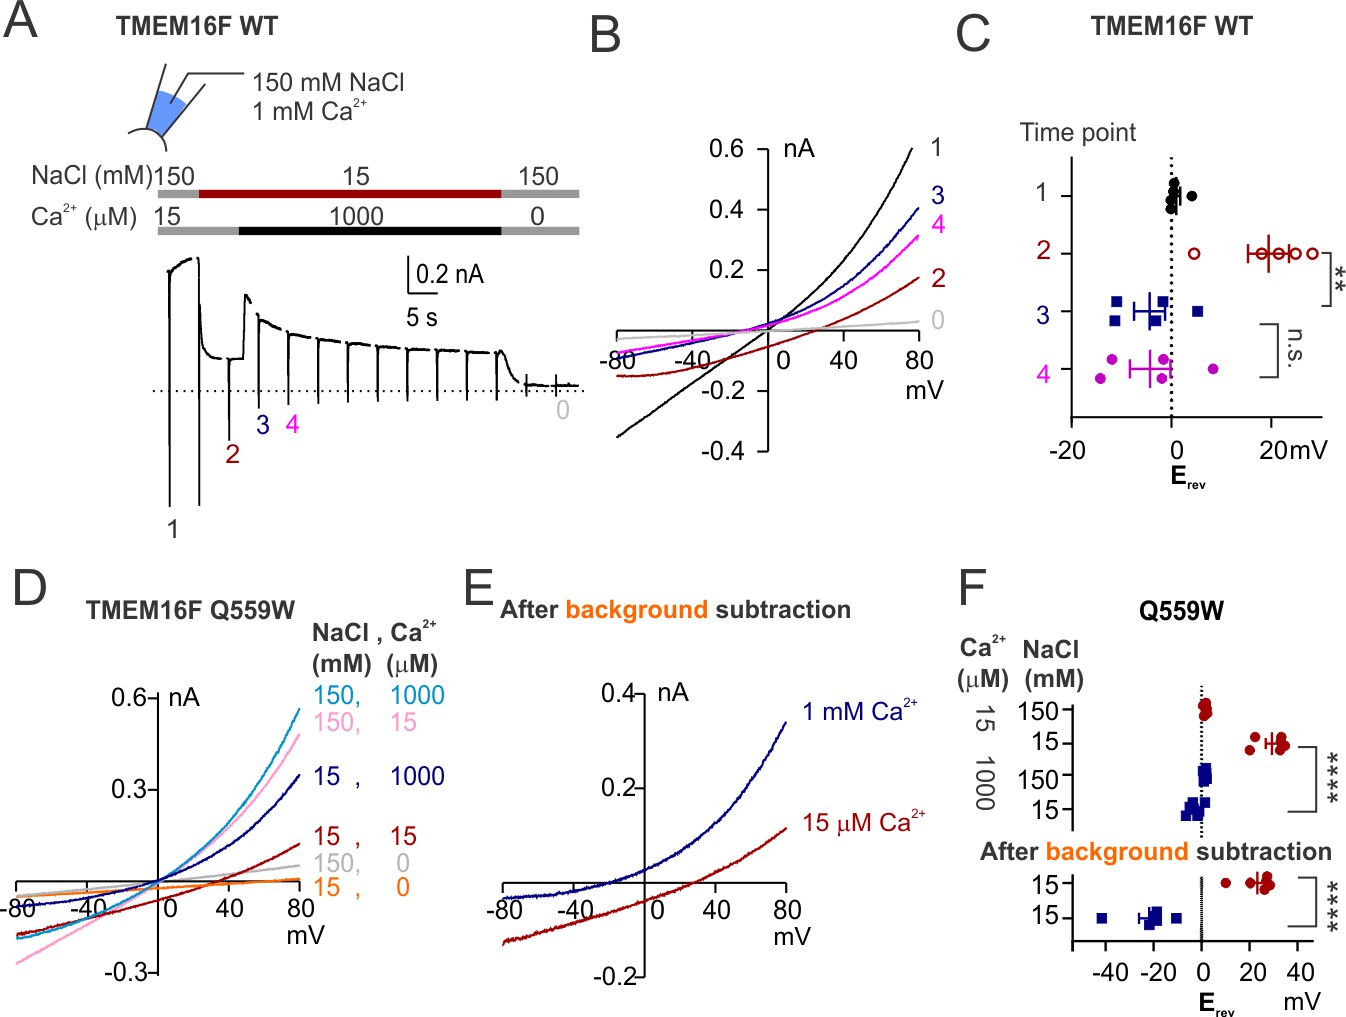
Permeability ratio PNa+/PCl- was altered in WT TMEM16F and Q559W in response to change of Ca2+.
(A) Representative recordings of WT TMEM16F held at +80 mV with a hyperpolarizing ramp (−1 V/s) once every 5 s in indicated conditions. (B) Representative I-V relationships of currents recorded at labeled time points. (C) Scatter plot of the reversal potentials (Erev) at labeled time points without background subtraction. p-Values were determined with Tukey's multiple comparisons following one-way ANOVA. (D) Representative I-V relationships of Q559W recorded in indicated conditions. Traces were recorded with the same protocol as in Figure 1E,F. (E) I-V relationships of the currents in 15 µM Ca2+ and 1 mM Ca2+ (both in 15 mM NaCl) after background subtraction (subtraction of the current in Ca2+-free 15 mM NaCl solution, orange trace in D). (F) Scatter plot of reversal potentials (Erev) obtained from traces as in D (without background subtraction) and in E (after background subtraction). p-Values were respectively determined with Sidak's multiple comparisons following two-way ANOVA and two-tailed Student's t-test.
Figure 1—figure supplement 5

I- permeability of TMEM16F WT and Q559K.
(A, B) Representative I-V relationships of currents recorded in indicated conditions showing the shift of reversal potentials when the bath (intracellular) solution was switched from 150 mM NaCl to 150 mM NaI. (C) Scatter plot of the changes of reversal potentials (ΔErev) when solution was switched from 150 mM NaCl to 150 mM NaI. WT currents in 1 mM Ca2+ were not included because they were not distinguishable from the currents endogenous to HEK293 cells. Because the interpretation methods for bi-ionic condition were not applicable here, we did NOT perform statistics and instead showed the values directly.
Figure 2
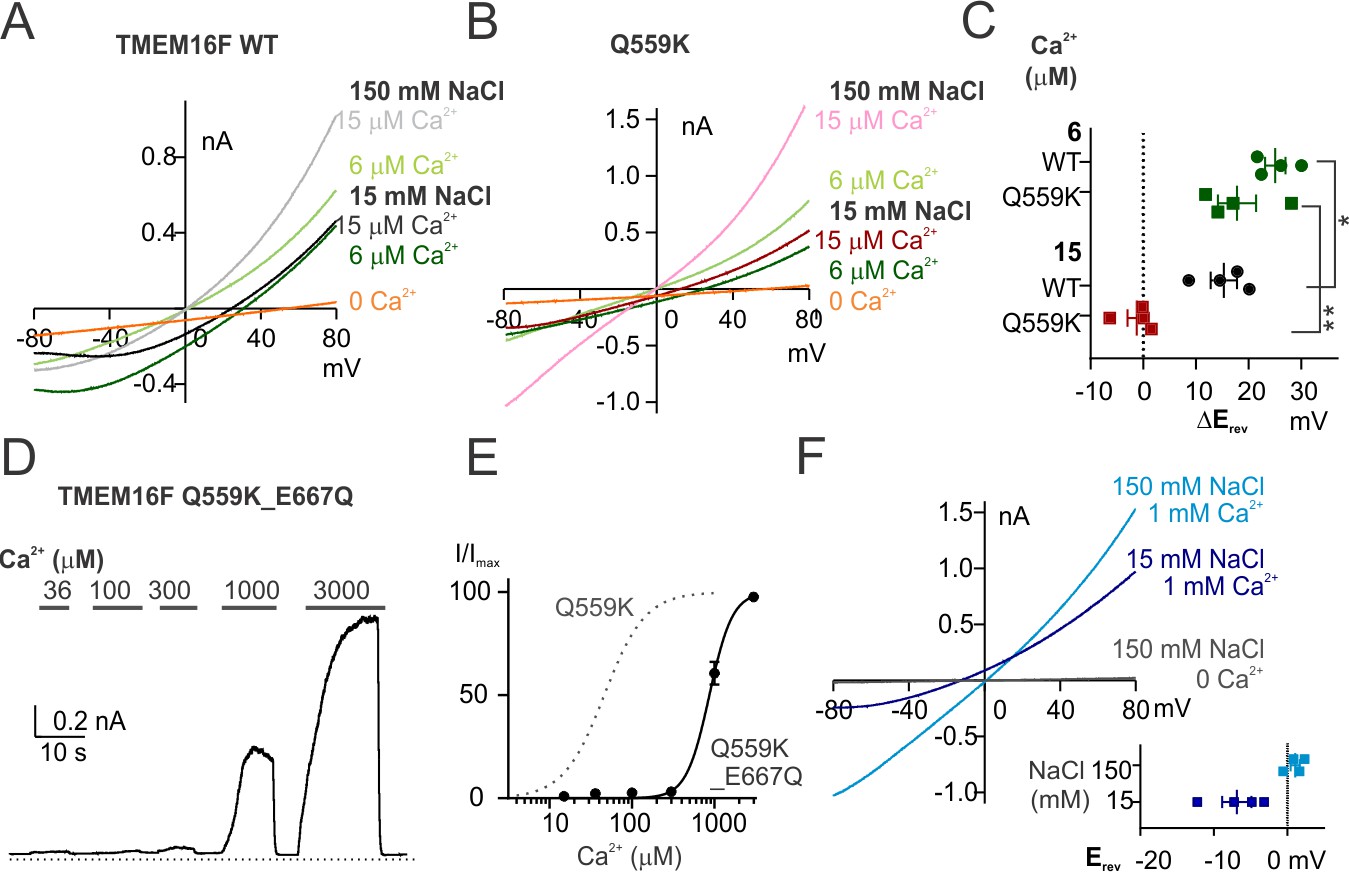
TMEM16F Q559K_E667Q channel is more permeable to Cl- than to Na+ in 1 mM Ca2+despite being half activated.
(A, B) Representative I-V relationships of WT and Q559K currents recorded in indicated conditions. The recording protocol was the same as in Figure 1E,F. Ca2+-free 15 mM NaCl solution was applied at the end for background subtraction. (C) Scatter plot of the changes of reversal potentials (ΔErev) when solution was switched to 15 mM NaCl, obtained from traces as in A and B. p-Values were determined with Fisher's LSD test after two-way ANOVA. (D) Representative recordings of TMEM16F Q559K_E667Q in different Ca2+ concentrations. The recording protocol was the same as in Figure 1A. (E) Dose-response curve for Ca2+-activation of Q559K_E667Q. The gray dotted line represents the curve for Q559K after 1 mM Ca2+, replotted from Figure 1C. (F) Representative I-V relationships of Q559K_E667Q recorded in indicated conditions. The recording protocol was the same as in Figure 1E,F. The insert shows the scatter plot of reversal potentials (Erev) obtained from traces as in F.
Figure 3
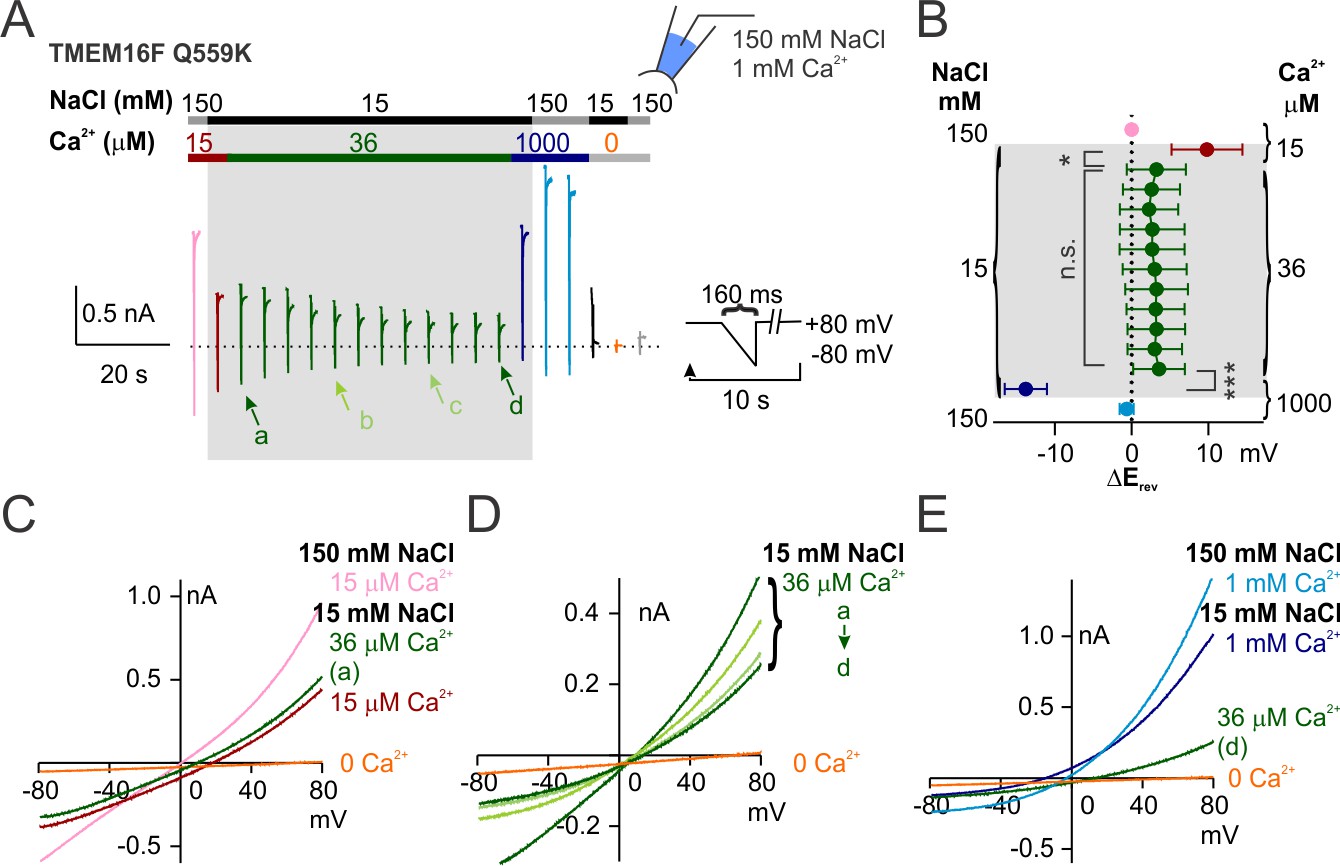
Q559K Erev only shifts with the change of Ca2+ concentration.
(A) Representative recording of TMEM16F Q559K held at +80 mV with a hyperpolarizing ramp (−1 V/s) once every 10 s in indicated conditions. (B) Summary of the averaged Erev with background subtraction (subtraction of the current in Ca2+-free 15 mM NaCl solution, orange trace in A, except for the current in 1 mM Ca2+) in indicated conditions. For all the traces recorded in 15 mM NaCl, Erev only shifts when Ca2+ concentration is changed. (C, D, E) Representative I-V relationships of Q559K at arrowed points in A, showing that Erev shifts when Ca2+ is increased from 15 µM to 36 µM, persists in 36 µM Ca2+ despite the constant rundown, and shifts when Ca2+ is increased from 36 µM to 1 mM.
Figure 4 with 2 supplements
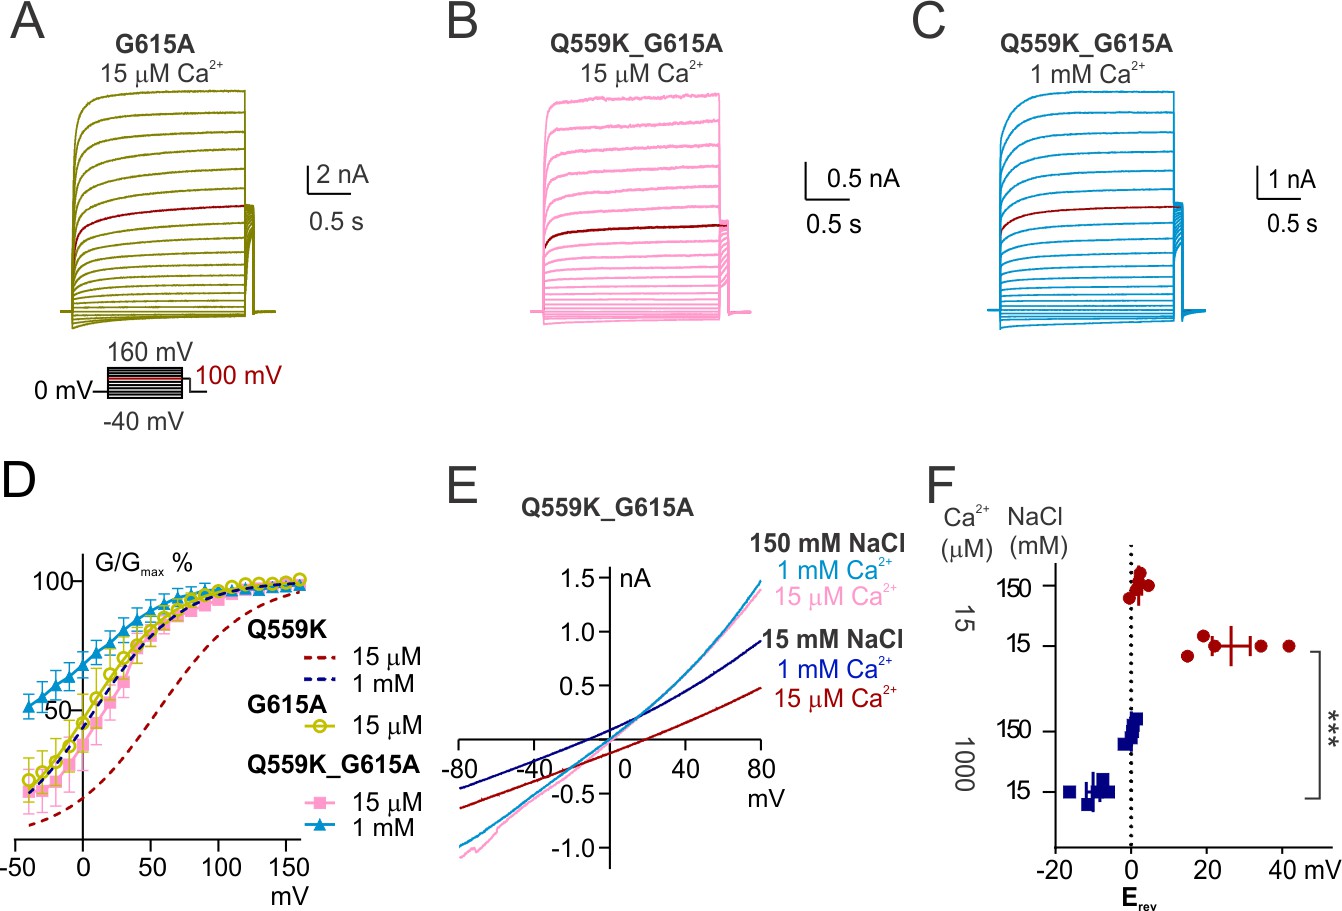
The change of ion permeability ratio is preserved despite TM6 conformational stabilization.
(A, B, C) Representative traces of G615A and Q559K_G615A recorded with a voltage family protocol as in Figure 1—figure supplement 1. The currents recorded at +100 mV are highlighted for comparison. (D) Averaged G-V relationships of G615A and Q559K_G615A currents. The method for data analysis was the same as that for WT in 15 µM Ca2+. The two traces for Q559K were replotted from Figure 1—figure supplement 1H. (D) Representative I-V relationships of Q559K_G615A recorded in indicated conditions. (F) Scatter plot of reversal potentials (Erev) obtained from traces as in E without background correction. p-Values were determined with Sidak's multiple comparisons following two-way ANOVA.
Figure 4—figure supplement 1
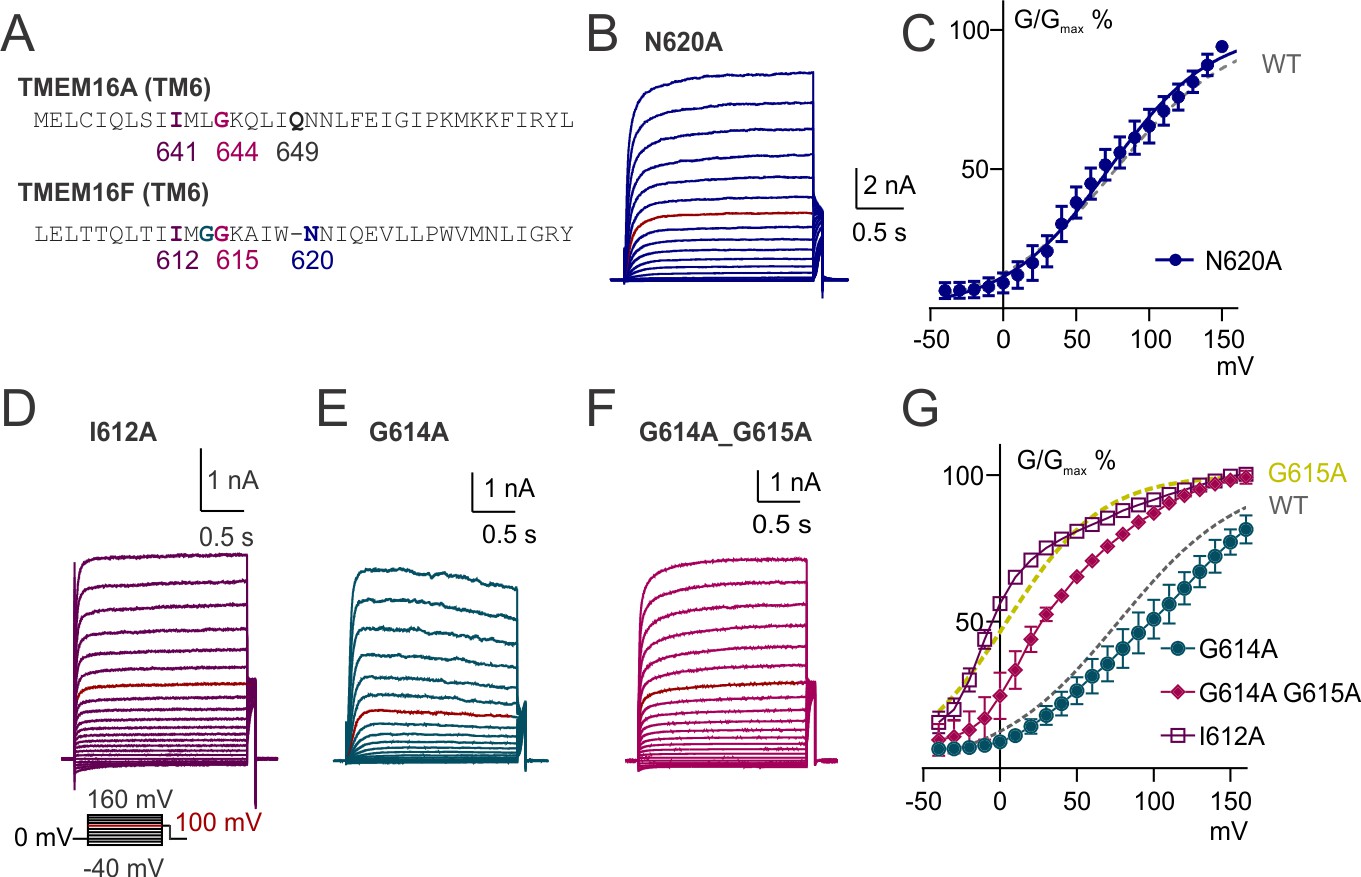
TM6 functions in TMEM16F gating.
(A) Alignment of TM6 sequences of TMEM16A and TMEM16F. The numbering for TMEM16A represents the isoform as used by Lam and Dutzler (2018). (B, D, E, F). Representative traces of TMEM16F mutants recorded in 15 µM Ca2+ with a voltage family protocol as in Figure 1—figure supplement 1. Currents recorded at +100 mV are highlighted for comparison. (C, G) Averaged G-V relationships of indicated TMEM16F mutants. The method for data analysis was the same as that for WT in 15 µM Ca2+. The traces for WT and G615A were replotted from Figure 1—figure supplement 1H and Figure 4D.
Figure 4—figure supplement 2
Recordings in indicated conditions with a hyperpolarizing ramp protocol.
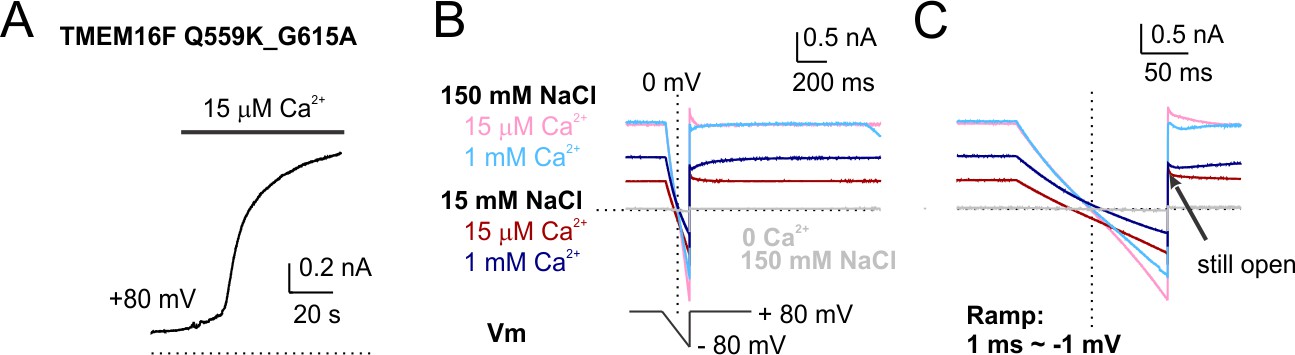
(A) Time courses of TMEM16F Q559K_G615A activation by 15 µM Ca2+ in 150 mM NaCl. The currents were held at +80 mV. (B) Recordings of reversal potentials with a hyperpolarizing ramp protocol following constant holding at +80 mV. The solutions were applied in the order of 150 mM, 15 mM NaCl with 15 µM Ca2+, 150 mM NaCl, 15 mM NaCl with 1 mM Ca2+. Ca2+-free solution was applied at the end to confirm the seal. (C) Detail amplification showing tail currents in B recorded at +80 mV following the hyperpolarizing ramp.
Figure 5 with 1 supplement
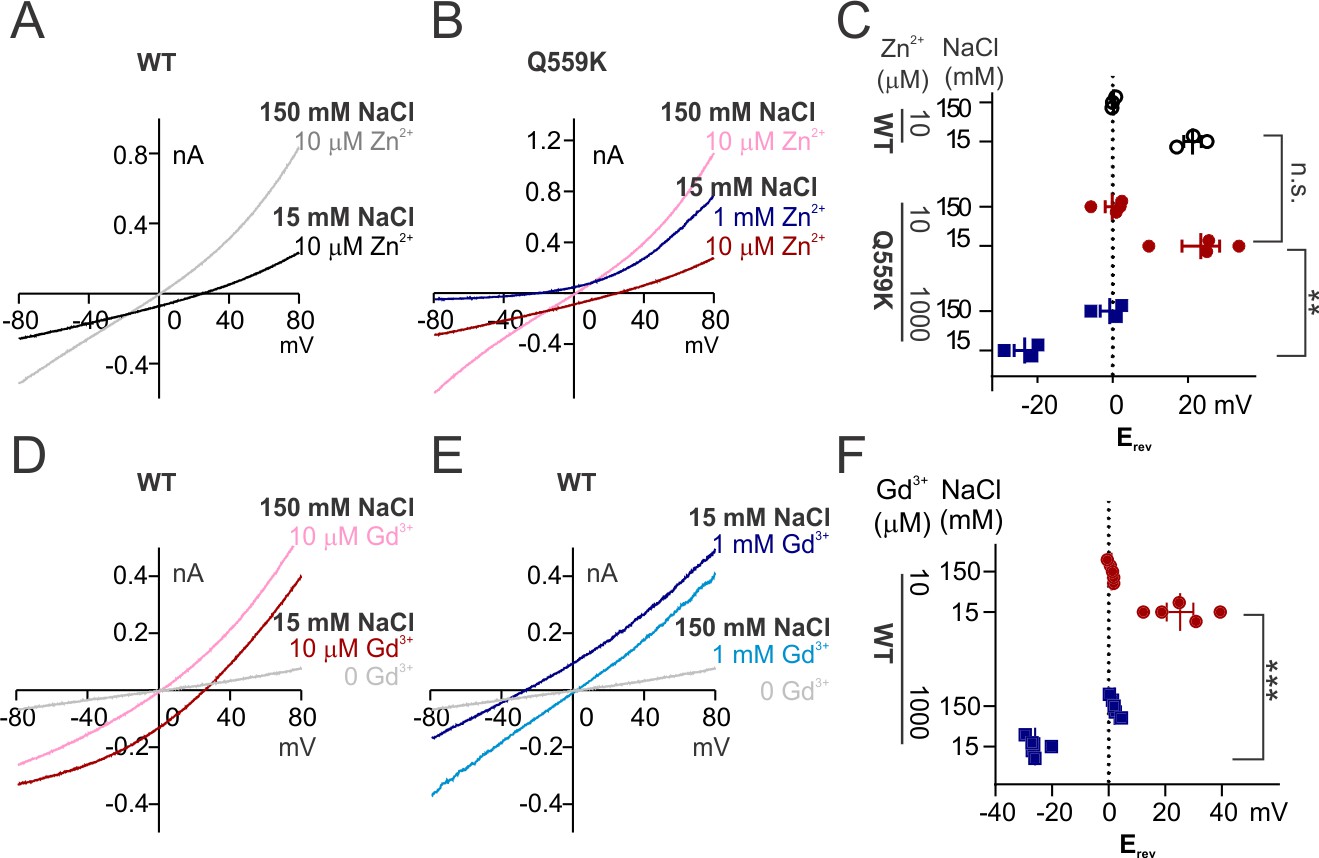
The change of ion permeability ratio is preserved when current is activated by Zn2+ or Gd3+.
(A, B) Representative I-V relationships of WT and Q559K recorded in indicated Zn2+-containing solutions. The currents were recorded with the same protocol as in Figure 1E,F. (C) Scatter plot of reversal potentials (Erev) obtained from traces as in A and B. p-Values were determined with Sidak's multiple comparisons following two-way ANOVA. (D, E) Representative I-V relationships of WT TMEM16F recorded in indicated Gd3+-containing solutions. Note that the current in 1 mM Gd3+ 15 mM NaCl is still distinguishable from background current. (F) Scatter plot of reversal potentials (Erev) obtained from traces as in E and F. p-Values were determined with Sidak's multiple comparisons following two-way ANOVA.
Figure 5—figure supplement 1

Supplementary recordings for Zn2+ and Gd3+activation of TMEM16F.
(A) Representative recording of WT TMEM16F current in response to indicated concentrations of Zn2+ and Ca2+. The rundown of current in 1 µM Zn2+ was observed in all the three recordings. (B) Representative recording of WT TMEM16F current in response to multiple applications of Zn2+. (C) Averaged current magnitudes measured at arrowed time points normalized to the respective initial magnitudes (I0), indicating that Zn2+-inactivation is reversible. (D) Representative recording of WT TMEM16F current in response to indicated concentrations of Gd3+ and Ca2+. The rundown of current in 10 µM Gd3+ was observed in all the five recordings. (E) Representative traces of TMEM16F WT recorded in 1 mM Gd3+ with a voltage family protocol as in Figure 1—figure supplement 1. Currents recorded at +100 mV are highlighted for comparison. (F) Averaged G-V relationships of indicated TMEM16F WT activated by Gd3+. The method for data analysis was the same as that for WT in 15 µM Ca2+.
Figure 6 with 2 supplements

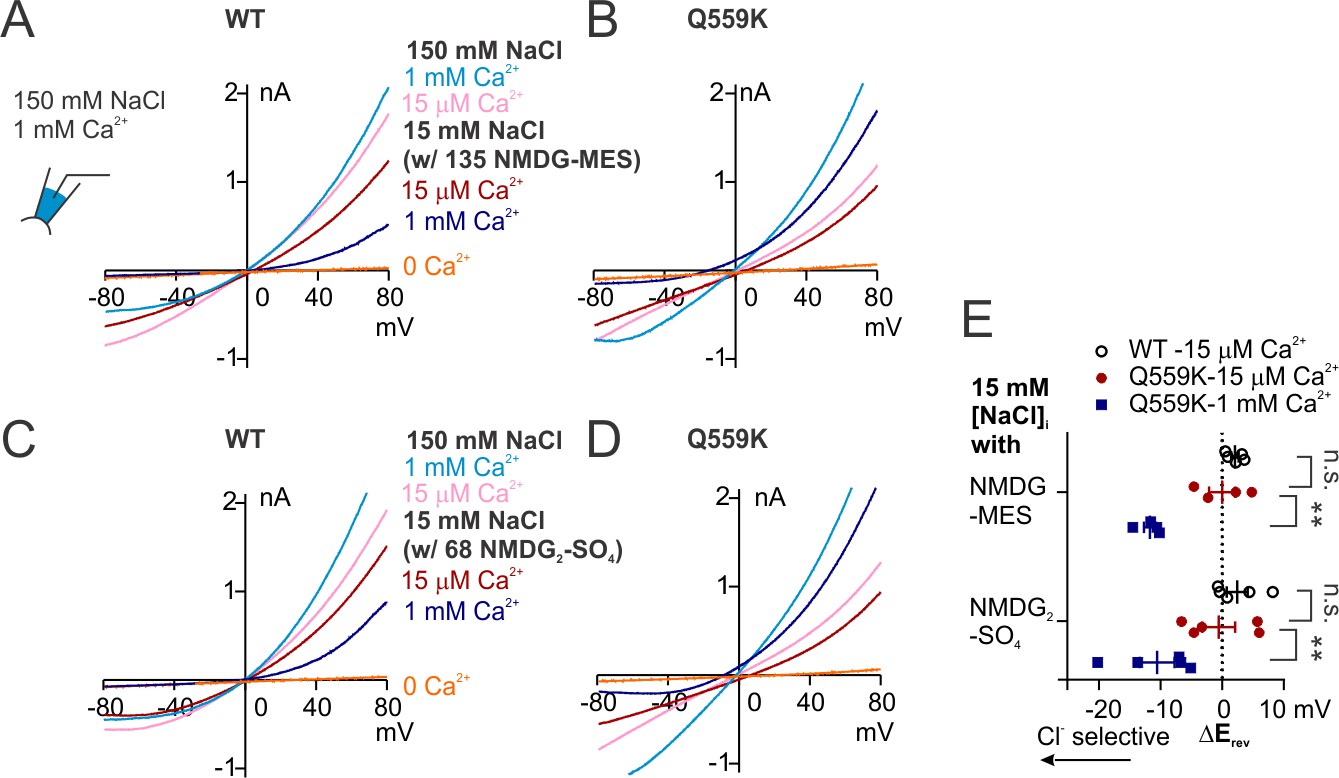
Ion permeability ratio is altered with change of intracellular NaCl concentration.
(A, B, C) Representative I-V relationships of WT and Q559K recorded with inside-out configuration in indicated conditions. The currents were reanalyzed from the recordings as in Figure 1—figure supplement 2. Notice NOT to directly compare the shift of Erev because the intracellular NaCl concentrations are varying. (D) Scatter plot showing the permeability ratio (PNa+/PCl-) calculated from the shift of reversal potentials (ΔErev) obtained from traces as in A, B and C. p-Value for WT was determined with Wilcoxon test. P values for Q559K were determined with Sidak's multiple comparisons following two-way ANOVA. (E, F) Representative I-V relationships of wild-type TMEM16F currents recorded with whole-cell configuration in indicated bath solutions. NMDG: N-methyl-D-glucamine; Gluc: gluconate. (G) Scatter plot of the changes of reversal potentials (ΔErev) obtained from recordings as in E and F. Due to the potentially varying PNa+/PCl-, we did NOT perform statistics or use them to calculate ion permeability ratios.
Figure 6—figure supplement 1
Recordings involving 15 mM NaCl bath balanced with NMDG-MES or NMDG2-SO4.
(A ,B, C, D) Representative recordings of TMEM16F WT and Q559K in indicated bath conditions, where the osmolarity of 15 mM NaCl bath solution was balanced with NMDG-MES or NMDG2-SO4. The currents were recorded with the same protocol as in Figure 1E,F. Ca2+-free 15 mM NaCl (balanced with the respective salt composition) was applied at the end for background correction. Note that the Erev values of WT currents in 1 mM Ca2+ (A and C, dark blue traces) were not distinguishable from those of the background currents (orange traces). (E) Scatter plot showing the changes of reversal potentials (ΔErev) when solution was switched to 15 mM NaCl, obtained from traces as in A ~ D. Background subtraction was performed for currents activated by 15 µM Ca2+. p-Values were determined with Sidak's multiple comparisons following two-way ANOVA.
Figure 6—figure supplement 2

Recordings with 15 mM NaCl in the pipette solution.
(A) Representative recordings of TMEM16F WT in different Ca2+ concentrations, where the pipette solution contained 15 mM NaCl balanced with mannitol. (B) Recording traces modified from A with liquid junction potential (12 mV) corrected. (C) Scatter plot of reversal potentials (Erev) obtained from traces as in (B). p- Value was determined with paired t-test. (D, E) Representative recordings of TMEM16F WT in different Ca2+ concentrations, where the pipette solution contained 15 mM NaCl balanced with mannitol NMDG-MES (D) or NMDG2-SO4 (E). The traces were plotted with the correction of liquid junction potentials (6 mM for D and 2 mM for E). (F) Scatter plot showing the reversal potential (Erev) after correction of liquid junction potentials, obtained from traces as in (F) and (G). p-Values were determined with Sidak's multiple comparisons following two-way ANOVA.
Figure 7 with 1 supplement
Depolarization alters permeability ratio synergistically with Ca2+ level.
(A, B, D, E) Representative I-V relationships of currents recorded in indicated conditions. The excised patch was held at +40 to+160 mV with increments of 40 mV (‘conditioning potentials’) followed by a hyperpolarizing ramp from +80 mV to −80 mV (−2 V/s). (C) Scatter plot showing the changes of reversal potentials (ΔErev) when solution was switched from 150 mM NaCl to 15 mM NaCl. For TMEM16A and WT TMEM16F, p-values were determined with one-way ANOVA. For TMEM16F Q559K, two-way ANOVA shows p<0.001 across voltages, p<0.0001 across Ca2+ concentrations. (F) Representative WT TMEM16F traces recorded in 15 µM Ca2+ 15 mM NaCl bath solution with the indicated protocol. The excised patch was held at 120 mV followed by a hyperpolarizing ramp from +120 mV to −30 mV (ramping speed from −0.3 V/s to −3 V/s), and the reversal potentials were corrected with background current recorded at the end. (G) The I-V relationships of the highlighted traces as in F, showing the currents reverse at the same point despite the change of rectification. (H). Summary of reversal potentials at different hyperpolarizing speeds obtained from traces as in G. Two-way ANOVA suggests that there is no significant difference among various hyperpolarizing speeds (p=0.28).
Figure 7—figure supplement 1
Representative traces of Q559K recorded with ramps of varoius hyperpolarizing speeds.
(A, C) Representative TMEM16F Q559K traces recorded in 15 µM Ca2+ or 1 mM Ca2+, both with 15 mM NaCl bath solutions. The recording protocol was the same as in Figure 7F. (B, D) The I-V relationships of the highlighted traces as in A and C, showing the currents in each condition reverse at the same point.
Figure 8 with 1 supplement

Diagram showing the proposed ion selectivity mechanism for TMEM16F and a comparison with TMEM16A.
(Upper) TMEM16F gating and ion selectivity. The binding of intracellular Ca2+ to the binding-pocket triggers the rearrangement of transmembrane helices and opens the ion permeation pathway (from 1 to 2). The elevation of intracellular Ca2+ level shifts the electrostatic field along the permeation pathway from a Na+-favoring state (shaded with cold color) to that with increased attraction to Cl- (shaded with warm color, from 2 to 3). Each red dot represents a Ca2+-entry event, while the number of Ca2+ ions for every event is not specified. Depolarization drives Ca2+ into both the binding pocket and the permeation pathway; PIP2 stabilizes the open conformation but does not affect the ion selectivity. Hyperpolarization triggers the closing of the channel, preceding the retreating of Ca2+ from the site that allows it to affect the permeation pathway, so that the channel maintains the electrostatic field and ‘memorizes’ the permeability ratio (from 3 to 4). (Lower) TMEM16A might harbor a selectivity filter restrictedly selective for anions (scenario 1), either with a size-dependent mechanism (illustrated with the zigzags) or a strong electrostatic field (illustrated with red shade). Alternatively, the change of electrostatic field might be tightly coupled to Ca2+-gating (scenario 2), so that the pore restrictedly selects for anions once it is opened.
Figure 8—figure supplement 1
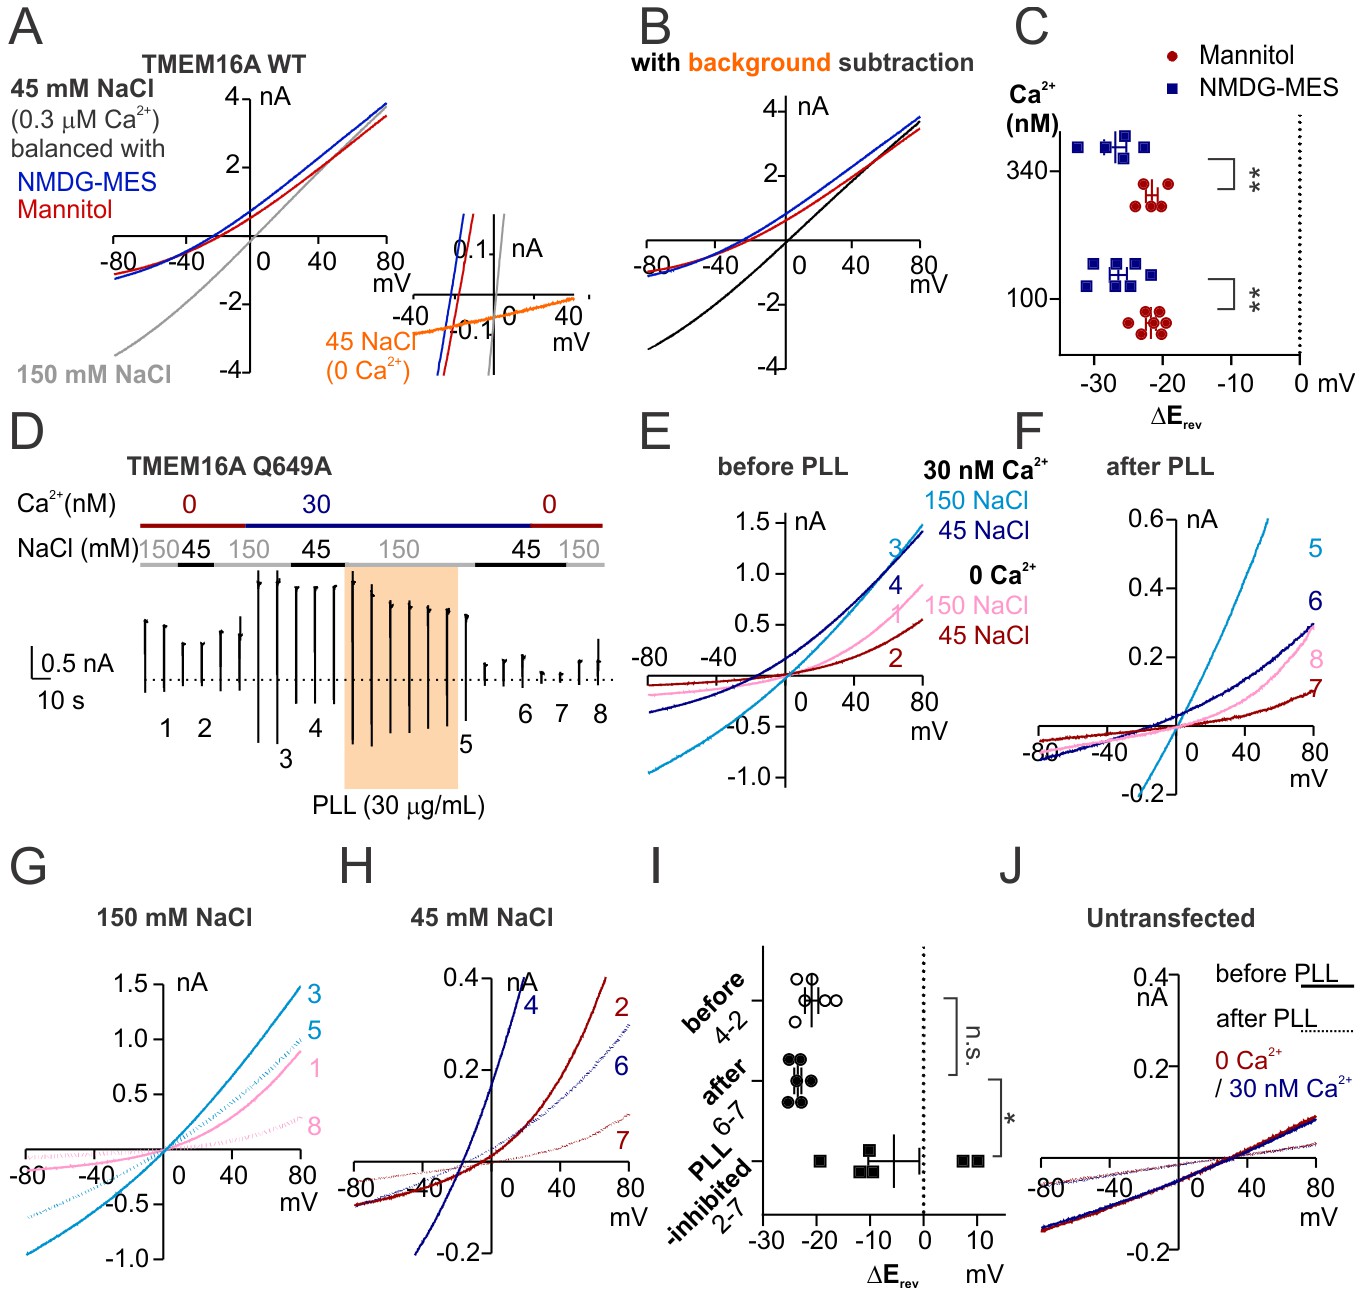
TMEM16A ion selectivity.
(A) Representative I-V relationships of TMEM16A recorded in indicated conditions. Insert shows the detail amplification with the background current. (B) Representative I-V relationships of TMEM16A with background subtraction. (C) Scatter plot of Erevs obtained from traces as in A, with background subtraction. p-Values were determined with Sidak's multiple comparisons following two-way ANOVA. (D) Representative recording of TMEM16A Q649A held at +80 mV with a hyperpolarizing ramp (−1 V/s) once every 10 s under indicated conditions. The orange shade represents the treatment of poly-L-lysine (PLL) that promotes current rundown. (E, F, G, H) Representative I-V relationships of labeled traces as in D. (I) Scatter plot showing Erevs obtained from traces as in D. p-Values were determined with Tukey's multiple comparisons following one-way ANOVA. (J) Representative I-V relationships of an untransfected cell under indicated conditions, showing that PLL also triggers the rundown of the endogenous cation-selective current.
Author response image 1
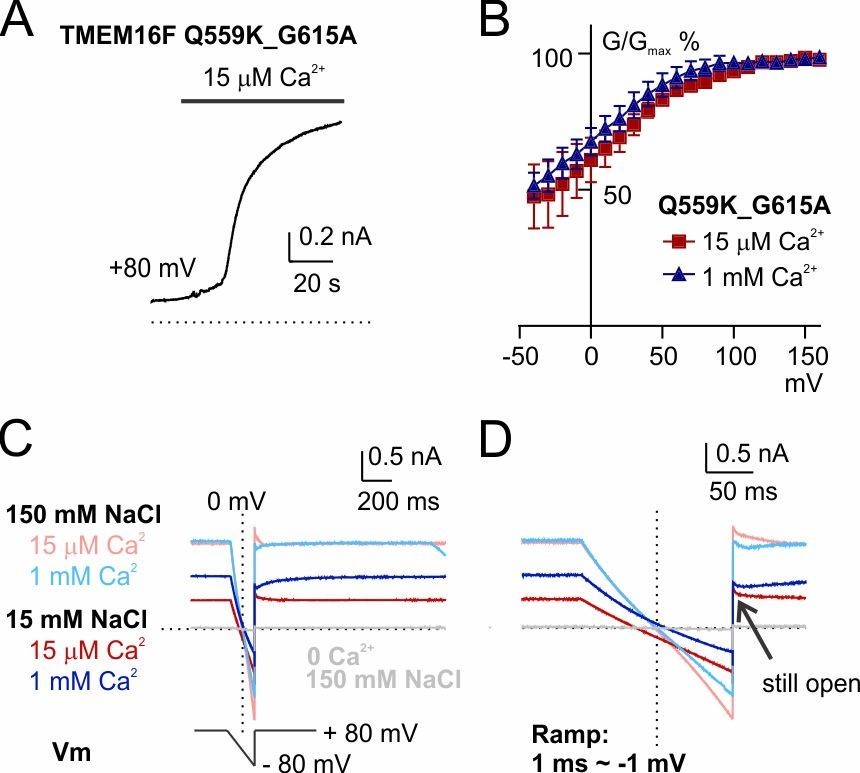
The shift of Erev persists in a mutant with reduced outward rectification, Q559K_G615A.
(A) Time course of TMEM16F Q559K_G615A activation by 15 µM Ca2+ in 150 mM NaCl. The inside-out membrane patch was held at +80 mV. (B) Normalized conductance-voltage relationships. (C) Recordings of reversal potential with a hyperpolarizing ramp protocol following constant holding potential at +80 mV. The solutions were applied in the order of 150 mM with 15 µM Ca2+, 15 mM with 15 µM Ca2+, 150 mM NaCl with 1 mM Ca2+, 15 mM NaCl with 1 mM Ca2+. Ca2+-free 150 mM NaCl solution was applied at the end to confirm the seal. (D) Detail amplification showing the tail currents in C recorded at +80 mV following the hyperpolarizing ramp.
Author response image 2
Author response image 3

Author response image 4
Author response image 5

Author response image 6

Author response image 7
Author response image 8
Author response image 9
Additional files
-
Transparent reporting form
- https://doi.org/10.7554/eLife.45187.022
Download links
A two-part list of links to download the article, or parts of the article, in various formats.
Downloads (link to download the article as PDF)
Open citations (links to open the citations from this article in various online reference manager services)
Cite this article (links to download the citations from this article in formats compatible with various reference manager tools)
Dynamic change of electrostatic field in TMEM16F permeation pathway shifts its ion selectivity
eLife 8:e45187.
https://doi.org/10.7554/eLife.45187


