Dynamic change of electrostatic field in TMEM16F permeation pathway shifts its ion selectivity
Abstract
TMEM16F is activated by elevated intracellular Ca2+, and functions as a small-conductance ion channel and as a phospholipid scramblase. In contrast to its paralogs, the TMEM16A/B calcium-activated chloride channels, mouse TMEM16F has been reported as a cation-, anion-, or non-selective ion channel, without a definite conclusion. Starting with the Q559K mutant that shows no current rundown and less outward rectification in excised patch, we found that the channel shifted its ion selectivity in response to the change of intracellular Ca2+ concentration, with an increased permeability ratio of Cl- to Na+ (PCl-/PNa+) at a higher Ca2+ level. The gradual shift of relative ion permeability did not correlate with the channel activation state. Instead, it was indicative of an alteration of electrostatic field in the permeation pathway. The dynamic change of ion selectivity suggests a charge-screening mechanism for TMEM16F ion conduction, and it provides hints to further studies of TMEM16F physiological functions.
https://doi.org/10.7554/eLife.45187.001Introduction
Mammalian TMEM16F (Anoctamin-6, ANO6) is a membrane protein with dual functions of phospholipid scrambling and ion conduction, both activated by elevation of intracellular Ca2+ (Whitlock and Hartzell, 2017; Falzone et al., 2018; Bevers and Williamson, 2016; Pedemonte and Galietta, 2014). When activated, TMEM16F mediates the exposure of phosphatidylserine, a lipid normally restricted to the inner leaflet of cell membrane lipid bilayer, to the cell surface (Suzuki et al., 2010). This process, known as lipid scrambling, initiates many physiological processes such as recruitment of tissue factors to the platelet surface for thrombin production to trigger blood coagulation and modulation of immune responses in T lymphocytes (Suzuki et al., 2010; Yang et al., 2012; Hu et al., 2016; Zaitseva et al., 2017). TMEM16F is also a Ca2+-activated small-conductance ion channel (Yang et al., 2012), raising the possibility that it has additional physiological functions that have not been revealed. However, there is discrepancy regarding TMEM16F ion selectivity reported by different labs. Recorded with excised-patch inside-out configuration, TMEM16F channels are quickly activated by micromolar Ca2+ and they are more permeable to cations (mainly physiological cations such as Na+, K+ and Ca2+) than to Cl- (Yang et al., 2012; Alvadia et al., 2019). Surprisingly, many groups have reported that the TMEM16F whole-cell current is activated several minutes after cytoplasmic Ca2+ elevation, and it displays less cation-selectivity (Yu et al., 2015) or even higher permeability to Cl- than to Na+ (Grubb et al., 2013; Scudieri et al., 2015; Shimizu et al., 2013; Tian et al., 2012). This disagreement hampers our further understanding of the functions of this membrane protein.
TMEM16F belongs to the mammalian TMEM16 membrane protein family with 10 members (Whitlock and Hartzell, 2017; Falzone et al., 2018; Pedemonte and Galietta, 2014). The founding members TMEM16A (ANO1) and TMEM16B (ANO2) represent the only two canonical Ca2+-activated Cl- channels (CaCC) without lipid scrambling functions (Schroeder et al., 2008; Caputo et al., 2008; Yang et al., 2008; Stephan et al., 2009), while several other mammalian homologs show a modest selectivity between cations and anions but with lipid scrambling capacities (Suzuki et al., 2010; Suzuki et al., 2013; Gyobu et al., 2017; Le et al., 2019a; Watanabe et al., 2018), a property closer to that of their fungal homologues (Malvezzi et al., 2013; Brunner et al., 2014; Lee et al., 2016). Mammalian TMEM16 proteins are dimeric, as revealed by structural analyses of TMEM16A, TMEM16F and TMEM16K via electron cryo-microscopy (cryo-EM) or crystallography (Alvadia et al., 2019; Paulino et al., 2017a; Paulino et al., 2017b; Bushell, 2018; Dang et al., 2017; Feng et al., 2019), and each subunit contains a permeation pathway that works independently (Paulino et al., 2017b; Lim et al., 2016; Jeng et al., 2016). For TMEM16A, each subunit contains 10 transmembrane helices (TM1 ~TM10), and the stabilization of TM6 by the binding of Ca2+ ions to the binding-pocket formed by acidic residues on TM6, TM7 and TM8 within the transmembrane domain opens the permeation pathway, composed of TM3-TM8 (Paulino et al., 2017a; Peters et al., 2018). Recent studies suggested that, in addition to the pore-lining residues on TM3-TM8 along the TMEM16A permeation pathway for anion conduction, the positive electrostatic field introduced by the Ca2+ ions bound to the binding-pocket also contributes to anion accessibility to the pore (Lam and Dutzler, 2018). This finding raised the possibility that TMEM16 proteins might adopt a strategy of utilizing the electrostatic field to control ion accessibility to the pore, a process that allows these proteins to be modulated by their surroundings such as Ca2+ level. We hypothesize that TMEM16F shifts its ion selectivity in response to elevation of intracellular Ca2+ concentrations. However, because TMEM16F current in inside-out excised patch exhibits rapid desensitization and rundown in high Ca2+ (Ye et al., 2018), it is challenging to test for TMEM16F ion permeability ratio under a wide range of Ca2+ concentrations.
In TMEM16F, glutamine 559 (Q559) faces the ionic permeation pathway, and lysine substitution of this pore-lining residue (Q559K) reduces the ratio of Na+ permeability to Cl- permeability (PNa+/PCl-) (Yang et al., 2012; Alvadia et al., 2019; Feng et al., 2019). Previous studies also show that the current of Q559K persists with prolonged exposure of the excised patch to high intracellular Ca2+, and that it displays reduced outward rectification (Alvadia et al., 2019; Nguyen et al., 2019). In this study, we found that this mutant has different ratio of Na+ permeability to Cl- permeability (PNa+/PCl-) in different Ca2+ concentrations. The shift of permeability ratio does not correlate with alterations of channel open states, but instead is regulated by the change of electrostatic field along the permeation pathway, on which divalent cations such as Ca2+ and Zn2+ have more significant impact than monovalent ions. Depolarization, which facilitates intracellular cation entry into the membrane electric field, promotes the shift of the relative permeability toward a preference for Cl- over cations. Such an electrostatic modulation could reflect a general feature of the mechanism of ionic transportation by TMEM16 proteins, and it suggests that TMEM16F harbors an inherent machinery that allows it to dynamically modulate preference between cations and anions in response to its local environment.
Results
TMEM16F Q559K increases permeability to Cl- as intracellular Ca2+ increases
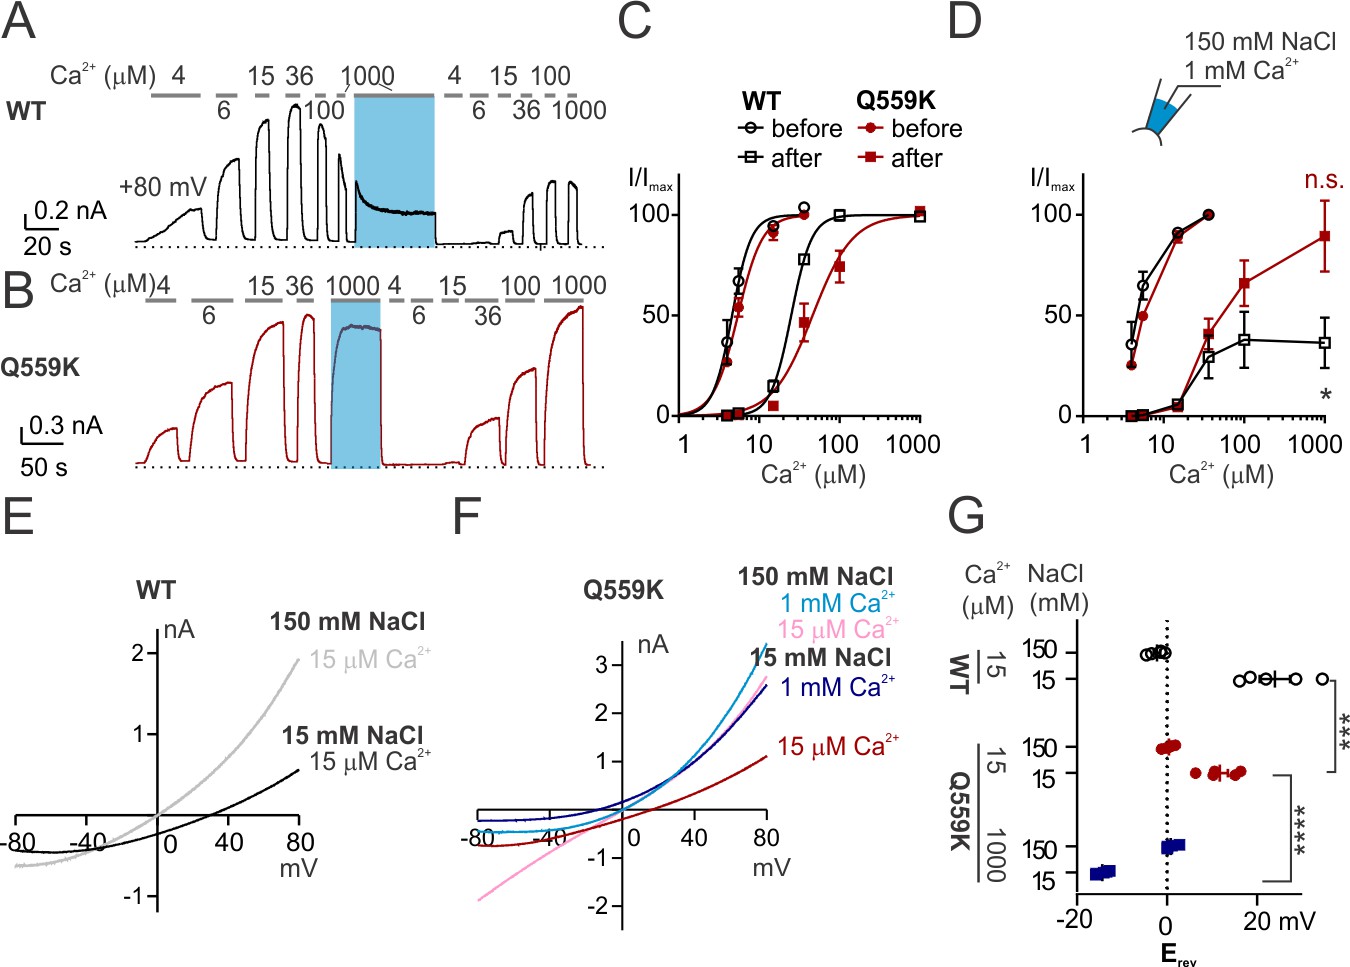
Recording from inside-out membrane patch held at +80 mV revealed that wild-type mouse TMEM16F current was activated by intracellular Ca2+ in a dose-dependent manner. The current started to decrease when Ca2+ was higher than ~30 µM, as a result of both desensitization and rundown (Figure 1A,C,D) (Ye et al., 2018). Here, desensitization refers to a decreased sensitivity to Ca2+, caused by degradation of PIP2 via membrane-tethered phospholipase activated by high intracellular Ca2+. Desensitization is also reflected by the requirement of stronger depolarization for channel activation, as a result of the synergy between depolarization and Ca2+ level (to be shown later). Rundown refers to a reduction of current magnitude (induced by 1 mM Ca2+ in this case). To measure the voltage dependence of activation, we recorded with a voltage-family protocol from −40 mV to +160 mV with 10 mV increments followed by holding at 100 mV to obtain ‘tail-currents’, which we used as indicators of steady-state conductance at the range of voltages. Fitting to the sigmoidal conductance-voltage (G-V) relationship yielded V1/2 of 76 ± 11 mV in 15 µM Ca2+ for wild-type TMEM16F, while in 1 mM Ca2+, desensitization strongly reduced the voltage-gating, as was previously reported (Figure 1—figure supplement 1A,B,C) (Ye et al., 2018). The combination of rundown and desensitization rendered it difficult to record the reversal potential (Erev) of wild-type TMEM16F in 1 mM Ca2+. In our experiments, we measured the Erev from the current recorded with a hyperpolarizing ramp (from +80 mV to −80 mV, 1 V/s) following holding the excised patch at +80 mV. When we switched the bath (equivalent to intracellular solution) from 150 mM NaCl to 45 mM or 15 mM NaCl (osmolarity balanced with mannitol), the current recorded from Tmem16f-transfected cells immediately diminished with the hyperpolarizing voltage and was indistinguishable from the background current endogenous to HEK293 cells (Figure 1—figure supplement 2E,F). For TMEM16F current induced by 15 µM Ca2+ before desensitization, despite the channel closing with the hyperpolarizing voltage, the remaining current was still large enough, distinguishable from the current recorded in 0 Ca2+ (referred to as ‘background current’, Figure 1—figure supplement 2B,C). Consistent with previous reports (Yang et al., 2012; Alvadia et al., 2019), it was moderately selective for Na+ over Cl- (Figure 1E).

TMEM16F Q559K shifts its reversal potential in response to change of intracellular Ca2+ concentration.
(A, B) Representative recordings of TMEM16F wild type (WT) and Q559K in different Ca2+ concentrations. Traces were recorded from transfected HEK293 cells and the inside-out patches were held at +80 mV. The shades illustrate 1 min treatment with 1 mM Ca2+ that catalyzes PIP2 degradation by membrane-tethered phospholipase. (C) Dose-response curves for Ca2+-activation of WT and Q559K before and after 1 mM Ca2+ treatment, respectively. Currents before and after 1 mM Ca2+ were separately fitted to the Hill equation and normalized to their respective maximal amplitudes. (D) Change of current magnitudes of WT and Q559K. The currents were normalized to the maximal magnitudes before 1 mM Ca2+ for each cell. *p<0.05 (one sample t test against hypothetical value ‘1’). (E, F) Representative I-V relationships of WT and Q559K recorded in indicated conditions. The traces were recorded with a hyperpolarizing ramp from +80 mV to −80 mV (−1 V/s) following holding at +80 mV. (G) Scatter plot of reversal potentials (Erev) obtained from traces as in E and F without background correction. p-Values were determined with Sidak's multiple comparisons following two-way ANOVA.
In contrast, the mutant Q559K current recorded at +80 mV showed minimal rundown in 1 mM Ca2+, in spite of desensitization to Ca2+ activation (Figure 1B) (Alvadia et al., 2019; Ye et al., 2018). Normalized to the respective maximal magnitudes of the currents before and after 1-min-treatment of 1 mM Ca2+, EC50 of Ca2+-activation was shifted from 5.6 ± 0.3 µM to 52 ± 11 µM (Figure 1C), while the normalized fully activated current magnitude was 0.89 ± 0.18 (current in 1 mM Ca2+ normalized to that before 1 mM Ca2+), significantly different from 0.36 ± 0.13 for wild type (Figure 1D). We also measured the steady-state conductance-voltage relationship from −40 mV to +160 mV. Desensitization caused a right-shift of the voltage-dependence of Q559K current in 15 µM Ca2+ (according to the comparison of 15 µM Ca2+-activated current before and after 1 mM Ca2+-treatment, Figure 1—figure supplement 1E,G), but in 1 mM Ca2+ the left-shift overrode the effect of desensitization, with V1/2 being 18 ± 10 mV (Figure 1—figure supplement 1F,H). The left shift of voltage-dependence in 1 mM Ca2+ probably explains the absence of rundown in Q559K current as observed for wild type, since at +80 mV Q559K in 1 mM Ca2+ is activated to a greater level than Q559K in 15 µM Ca2+ (with endogenous PIP2 in cell membrane) or wild type in 1 mM Ca2+ (Figure 1—figure supplement 1). Taken together, the Q559K mutation that minimized rundown allowed us to record TMEM16F current around physiological membrane potentials in a wide-range of Ca2+ concentration, here particularly, to measure Erev in 1 mM Ca2+.
Interestingly, the Erev of TMEM16F Q559K current activated by 1 mM Ca2+ exhibited a left-shift to −14 ± 1 mV in 15 mM NaCl, suggesting that it was more permeable to Cl- than to Na+ (Figure 1F,G), in contrast to 12 ± 2 mV as the Erev of it in 15 µM Ca2+ (recorded with the same protocol as for wild type above). Q559K mutant channels in 1 mM Ca2+ had a lower threshold for voltage activation than in 15 µM Ca2+ (Figure 1—figure supplement 1H), but the current quickly diminished with the hyperpolarizing voltage as in the case of wild-type TMEM16F (Figure 1—figure supplement 2K). The remaining current (confirmed with the ‘tail current’ recorded at +80 mV immediately following the ramp, Figure 1—figure supplement 2L) was nonetheless distinguishable from the background current endogenous to HEK293 cells, revealing that it reversed at a negative membrane potential. The current endogenous to HEK293 cells was partially inhibited in 1 mM Ca2+ (Figure 1—figure supplement 3A,B,C), thus rendering it difficult to measure for background correction in each recording in 1 mM Ca2+. However, with the confirmation that the endogenous current was selective for cation (Figure 1—figure supplement 3A,B,C) so that the ‘real’ TMEM16F-mediated current in 1 mM Ca2+ should reverse at an even lower membrane potential if the contribution of background current could be adequately removed (Figure 1—figure supplement 3F), we chose to take a ‘safer’ step by not performing background subtraction if the comparison involved currents activated by 1 mM Ca2+. Corrected for the liquid junction potential calculated with Clampex, these results indicated that the PNa+/PCl- was 0.47 ± 0.03 in 1 mM Ca2+, in contrast to 2.1 ± 0.4 as calculated from Erev in 15 µM Ca2+.
We asked whether the phenotype of Erev shifting is specific to the introduction of lysine to the position Q559 in TMEM16F. For the data shown above, Erev measurements were made after the solution exchange was complete and the current alteration reached equilibrium, in which case the Erev of wild-type TMEM16F in 1 mM Ca2+ was not measurable. Now we switched to 1 mM Ca2+ when the patch was incubated in 15 mM NaCl and immediately recorded Erev. With this protocol, we found a left-shift of Erev accompanied with rapid current inactivation, until the current was too small to be distinguishable from endogenous current (Figure 1—figure supplement 4A,B,C). Thus, wild-type TMEM16F dynamically underwent the transition of an increased preference for Cl- permeation with the elevation of intracellular Ca2+ concentration. It has been recently reported that mutation of Q559 to aromatic amino acids (such as Q559W) in TMEM16F also prevents current rundown (Nguyen et al., 2019). We measured the Erev of Q559W current activated by 15 µM Ca2+ and 1 mM Ca2+ in 15 mM NaCl with the protocol as for Q559K. Although in each condition the Erev of Q559W was more positive than that of Q559K, the Erev shift persisted, regardless of background subtraction (with background currents recorded in Ca2+-free solutions with the same NaCl concentration) (Figure 1—figure supplement 4D,E,F). The above results showed that TMEM16F increased the relative permeability to Cl- (versus Na+) when Ca2+ concentration was raised from 15 µM to 1 mM, in both wild type and mutants.
TMEM16F has been reported to be permeable to a variety of cations. With the respective published experimental settings, the permeabilities to many physiological cations (Na+, K+, Ca2+) were higher than that to Cl-, while the permeability to some other cations may be lower (Yang et al., 2012; Yu et al., 2015). Among anions, both wild-type TMEM16F and mutant channels are more permeable to I- than Cl- (Figure 1—figure supplement 5) (Nguyen et al., 2019), similar to the preference of CaCC for larger anions (Schroeder et al., 2008; Caputo et al., 2008; Yang et al., 2008). In this study, we will mainly focus on the comparison between Na+ permeability and Cl- permeability unless otherwise stated. Given the dynamic PNa+/PCl- ratio, we could not employ the calculation methods normally used for bi-ionic conditions to analyze data obtained with solutions involving a third ion species. Additionally, for each experiment in the following study, we performed paired-comparison within the same patches to avoid ambiguities arising from large variations across different recordings.
Q559K channel permeability ratio PNa+/PCl- varies with intracellular Ca2+ concentration
We wondered whether the two types of ion selectivity of the Q559K mutant channel correspond to multiple open states. For example, the channel may be in an intermediate open state in 15 µM Ca2+ but a fully open state in 1 mM Ca2+. To test this possibility, we first tested the ion permeability ratio of current activated by 6 µM Ca2+, a condition where both WT and Q559K channels were activated to yield about half of the maximal current magnitudes (Figure 1A,B,C). To obtain accurate measurements, we subtracted the current recorded in Ca2+-free solution (with 15 mM NaCl) from those recorded in 6 and 15 µM Ca2+ for each excised patch. We found that for each recording from either WT or Q559K, the current evoked by 6 µM Ca2+ reversed at a more positive voltage than that by 15 µM Ca2+ (Figure 2A,B,C). To dissociate the effect of Ca2+ concentration from that attributable to different open states of the channel, we made use of the Ca2+-binding-site mutant, E667Q, that exhibits an elevation of EC50 of Ca2+-activation (Yang et al., 2012; Alvadia et al., 2019). The EC50 of the double-mutant, Q559K_E667Q, was 0.88 ± 0.06 mM, suggesting that the double mutant should not be in the fully open state in 1 mM Ca2+ (Figure 2D,E). If the increase of anion permeability only occurs when channel is fully open, the current through Q559K_E667Q channels should reverse at a positive potential in 1 mM Ca2+. Strikingly, the current in 1 mM Ca2+ reversed at −6.9 ± 2.0 mV, corresponding to a channel with higher permeability to Cl- than to Na+ (Figure 2F). This indicates either that TMEM16F ion permeability preference is not correlated with its open state, or that the E667Q mutation circumvents the intermediate open state (if any) and causes the mutant channel to directly enter a fully-open conformation.

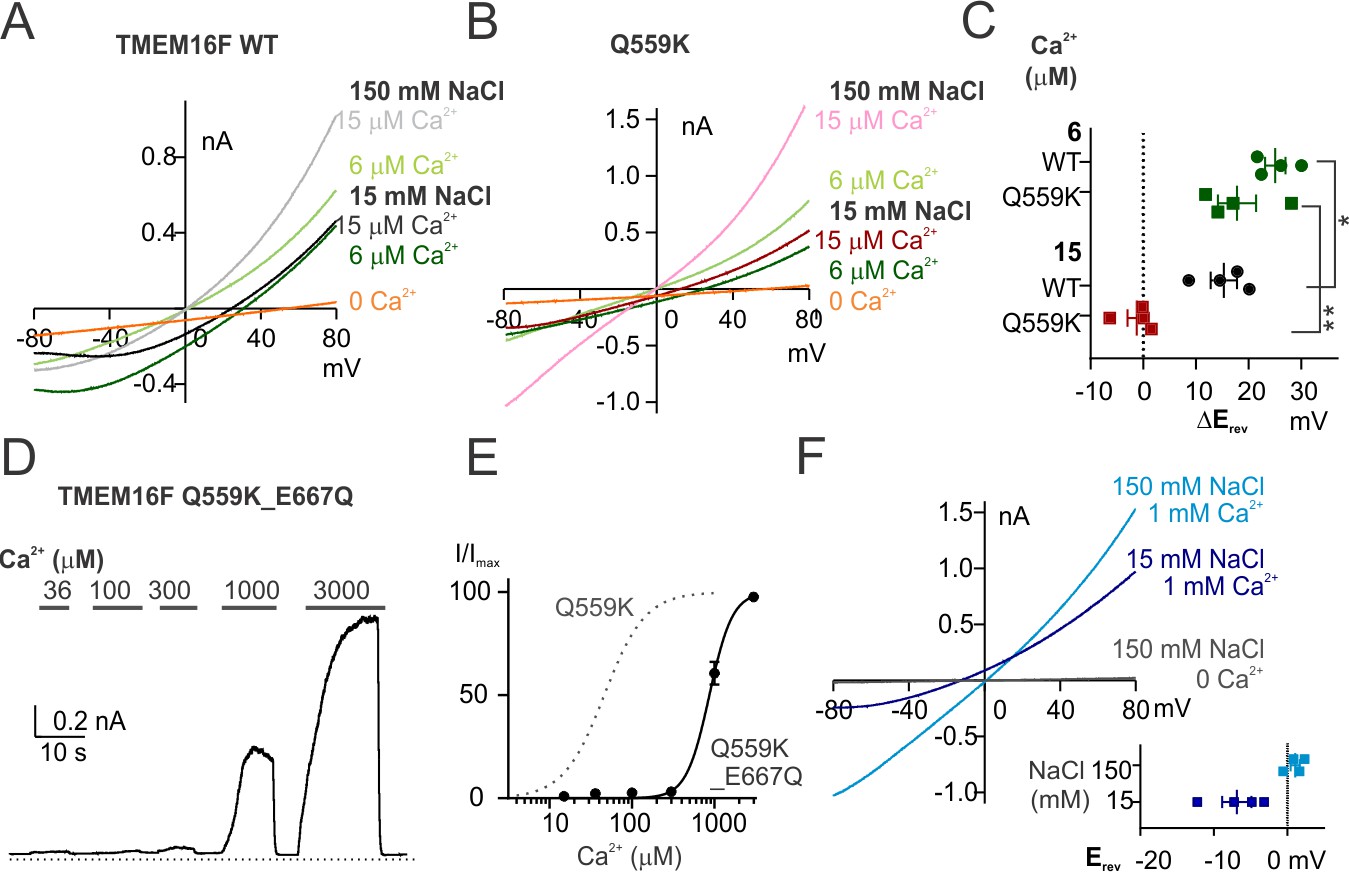
TMEM16F Q559K_E667Q channel is more permeable to Cl- than to Na+ in 1 mM Ca2+despite being half activated.
(A, B) Representative I-V relationships of WT and Q559K currents recorded in indicated conditions. The recording protocol was the same as in Figure 1E,F. Ca2+-free 15 mM NaCl solution was applied at the end for background subtraction. (C) Scatter plot of the changes of reversal potentials (ΔErev) when solution was switched to 15 mM NaCl, obtained from traces as in A and B. p-Values were determined with Fisher's LSD test after two-way ANOVA. (D) Representative recordings of TMEM16F Q559K_E667Q in different Ca2+ concentrations. The recording protocol was the same as in Figure 1A. (E) Dose-response curve for Ca2+-activation of Q559K_E667Q. The gray dotted line represents the curve for Q559K after 1 mM Ca2+, replotted from Figure 1C. (F) Representative I-V relationships of Q559K_E667Q recorded in indicated conditions. The recording protocol was the same as in Figure 1E,F. The insert shows the scatter plot of reversal potentials (Erev) obtained from traces as in F.
To dissociate the correlation between Ca2+ concentration and activation state, we utilized the desensitization phenotype of TMEM16F Ca2+-gating via exposure to high Ca2+. We previously reported that TMEM16F in 36 µM Ca2+ undergoes a slow desensitization with time constant of ~60 s possibly due to the slow degradation of PIP2. TMEM16F Q559K activation by 36 µM Ca2+ reached full or less-than-half open state, respectively, before or after desensitization (Figure 1B,C). We maintained the inside-out patches from Q559K-transfected cells in 36 µM Ca2+ (15 mM NaCl) for 90–100 s and measured Erev once every 10 s (Figure 3). The Erev was left-shifted when the Ca2+ concentration was raised from 15 µM to 36 µM. During the slow desensitization in 36 µM Ca2+, Erev (corrected with subtraction of background current recorded in 0 Ca2+ afterwards) remained unchanged despite the constant decrease of current magnitude and the increase of outward rectification. We therefore concluded that the reversal potential of Q559K shifted only when Ca2+ concentration was changed, independently of current magnitude, open state, or rectification level. Also, although it was not clear whether the permeation pathway could be partially composed of the headgroups of lipids being scrambled, we inferred that at least PIP2, which was slowly depleted during incubation in 36 µM Ca2+, did not contribute to the shift of ion permeability ratio.

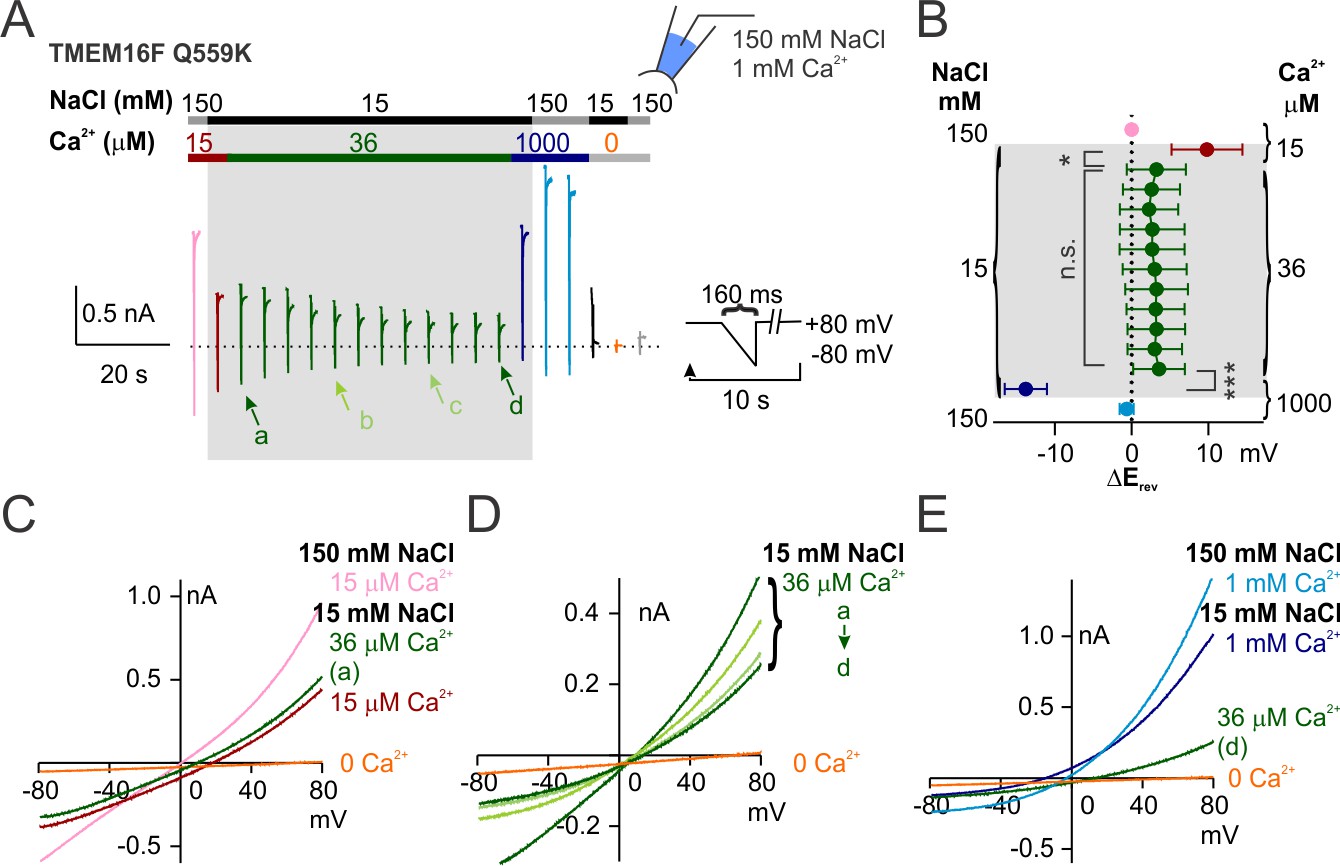
Q559K Erev only shifts with the change of Ca2+ concentration.
(A) Representative recording of TMEM16F Q559K held at +80 mV with a hyperpolarizing ramp (−1 V/s) once every 10 s in indicated conditions. (B) Summary of the averaged Erev with background subtraction (subtraction of the current in Ca2+-free 15 mM NaCl solution, orange trace in A, except for the current in 1 mM Ca2+) in indicated conditions. For all the traces recorded in 15 mM NaCl, Erev only shifts when Ca2+ concentration is changed. (C, D, E) Representative I-V relationships of Q559K at arrowed points in A, showing that Erev shifts when Ca2+ is increased from 15 µM to 36 µM, persists in 36 µM Ca2+ despite the constant rundown, and shifts when Ca2+ is increased from 36 µM to 1 mM.
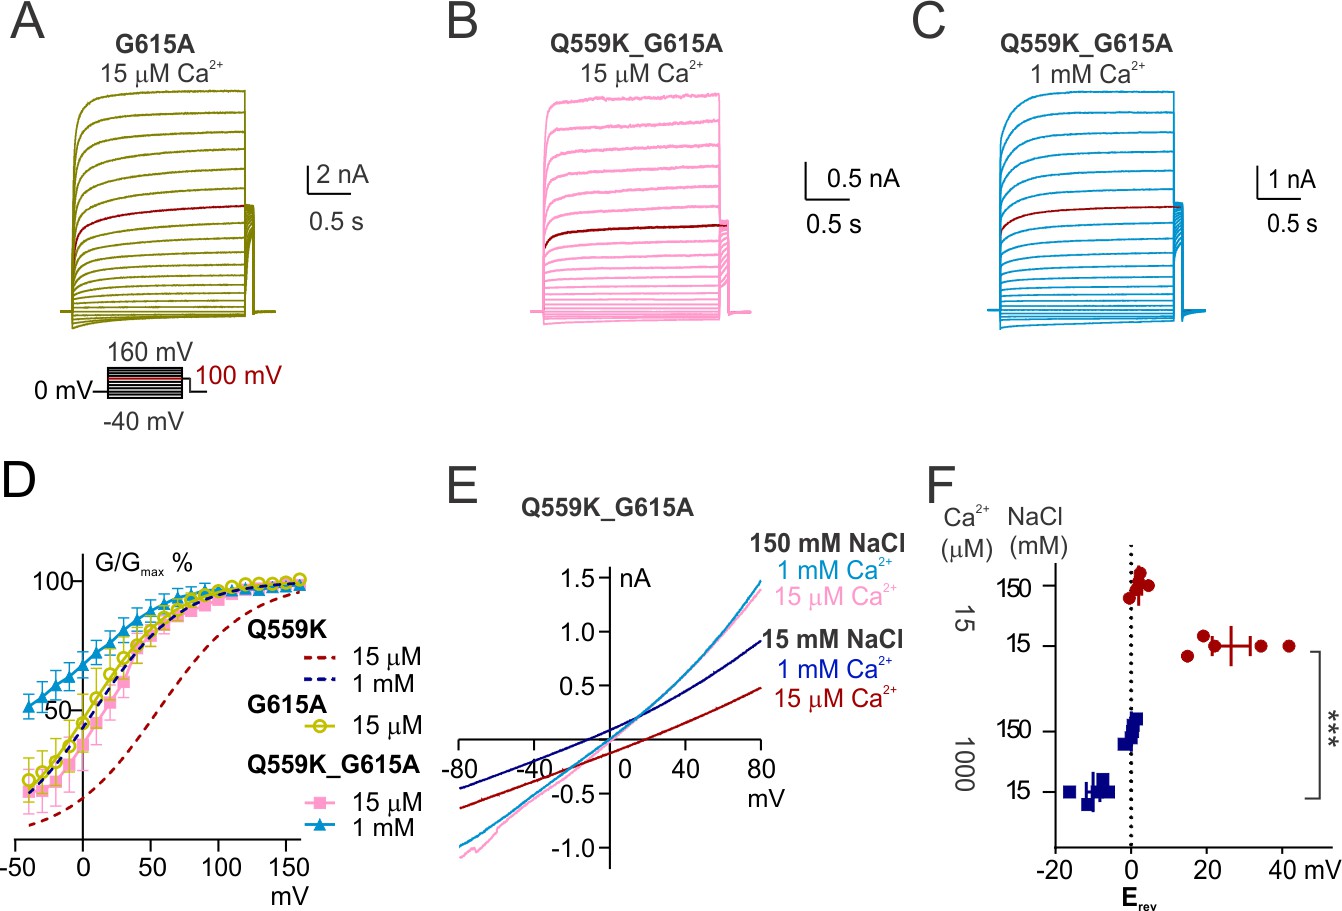
We investigated whether the shift of relative ion permeability involves the conformational change of TM6, a critical step in channel activation. In TMEM16A, the glycine in TM6 (G640 or G644 depending on isoform) works as a hinge to allow the rearrangement of the helical segments during channel activation to generate the ionic permeation pathway (Paulino et al., 2017a; Peters et al., 2018). Alanine substitution of this glycine stabilizes TM6 at the open conformation and increases TMEM16A Ca2+ sensitivity (Paulino et al., 2017a; Peters et al., 2018). This glycine hinge in TMEM16A TM6 corresponds to G615 in TMEM16F according to sequence alignment (Figure 4—figure supplement 1A). Cryo-EM studies reveal that TM6 is bent at this glycine hinge in Ca2+-free but not Ca2+-bound TMEM16F (Feng et al., 2019). Previous studies have shown that its alanine substitution (G615A) increases Ca2+ sensitivity (Alvadia et al., 2019; Han et al., 2019), and we confirmed that G615A left-shifted the voltage dependence of channels recorded in 15 μM Ca2+ (Figure 4A,D). In contrast, mutation of the adjacent glycine, G614A, did not have similar or further effects (Figure 4—figure supplement 1E,F,G). We also confirmed the effect of G615A mutation by comparing its voltage-dependent activation with another two TM6 mutants, I612A and N620A, which were chosen because the alanine substitutions of their corresponding amino acids in TMEM16A (I637A or I641A, Q645A or Q649A, depending on isoform) represent the stabilization of the two steps of TM6 conformational rearrangement during TMEM16A activation, respectively (Peters et al., 2018). TMEM16F I612A, mutation of the isoleucine in TM6 upper segment, caused shifts in Ca2+- and voltage-gating by an extent comparable with those of G615A (Figure 4—figure supplement 1D,G) (Han et al., 2019), indicative of a relationship similar to that between TMEM16A G644A and I641A (amino acid labels using TMEM16A isoform as in Lam and Dutzler, 2018; equivalent to G640A and I637A for the isoform as in Peters et al., 2018 ), indicating that the two mutants might be stabilized in the same state. In the lower segment, TMEM16A Q649 (Q645 in Peters et al., 2018 ), whose alanine substitution facilitates channel opening (Peters et al., 2018; Lam and Dutzler, 2018), corresponds to a gap of the alignment in TMEM16F (Figure 4—figure supplement 1A); alanine substitution of the asparagine ‘5-amino-acid-away’ in TMEM16F TM6, N620, did not facilitate Ca2+ (Han et al., 2019) or voltage gating (Figure 4—figure supplement 1B,C). Taken together, mutation of G615 to alanine (G615A) might sufficiently stabilize TM6, which in wild-type TMEM16F undergoes rearrangement to generate the ionic permeation pathway.

The change of ion permeability ratio is preserved despite TM6 conformational stabilization.
(A, B, C) Representative traces of G615A and Q559K_G615A recorded with a voltage family protocol as in Figure 1—figure supplement 1. The currents recorded at +100 mV are highlighted for comparison. (D) Averaged G-V relationships of G615A and Q559K_G615A currents. The method for data analysis was the same as that for WT in 15 µM Ca2+. The two traces for Q559K were replotted from Figure 1—figure supplement 1H. (D) Representative I-V relationships of Q559K_G615A recorded in indicated conditions. (F) Scatter plot of reversal potentials (Erev) obtained from traces as in E without background correction. p-Values were determined with Sidak's multiple comparisons following two-way ANOVA.
Notably, the steady-state voltage dependence of TMEM16F G615A channel in 15 μM Ca2+ was comparable to that of Q559K in 1 mM Ca2+ (Figure 4A,D). We then generated the double-mutant Q559K_G615A, which in 1 mM Ca2+ showed further left-shift of G-V relationship (Figure 4B,C,D). Recorded with the fast hyperpolarizing ramp, the current was almost linear, consistent with the notion that removal of the glycine hinge stabilizes the open conformation (Figure 4—figure supplement 2). The change of the permeability ratio PNa+/PCl- with rising Ca2+ in this double mutant was similar to that of Q559K (and wild-type) TMEM16F (Figure 4E,F). This double mutant revealed that in the presence of Q559K mutation, TMEM16F channel in 15 μM Ca2+ was modestly more permeable to Na+, but it became more permeable to Cl- in 1 mM Ca2+ regardless of TM6 stabilization. Taken together, these results suggest that TMEM16F ion selectivity more likely depends on intracellular Ca2+ concentration directly rather than its open state(s), although it remains possible that TMEM16F might undergo miniscule conformational changes at different Ca2+ concentrations that contribute to the transition of relative permeability.
The shift of permeability ratio correlates with electrostatic change in permeation pathway
Intrigued by the possibility that Ca2+ alters anion accessibility to the TMEM16A pore through electrostatic effect (Lam and Dutzler, 2018), we hypothesize that the shift of permeability ratio of TMEM16F Q559K in response to elevation of intracellular Ca2+ is due to a change of electrostatic field along its permeation pathway. In this scenario, the effect ought to be elicited not only by Ca2+ but also by other divalent or trivalent cations (Lam and Dutzler, 2018). We chose to test Zn2+ and Gd3+, divalent and trivalent cations that are smaller in ionic radius than Ca2+ but capable of activating TMEM16F. Both Zn2+- and Gd3+-activations of TMEM16F were coupled with rapid inactivation even at low concentrations (Figure 5—figure supplement 1A,D), precluding the possibility to accurately plot the dose-response curves. The exposure to divalent-free solution (with EGTA) for ~30 s to 1 min following channel inactivation by Zn2+ allowed the current to fully recover in magnitude (Figure 5—figure supplement 1B,C), suggesting that the rapid current rundown was not attributed to desensitization triggered by PIP2 degradation, although it is unclear whether Zn2+ can shield the negative charges in PIP2 headgroups to elicit a reversible rundown.
We found that the wild-type TMEM16F channels activated by 10 μM Zn2+ were more permeable to Na+ than to Cl-, as evident from the right-shift in Erev as intracellular NaCl dropped to 15 mM (Figure 5A). The Erev in 1 mM Zn2+ could not be determined owing to the rapid current inactivation, so we again used the Q559K mutant to this end. Notably, TMEM16F Q559K channels exhibited an increased relative permeability to Cl- (versus to Na+) with elevation of Zn2+ concentration from 10 μM to 1 mM (Figure 5B,C). In contrast to the drastic inactivation in 1 mM Zn2+, wild-type TMEM16F current activated by Gd3+, even with rundown, was still distinguishable from background current at both low and high concentrations. The remaining current underwent the Erev shift when Gd3+ concentration was switched from 10 µM to 1 mM (Figure 5D,E,F). Note that wild-type TMEM16F current activated by Gd3+ showed weaker outward rectification (Figure 5E, compared with Figure 1—figure supplement 3D). However, the steady-state conductance-voltage relationship (Figure 5—figure supplement 1E,F) suggested that, instead of being activated independently of depolarization, the change of rectification was more likely due to a delayed channel closing during hyperpolarization.

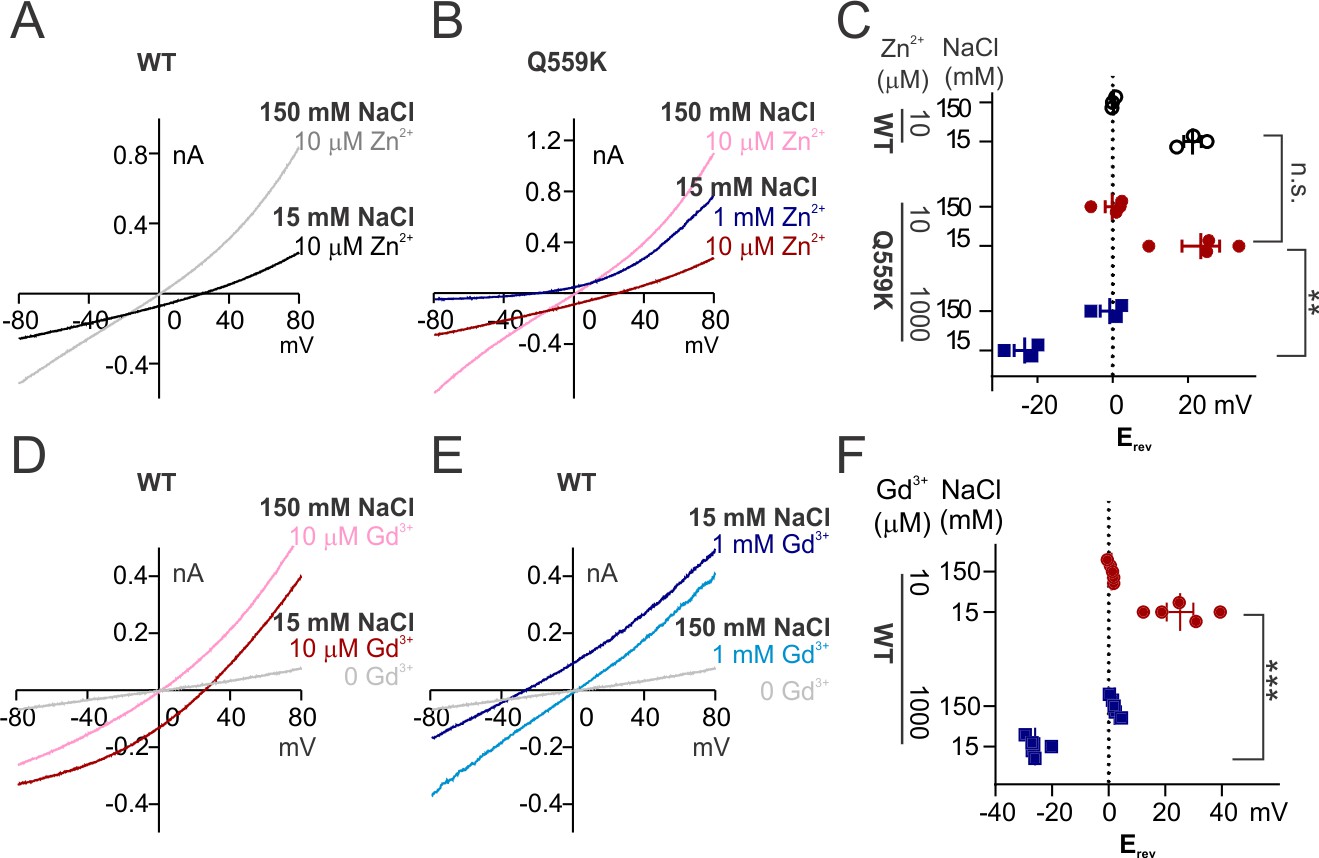
The change of ion permeability ratio is preserved when current is activated by Zn2+ or Gd3+.
(A, B) Representative I-V relationships of WT and Q559K recorded in indicated Zn2+-containing solutions. The currents were recorded with the same protocol as in Figure 1E,F. (C) Scatter plot of reversal potentials (Erev) obtained from traces as in A and B. p-Values were determined with Sidak's multiple comparisons following two-way ANOVA. (D, E) Representative I-V relationships of WT TMEM16F recorded in indicated Gd3+-containing solutions. Note that the current in 1 mM Gd3+ 15 mM NaCl is still distinguishable from background current. (F) Scatter plot of reversal potentials (Erev) obtained from traces as in E and F. p-Values were determined with Sidak's multiple comparisons following two-way ANOVA.
Although monovalent ions generate weak electrostatic fields compared with divalent and trivalent ions, given their abundance they should also be able to modulate the electrostatic field along TMEM16F permeation pathway and alter the relative ion permeability. TMEM16F is permeable to most generally-used cations including N-methyl-D-glucamine (NMDG) and tetraethylammonium (TEA) (Yang et al., 2012; Yu et al., 2015), so introducing any other ion species will cause difficulties in distinguishing whether the shift of Erev is due to the change of PNa+/PCl- or to the permeation of the new ion species. Thus, we first calculated the respective permeability ratios from the measured Erev with different intracellular NaCl concentrations (Figure 1—figure supplement 2). Compared with 15 mM NaCl, the stronger ionic strength of 45 mM intracellular NaCl enhances the screening effect for anions, and thus is predicted to increase the relative permeability to Cl-. Indeed, the calculated PNa+/PCl- values measured in 15 µM Ca2+ were 4.8 ± 0.6 and 2.3 ± 0.2 for wild-type TMEM16F in 15 mM and 45 mM NaCl, respectively; and the calculated PNa+/PCl- values measured in 15 µM Ca2+ were 2.1 ± 0.4 and 1.4 ± 0.1 for Q559K in 15 mM and 45 mM NaCl, respectively (Figure 6), consistent with previous findings that Q559K reduces PNa+/PCl- (Yang et al., 2012; Alvadia et al., 2019). The PNa+/PCl- for Q559K in 1 mM Ca2+ showed no significant difference between 15 mM NaCl and 45 mM NaCl (Figure 6), suggesting that millimolar Ca2+ outweighs Na+ in controlling the electrostatic effect. The shift of Erev by changing the intracellular NaCl is also consistent with our proposed scenario that the shift of ion permeability ratio is not due to TM6 conformational change associated with different open states, but instead, due to the alteration of electrostatic field along the permeation pathway.

Ion permeability ratio is altered with change of intracellular NaCl concentration.
(A, B, C) Representative I-V relationships of WT and Q559K recorded with inside-out configuration in indicated conditions. The currents were reanalyzed from the recordings as in Figure 1—figure supplement 2. Notice NOT to directly compare the shift of Erev because the intracellular NaCl concentrations are varying. (D) Scatter plot showing the permeability ratio (PNa+/PCl-) calculated from the shift of reversal potentials (ΔErev) obtained from traces as in A, B and C. p-Value for WT was determined with Wilcoxon test. P values for Q559K were determined with Sidak's multiple comparisons following two-way ANOVA. (E, F) Representative I-V relationships of wild-type TMEM16F currents recorded with whole-cell configuration in indicated bath solutions. NMDG: N-methyl-D-glucamine; Gluc: gluconate. (G) Scatter plot of the changes of reversal potentials (ΔErev) obtained from recordings as in E and F. Due to the potentially varying PNa+/PCl-, we did NOT perform statistics or use them to calculate ion permeability ratios.
The minor shift of relative ion permeability by the change of intracellular NaCl concentration shown above might account for the discrepancy regarding TMEM16F ion selectivity recorded with various methods used by different labs. In the experiments above, the osmolarities of low NaCl solutions were all balanced with mannitol to avoid the interference by other ion species. Now, we tested for 15 mM NaCl with equal ionic strength as extracellular solution, which was balanced either with 135 mM NMDG-MES (MES: methanesulfonic acid) or 68 mM NMDG2-SO4. We observed that the wild-type TMEM16F activated by 15 µM Ca2+ in both conditions reversed at ~0 mV (2 ± 1 mV in 15 mM NaCl with NMDG-MES, 3 ± 2 mV in that with NMDG2-SO4; Figure 6—figure supplement 1A,C). Compared with Erev recorded in 15 mM NaCl with mannitol, the reduction of Erev might reflect a combination of NMDG permeation and the reduction of PNa+/PCl-, assuming the permeation of MES- or SO42- was negligible. In neither condition could we determine the Erev for currents activated by 1 mM Ca2+. Using the mutant Q559K, we confirmed that in both conditions, the shift of Erev with rising Ca2+ persisted (Figure 6—figure supplement 1B,D,E), which could be explained by an increase of PCl-/PNa+ or a robustly increased permeation of NMDG, with the latter being less likely.
To confirm that the shift of ion permeability ratio does not depend on recording configuration, we altered the compositions of the pipette solution rather than those of the bath solution. We applied 15 mM NaCl balanced with mannitol, NMDG-MES or NMDG2-SO4 to the pipette solution (equivalent to extracellular solution), while the bath (equivalent to intracellular solution) contained 150 mM NaCl. With the correction of liquid junction potentials (12 mV, 6 mV and 2 mV respectively), the currents reversed at ~0 mV when activated by 15 µM Ca2+ in all the conditions (−1 ± 1 mV, 4 ± 2 mV and −1 ± 2 mV, respectively), while at 11 ± 2 mV, 19 ± 1 mV and 24 ± 1 mV, respectively, when activated by 1 mM Ca2+ (Figure 6—figure supplement 2). For the conditions involving NMDG, the Erev shift either indicated an increased PCl-/PNa+ or a robustly increased permeation of NMDG, with the latter being less likely. These results also complemented the previous tests involving changes of intracellular NaCl concentration (Figure 6A–D), showing that enhancement of intracellular ionic strength ‘unidirectionally’ promotes the relative permeability to Cl-. This can be attributed either to the preceding depolarization which drives cations into the pore, or to the possibility that the pore intrinsically adopts cations to modulate the electrostatic field. In addition, there was no significant difference in Erev shifting between solutions balanced with NMDG-MES and that with NMDG2-SO4, suggesting that the divalent anions are relatively inert whether being applied intracellularly or extracellularly, attributable to the inaccessibility of divalent anions to the permeation pathway.
The above results suggest that TMEM16F ion selectivity is modulated by the change of electrostatic field along its permeation pathway, with divalent or trivalent cations having stronger impacts than monovalent ions. This might account for the lower selectivity for Na+ over Cl- obtained from whole-cell recording, where intracellular solution was usually an isotonic salt solution. In whole-cell recording, TMEM16F current is reported to be elicited a few minutes after the whole-cell configuration is formed, and less selective for cations or in certain conditions even more selective for Cl-. Based on results reported above, we could infer that in these conditions the intracellular ionic strength (mainly maintained by ~150 mM NaCl or KCl) would reduce the channel relative permeability to cations. We performed whole-cell recording with 150 mM NaCl and 15 µM Ca2+ in the pipette, the Erev was 1.4 ± 3.1 mV in 15 mM NaCl, indicative of PNa+/PCl- of 1.0 ± 0.1 (Figure 6D,F). Replacement of extracellular Na+ with NMDG did not significantly shift Erev, indicative of an increased permeability to Cl- and/or a modest permeability to NMDG. Replacement of extracellular Cl- with gluconate (Gluc) or I- shifted Erev to positive or negative values respectively, suggesting the presence of Cl- conduction (Figure 6E,F) as observed in previous studies. However, we could not calculate the permeability ratios due to the potentially varying PNa+/PCl- in these conditions. Notably, it is also reported that Tmem16f-transfected cells undergo an ‘unconventional exocytosis’ which expands the membrane surface area dramatically during recording (Bricogne et al., 2019), leading to challenges in performing membrane capacitance compensation. These technical issues rendered it difficult to perform accurate measurements with whole-cell recording.
Taken together, the elevation of intracellular cation level underlies the increased permeability to Cl-, with divalent cations (Ca2+ and Zn2+) and trivalent cations (Gd3+) having stronger effects than monovalent ions (Na+ and NMDG). This suggests that TMEM16F employs a charge-screening mechanism to dynamically alter the preference for permeating ion species: Increase of positive charges, by introduction of basic amino acids or by entry of cations, enhances the channel preference for anions. This mechanism allows TMEM16F to open as a non-selective ion channel at low intracellular Ca2+ level and as a Cl- channel when local Ca2+ concentration increases, indicative of physiological functions that have not been investigated thus far.
Depolarization alters permeability ratio synergistically with intracellular Ca2+
Previous studies have shown the synergy between Ca2+ and depolarization in the gating of TMEM16A. Depolarization facilitates Ca2+ entry into the membrane electric field and thus reducing the EC50 for channel activation by Ca2+ (Xiao et al., 2011; Peters et al., 2018). The reduction of EC50 of Ca2+ activation by depolarization is also observed in TMEM16F (Yang et al., 2012; Ye et al., 2018), although TMEM16F permeates Ca2+ (Yang et al., 2012), suggesting Ca2+ efflux is not fast enough to deplete Ca2+ from the electric field at the intracellular side. We asked whether depolarization also increases TMEM16F permeability to Cl- by driving Ca2+ into the membrane electric field. To this end, we held the excised membrane patch at potentials ranging from +40 to+160 mV with increments of 40 mV (referred to as ‘conditioning potentials’) followed by a hyperpolarizing ramp from +80 mV to −80 mV (−2 V/s), to measure the Erev (Figure 7C). With this experimental design, the shift of Erev following different conditioning potentials could provide an indication of the changes of relative permeability, under the circumstance that during hyperpolarization TMEM16F can temporarily ‘memorize’ the ion permeability ratio at the preceding conditioning potential. We measured the Erev of TMEM16F wild-type channels in 15 µM Ca2+, Q559K channels in 15 µM and in 1 mM Ca2+. In 15 µM Ca2+, the more depolarized the conditioning potential, the higher the relative Cl- permeability (versus Na+ permeability) (Figure 7A,D). The traces recorded with the hyperpolarizing ramp following different conditioning potentials did not intersect with each other, confirming the Erev alteration even though we did not perform background subtraction. The shift of Erev was not a potential artifact caused by ion accumulation or depletion as previously investigated for other channels (Li et al., 2015; Yu et al., 2014), since if it was, a more depolarized conditioning potential would cause more severe Na+ accumulation or Cl- depletion at the extracellular side (in the pipette solution), leading to a right-shift of Erev, which was opposite to our results. Traces of Q559K currents following different conditioning potentials in 1 mM Ca2+ overlapped at low membrane voltages (Figure 7E), a phenomenon observed for TMEM16A in 0.2 µM Ca2+ (Figure 7B). The gradual increase of relative Cl- permeability caused by preceding depolarization can be attributed to intracellular cations, particularly Ca2+, to the membrane electric field to enhance the attraction of permeation pathway to anions, as can be inferred from the charge-screening mechanism.

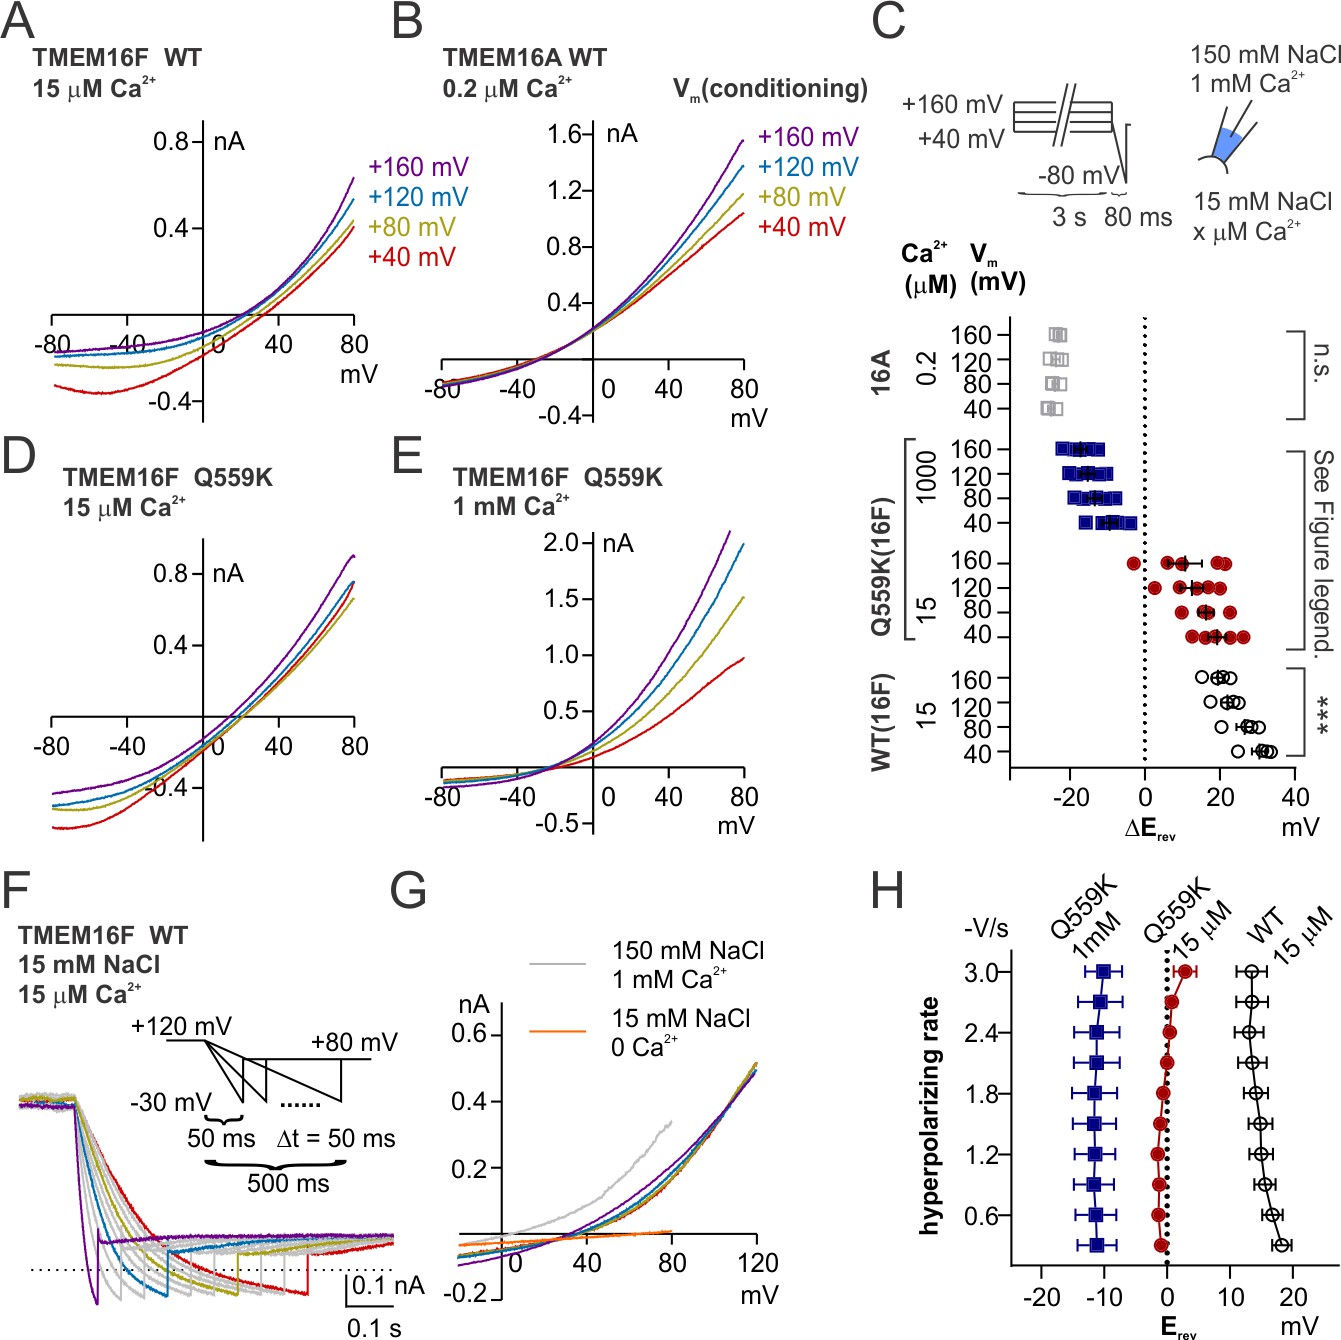
Depolarization alters permeability ratio synergistically with Ca2+ level.
(A, B, D, E) Representative I-V relationships of currents recorded in indicated conditions. The excised patch was held at +40 to+160 mV with increments of 40 mV (‘conditioning potentials’) followed by a hyperpolarizing ramp from +80 mV to −80 mV (−2 V/s). (C) Scatter plot showing the changes of reversal potentials (ΔErev) when solution was switched from 150 mM NaCl to 15 mM NaCl. For TMEM16A and WT TMEM16F, p-values were determined with one-way ANOVA. For TMEM16F Q559K, two-way ANOVA shows p<0.001 across voltages, p<0.0001 across Ca2+ concentrations. (F) Representative WT TMEM16F traces recorded in 15 µM Ca2+ 15 mM NaCl bath solution with the indicated protocol. The excised patch was held at 120 mV followed by a hyperpolarizing ramp from +120 mV to −30 mV (ramping speed from −0.3 V/s to −3 V/s), and the reversal potentials were corrected with background current recorded at the end. (G) The I-V relationships of the highlighted traces as in F, showing the currents reverse at the same point despite the change of rectification. (H). Summary of reversal potentials at different hyperpolarizing speeds obtained from traces as in G. Two-way ANOVA suggests that there is no significant difference among various hyperpolarizing speeds (p=0.28).
The observation that TMEM16F in 15 µM Ca2+ is able to ‘memorize’ the ion permeability ratio at the preceding conditioning potential, suggests that the electrostatic field along the permeation pathway can be maintained even when there is no movement of net charge (i.e. 0 pA). We then recorded the Erev with hyperpolarizing ramps of variable speeds (0.3 V/s to 3 V/s) following holding the patch at +120 mV, to test whether the channel would ‘forget’ the ion permeability ratio at the conditioning potential (+120 mV) by observing Erevs under hyperpolarization ramps of various rates. We did not see a significant shift of the Erev for both WT and Q559K, although wild-type TMEM16F current became more outwardly rectifying at slower hyperpolarizing ramps (Figure 7F,G, Figure 7—figure supplement 1). Thus, the permeability ratio (PCl-/PNa+) can be maintained during hyperpolarization, raising the possibility that the Ca2+ ion that modulates the pore electrostatic field dwells at the permeation pathway or a proximal site that allows it to still affect permeation pathway instead of leaving the pore with the ionic flow.
We summarized the mechanism of TMEM16F dynamic ion selectivity based on the experiments shown above and published previously (Figure 8). TMEM16F ion permeation pathway is opened as a result of protein conformational change, which probably involves the rearrangement of TM6 induced by Ca2+-binding to the conserved Ca2+-binding pocket. The elevation of intracellular divalent or trivalent cation concentration brings positive charges into the permeation pathway, which gradually increases the relative permeability of anions. Depolarization promotes the pore attraction to anions by facilitating Ca2+ entry into the membrane electric field, wherein it may remain until the channel is closed.

Diagram showing the proposed ion selectivity mechanism for TMEM16F and a comparison with TMEM16A.
(Upper) TMEM16F gating and ion selectivity. The binding of intracellular Ca2+ to the binding-pocket triggers the rearrangement of transmembrane helices and opens the ion permeation pathway (from 1 to 2). The elevation of intracellular Ca2+ level shifts the electrostatic field along the permeation pathway from a Na+-favoring state (shaded with cold color) to that with increased attraction to Cl- (shaded with warm color, from 2 to 3). Each red dot represents a Ca2+-entry event, while the number of Ca2+ ions for every event is not specified. Depolarization drives Ca2+ into both the binding pocket and the permeation pathway; PIP2 stabilizes the open conformation but does not affect the ion selectivity. Hyperpolarization triggers the closing of the channel, preceding the retreating of Ca2+ from the site that allows it to affect the permeation pathway, so that the channel maintains the electrostatic field and ‘memorizes’ the permeability ratio (from 3 to 4). (Lower) TMEM16A might harbor a selectivity filter restrictedly selective for anions (scenario 1), either with a size-dependent mechanism (illustrated with the zigzags) or a strong electrostatic field (illustrated with red shade). Alternatively, the change of electrostatic field might be tightly coupled to Ca2+-gating (scenario 2), so that the pore restrictedly selects for anions once it is opened.
Discussion
Studies regarding TMEM16F physiological functions have mostly focused on its phospholipid scrambling activities, while the understanding of its ion channel functions is confounded by the discrepancy of ion selectivity measurements. In cells with TMEM16F expression, increasing cytoplasmic Ca2+ concentration leads to activation of TMEM16F channel that mediates Ca2+ influx (Feng et al., 2019; Han et al., 2019), which further activates phospholipid scrambling. This is consistent with the results that TMEM16F recorded with inside-out excised patch showed higher permeability to cations than to Cl- (Yang et al., 2012; Alvadia et al., 2019), notwithstanding the whole-cell recording indicating that delayed-activated TMEM16F is an anion channel (Grubb et al., 2013). In light of the Q559K mutant which displays minimal rundown and less outward rectification in 1 mM Ca2+, we measured TMEM16F reversal potentials at different Ca2+ concentrations, revealing a shift toward Cl--selectivity at high intracellular Ca2+. This shift of ion permeability ratio correlates with the change of electrostatic field in the permeation pathway, which is determined by both intracellular ion concentration and membrane potential; divalent cations regardless of ion species are expected to exert stronger electrostatic effects than monovalent cations. This might reflect a general feature in the coupling of gating and conduction for channels in the TMEM16 family, likely relevant to their physiological functions.
Gating and ion selectivity of TMEM16F
The ion permeation pathway of TMEM16F is generated probably through the rearrangement of TM6 in response to elevation of intracellular Ca2+ concentration, as reflected in its conformation in the presence or absence of Ca2+ (Feng et al., 2019), a mechanism similar to that of TMEM16A. Further elevation of intracellular Ca2+ results in an increase of relative permeability to Cl- (versus Na+). With membrane potential and ionic strength unchanged, the permeability ratio PNa+/PCl- is only correlated with Ca2+ concentration rather than Ca2+-induced conformational change, suggesting that the ion selectivity machinery is not coupled to channel gating. At low Ca2+ when channels display modest selectivity between Na+ and Cl-, the ion permeability ratio is also altered by monovalent ions and membrane potential, which indicates that the ion selectivity filter is sensitive to electrostatic disturbance and thus might explain the discrepancy of experimental results from different labs. Depolarization, which drives Ca2+ into membrane electric field and facilitates Ca2+-gating, synergistically promotes the permeability alteration towards a preference for Cl-. The ion permeability ratio can be memorized during the recording with a hyperpolarizing ramp, suggesting that Ca2+ retreating from the site that affects the permeation pathway is preceded by the dissociation of Ca2+ from the binding pocket, so that the pore electrostatic field can be maintained until the channel is closed. PIP2 reduces the EC50 for Ca2+-activation but does not affect ion selectivity, thus facilitating TMEM16F opening when the pore is still more attractive to cations in low intracellular Ca2+. Controlling the selectivity between cations and anions by altering the pore potential, referred to as a charge-screening mechanism, is also documented in other ion channels, such as ligand-gated channels (Keramidas et al., 2004) and bacterial porins (Alcaraz et al., 2004), through charged residues lining the pore and/or through permeating ions within the pore.
It is intriguing to consider the structural basis for Ca2+ regulation of the TMEM16F relative ion permeability. Specifically, we wonder whether Ca2+ ion(s) in the Ca2+-binding pocket, or in the permeation pathway, may alter the electrostatic field of the pore. The former resembles what has been proposed for TMEM16A (Lam and Dutzler, 2018), whose pore is electrostatically modulated by Ca2+ bound to the pocket, but it seems unlikely for TMEM16F, because the Hill coefficient of Ca2+-activation of TMEM16F is ~2, suggesting that the two Ca2+-binding sites should both be occupied when the current displays higher permeability to cations. The latter scenario is that there is room for Ca2+-dwelling in the permeation pathway, consistent with the recently-published TMEM16F structure in which the pore harbors a large vestibule (Alvadia et al., 2019; Feng et al., 2019). Also, its distant homolog, TMEM16K, has multiple Ca2+ ions bound to its cytoplasmic domains (Bushell, 2018), raising the question whether there could be a reservoir in the TMEM16 cytoplasmic domain to store Ca2+. Given the long range electrostatic actions, it will be technically challenging to identify the structural basis for the electrostatic modulation in the pore.
Comparison among TMEM16 members
TMEM16 represents a family of membrane proteins with diverse functions, including Ca2+-activated ion channel activities and Ca2+-activated lipid scrambling. Mammalian TMEM16A and TMEM16B are Ca2+-activated Cl- channels (Schroeder et al., 2008; Caputo et al., 2008; Yang et al., 2008; Stephan et al., 2009), while other members with phospholipid scrambling functions display modest cation-selective or non-selective ion channel activities, such as TMEM16E (Whitlock et al., 2018), TMEM16F (Yang et al., 2012; Alvadia et al., 2019; Yu et al., 2015; Le et al., 2019a), Drosophila subdued (Le et al., 2019b), and two fungal TMEM16 homologs (Malvezzi et al., 2013; Brunner et al., 2014; Lee et al., 2016; Jiang et al., 2017). The lipid scrambling activity is also observed in an amoebozoa TMEM16 homolog (Pelz et al., 2018). All the TMEM16 proteins, based on reported structures and sequence alignment, are dimers with each monomer containing 10 transmembrane helices with conserved Ca2+-binding sites (Alvadia et al., 2019; Brunner et al., 2014; Paulino et al., 2017a; Bushell, 2018; Dang et al., 2017; Feng et al., 2019; Kalienkova et al., 2019; Falzone et al., 2019). Here, our studies reveal that TMEM16F displays a preference for Cl- conduction when Ca2+ concentration is high, potentially indicative of a unifying mechanism regarding TMEM16 channel functions. In the following paragraphs, we will briefly discuss the similarities and differences among TMEM16 members, and focus mainly on the comparison between TMEM16A and TMEM16F.
In both TMEM16A and TMEM16F, the opening of the permeation pathway involves the conformational stabilization of TM6, while the removal of a glycine hinge reduces the Ca2+ level required for activation (Paulino et al., 2017a; Peters et al., 2018). Alanine substitution of the glycine reduces EC50s of Ca2+-activation in both TMEM16A and TMEM16F. However, TMEM16A and TMEM16F currents differ in rectification level (Nguyen et al., 2019). The current of TMEM16A bound to one Ca2+ ion (at low intracellular Ca2+ level) is outwardly rectifying, while at high intracellular Ca2+ level that allows two Ca2+ ions to occupy the binding-pocket, the TMEM16A channel conductance becomes ‘Ohmic’ (Peters et al., 2018). Such a transition can be explained by two mutually compatible mechanisms: the second Ca2+ ion triggers the further rearrangement of TM6 (Peters et al., 2018) and its positive electrostatic field reduces the energy barrier that intracellular anions need to overcome to access the permeation pathway (Lam and Dutzler, 2018). In contrast, TMEM16F current is outwardly rectifying in a wide range of Ca2+ concentration. It is important to keep in mind that TMEM16F rectification indices obtained from the traces recorded with ramp protocols (such as in Figure 1E,F) can be confounded with the voltage-dependent gating. However, according to the ‘instantaneous rectification index’ (Alvadia et al., 2019), which describes the magnitude ratio of outward current to inward current within the time range only allowing minimal change of gating, the TMEM16F pore is intrinsically outwardly rectifying, and wild type and Q559K channels are likely rectifying to a similar extent (Alvadia et al., 2019). Thus, in contrast to the corresponding pore-lining residue K588 in TMEM16A, which electrostatically interacts with the permeating Cl- and is necessary for the ohmic conductance (Paulino et al., 2017b; Nguyen et al., 2019), the reduction of outward rectification of TMEM16F Q559K mutation might result from the alteration of voltage gating. Interestingly, the TMEM16F current activated by 1 mM Gd3+ is potentially approaching the ‘ohmic’ state (Figure 5E), suggesting that the strong electrostatic field of a trivalent cation bound to the protein could enhance the accessibility of intracellular Cl- to the pore.
We propose two scenarios to explain why TMEM16F displays a shifting ion selectivity, while TMEM16A selects for Cl- at all Ca2+ concentrations (Figure 8). In one scenario, TMEM16A has a ‘built-in’ selectivity filter that favors anions, so that only anions can eventually permeate even though both anions and cations can access the pore. Such a ‘built-in’ selectivity filter can either be a size-based screening structure, or a constantly strong positively-charged field to attract anions and repel cations. In the second scenario, TMEM16A couples the change of the electrostatic field to the opening of the pore, in a way that the former event precedes or synchronizes with the latter. We tried to distinguish between the two scenarios by measuring the ion selectivity of TMEM16A activated by low intracellular Ca2+. Notably, TMEM16A current activated by 100 nM Ca2+ or 300 nM Ca2+ is Cl--selective, with the selectivity measured in low NaCl balanced with NMDG-MES being more selective for Cl- (compared with Na+) than that in low NaCl balanced with mannitol (Figure 8—figure supplement 1A,B,C), a phenomenon consistent with a previous report (Lim et al., 2016). To probe TMEM16A ion selectivity in 0 Ca2+, we also generated the Q649A mutant of TMEM16A, which is activated by depolarization in Ca2+-free solution (Peters et al., 2018; Lam and Dutzler, 2018), and we used poly-L-lysine (PLL) to strip off membrane-tethered PIP2 to accelerate current rundown (De Jesús-Pérez et al., 2018). We noticed that TMEM16A Q649A activated by 30 nM Ca2+ was selective for Cl- before or after PLL application, but the ‘rundown’ component (current in 0 Ca2+) displayed a dispersed distribution of Erev (Figure 8—figure supplement 1D–I). Because PLL also triggered the rundown of the background current endogenous to HEK293 cells, which is cation selective (Figure 8—figure supplement 1J), we could not draw a definitive conclusion at this point.
Functional implication
The shift of relative ion permeability with elevation of Ca2+ concentration may dynamically regulate membrane potential of the cell. Since TMEM16F can function as a Ca2+-activated Ca2+-permeable channel, the dynamic increase of Cl- permeability (versus cation) might provide a brake to the positive feedback to reduce the influx of cations including Ca2+. In a typical neuronal cell, such a transition towards Cl- selectivity might reduce the entry of Ca2+ into the cell and drive membrane potential close to Cl- equilibrium potential, both of which will reduce the neuronal excitability and prevent Ca2+-overloading. The ‘memory’ of the permeability ratio during repolarization allows TMEM16F to modulate the waveform of action potentials in accordance to local cytoplasmic Ca2+ level. In non-excitable cells, this function might enable TMEM16F to sense cellular Ca2+ level and modulate membrane potential, which affects cellular proliferation and differentiation (Sundelacruz et al., 2009). It has also been reported that TMEM16F is localized in primary cilia (Forschbach et al., 2015), a special cellular compartment with elevated Ca2+ level and greater depolarization (Delling et al., 2013), providing a condition for TMEM16F to function dynamically. With the broad expression pattern of TMEM16F, we envision a new perspective to examine the functions of TMEM16F.
Materials and methods
Cell culture and molecular biology
Request a detailed protocolMouse Tmem16f and Tmem16a cDNAs (sequences as in NCBI RefSeq NM_175344.4, Mus musculus Ano6-splice variant 2, and NM_178642.5, Mus musculus Ano1-splice variant 1, respectively) were respectively fused with mCherry and subcloned into pcDNA3, as previously reported (Ye et al., 2018). Site-directed mutagenesis was performed using standard molecular techniques with pHusion polymerase (New England Biolabs, Ipswich, MA) and sequences were all verified (Quintara Biosciences, South San Francisco, CA). HEK (Human embryonic kidney)−293 cells (ATCC, RRID: CVCL_0045) were aliquoted and preserved in liquid nitrogen. One vial of cells was thawed and plated in 10-mL cell culture flask (ThermoFisher Scientific, Waltham, MA) once every 3 months. Cell were cultured in Dulbecco's Modified Eagle Medium (DMEM, with 4.5 g/L glucose, L-glutamine and sodium pyruvate, Mediatech, Manassas, VA) containing 10% FBS (Axenia BioLogix, Dixon, CA) and 1% penicillin-streptomycin, at 37°C and with 5% CO2, and they were passaged into a new flask with a 1:10 ratio once every 3 ~ 4 days. They were disposed of if they were not confluent in the flask in 4 days, their morphologies deviated from pictures in instructions (ThermoFisher website), or if the batch had been used for 3 months, whichever coming first, but were not in particular tested for mycoplasma contamination. Cells for electrophysiology recording were plated on 12 mm round coverslip (Warner Instruments, Hamden, CT) during the passaging procedure. Transient transfection was performed with Lipofectamine 2000 (ThermoFisher Scientific, Waltham, MA) 2 days before recording. The cDNA constructs for wild-type TMEM16F-mCherry, the mutants Q559K-, G615A-, G614A-, I612A-, G614_G615A-, N620A-, and E667Q- mCherry were stably transfected in HEK293 cells as previously reported (Han et al., 2019). Briefly, the cDNAs were subcloned into pENTR1A (Addgene plasmid #17398) and transferred to pLenti CMV Hygro DEST (Addgene plasmid #17454) using Gateway cloning (Campeau et al., 2009). pENTR1A no ccDB (w48-1) and pLenti CMV Hygro DEST (w117-1) were gifts from Dr. Eric Campeau and Dr. Paul Kaufman (University of Massachusetts Medical School, Worcester, MA, USA). TMEM16F-mCherry pLenti was co-transfected into HEK293FT cells with packaging plasmids pMD.2G and psPAX2, which were gifts from Didier Trono (Addgene plasmids # 12259 and #12260). Lentivirus was harvested from the transfected cells 36–48 hr post-transfection and incubated with HEK293 cells to establish stable cell lines under hygromycin selection.
Solutions
For all electrophysiology recordings, bath solution contained 145 mM NaCl, 10 mM HEPES, 2 mM CaCl2, 1 mM MgCl2, 10 mM glucose, pH 7.2 with NaOH. For inside-out recordings, pipette solution contained 150 mM NaCl, 10 mM HEPES, 1 mM CaCl2, unless otherwise stated. The membrane patch was excised to form inside-out configuration in Ca2+-free solution: 150 mM NaCl, 10 mM HEPES, 2 mM EGTA. For solutions with Ca2+ < 100 µM, Ca2+ was added to solutions containing 2 mM EGTA or 2 mM HEDTA, and the final Ca2+ concentration was confirmed with Fluo-3 or Oregon Green BAPTA 5N (ThermoFisher Scientific). For whole-cell recording, the pipette solution contained 150 mM NaCl, 10 mM HEPES, 5 mM HEDTA and 4.1 mM CaCl2, and the final free Ca2+ concentration (15 µM) was confirmed with Oregon Green BAPTA 5N. The osmolality of each solution was adjusted to 290 ~ 310 mOsm/kg.
Solutions with NaCl lower than 150 mM were made by mixing the above solutions (if Ca2+ < 100 µM) with isotonic mannitol solution (300 mM mannitol, 10 HEPES), NMDG-MES solution (150 mM NMDG, 150 mM MES, 10 mM HEPES), or NMDG2-SO4 solution (150 mM NMDG, 75 mM H2SO4, 10 mM HEPES). Ca2+ concentration was subsequently confirmed with Oregon Green BAPTA 5N. The 1 mM Ca2+ solutions were made by directly mixing the solution containing 150 mM NaCl, 10 HEPES with the respective isotonic solutions, and Ca2+ was added at the end. Solutions in Figure 6F contained 150 mM NaI, Na-gluconate or NMDG-Cl with 10 mM HEPES, 1 mM Ca2+. Zn2+ and Gd3+ were directly added to solution of 150 mM NaCl, 10 HEPES from 100 mM stocks. The pH values of all the solutions were confirmed to be ~7.3. All the chemicals were purchased from Sigma-Aldrich (St Louis, MO).
Electrophysiology
Request a detailed protocolCells were lifted with trypsin-EDTA (Life Technologies, Carlsbad, CA) and plated onto 12 mM coverslip (Warner Instruments, Hamden, CT) 3 ~ 4 days before recording. For recording, coverslips with cells were transferred to a chamber on a Nikon-TE2000 Inverted Scope (Nikon Instruments, Melville, NY) and transfection was confirmed with fluorescent microscopy. Patch borosilicate pipets (Sutter Instrument, Novato, CA) were pulled from a Sutter P-97 puller with resistances of 2–3 MΩ for inside-out patch recordings. Solutions were puffed to the excised patch using VC3-8xP pressurized perfusion system (ALA Science, Farmingdale, NY). Data were acquired using a Multiclamp 700B amplifier controlled by Clampex 10.2 via Digidata 1440A (Axon Instruments, Sunnyvale, CA). All experiments were performed at room temperature (22–24°C).
For measurements of reversal potentials, a 3 M KCl salt bridge was used. For experiments with 150 mM NaCl in the pipette solution, based on prediction by Clampex (Molecular Devices, Sunnyvale, CA), the liquid junction potentials for 15 mM NaCl, 45 mM NaCl (balanced with mannitol) were −1.7 mV and −1.0 mV respectively and were only corrected for calculation of permeability ratios (PNa+/PCl-). For recordings with 150 mM NaCl pipette solution, the liquid junction potentials for all the other conditions were within ±2 mV, and were not corrected in the figures. For recordings where the pipette solution contained 15 mM NaCl (balanced with mannitol, NMDG-MES or NMDG2-SO4), the liquid junction potentials were corrected by adding 12 mV, 6 mV and 2 mV, respectively, to the measured values, as estimated by Clampex. The data in Figure 6—figure supplement 2B~F were displayed with the correction of liquid junction potentials.
Data analysis
Request a detailed protocolAll data were analyzed using pClamp10 (RRID: SCR_011323, Molecular Devices, Sunnyvale, CA), OriginLab (OriginLab Corporation, Northampton, MA), and Graphpad Prism (RRID:SCR_002798, GraphPad Software, La Jolla, CA). For the measurement of Ca2+-sensitivity, every trace was fitted to the Hill equation to generate its respective EC50 and H (Hill coefficient). The curves in the figures display the averaged current magnitudes normalized to their respective maximal values (I/Imax %). PNa+/PCl- values were calculated with the simplified equation derived from Goldman-Hodgkin-Katz equation:
where [Na+]o, [Cl-]o, [Na+]i, and [Cl-]i are extracellular and intracellular Na+ and Cl− concentrations, respectively.
Significant differences were determined with Student’s t-test and ANOVA unless otherwise stated. In all cases, data represent mean ± SEM, *p<0.05, **p<0.01, ***p<0.001, ****p<0.0001, n.s. p>0.05.
Data availability
All data generated or analysed during this study are included in the manuscript and supporting files.
References
-
Salting out the ionic selectivity of a wide channel: the asymmetry of OmpFBiophysical Journal 87:943–957.https://doi.org/10.1529/biophysj.104/043414
-
Phosphatidylinositol 4,5-bisphosphate, cholesterol, and fatty acids modulate the calcium-activated chloride channel TMEM16A (ANO1)Biochimica Et Biophysica Acta (BBA) - Molecular and Cell Biology of Lipids 1863:299–312.https://doi.org/10.1016/j.bbalip.2017.12.009
-
Known structures and unknown mechanisms of TMEM16 scramblases and channelsThe Journal of General Physiology 180:jgp.201711957.https://doi.org/10.1085/jgp.201711957
-
TMEM16F (Anoctamin 6), an anion channel of delayed Ca2+ activationThe Journal of General Physiology 141:585–600.https://doi.org/10.1085/jgp.201210861
-
Scramblase TMEM16F terminates T cell receptor signaling to restrict T cell exhaustionThe Journal of Experimental Medicine 213:2759–2772.https://doi.org/10.1084/jem.20160612
-
Independent activation of distinct pores in dimeric TMEM16A channelsThe Journal of General Physiology 148:393–404.https://doi.org/10.1085/jgp.201611651
-
Ligand-gated ion channels: mechanisms underlying ion selectivityProgress in Biophysics and Molecular Biology 86:161–204.https://doi.org/10.1016/j.pbiomolbio.2003.09.002
-
An inner activation gate controls TMEM16F phospholipid scramblingNature Communications 10:e1846.https://doi.org/10.1038/s41467-019-09778-7
-
Drosophila subdued is a moonlighting transmembrane protein 16 (TMEM16) that transports ions and phospholipidsJournal of Biological Chemistry 294:4529–4537.https://doi.org/10.1074/jbc.AC118.006530
-
The nhTMEM16 scramblase is also a nonselective ion channelBiophysical Journal 111:1919–1924.https://doi.org/10.1016/j.bpj.2016.09.032
-
Physical basis of apparent pore dilation of ATP-activated P2X receptor channelsNature Neuroscience 18:1577–1583.https://doi.org/10.1038/nn.4120
-
Independent activation of ion conduction pores in the double-barreled calcium-activated chloride channel TMEM16AThe Journal of General Physiology 148:375–392.https://doi.org/10.1085/jgp.201611650
-
Ca2+-dependent phospholipid scrambling by a reconstituted TMEM16 ion channelNature Communications 4:2367.https://doi.org/10.1038/ncomms3367
-
Comparison of ion transport determinants between a TMEM16 chloride channel and phospholipid scramblaseThe Journal of General Physiology 10:jgp.201812270.https://doi.org/10.1085/jgp.201812270
-
Structure and function of TMEM16 proteins (anoctamins)Physiological Reviews 94:419–459.https://doi.org/10.1152/physrev.00039.2011
-
Ion channel and lipid scramblase activity associated with expression of TMEM16F/ANO6 isoformsThe Journal of Physiology 593:3829–3848.https://doi.org/10.1113/JP270691
-
TMEM16F is a component of a Ca2+-activated cl- channel but not a volume-sensitive outwardly rectifying cl- channelAmerican Journal of Physiology. Cell Physiology 304:C748–C759.https://doi.org/10.1152/ajpcell.00228.2012
-
Role of membrane potential in the regulation of cell proliferation and differentiationStem Cell Reviews and Reports 5:231–246.https://doi.org/10.1007/s12015-009-9080-2
-
Calcium-dependent phospholipid scramblase activity of TMEM16 protein family membersJournal of Biological Chemistry 288:13305–13316.https://doi.org/10.1074/jbc.M113.457937
-
Anoctamins are a family of Ca2+-activated cl- channelsJournal of Cell Science 125:4991–4998.https://doi.org/10.1242/jcs.109553
-
Anoctamin 5/TMEM16E facilitates muscle precursor cell fusionThe Journal of General Physiology 150:1498–1509.https://doi.org/10.1085/jgp.201812097
-
Anoctamins/TMEM16 proteins: chloride channels flirting with lipids and extracellular vesiclesAnnual Review of Physiology 79:119–143.https://doi.org/10.1146/annurev-physiol-022516-034031
-
Calcium-calmodulin does not alter the anion permeability of the mouse TMEM16A calcium-activated chloride channelThe Journal of General Physiology 144:115–124.https://doi.org/10.1085/jgp.201411179
Decision letter
-
Kenton Jon SwartzReviewing Editor; National Institute of Neurological Disorders and Stroke, National Institutes of Health, United States
-
Richard AldrichSenior Editor; The University of Texas at Austin, United States
-
Gilman ToombesReviewer; National Institute of Neurological Disorders and Strokes, United States
In the interests of transparency, eLife includes the editorial decision letter and accompanying author responses. A lightly edited version of the letter sent to the authors after peer review is shown, indicating the most substantive concerns; minor comments are not usually included.
[Editors’ note: this article was originally rejected after discussions between the reviewers, but the authors were invited to resubmit after an appeal against the decision.]
Thank you for submitting your work entitled "Dynamic change of electrostatic field in TMEM16F permeation pathway shifts its ion selectivity" for consideration by eLife. Your article has been reviewed by three peer reviewers, and the evaluation has been overseen by Kenton Swartz as the Reviewing Editor and a Senior Editor. The following individual involved in review of your submission has agreed to reveal their identity: Gilman Toombes (Reviewer #2).
Our decision has been reached after consultation between the reviewers. Based on these discussions and the individual reviews below, we regret to inform you that your work will not be considered further for publication in eLife.
The reviewing editor and reviewers found your manuscript on TMEM16F to be interesting and provocative. However, after careful consideration, the consensus was that there are substantive technical concerns with your measurements of Vrev, including potential problems arising from not subtracting background conductances or controlling for potential changes in ion concentrations during your recordings. There were also concerns with your proposed mechanism and whether the changes you see may be physiologically relevant, The reviewers articulate their concerns at considerable length, which we hope you will find helpful in sorting out whether the ion selectivity of TMEM16F is indeed dynamic, and if so what the underlying mechanism and physiological relevance may be.
Reviewer #1:
This manuscript by the Jan lab investigates the selectivity of the TMEM16F channel/scramblase. Multiple contrasting publications in the literature reported that TMEM16F-mediated ionic currents are anion-, cation- or non-selective. Here, Ye and colleagues show that the selectivity of TMEM16F changes dynamically as a function of divalent cations, ionic strength, and voltage. The authors propose that this shift in selectivity is not due to the ability of the TMEM16F ion pore to adopt conformations with different selectivity properties, but rather to the modulation by divalent cations of the electric field within the pore.
These findings are important because they provide a unifying framework to interpret the contrasting and confusing data present in the literature. However, I have three major concerns with regards to the interpretation of the data, and several minor issues that need to be addressed.
1) TMEM16F is a scramblase, as such its main function is lipid transport to externalize PS to initiate blood coagulation and recognition of apoptotic cells by macrophages. The physiological relevance of TMEM16F-mediated ionic currents is -at the moment- unclear. Further, activation of TMEM16F currents require sustained depolarizations and high Ca2+ concentrations, while lipid scrambling requires only elevation of Ca2+, but not depolarization. Thus, it is not clear under what physiological conditions the self-braking mechanism enabled by the dynamic switch in selectivity might play a role. For example, does the membrane potential of platelets and/or apoptotic cells reach and maintain the depolarizations necessary for channel activation? Furthermore, the magnitude of the observed switch is relatively modest; in all conditions the channel is poorly selective between anions and cations, displaying only modest preferences for one over the other. In no cases do the currents approach ideal anion vs cation selectivity. Given the overall poor selectivity, I wonder how much of an effect would be caused by the observed switch in selectivity. Thus, while the phenomenon described here is biophysically interesting, I am not convinced of its physiological relevance. Some quantitation of the effects observed here within the context of a cell would be needed to establish a clear link to physiology.
2) It is not clear through what type of pore ions move in TMEM16F. It has been proposed that the TMEM16 scramblases form a lipid-lined pore through which ions can diffuse together with the lipids that are being scrambled (Whitlock and Hartzell, 2016; Jiang et al., 2017). If this were the case, then the selectivity of the channel would be affected by multiple factors such as lipid headgroups, voltage and mono- and di-valent ions. On the other hand, the TMEM16A homologue forms a more conventional, protein-delimited, pore. In this case, the observed changes in selectivity could reflect either a charge-screening effect (as the authors propose) or the ability of the channel's pore to adopt slightly different conformations. Further, most of the measurements are carried out using a mutant, Q559K that affects both selectivity and gating of TMEM16F. I understand that the mutant was used because of the removal of run-down. It is unclear whether this construct can serve as a good model for the WT pore. The mutation could case subtle rearrangements in the pore rendering it more sensitive to environmental changes. While the present experiments provide evidence suggesting that the selectivity of TMEM16F changes, they shed little light into the mechanisms underlying such a switch.
3) A technical concern I have is that the measured currents are relatively large (~1 nA) and the stimulation protocols used are long. Can the authors rule out that the effects they see are due to ion accumulation/depletion effects? The currents in 15 μm Ca2+ are naturally smaller than those in 1 mM Ca2+, and therefore these effects are less pronounced leading to the observed differences. Did the authors use different directs of the ramp and/or tail current protocols to measure reversal potentials? Is there an effect on the direction of the ion switch (i.e. going from 150 NaCl to 15 NaCl is the same as going from 15 NaCl to 150 NaCl)? Do they observe a dependence of the magnitude of the effects as a function of the current in the patch?
4) Subsection “Q559K channel ion selectivity varies with intracellular Ca2+ concentration”. The reversal potential of the QK/EQ mutant suggest this mutant is less Cl- selective than the QK mutant alone. Thus, at an intermediate Po the selectivity is also intermediate. This is more consistent with a model where the pore can adopt multiple open states with different selectivity. What happens to the currents of the QK mutant alone (or WT) when measured at a Po~0.5? I do not think that the authors' conclusion that "This indicates either that TMEM16F ion selectivity is not correlated with its open state, or that the E667Q mutation circumvents the intermediate open state (if any) and causes the mutant channel to directly enter a fully-open conformation" is warranted by the data.
5) Subsection “The switch of ion selectivity correlates with electrostatic change in permeating pathway”. If the shift in Vrev depends on divalent ions (Ca2+, Zn2+) then the shift should depend in a graded manner on their concentration. Did the authors test what happens when using intermediate increases between the 15 and 1000 μm concentrations shown?
6) Are divalent anions inert? Since the channel is permeable to anions under all conditions (even when it is in its "cation selective" state, its selectivity is modest), these ions can enter the pore and therefore should have the opposite effect of the divalent cations.
7) The inactivation in Figure 4A is slow (tau~30s – 1 min). Why weren't the reversal potentials measured after reaching activation but before inactivation sets in? Is inactivation dependent on voltage? If the patches are held at a membrane voltage closer to reversal is there a similar effect?
8) I find the effects of Zn2+ confusing where they regard the rapid run-down that is PIP2 independent. Are there multiple run-down mechanisms?
9) Discussion section. The authors state "However, TMEM16F does not have an "Ohmic" state: the channel always requires depolarization to be activated." What does this mean? That the pore is intrinsically rectifying? Ohmic state would refer to conductance, not gating.
Reviewer #2:
While TMEM16F's dual roles as a calcium-activated phospholipid scramblase and ion channel are well established, its’ ionic selectivity remains the subject of debate. In this work, the authors examine whether the ionic selectivity of TMEM16F can change in response to solution composition and membrane voltage. Using the Q559K mutation to prevent channel rundown, the authors report that TMEM16F switches its preference from cations to anions depending on the intra-cellular calcium concentration and membrane voltage used to activate it, and they propose that this switch results from the calcium ions and membrane potential changing the electrostatic field in the permeation pathway.
The authors results are very interesting, but I have several concerns.
1) Experimental artifacts: To combat channel rundown and voltage-dependent activation, the authors have resorted to protocols with sizeable resting membrane currents and conductance, conditions that can easily lead to ion accumulation/depletion artifacts ("Calcium-calmodulin does not alter the anion permeability of the mouse TMEM16A calcium-activated chloride channel", JGP 2014 Jul; 144(1): 115-124.).
I am sure the authors have thought carefully about this issue and probably already have data to exclude this possibility. For example, since the channel undergoes desensitization, they should have recordings in which early ramps have a much larger conductance than later ramps recorded under identical conditions (e.g. [Ca2+], holding voltage). If the reversal potential for each condition is essentially independent of the holding current/conductance, ion accumulation/depletion artifacts are unlikely. Reporting key experimental details (e.g. complete protocol and order in which conditions/ramps were performed, leak subtraction protocol, series resistance compensation, composition of 15mM NaCl solution, control experiments to exclude effects of Ca2+, HEPES, EDTA permation, etc.) would help address these concerns.
2) Proposed mechanisms for holding voltage changing ionic selectivity:
The authors seem to be proposing that Ca2+ (and perhaps also Na+) ions driven into the permeation pathway by the electric fields/driving force during the holding/activation voltage somehow modify permeation during the subsequent voltage ramp step. I have two concerns with this idea. Firstly, the authors have previously reported that TMEM16F is quite permeable to calcium. Larger depolarizations will drive more calcium out through the channel which could lower the calcium concentration on the intra-cellular side of the permeation pathway, rather than increasing it. Secondly, for the permeation pathway to act as a channel, ions must be able to enter and leave it on the microsecond timescale and thus one would expect rapid turnover of all permeating ions during the voltage ramp. For the channel to "remember" the holding voltage, it seems like voltage would either have to induce a conformational change or modulate the binding of ions to specific sites that turnover slowly enough to remain present during the subsequent ramp.
Reviewer #3:
This manuscript explores how Ca2+ concentration may affect TMEM16F ion-selectivity. In high intracellular Ca2+, TMEM16F runs down quickly. However, the authors overcome the rundown problem of TMEM16F by utilizing the Q559K mutant together with the wild-type TMEM16F for their experiments. In both proteins, they report that the current is cation selective at low intracellular [Ca2+], but becomes anion selective at high Ca2+. Also, they show that manipulating the opening state of the channel does not affect this ion-selectivity shift, but manipulating electrostatic field in the permeation pathway of the channel does. Finally, they also found that more positive potential tends to increase the anion permeability. They speculate that the discrepancy of TMEM16F ion selectivity reported in the literature may result from different recording conditions such as holding potentials and ion concentrations.
While resolving the controversy in the cation/anion selectivity of TMEM16F is important, the authors' conclusion that the controversy results from different recording conditions used in various labs (such as different holding voltages, ionic conditions, or Ca2+ concentrations used) is a little bit hand waiving. In the literature, the permeability difference in TMEM16F between Na+ and Cl- is not huge. Even accepting the results in this study as face value, the TMEM16F's PNa/PCl ratios range from 0.5 to 2 (Figure 5D). It is therefore strange that the authors would call such a several-fold difference of Na+/Cl- permeability as Na+ selective (or Cl- selective in the other way around). Even worse, the changes of the PNa/PCl permeability ratios reported here may actually be artefacts.
In the present study and the Yang et al. paper cited by the authors (Yang et al., 2012), there are at least two serious technical problems that could contribute to the controversy. In fact, the result from Yang et al., 2012 and the result in this paper, both from the same lab, already contradict each other. Here is a striking example: in the present study, the authors show that with a high concentration (1 mM) of Ca2+, when [NaCl]i is changed from 150 mM to 15 mM, the reversal potentials (in both Q559K and wild-type TMEM16F) shift from ~ 0 mV to ~ -15 mV (Figure 1). In Yang et al., 2012, a similar 10-fold change of [NaCl]i in the presence of 0.5 mM Ca2+ generated a right shift of the reversal potential to ~+20 mV (Figure 6 D and 6G in Yang et al., 2012). Both experiments are excised inside-out patch recordings, and the solutions are similar (150 mM/15 mM vs 140 mM/14 mM). The [Ca2+]i in Yang et al. was 0.5 mM, which should be closer to 1 mM Ca2+ than to 15 µM Ca2+. Why did the authors obtain a left shift of the reversal potential while in Yang et al., 2012, the reversal potential shifted to the right?
Two technical issues in both the current study and Yang et al., 2012 are not seriously dealt with.
The first serious technical problem is the junction potential correction. Throughout the whole paper of Yang et al., 2012, there was no description of junction potential correction. In the present study, the authors mention that "the liquid junction potentials for 15 mM NaCl, (and) 45 mM NaCl were -1.7 mV and -1.0 mV respectively.……". I suppose that the authors calculated these values with respect to the 150 mM NaCl solution. If so, these values are severely under-estimated. In fact, using the same calculator (Clamplex), the value of liquid junction potential for 15 mM NaCl (with respect to 150 mM NaCl) is -11 mV (I confirm this value by actually measuring the liquid junction potential between 15 mM NaCl and 150 mM NaCl solution). Since the data points in the figures (For example, Figure 1 F and G) are not corrected for the junction potential, the reversal potential of ~ -15 mV in 1 mM Ca2+ (see Figure 1G) should only be ~ -4 mV (with a 10-fold NaCl gradient). The reversal potential shift in Q559K in 15 µM Ca2+ in the paper is ~ +10 mV (Figure 1G). After junction potential correction, this should be ~+20 mV.
The second and even more problematic issue is a lack of background current subtraction. Throughout the whole manuscript (and also in Yang et al., 2012), I do not see a description of background current subtraction for the presented I-V curves (and thus the measured reversal potentials). In the absence of TMEM16F conductance, the HEK293 cells have a cation-selective endogenous conductance. The authors actually show this fact from the background current measurement where the reversal potentials under 150 mM/15 mM NaCl condition were ~+20 mV (in 1 mM Ca2+) and ~ +60 mV (in 15 µM Ca2+) (see B and C in Figure 1—figure supplement 1). The conductance of the untransfected cell patches includes the leak conductance and the conductance from the endogenous channels/transporters. If we sum the two as the background conductance (abbreviated as gb), and the conductance from TMEM16F (the channel conductance) is denoted as gc, the measured reversal potential (Erev) should be a weighted sum of the reversal potential of gc (abbreviated as Ec) and that of gb (abbreviated as Eb) according to the following equation:
Erev = [gc/(gc+gb)] × Ec + [gb/(gc+gb)] × Eb
Reducing [NaCl] or Ca2+ will reduce the TMEM16F conductance (gc), and therefore, Erev will approach Eb (which is +20 mV or +60 mV). When the gc is much larger than gb (this is the case when TMEM16F is activated by 1 mM Ca2+), the contribution of gb to the measured Erev is less significant (as shown in Figure 1—figure supplement 1A, blue and grey curve). However, when gc is small relative to gb, the measured Erev will be severely contaminated by Eb. The example is no better than the one provided by the authors in Figure 6, where when the holding voltage is more positive (the TMEM16F conductance is larger because of its outward rectification property), the reversal potential is less positive (less contaminated by Eb). This phenomenon is consistent with all the results throughout the paper. Various manipulations in the paper (including several mutations or even experiments in TMEM16A) would not change this trend-the larger the gc, the less positive the measured Erev.
Without subtracting the background current obtained in the absence of Ca2+, how large the total current should be so that the measured Erev is good enough to reflect the true TMEM16F reversal potential (Ec)? The equation above indicates that gc needs to be larger than 90% of the total conductance (gc + gb) in order to have a measurement where <10% of Eb (namely +2 mV to +6 mV, according to the measured Eb) is added to the measured reversal potential. The authors show that the background current from untransfected cell patches at +80 mV is 50-80 pA (Figure 1—figure supplement 1B and C). If the total current at +80 mV is 500 pA (0.5 nA) in the solution with 15 µM Ca2+ and 15 mM NaCl, as in many of the authors' recording traces, the conductance of TMEM16F at +80 mV is ~ 9-10 fold that of the background current. However, since WT TMEM16F and Q559K mutant are outwardly rectifying, their conductances are quickly reduced by several fold near the reversal potential (the outward rectification is even more severe in low NaCl and low Ca2+ condition). Therefore, the 9-10 fold gc/gb ratio at +80 mV may reduce to 2-3 near Ec (gb is constant at different voltages). Suppose the true value of Ec is 0 mV in the 150 mM/15 mM NaCl condition (namely, PNa/PCl =1), and the value of Eb is +60 mV (as shown in the supplementary figure), a gc/gb ratio of 2-3 will give a measured reversal potential of +20 mV – +30 mV. If the total current at +80 mV is less than 0.5 nA, the situation will be even worse. Interestingly, the reversal potentials measured in 150 mM/15 mM NaCl condition in many experiments in this manuscript are in this range.
The above example therefore emphasizes the importance of subtracting the background current in order to evaluate EC more precisely. However, I am only using the data provided by the authors to make the above estimate. Since the background currents vary from patch to patch, the easy way to minimize the contribution of the background conductance is to subtract the current obtained in the absence of Ca2+ from current obtained in the presence of Ca2+. By doing background current subtraction, the authors would eliminate the shift in Erev caused by the background conductance and thus isolate the shift in Erev caused by Ca2+. It is interesting that similar background current contamination of the reversal potential measurement is also shown in TMEM16A and its K584Q mutant in this manuscript (Figure 6—figure supplement 1). However, it appears that the authors have not noticed this problem. Taking K584Q recordings as an example (see Figure 6—figure supplement 1), the K584Q conductance is bigger in 1 mM Ca2+ than in 0.4 µM Ca2+. Therefore, the reversal potential is more shifted to the right in 0.4 µM Ca2+. Here, the measured reversal potentials (10 fold NaCl gradient) of K584Q in 0.4 µM and 1 mM Ca2+ are both far from the perfect Cl- Nernst potential. It has already been shown (see Supplementary figure 2 in Jeng et al., 2016) that after background current subtraction, the K584Q mutant, like the wild-type TMEM16A, is perfectly Cl- selective in 20 µM Ca2+. In other words, based on the measured reversal potentials, K584Q in 20 µM Ca2+ in Jeng et al., 2016, is more Cl- selective than the K584Q current activated by 1 mM Ca2+ shown in this paper. The key difference between the two studies is the background current subtraction.
With these technical flaws, the reported reversal potentials in this manuscript are simply not correct. I am not sure if the authors have measured background I-V curve in every recorded patch. If not, I do not think the problem can be corrected within a short time. If these two technical problems are corrected, I anticipate that conclusion of the paper is probably not going to hold.
[Editors’ note: below is the decision letter following the authors’ appeal.]
Thank you for choosing to send your work entitled "Dynamic change of electrostatic field in TMEM16F permeation pathway shifts its ion selectivity" for consideration at eLife. Your letter of appeal has been considered by Rick Aldrich as Senior Editor and Kenton Swartz as Reviewing editor, and we are prepared to consider a revised submission with no guarantees of acceptance.
The editors and reviewers have read and discussed your rebuttal. It is important to point out that our initial concerns remain, and we are not convinced that your plan for revision will satisfy those concerns. However, we are willing to reconsider a revised manuscript after you have had a chance to do the additional experiments. The following are several points that you should consider in preparing the revised manuscript.
1) We remain concerned that leak currents could contribute in a non-linear fashion to the observed shifts in Vrev. The data provided in your rebuttal does not address this issue, as in different ionic concentrations the shape and Vrevof the leak will change. We suggest that you bracket each IV measurement in any solution containing calcium with measurements of the background IV (i.e. 0µM Ca2+) in solutions with identical NaCl concentration so that the voltage dependence of the total and leak currents can be directly compared. We understand that there is no perfect way to identify and subtract leak currents for TMEM16F, but by showing raw and leak corrected data it will be possible to estimate the total and leak conductances at the reversal potential and thereby gauge the accuracy and reliability of the Vrevcalculations. Since this does not appear to have been done in your initial experiments, we would request that they show a set of experiments between the extremes of low and high current density where you do these experiments, perhaps using a couple of different constructs.
2) As you point out, the current in your experiments is typically quite high, in the range of 1-8 nA when activated with calcium at +80mV. Although increasing current density diminishes the contribution of leak currents, currents of this magnitude will cause substantial voltage errors due to series resistance and will also alter ion concentrations (via ion depletion and accumulation). The plots of the current magnitude vs Vrevshift in Author Response Image 1D of your rebuttal only partially addresses this concern since the conductance of TMEM16F is nonlinear and you have not reported the TMEM16F and leak conductances at the reversal potential. Furthermore, the data in Author Response Image 1D shows that there is a ~2-fold variability in the Vrevmeasurements (between ~15 and ~35 mV), in a similar range to the changes in Vrevthat lead you to conclude that the ion selectivity of TMEM16F changes. We are not certain how best to resolve this issue, but we suggest that it might be helpful to provide Vrevmeasurements as outlined above for both low and high calcium and to extend the range shown in Figure 1D to somewhat lower current density, in the range of 500 pA. While these might be affected more by background leak currents, they might also serve to validate the conclusions by providing an empirical calibration of the role of the leaks and other errors.
3) We suggest that you rephrase how you describe the ion selectivity of TMEM16F. Assuming a clear shift in Vrevcan be unambiguously demonstrated, it would be more appropriate to refer to the protein as a poor ion selective channel that slightly changes its ionic preference (rather than a sodium selective channel that becomes chloride selective).
4) We think the potential physiological effects of the ion selectivity changes you report are overstated. You argue that the effects might induce a ~13 mV change in the resting potential of a cell where TMEM16F is the main conductance. However, we are unaware of conditions where a cell would be exposed to millimolar intracellular calcium and sustained large depolarizations. Moreover, the presence of other currents would significantly diminish the impact of small changes in the selectivity of TMEM16F, especially since in the -80 to +50 mV range (where the cell membrane potential is likely to be), TMEM16F has a very low Po (i.e. Figure 1—figure supplement 2D). Therefore, the physiological effects on a cell's membrane voltage -if any- will be considerably smaller than ~13 mV. We request that the physiological relevance should be removed from the Abstract and significantly toned down in the Discussion. The focus of the manuscript should be on the biophysical mechanism underlying the small shift in selectivity.
5) We suggest that you add a discussion about the origin of the discrepancy of the ion selectivity of TMEM16A and TMEM16F.
[Editors' note: further revisions were requested prior to acceptance, as described below.]
Thank you for resubmitting your work entitled "Dynamic change of electrostatic field in TMEM16F permeation pathway shifts its ion selectivity" for further consideration at eLife. Your revised article has been favorably evaluated by Richard Aldrich (Senior Editor), Kenton Swartz (Reviewing Editor), and three reviewers.
The manuscript has been improved but there are some remaining issues that need to be addressed before acceptance, as outlined below:
Summary:
The authors' extensive revisions resolve many issues with the earlier version. The article now describes the authors' considerable efforts to exclude artifacts that might bias the reversal potential methods, and also provides sufficient detail that their measurements can be meaningfully compared to other published work. The following are suggestions for revising the manuscript:
Major comments:
1) The term "electrostatic gate" seems out of place. The ordinary meaning of a "gate" is to control a flux in an all-or-none way. It is very odd to read a sentence like “…the "closed state" of the electrostatic gate allows the permeation of cations.”. Throughout the whole paper, there are no results showing that TMEM16F is only conducting cations or only conducting anions. It seems inappropriate to use the concept of "gate" to represent the control by a change of electrostatic potential. Controlling the cation versus anion selectivity by altering the pore potential (through charge residue mutations) is well documented in pentameric ligand-gated channels. The authors may want to reference those papers to strengthen the main conclusion in this paper.
2) Synergy of Ca2+ and Depolarization: The authors propose that depolarization indirectly modifies permeation by "driving Ca2+ into the membrane electric field". While the conceptual simplicity of this idea is appealing, the authors observe that depolarization still alters the relative permeability even at high (i.e. 1mM) calcium concentrations where the site of action for calcium should be saturated.
https://doi.org/10.7554/eLife.45187.024Author response
[Editors’ note: the author responses to the first round of peer review follow.]
We thank the reviewers for their helpful suggestions. We are grateful for the acknowledgement by all the reviewers that our work provides a unifying mechanism for previous discrepancy pertinent to ion selectivity of TMEM16F. Parts of comments by reviewer 1 and 2, and almost all of the comments by reviewer 3 are focusing on technical issues, mainly questioning whether the shift of reversal potential is an artifact resulting from issues involving ion accumulation / depletion, liquid junction potential and background current contamination. Reviewers 1 and 3 also raise the question about the physiological implication of the ion selectivity shift. In addition, reviewers 1 and 2 inspire us to perform a few more practical experiments to support our proposed mechanism. In this appeal letter, we will clarify these main issues followed by point-to-point responses.
We will address our responses to the concerns raised by multiple reviewers, including technical issues and physiological implications, and believe these concerns could be cleared. Upon the request by the reviewers, we will perform a few additional experiments to corroborate our mechanistic model.
1) Technical issues
All the reviewers express the concern regarding whether the shift of Erev is an experiment artifact. We apologize for not having explained the methodology clearly in the manuscript. We will add the experimental details and two figures (Figure 1—figure supplement 2 and Author response image 1) to the revised manuscript to illustrate how the traces were obtained from recording with a hyperpolarizing ramp, and how we performed “quality control”, as suggested by reviewer 2. We hope this revision will address the reviewers' concerns.
First, for all the experiments, we started recording in a 150 mM NaCl, Ca2+-free solution and made sure that the current recorded at +80 mV is around or smaller than 100 pA before applying Ca2+ (Figure 1—figure supplement 2 A, G); In most cases we only included recordings with Ca2+-activated current > 1000 pA. In all cases, we made sure that the Ca2+-activated current (recorded at +80 mV) is >ten-fold larger than endogenous current before switching protocol for testing Erev, and this is consistent with reviewer 3's estimation. In addition, for data in Figure 1 (and supplement 2, 4), Figure 2, Figure 3, Figure 4, Figure 5, Figure 6—figure supplement 1, Figure 7, we always recorded the current in 0 Ca2+ solutions at the end to make sure that the seal is good (as in Figure 1—figure supplement 2 B, E, H, K).
Second, there is no correlation between reversal potential and current magnitude (Figure 1—figure supplement 2 D, J). If the current was contaminated by endogenous current (which is cation-selective), there would be a negative correlation between Erev and current magnitude, but we did not see such a trend. This analysis also partially answers the question of reviewer 1 and 2 regarding artifacts caused by ion accumulation / depletion.
Third, we did notice that with the hyperpolarizing ramp (so-called "reverse ramp"), using current magnitude at +80 mV as “quality control” will underestimate the effect of background current contamination, because TMEM16F current is outwardly rectifying while background current is linear (as pointed out by reviewer 3). We have thought about this and have made sure that our conclusion is valid: (1) In Figure 1—figure supplement 2C, the current at 0 mV is ~-200 pA, which would not have been "eliminated" even if we performed background subtraction, suggesting that the channel activated by 15 µM Ca2+ mostly permeates cation. (2) The "reverse tail current" (recorded at +80 mV, arrowed in Figure 1—figure supplement 2C, I, L) following the reverse ramp is still 6~7-fold the size of the background current, meaning that the current at ~0 mV will be larger than that. The current underlying the reversal potential thus is dominated by TMEM16F current. To be cautious with our conclusions, we did not interpret the reversal potential of WT TMEM16F in 1 mM Ca2+ (Figure 1—figure supplement 2F). (3) Most importantly, the double mutant Q559K_G615A reduces the rectification in both 15 µM and 1 mM Ca2+(Author response image 1). For this double mutant, the currents recorded at both Ca2+ concentrations were almost linear (Figure 4E, Author response image 1C, D) with little inactivation at hyperpolarized membrane potential, and the reversal potential was clearly shifted.
Fourth, reviewer 1 and 2 raise the issue of ion accumulation / depletion. For most recordings, we switched solutions "back and forth" to make sure traces in the same solution reversed at the same voltage despite the change of current magnitude. We also successively recorded multiple traces in the same solution to make sure there was no drift. Between different cells, there was no correlation between Erev and current magnitude (Figure 1—figure supplement 2). In addition, the main conclusion of our study is not affected by any deviation (even if there is actually a deviation) caused by the ion accumulation or depletion: We used a hyperpolarizing ramp protocol following a holing potential at +80 mV (See Figure 1—figure supplement 2). This will cause Na+ efflux and/or Cl- influx, potentially leading to Na+ accumulation on the extracellular side and Cl- accumulation on the intracellular side (or intracellular Na+ depletion and extracellular Cl- depletion). All of these possibilities should push ENa and ECl to “more positive” values, leading to a positive shift of Erev (as observed in the JGP paper1 cited by reviewer 2). This is opposite to the difference between 15 µM and 1 mM Ca2+, where the Erev in 1 mM Ca2+ is more negative. Also, In Figure 6D, a more depolarized holding potential should exacerbate the accumulation/depletion effect (if there is any), also pushing Erev to more positive values. The data show the opposite.
Fifth, reviewer 3 states that "the smaller the magnitude, the more cation-selective the current" suggesting that the current is contaminated by endogenous current. We believe this is a misinterpretation of our data. The reviewer might be comparing the magnitudes between the currents in 15 mM NaCl (~0.5 nA, as was stated in his/her opinion, likely referring to the red and blue traces in Figure 1F), which seems inappropriate; instead, we should compare the pink trace and the gray trace (Figure 1F, recorded in 150 mM NaCl). For each cell expressing Q559K mutant channels, the current activated by 15 µM Ca2+ (pink) and by 1 mM Ca2+ (gray) were similar in magnitude (consistent with data in Figure 1B, D). In contrast, since the red trace is more Na+-selective than the blue trace, in 15 mM [NaCl]i the driving force for Na+ efflux at +80 mV is small (only 20 mV), while in 1 mM Ca2+ (the blue trace) the outward current is mainly carried by Cl- influx. Thus, this comparison between the red and blue traces is in fact consistent with our main idea. In addition, among different cells expressing WT or Q559K channels, there is no correlation between current magnitude and reversal potential (Figure 1—figure supplement 2 D, J).
Last but not least, reviewer 3 raises the issue of background current contamination and liquid junction potential. Given the above explanation of experiment details, including selection of Ca2+-activated current > 1 nA, validation with "reversal tail current" and the utilization of a mutant with reduced rectification, we hope the reviewer would be convinced that the measured reversal potentials are accurate. Also, in the point-to-point response to reviewer 3, we will demonstrate that background current correction will actually "expand" the magnitude of Erev shift and cause additional problems, given how Ca2+ affects the background current. We will also demonstrate in our response to reviewer 3 that our correction of liquid junction potential is reliable.
2) Physiological implication
Reviewer 1 and 3 point out that the shift of reversal potential is modest and question whether it is physiologically significant. We believe that the “relatively modest” ion selectivity change is sufficiently large to be relevant for physiological functions. In a hypothetical cell whose Cl- equilibrium potential is -60 mV and extracellular / intracellular cations are Na+ / K+ respectively, a shift of PNa+/PCl- from 0.5 to 2 can cause the membrane potential shift from -22 mV to -9 mV (assuming that this channel is the predominant local membrane conductance, and its PNa+ = PK+), big enough to regulate some signaling molecules such as NMDA receptors, voltage-gated Ca2+ and Na+ channels. Given that TMEM16F is proposed to be on the dendritic spines of neurons2, a local membrane potential change can be very consequential.
TMEM16F is one of the several TMEM16 members universally expressed in diverse cell types, including epithelial cells, neurons and immune cells, but its physiological functions have not been fully characterized. It was reported that TMEM16F is localized in the primary cilia of epithelial cells3 as well as odorant receptor neuron sensory cilia4. Primary cilia are specialized organelles containing high Ca2+ and being constantly depolarized5, offering a “platform” for the dynamic ion selectivity. The ion transport in primary cilia is still a new area of investigation, and our work is indicative of a new regulatory machinery of primary cilia signaling. Our studies of TMEM16F might provide novel hints to people studying ion transport at subcellular regions, such as dendritic spines and cilia.
3) Additional experiments as suggested by reviewers
Based on suggestions of reviewer 1, we will test the effect of divalent anion on reversal potential. We will use Na2SO4-based pipette solution and record the reversal potential of Q559K with the same protocol. We expect to see a less substantial reversal potential shift as we switch from 15 µM Ca2+ to 1 mM Ca2+, since we predict divalent anions might have effects opposite to those of divalent cations with respect to the alteration of electrostatic field in the permeation pathway.
Based on the suggestions of reviewer 2, we will test TMEM16F's "memory" of factors impacting the reversal potential at a given holding voltage (+80 mV). We will hold the membrane potential at +80 mV for ~5 s followed by hyperpolarizing ramps of different speeds. We expect to see that the recorded reversal potential is shifted to a more positive value as the ramp speed is reduced. This would indicate that TMEM16F ion selectivity is restored to being more Na+ selective as the membrane repolarizes during a slow ramp.
Also based on the suggestion of reviewer 2, we will test the reversal potential of Q559K with whole cell configuration.
Based on the comment of reviewer 3, we will test whether replacing NaCl with mannitol or NMDG2-SO4 would affect the ion selectivity of TMEM16A.

The shift of Erev persists in a mutant with reduced outward rectification, Q559K_G615A.
(A) Time course of TMEM16F Q559K_G615A activation by 15 µM Ca2+ in 150 mM NaCl. The inside-out membrane patch was held at +80 mV. (B) Normalized conductance-voltage relationships. (C) Recordings of reversal potential with a hyperpolarizing ramp protocol following constant holding potential at +80 mV. The solutions were applied in the order of 150 mM with 15 µM Ca2+, 15 mM with 15 µM Ca2+, 150 mM NaCl with 1 mM Ca2+, 15 mM NaCl with 1 mM Ca2+. Ca2+-free 150 mM NaCl solution was applied at the end to confirm the seal. (D) Detail amplification showing the tail currents in C recorded at +80 mV following the hyperpolarizing ramp.
Reviewer #1:
[…] 1) TMEM16F is a scramblase, as such its main function is lipid transport to externalize PS to initiate blood coagulation and recognition of apoptotic cells by macrophages. The physiological relevance of TMEM16F-mediated ionic currents is -at the moment- unclear. Further, activation of TMEM16F currents require sustained depolarizations and high Ca2+ concentrations, while lipid scrambling requires only elevation of Ca2+, but not depolarization. Thus, it is not clear under what physiological conditions the self-braking mechanism enabled by the dynamic switch in selectivity might play a role. For example, does the membrane potential of platelets and/or apoptotic cells reach and maintain the depolarizations necessary for channel activation? Furthermore, the magnitude of the observed switch is relatively modest; in all conditions the channel is poorly selective between anions and cations, displaying only modest preferences for one over the other. In no cases do the currents approach ideal anion vs cation selectivity. Given the overall poor selectivity, I wonder how much of an effect would be caused by the observed switch in selectivity. Thus, while the phenomenon described here is biophysically interesting, I am not convinced of its physiological relevance. Some quantitation of the effects observed here within the context of a cell would be needed to establish a clear link to physiology.
We thank the reviewer for raising the question regarding the physiological relevance of our work. It is true that previous studies regarding TMEM16F functions are mostly focused on its function of phospholipid scrambling and vesiculation. However, recently published papers6 and preprints7 indicated that monovalent ions (not only Ca2+) are necessary for the execution of these functions. Clarification of TMEM16F ion selectivity will help unravel the mechanism of lipid scrambling, providing answers to questions such as whether scrambling occurs at a particular stage of the ion permeability transition, and whether movement of different ions drives the scrambling of different lipids.
TMEM16F is one of the few TMEM16 members universally expressed in diverse cell types, but its subcellular localization and physiological functions have not been fully characterized. It was reported that TMEM16F is localized in the primary cilia of epithelial cells3, which are specialized organelles containing high Ca2+ and being constantly depolarized5 – physiological conditions where TMEM16F ion selectivity shift is very likely. Our studies might suggest implications for researchers studying these subcellular regions. Also, as we discussed in "responses to all reviewers", the “relatively modest” ion selectivity change is sufficiently large to be relevant for physiological functions, such as the regulation of NMDA receptors and voltage-gated ion channels. Given that TMEM16F is proposed to be on the dendritic spines of neurons2, a local membrane potential change can be very consequential.
2) It is not clear through what type of pore ions move in TMEM16F. It has been proposed that the TMEM16 scramblases form a lipid-lined pore through which ions can diffuse together with the lipids that are being scrambled (Whitlock and Hartzell, 2016; Jiang et al., 2017). If this were the case, then the selectivity of the channel would be affected by multiple factors such as lipid headgroups, voltage and mono- and di-valent ions. On the other hand, the TMEM16A homologue forms a more conventional, protein-delimited, pore. In this case, the observed changes in selectivity could reflect either a charge-screening effect (as the authors propose) or the ability of the channel's pore to adopt slightly different conformations. Further, most of the measurements are carried out using a mutant, Q559K, that affects both selectivity and gating of TMEM16F. I understand that the mutant was used because of the removal of run-down. It is unclear whether this construct can serve as a good model for the WT pore. The mutation could case subtle rearrangements in the pore rendering it more sensitive to environmental changes. While the present experiments provide evidence suggesting that the selectivity of TMEM16F changes, they shed little light into the mechanisms underlying such a switch.
We thank the reviewer for the question regarding the structure of TMEM16F. Previous studies have suggested that the Q559K mutant is deficient in scrambling, suggesting that it is a mutant stabilized in an open channel conformation with scrambling defect8. A recent paper also proposes that mutation of Q559 establishes the feasibility to study ion transportation of TMEM16F9. Although WT is not feasible for mechanistic research about the impact of high internal Ca2+ concentration on ion selectivity, we showed that the critical phenotypes as found in Q559K mutant channel could all be recapitulated in WT, including the shift of Erev in accordance to ionic strength (Figure 6), voltage (Figure 7) and Ca2+ level (Figure 1-figure supplement 4). Several studies of the TMEM16 family of proteins regulated in multiple ways have exemplified the strategy of using mutants to “stabilize" some dynamic features (e.g., using G644P to stabilize the TM6 conformational change of TMEM16A10, using Q645A to circumvent one Ca2+-binding event11), as long as critical phenotypes inferred from the mutant studies can be recapitulated in WT.
3) A technical concern I have is that the measured currents are relatively large (~1 nA) and the stimulation protocols used are long. Can the authors rule out that the effects they see are due to ion accumulation/depletion effects? The currents in 15 μm Ca2+ are naturally smaller than those in 1 mM Ca2+, and therefore these effects are less pronounced leading to the observed differences. Did the authors use different directs of the ramp and/or tail current protocols to measure reversal potentials? Is there an effect on the direction of the ion switch (i.e. going from 150 NaCl to 15 NaCl is the same as going from 15 NaCl to 150 NaCl)? Do they observe a dependence of the magnitude of the effects as a function of the current in the patch?
We thank the reviewer for the helpful suggestion. The effects we observe are unlikely due to ion accumulation/depletion. We used a hyperpolarizing ramp following holding the membrane potential at +80 mV (See Figure 1—figure supplement 2). This will cause Na+ efflux and/or Cl- influx, supposedly leading to Na+ accumulation on the extracellular side of the channel and Cl- accumulation on the intracellular side (or intracellular Na+ depletion and extracellular Cl- depletion). All of these should push ENa and ECl to “more positive” values, leading to a positive shift of Erev. This is opposite to the shift we observed between 15 µM and 1 mM Ca2+, where the Erev in 1 mM Ca2+ is more negative. Also, In Figure 6D, a more depolarized holding potential should exacerbate the accumulation/depletion effect (if there is any), also pushing Erev to more positive values. The data show the opposite.
We did not use a different ramp protocol because we predict the measured values will surely be different due to our hypothesis that membrane potential will drive ion movement into/away from the electric field. But for every experiment, we did switch solutions “back and forth” to make sure the results are reproduceable. Also, there is no correlation between Erev with current magnitude (Figure 1—figure supplement 2 D, J). We will perform additional experiments to look into the effect of varying the ramp speed.
4) Subsection “Q559K channel ion selectivity varies with intracellular Ca2+ concentration”. The reversal potential of the QK/EQ mutant suggest this mutant is less Cl- selective than the QK mutant alone. Thus, at an intermediate Po the selectivity is also intermediate. This is more consistent with a model where the pore can adopt multiple open states with different selectivity. What happens to the currents of the QK mutant alone (or WT) when measured at a Po~0.5? I do not think that the authors' conclusion that "This indicates either that TMEM16F ion selectivity is not correlated with its open state, or that the E667Q mutation circumvents the intermediate open state (if any) and causes the mutant channel to directly enter a fully-open conformation" is warranted by the data.
We thank the reviewer for making this point. . The "less negative shift" of Q559K_E667Q compared to Q559K can be attributed to the "cross talk" of the electrostatic field effect of Ca2+ in the binding pocket and ion entry into the permeation pathway, which has been shown in a recent paper for TMEM16A10. What we intended to indicate with this mutant is: Q559K channels in 15 µM Ca2+ or 1 mM Ca2+ are close to "full activation", and if the shift was due to the activation state, the "half-activation" mutant (i.e. Q559K_E667Q in 1 mM Ca2+)_should have more "positive" Erev – which is not the case. We will take the advice by adding the data in 6 µM Ca2+ and revising the text to clarify the point.
5) Subsection “The switch of ion selectivity correlates with electrostatic change in permeating pathway”. If the shift in Vrev depends on divalent ions (Ca2+, Zn2+) then the shift should depend in a graded manner on their concentration. Did the authors test what happens when using intermediate increases between the 15 and 1000 μm concentrations shown?
We thank the reviewer for this question. Yes, Figure 3 shows our results in ~40 µM Ca2+. We will mention this point in the presentation of Figure 3.
6) Are divalent anions inert? Since the channel is permeable to anions under all conditions (even when it is in its "cation selective" state, its selectivity is modest), these ions can enter the pore and therefore should have the opposite effect of the divalent cations.
This is a very interesting question. However, TMEM16A is not permeable to divalent ions such as SO42-, so we are not sure if this will work for TMEM16F Q559K. But nonetheless, we can try testing the reversal potential with SO42- in the solution.
7) The inactivation in Figure 4A is slow (tau~30s – 1 min). Why weren't the reversal potentials measured after reaching activation but before inactivation sets in? Is inactivation dependent on voltage? If the patches are held at a membrane voltage closer to reversal is there a similar effect?
We thank the reviewer for the insight. We did this experiment. Although the rundown of TMEM16F WT current magnitude in 1 mM Ca2+ is "slow", the change of its rectification is relatively fast (Figure 1—figure supplement 2 F, the trace in 45 mM NaCl was recorded ~5 s after solution change to 1 mM Ca2+). Combining these changes together, we cannot draw convincing conclusions from these data. But interestingly, we noticed that if the patch was exposed to 1 mM Ca2+ in 15 mM NaCl, the change of rectification is slower, enabling us to obtain data as in Figure 1_figure supplment 4. We speculate that the inactivation indeed depends on the difference between voltage and Erev, and more specifically, the amount of permeating cation. But this is beyond the scope of this manuscript.
8) I find the effects of Zn2+ confusing where they regard the rapid run-down that is PIP2 independent. Are there multiple run-down mechanisms?
We thank the reviewer for mentioning this point. From Figure 4—figure supplement 1, the Zn2+-induced rundown was reversed in ~1 minute. We thus believe Zn2+-induced rundown was not caused by degradation of PIP2, which is irreversible, although we are not sure whether Zn2+ can sequester PIP2 in a reversible manner. We will re-write the sentence to make it clear.
9) Discussion section. The authors state "However, TMEM16F does not have an "Ohmic" state: the channel always requires depolarization to be activated." What does this mean? That the pore is intrinsically rectifying? Ohmic state would refer to conductance, not gating.
We apologize for the confusing statement. TMEM16A in high Ca2+ concentration (>a few µM) stably binds to two Ca2+ ions so that its conductance is "Ohmic". For TMEM16F, the data indicate that it is always outwardly rectifying regardless of Ca2+ concentration, but we don't know whether the pore is "intrinsically rectifying" or Ca2+ ions are not stably bound without depolarization. We will rewrite the sentence to clarify this point.
Reviewer #2:
[…] The authors results are very interesting, but I have several concerns.
1) Experimental artifacts: To combat channel rundown and voltage-dependent activation, the authors have resorted to protocols with sizeable resting membrane currents and conductance, conditions that can easily lead to ion accumulation/depletion artifacts ("Calcium-calmodulin does not alter the anion permeability of the mouse TMEM16A calcium-activated chloride channel", JGP 2014 Jul; 144(1): 115-124.).
I am sure the authors have thought carefully about this issue and probably already have data to exclude this possibility. For example, since the channel undergoes desensitization, they should have recordings in which early ramps have a much larger conductance than later ramps recorded under identical conditions (e.g. [Ca2+], holding voltage). If the reversal potential for each condition is essentially independent of the holding current/conductance, ion accumulation/depletion artifacts are unlikely. Reporting key experimental details (e.g. complete protocol and order in which conditions/ramps were performed, leak subtraction protocol, series resistance compensation, composition of 15mM NaCl solution, control experiments to exclude effects of Ca2+, HEPES, EDTA permation, etc.) would help address these concerns.
We thank the reviewer for these helpful comments and his trust that we have thought carefully about the issues raised. We will take the advice and explain our methods with more details in the revised manuscript. As we stated in the responses to all reviewers, the concern regarding the ion accumulation/depletion artifacts can be addressed for the following reasons:
For most recordings, we switched solutions "back and forth" to make sure traces in the same solution reversed at the same voltage despite the change of current magnitude. We also successively recorded multiple traces in the same solution to make sure there was no drift. Between different cells, there was no correlation between Erev and current magnitude (Figure 1—figure supplement 2 D, J).
It is important to clarify that the main conclusion of our study is not affected by any deviation (even if there is actually a deviation) caused by the ion accumulation or depletion:
We used a hyperpolarizing ramp from the holing potential at +80 mV (Figure 1—figure supplement 2). This will cause Na+ efflux and/or Cl- influx, potentially leading to Na+ accumulation on the extracellular side and Cl- accumulation on the intracellular side (or intracellular Na+ depletion and extracellular Cl- depletion). All of these possibilities should push ENa and ECl to “more positive” values, leading to a positive shift of Erev (as observed in the cited JGP paper1). This is opposite to the difference between 15 µM and 1 mM Ca2+, where the Erev in 1 mM Ca2+ is more negative. Also, In Figure 6D, a more depolarized holding potential should exacerbate the accumulation/depletion effect (if there is any), also pushing Erev to more positive values. The data show the opposite.
2) Proposed mechanisms for holding voltage changing ionic selectivity:
The authors seem to be proposing that Ca2+ (and perhaps also Na+) ions driven into the permeation pathway by the electric fields/driving force during the holding/activation voltage somehow modify permeation during the subsequent voltage ramp step. I have two concerns with this idea. Firstly, the authors have previously reported that TMEM16F is quite permeable to calcium. Larger depolarizations will drive more calcium out through the channel which could lower the calcium concentration on the intra-cellular side of the permeation pathway, rather than increasing it. Secondly, for the permeation pathway to act as a channel, ions must be able to enter and leave it on the microsecond timescale and thus one would expect rapid turnover of all permeating ions during the voltage ramp. For the channel to "remember" the holding voltage, it seems like voltage would either have to induce a conformational change or modulate the binding of ions to specific sites that turnover slowly enough to remain present during the subsequent ramp.
We thank the reviewer for the question. First, although the Ca2+ permeation may potentially reduce Ca2+ concentration at the intracellular interface of the pore, it is not fast enough to deplete Ca2+. This can be inferred from our data in a previous publication13: holding the membrane patch at a more depolarized membrane potential increases Ca2+ sensitivity of TMEM16F. If local intracellular Ca2+ depletion took place at a faster rate than Ca2+ entry into the membrane electric field, greater depolarization would lead to an increase of the EC50 for Ca2+ activation, which is opposite to what we found in our previous study. We will make this point clearly in the revised manuscript.
The second question concerns the structural basis for TMEM16F ion selectivity shift. The model proposed by the reviewer is based on a "conventional" selective filter exemplified by that in potassium channels, in which a few permeating ions "line up" and move along the pore, though multiple ions may still reside in a wide vestibule below the selectivity filter, as evident from the ability of magnesium and polyamines to cause inward rectification of Kir channels. At this point we do not have a TMEM16F open-channel structure, but we might infer from the structure of TMEM16A. Instead of a conventional selective filter similar to that in voltage-gated ion channels, the TMEM16A permeation pathway has amino acids that are critical for ion selectivity distributed along the pore; with a few narrow constrictions, the permeation pathway has a wide vestibule14-16. This structural feature is compatible with the possibility that ions can enter the permeation pathway and "resident at specific sites" without "leaving the pore", but still allow other permeating ions to move "beside them", reminiscent of schemes included in early editions of Bertil Hille’s book.
Reviewer #3:
[…] While resolving the controversy in the cation/anion selectivity of TMEM16F is important, the authors' conclusion that the controversy results from different recording conditions used in various labs (such as different holding voltages, ionic conditions, or Ca2+ concentrations used) is a little bit hand waiving. In the literature, the permeability difference in TMEM16F between Na+ and Cl- is not huge. Even accepting the results in this study as face value, the TMEM16F's PNa/PClratios range from 0.5 to 2 (Figure 5D). It is therefore strange that the authors would call such a several-fold difference of Na+/Cl- permeability as Na+ selective (or Cl- selective in the other way around). Even worse, the changes of the PNa/PClpermeability ratios reported here may actually be artefacts.
The reviewer believes that the discrepancy regarding PNa/PCl in previously published literature as well as the shift in our study "is not huge". In fact, the moderate permeability ratio is nonetheless physiologically important. In a hypothetical cell whose Cl- equilibrium potential is -60 mV and extracellular / intracellular cations are Na+ / K+ respectively, a shift of PNa/PCl from 0.5 to 2 can cause the membrane potential shift from -22 mV to -9 mV (assuming that this channel is the predominant local membrane conductance, and its PNa+ = PK+), big enough to regulate some signaling molecules such as NMDA receptors, voltage-gated Ca2+ and Na+ channels. Given that TMEM16F is proposed to be on the dendritic spines of neurons2 and primary cilia of epithelial cells3, a local membrane potential change can be very consequential.
In the present study and the Yang et al. paper cited by the authors (Yang et al., 2012), there are at least two serious technical problems that could contribute to the controversy. In fact, the result from Yang et al., 2012 and the result in this paper, both from the same lab, already contradict each other. Here is a striking example: in the present study, the authors show that with a high concentration (1 mM) of Ca2+, when [NaCl]i is changed from 150 mM to 15 mM, the reversal potentials (in both Q559K and wild-type TMEM16F) shift from ~ 0 mV to ~ -15 mV (Figure 1). In Yang et al., 2012, a similar 10-fold change of [NaCl]i in the presence of 0.5 mM Ca2+ generated a right shift of the reversal potential to ~+20 mV (Figure 6D and 6G in Yang et al., 2012). Both experiments are excised inside-out patch recordings, and the solutions are similar (150 mM/15 mM vs 140 mM/14 mM). The [Ca2+]i in Yang et al. was 0.5 mM, which should be closer to 1 mM Ca2+ than to 15 µM Ca2+. Why did the authors obtain a left shift of the reversal potential while in Yang et al., 2012, the reversal potential shifted to the right?
We thank the reviewer for the scrutiny. Actually, this question has already been answered in this manuscript: membrane potential matters. In the Yang et al. paper18, "A voltage ramp from −80 to +100 mV with a rate (dV/dt) = 0.36 V/s was used to determine the reversal potentials for the wild-type mTMEM16A and mTMEM16F channels" – this is a slow depolarizing ramp. By contrast, in the current manuscript, "The traces were recorded with a hyperpolarizing ramp from +80 mV to -80 mV (-1 V/s) following holding at +80 mV" – a fast reverse ramp. The protocol used in our manuscript reflects the channel permeability when it is at a more depolarized membrane potential. Inspired by review 2, we will add one experiment to show that TMEM16F can briefly "memorize" the ion selectivity . Also, please note that in Figure 6, in hundreds of μM Ca2+, the “conditioning membrane potential” impacts significantly on the measurements of reversal potential.
Given that TMEM16F (and most of the mutants) is outwardly rectifying, in the experiments shown in this manuscript, we mostly performed reversal ramps to obtain "more-opened" current and minimize the contamination by endogenous current. Due to the different experiment protocols used in the two studies, it is understandable that the measurements are different.
Two technical issues in both the current study and Yang et al., 2012, are not seriously dealt with.
The first serious technical problem is the junction potential correction. Throughout the whole paper of Yang et al., 2012, there was no description of junction potential correction. In the present study, the authors mention that "the liquid junction potentials for 15 mM NaCl, (and) 45 mM NaCl were -1.7 mV and -1.0 mV respectively.……". I suppose that the authors calculated these values with respect to the 150 mM NaCl solution. If so, these values are severely under-estimated. In fact, using the same calculator (Clamplex), the value of liquid junction potential for 15 mM NaCl (with respect to 150 mM NaCl) is -11 mV (I confirm this value by actually measuring the liquid junction potential between 15 mM NaCl and 150 mM NaCl solution). Since the data points in the figures (For example, Figure 1F and G) are not corrected for the junction potential, the reversal potential of ~ -15 mV in 1 mM Ca2+ (see Figure 1G) should only be ~ -4 mV (with a 10-fold NaCl gradient). The reversal potential shift in Q559K in 15 µM Ca2+ in the paper is ~ +10 mV (Figure 1G). After junction potential correction, this should be ~+20 mV.
The reviewer might have neglected that we formed membrane seal in 150 mM NaCl-based solutions and used a 3 M KCl agar bridge as a reference electrode (so-called "salt bridge”) in both papers. The reviewer might have obtained the result (-11 mV) with the following parameters:
With our experimental protocol including forming giga-ohm seal in 150 mM NaCl and using a salt bridge during solution exchange, the correct setting should be:
This significantly reduces the liquid junction potential. With this setup involving a salt bridge, it is acceptable for Yang et al. not to correct it18.
The second and even more problematic issue is a lack of background current subtraction. Throughout the whole manuscript (and also in Yang et al., 2012), I do not see a description of background current subtraction for the presented I-V curves (and thus the measured reversal potentials). In the absence of TMEM16F conductance, the HEK293 cells have a cation-selective endogenous conductance. The authors actually show this fact from the background current measurement where the reversal potentials under 150 mM/15 mM NaCl condition were ~+20 mV (in 1 mM Ca2+) and ~ +60 mV (in 15 µM Ca2+) (see B and C in Figure 1—figure supplement 1). The conductance of the untransfected cell patches includes the leak conductance and the conductance from the endogenous channels/transporters. If we sum the two as the background conductance (abbreviated as gb), and the conductance from TMEM16F (the channel conductance) is denoted as gc, the measured reversal potential (Erev) should be a weighted sum of the reversal potential of gc (abbreviated as Ec) and that of gb (abbreviated as Eb) according to the following equation:
Erev= [gc/(gc+gb)] × Ec + [gb/(gc+gb)] × Eb
This equation, derived from the chord conductance equation, assumes that the conductance (gc and gb) is constant at all voltages, which is not always applicable here. Nonetheless, the double mutant, Q559K_G615A, with reduced outward rectification (Author response image 1), is close to this situation. Based on this equation, the measurement of the reversal potential in 15 µM Ca2+, which implicates higher Na+permeability, is not affected as much as the reversal potential in 1 mM Ca2+, which implicates higher Cl- permeability, whose real value should be even more “negative” (since the background current is cation-selective, Figure 1—figure supplement 3B,C). This is shown in Author response image 4 which is adapted from Figure 4C. Thus, our conclusion that there is a shift in Erev is upheld.
But nonetheless, we agree that it is necessary to reduce the contamination by gb, which we were very careful with. We also agree that currents with strong outward rectification are more susceptible to background contamination – we have explained how we performed "quality control" in the "response to all reviewers", and we will reinstate these points in the following response.
Reducing [NaCl] or Ca2+ will reduce the TMEM16F conductance (gc), and therefore, Erev will approach Eb (which is +20 mV or +60 mV). When the gc is much larger than gb (this is the case when TMEM16F is activated by 1 mM Ca2+), the contribution of gb to the measured Erev is less significant (as shown in Figure 1—figure supplement 1A, blue and grey curve). However, when gc is small relative to gb, the measured Erev will be severely contaminated by Eb. The example is no better than the one provided by the authors in Figure 6, where when the holding voltage is more positive (the TMEM16F conductance is larger because of its outward rectification property), the reversal potential is less positive (less contaminated by Eb). This phenomenon is consistent with all the results throughout the paper. Various manipulations in the paper (including several mutations or even experiments in TMEM16A) would not change this trend-the larger the gc, the less positive the measured Erev.
We respectfully disagree with the statement that "Reducing [NaCl] or Ca2+ will reduce the TMEM16F conductance (gc)". Please note that Q559K current activated by 15 µM Ca2+ and by 1 mM Ca2+ are similar in magnitude (Figure 1B, D). Although exposure to >30 µM Ca2+ leads to current desensitization due to loss of PIP2, (Figure 1B, Also Ref13) this is not an issue since we performed all the experiments in 15 µM Ca2+ before patch exposure to high Ca2+ in experiments throughout the whole manuscript (We formed the excised patch in 0 Ca2+ and carefully prevented the patch from exposure to Ca2+ > 20 µM13). The reviewer might have misinterpreted Figure 1F: the current activated by 15 µM Ca2+ in 15 mM NaCl at +80 mV “looks” small, but that is because the driving force of cation efflux is smaller (Ohm’s law: current is proportional to the product of driving force and conductance), while there is no evidence showing that the conductance is small. In 1 mM Ca2+, the current at +80 mV is not reduced simply because now the outward current is mainly carried by Cl- influx. This does not disprove our hypothesis, but instead, is consistent with our conclusion.
The reviewer uses Figure 6 (Figure 7 in the revised manuscript) as an example. Figure 6D (now Figure 7A) shows that holding at different conditioning voltages changes the reversal potential recorded with the hyperpolarizing ramp protocol. The traces were obtained from the same patch, so the contaminating gc is universal for the four traces. In whatever way the hypothetical background current is drawn, the shift of Erev is legitimate (shown in Author response image 5).
Without subtracting the background current obtained in the absence of Ca2+, how large the total current should be so that the measured Erev is good enough to reflect the true TMEM16F reversal potential (Ec)? The equation above indicates that gc needs to be larger than 90% of the total conductance (gc + gb) in order to have a measurement where <10% of Eb (namely +2 mV to +6 mV, according to the measured Eb) is added to the measured reversal potential.
We thank the reviewer for the friendly reminder. We have explained our detailed methods in the “responses to all reviewers” that we made sure gb is <10% as the reviewer points out. Nonetheless, performing background correction will expand the range of “Erev shift”. This can be illustrated in the Author response images 4 and 5.
The authors show that the background current from untransfected cell patches at +80 mV is 50-80 pA (Figure 1—figure supplement 1B and C). If the total current at +80 mV is 500 pA (0.5 nA) in the solution with 15 µM Ca2+ and 15 mM NaCl, as in many of the authors' recording traces, the conductance of TMEM16F at +80 mV is ~ 9-10 fold that of the background current. However, since WT TMEM16F and Q559K mutant are outwardly rectifying, their conductances are quickly reduced by several fold near the reversal potential (the outward rectification is even more severe in low NaCl and low Ca2+ condition). Therefore, the 9-10 fold gc/gb ratio at +80 mV may reduce to 2-3 near Ec (gb is constant at different voltages). Suppose the true value of Ec is 0 mV in the 150 mM/15 mM NaCl condition (namely, PNa/PCl =1), and the value of Eb is +60 mV (as shown in the supplementary figure), a gc/gb ratio of 2-3 will give a measured reversal potential of +20 mV – +30 mV. If the total current at +80 mV is less than 0.5 nA, the situation will be even worse. Interestingly, the reversal potentials measured in 150 mM/15 mM NaCl condition in many experiments in this manuscript are in this range.
We thank the reviewers for pointing this out. We explained our detailed methods in responses to all reviewers, but we would like to summarize here:
· We included the recordings with Ca2+-activated current > 1000 pA, which practically were ~ 2000 pA (Figure 1—figure supplement 2), 20 fold the size of the background current (<100 pA) (Figure 1—figure supplement 2A, D, G, J). The "0.5 nA" mentioned by the reviewer might refer to the current in 15 mM NaCl (blue traces in Figure 1—figure supplement 2B, E, H, K), which might actually reflect a reduction of driving force for cation efflux, rather than a reduction of conductance.
· We did take rectification into consideration and this consideration did not change the conclusion. We made sure the tail current recorded at + 80 mV after completion of the reversal ramp is still ~5 fold of the background current (Figure 1—figure supplement 2C, I, L). Also for this reason, we did not analyze WT current activated by 1 mM Ca2+ (Figure 1—figure supplement 2F).
· In some of the recordings (such as Figure 1—figure supplement 2B), the current in 15 mM NaCl 15 µM Ca2+ at 0 mV is ~-200 pA, and it would not have been eliminated by background subtraction.
· Q559K_G615A circumvents the concern of outward rectification.
The above example therefore emphasizes the importance of subtracting the background current in order to evaluate EC more precisely. However, I am only using the data provided by the authors to make the above estimate. Since the background currents vary from patch to patch, the easy way to minimize the contribution of the background conductance is to subtract the current obtained in the absence of Ca2+ from current obtained in the presence of Ca2+. By doing background current subtraction, the authors would eliminate the shift in Erev caused by the background conductance and thus isolate the shift in Erev caused by Ca2+.
We thank the reviewer for this suggestion. We did think about using background subtraction but did not eventually perform it, because it will bring about new issues. The reviewer suggests we should look at the Ca2+-activated component. But this is based on the assumption that Ca2+ does not have effects on background current, which is NOT the case. Judging from Figure 1—figure supplement 3, we noticed that there is a cation selective current endogenous to HEK cells, and this current is smaller in 1 mM Ca2+, suggesting that Ca2+ "blocks" the background cation current. We have observed this result frequently when we recorded from untransfected cells (See Author response image 6).
Performing background subtraction will "over-subtract" a cation component (~40 pA) in 1 mM Ca2+, making the 1-mM-Ca2+-evoked current appear "more anion-selective". On the other hand, traces recorded from the same patch have the same background current, but the shift was legitimate (shown in Author response image 5). Thus, we chose to take a more cautious and conservative action: NOT to perform background subtraction. Our Figure 1_figure supplement 3F shows the extrapolation to illustrate that background subtraction sometimes can be problematic.
It is interesting that similar background current contamination of the reversal potential measurement is also shown in TMEM16A and its K584Q mutant in this manuscript (Figure 6—figure supplement 1). However, it appears that the authors have not noticed this problem. Taking K584Q recordings as an example (see Figure 6—figure supplement 1), the K584Q conductance is bigger in 1 mM Ca2+ than in 0.4 µM Ca2+. Therefore, the reversal potential is more shifted to the right in 0.4 µM Ca2+. Here, the measured reversal potentials (10 fold NaCl gradient) of K584Q in 0.4 µM and 1 mM Ca2+ are both far from the perfect Cl- Nernst potential. It has already been shown (see Supplementary figure 2 in Jeng et al., 2016) that after background current subtraction, the K584Q mutant, like the wild-type TMEM16A, is perfectly Cl- selective in 20 µM Ca2+. In other words, based on the measured reversal potentials, K584Q in 20 µM Ca2+ in Jeng et al., 2016, is more Cl- selective than the K584Q current activated by 1 mM Ca2+ shown in this paper. The key difference between the two studies is the background current subtraction.
We thank the reviewer for this comment. The data regarding whether TMEM16A is strictly or moderately selective for Cl- over Na+ also has discrepancy among different groups, and several groups report that TMEM16A is moderately selective for Cl- over Na+, not perfectly meeting the Cl- Nernst potential11,19. In our recording of WT TMEM16A activated by 1 µM Ca2+ or in 1 mM Ca2+, the reversal potential is only shifted by ~15 mV in 45 mM NaCl (PNa/PCl ~ 0.2, osmolarity balanced with mannitol), different from the value reported by Jeng et al. (by ~30 mV). TMEM16A in 1 mM Ca2+ is linear and 60 times bigger than endogenous current, so background current subtraction will not account for the discrepancy. Jeng et al. had a very insightful discussion in their JGP paper:
· We suspect that differences in experimental methods, for example, using NMDG-SO4 versus sucrose to replace intracellular NaCl (Jeng et al., Lim et al), and/or analyses (such as subtraction of the endogenous leak current; Figure S2) may explain the discrepancy.
Given the above example, it is more likely that the "key difference" is "using NMDG-SO4 versus sucrose to replace intracellular NaCl". Notice that it is consistent with the idea conveyed in this manuscript: the intracellular ionic strength matters. NMDG might be still able to enter the electric field even though it cannot go through the channel, and it could account for the high anion permeability as recorded by Jeng et al.
For K584Q, although the current is small, it is nonetheless >10 times bigger than the background current. Since Ca2+ inhibits the cation-selective current endogenous to HEK cells (Figure 1—figure supplement 1B, C and previous paragraphs), background subtraction might cause new issues: The minor cation permeation (<1/10) might have been interpreted as background (which is already inhibited by Ca2+), and thus the corrected PNa/PCl will be smaller than the actual value. "The key difference between the two studies" (our study and Jeng et al) is in fact more than "background current subtraction". These discrepancies can be attributed to:
· Ca2+ concentration. The lowest Ca2+ concentration in Jeng et al. is 20 µM, while we tested 300 nM Ca2+. Note that 400 nM intracellular Ca2+ is a critical point where most TMEM16A channels are bound to 1 Ca2+ ion11, while in 20 µM Ca2+, TMEM16A binds to 2 Ca2+ ions. The electrostatic field along the TMEM16A permeation pathway is significantly different between the one-Ca2+-bound state and two-Ca2+-bound state10. Thus, in the experiments by Jeng et al., the permeation pathway might have been strongly influenced by the positive charges from two Ca2+ ions (they used 20 µM), overriding the effect of the mutation.
· Experimental details. Our unpublished data suggest that TMEM16A K584Q quickly runs down in 1 mM Ca2+, a feature mirroring the slower rundown of TMEM16F Q559K. The mechanism and consequence of rundown have not been studied. Thus, before we figure these out, we were careful about the experimental conditions such as forming the excised patch in 0 Ca2+ toprevent PIP2 degradation catalyzed by exposure to >20 µM Ca2+. Our methodology might "protect" some phenotypes that require PIP2. We infer that Chen lab did not make sure that the measurement of Erev was performed without any prior exposure of the patch to >20 µM Ca2+ (a condition where PIP2 starts to degrade), judging from a recent paper by Chen lab using 900 µM Ca2+ as a reference condition to measure TMEM16F gating and ion selectivity9. It is thus not surprising that they got results different from our results and from a recently deposited preprint12.
With these technical flaws, the reported reversal potentials in this manuscript are simply not correct. I am not sure if the authors have measured background I-V curve in every recorded patch. If not, I do not think the problem can be corrected within a short time. If these two technical problems are corrected, I anticipate that conclusion of the paper is probably not going to hold.
We have demonstrated that we had thought about the two technical issues raised by reviewer 3 as we performed experiments. We reduced the liquid junction potential by using a 3 M KCl salt bridge. We have provided experimental details and performed extrapolation to prove that our conclusion is valid regardless of background subtraction, and we also provide recordings of the background current in the presence or absence of Ca2+ to illustrate the point that background subtraction might in fact bring about new issues.
[Editors' note: below is the authors’ response to the decision letter following their appeal.]
The editors and reviewers have read and discussed your rebuttal. It is important to point out that our initial concerns remain, and we are not convinced that your plan for revision will satisfy those concerns. However, we are willing to reconsider a revised manuscript after you have had a chance to do the additional experiments.
Overall revisions:
We have performed extensive experiments and added the following figures to our manuscript:
Figure 2: TMEM16F wild type and Q559K ion permeability ratios measured in 6 µM and 15 µM Ca2+, with background (recorded in Ca2+-free 15 mM NaCl solution) subtraction.
Figure 3: TMEM16F Q559K ion permeability ratios during current rundown/desensitization in 36 µM Ca2+, with background (recorded in Ca2+-free 15 mM NaCl solution) subtraction.
Revised Figure 1—figure supplement 4: TMEM16F Q559W ion permeability ratios in 15 µM and 1 mM Ca2+, with background (recorded in Ca2+-free 15 mM NaCl solution) subtraction.
Revised Figure 5: TMEM16F wild type ion permeability ratios in 10 µM and 1 mM Gd3+.
Figure 6—figure supplement 1: TMEM16F wild type and Q559K recorded in 15 mM NaCl balanced with NMDG-MES or NMDG2-SO4.
Figure 6—figure supplement 2: TMEM16F wild type recorded with 15 mM NaCl in the pipette solution and 150 mM NaCl in the bath.
We have also added Figure 1—figure supplement 2, Figure 1—figure supplement 3, Figure 4—figure supplement 2 to illustrate the experimental details and how we performed "quality control". All the results support the notion that TMEM16F permeability to Cl- increases when intracellular Ca2+ is elevated. We hope these additional experiments and explanations will clear the concerns regarding technical issues.
Inspired by the editors, reviewer 1 and reviewer 2, we have performed experiments (now shown in Figure 7 F~H, Figure 8—figure supplement 1), renamed our mechanism as a “dual-gating model” for the purpose of a comparison with that of TMEM16A. We did not draw a definite conclusion from these experiments, but we hope these results will trigger discussions and new ideas among readers after the paper is published.
We also took the editors’ suggestion to reduce the discussion of physiological implication and focus more on the characterization of channel biophysical properties in the text. In the revised manuscript, we briefly discussed the physiological implication of the ion selectivity shifting in the discussion. As was mentioned in our correspondence with editors regarding the case of BK channel, we believed that a clear understanding of the channel biophysical properties will prompt the elucidation of important physiological functions of the channel. Thus, we wish these results (including the main results of ion permeability shifting in response to Ca2+ and voltage, and the addition experiments about channel activation by Zn2+ and Gd3+, the function of TM6 in gating) would be available to researchers working on TMEM16 and other channels with structural similarities (such as TMC and OSCA).
The following are several points that you should consider in preparing the revised manuscript.
1) We remain concerned that leak currents could contribute in a non-linear fashion to the observed shifts in Vrev. The data provided in your rebuttal does not address this issue, as in different ionic concentrations the shape and Vrevof the leak will change. We suggest that you bracket each IV measurement in any solution containing calcium with measurements of the background IV (i.e. 0µM Ca2+) in solutions with identical NaCl concentration so that the voltage dependence of the total and leak currents can be directly compared. We understand that there is no perfect way to identify and subtract leak currents for TMEM16F, but by showing raw and leak corrected data it will be possible to estimate the total and leak conductances at the reversal potential and thereby gauge the accuracy and reliability of the Vrevcalculations. Since this does not appear to have been done in your initial experiments, we would request that they show a set of experiments between the extremes of low and high current density where you do these experiments, perhaps using a couple of different constructs.
We thank the editors for this practical requirement. We adopted the suggested experimental procedures when we performed new experiments for WT and Q559K (in 6 µM, 15 µM, 36 µM and 1 mM Ca2+, Figure 2 and 3) and for the new construct, Q559W (Figure 1—figure supplement 4). We also applied this strategy to our experiments where 15 mM NaCl was balanced with salts (NMDG-MES and NMDG2-SO4) instead of mannitol (Figure 6—figure supplement 1). We would like to thank the editors for this suggestion, which enabled us to further firm up the conclusions drawn from Figure 3, in which for each patch all the currents recorded in 36 µM Ca2+ crossed with the background current at the same point, suggesting Erev did not shift with rundown or rectification state.
2) As you point out, the current in your experiments is typically quite high, in the range of 1-8 nA when activated with calcium at +80mV. Although increasing current density diminishes the contribution of leak currents, currents of this magnitude will cause substantial voltage errors due to series resistance and will also alter ion concentrations (via ion depletion and accumulation). The plots of the current magnitude vs Vrevshift in Author Response Image 1D of your rebuttal only partially addresses this concern since the conductance of TMEM16F is nonlinear and you have not reported the TMEM16F and leak conductances at the reversal potential. Furthermore, the data in Author Response Image 1D shows that there is a ~2-fold variability in the Vrevmeasurements (between ~15 and ~35 mV), in a similar range to the changes in Vrevthat lead you to conclude that the ion selectivity of TMEM16F changes. We are not certain how best to resolve this issue, but we suggest that it might be helpful to provide Vrevmeasurements as outlined above for both low and high calcium and to extend the range shown in Figure 1D to somewhat lower current density, in the range of 500 pA. While these might be affected more by background leak currents, they might also serve to validate the conclusions by providing an empirical calibration of the role of the leaks and other errors.
We thank the editors for the suggestion. The current magnitude of Q559W happened to be around ~500 pA, which we thus utilized to perform the measurement as requested. Regardless of background subtraction, the shift was legitimate (Figure 1—figure supplement 4). Please note that the current in 15 µM Ca2+ after background subtraction reversed at a more positive potential than current in 1 mM Ca2+ without background subtraction, confirming that the permeability ratio transition should be reliable. But there are variations across different samples even for the same batch of cells, recorded on the same day. Thus, "for each experiment in the following study, we performed paired-comparison within the same patch to avoid ambiguities arising from large variations across different recordings."
3) We suggest that you rephrase how you describe the ion selectivity of TMEM16F. Assuming a clear shift in Vrevcan be unambiguously demonstrated, it would be more appropriate to refer to the protein as a poor ion selective channel that slightly changes its ionic preference (rather than a sodium selective channel that becomes chloride selective).
We have rephrased the statements as suggested. We now used "change of permeability ratio" in most parts of data interpretation. We only use "ion selectivity" when we generally describe channel biophysics.
4) We think the potential physiological effects of the ion selectivity changes you report are overstated. You argue that the effects might induce a ~13 mV change in the resting potential of a cell where TMEM16F is the main conductance. However, we are unaware of conditions where a cell would be exposed to millimolar intracellular calcium and sustained large depolarizations. Moreover, the presence of other currents would significantly diminish the impact of small changes in the selectivity of TMEM16F, especially since in the -80 to +50 mV range (where the cell membrane potential is likely to be), TMEM16F has a very low Po (i.e. Figure 1—figure supplement 2D). Therefore, the physiological effects on a cell's membrane voltage -if any- will be considerably smaller than ~13 mV. We request that the physiological relevance should be removed from the Abstract and significantly toned down in the Discussion. The focus of the manuscript should be on the biophysical mechanism underlying the small shift in selectivity.
We thank the editors for the insight and have revised our manuscript as requested. Now the main text is focused on the biophysical mechanism, while the physiological implication was only briefly discussed at the end.
5) We suggest that you add a discussion about the origin of the discrepancy of the ion selectivity of TMEM16A and TMEM16F.
We thank the editors for the suggestion. We have added the discussion of the comparison between TMEM16A and TMEM16F, including but not limited to the aspect of ion selectivity.
Reviewer #1:
[…] 1) TMEM16F is a scramblase, as such its main function is lipid transport to externalize PS to initiate blood coagulation and recognition of apoptotic cells by macrophages. The physiological relevance of TMEM16F-mediated ionic currents is -at the moment- unclear. Further, activation of TMEM16F currents require sustained depolarizations and high Ca2+ concentrations, while lipid scrambling requires only elevation of Ca2+, but not depolarization. Thus, it is not clear under what physiological conditions the self-braking mechanism enabled by the dynamic switch in selectivity might play a role. For example, does the membrane potential of platelets and/or apoptotic cells reach and maintain the depolarizations necessary for channel activation? Furthermore, the magnitude of the observed switch is relatively modest; in all conditions the channel is poorly selective between anions and cations, displaying only modest preferences for one over the other. In no cases do the currents approach ideal anion vs cation selectivity. Given the overall poor selectivity, I wonder how much of an effect would be caused by the observed switch in selectivity. Thus, while the phenomenon described here is biophysically interesting, I am not convinced of its physiological relevance. Some quantitation of the effects observed here within the context of a cell would be needed to establish a clear link to physiology.
We thank the reviewer for raising the question regarding the physiological relevance of our work. It is true that previous studies regarding TMEM16F functions are mostly focused on its function in phospholipid scrambling and vesiculation. But one possible reason that hampers the study of its ion channel functions is the ambiguity of its ion selectivity; the conflicting results might have prevented us from understanding the channel functions thoroughly. Thus, our characterization of its biophysical properties might help unravel the physiological significance involving channel function of TMEM16F. We have included a brief discussion in this regard in the manuscript.
2) It is not clear through what type of pore ions move in TMEM16F. It has been proposed that the TMEM16 scramblases form a lipid-lined pore through which ions can diffuse together with the lipids that are being scrambled (Whitlock and Hartzell, 2016; Jiang et al., 2017). If this were the case, then the selectivity of the channel would be affected by multiple factors such as lipid headgroups, voltage and mono- and di-valent ions. On the other hand, the TMEM16A homologue forms a more conventional, protein-delimited, pore. In this case, the observed changes in selectivity could reflect either a charge-screening effect (as the authors propose) or the ability of the channel's pore to adopt slightly different conformations. Further, most of the measurements are carried out using a mutant, Q559K, that affects both selectivity and gating of TMEM16F. I understand that the mutant was used because of the removal of run-down. It is unclear whether this construct can serve as a good model for the WT pore. The mutation could case subtle rearrangements in the pore rendering it more sensitive to environmental changes. While the present experiments provide evidence suggesting that the selectivity of TMEM16F changes, they shed little light into the mechanisms underlying such a switch.
We thank the reviewer for the question concerning the structural basis of TMEM16F and the representativeness of the Q559K mutant.
In the revised manuscript, we added a few experiments to show that the shift of permeability ratio also happens to wild-type TMEM16F, including: (1) Using Gd3+ to activate TMEM16F for reversal potential measurements. Gd3+, a trivalent ion, increases Cl- accessibility to the permeation pathway likely due to its stronger influence of the electrostatic field, so that wild-type TMEM16F in 1 mM Gd3+ maintains conductivity to Cl- at low membrane potentials. (2) Alternating the pipette solution (equivalent to extracellular solution) and the bath (intracellular solution) so that in 1 mM Ca2+ the current reversed at a positive membrane potential. In addition, we confirmed that the critical phenotypes as found in Q559K mutant channel could all be recapitulated in WT, including the shift of Erev in accordance to ionic strength (Figure 6A), to voltage (Figure7D), and "transiently" to Ca2+ level (Figure 1—figure supplement 4). A recently published paper has also proposed using Q559 mutants to study the ionic transportation mechanism of TMEM16F9.
To consider whether the lipid headgroups affect the ion selectivity, we performed an additional experiment as in Figure3, showing that PIP2 does not play a significant role. TMEM16F current activated by Gd3+ - an ion that has not been reported to trigger scrambling – also shows a shifting permeability ratio. In addition, cells heterologously expressing Q559K proteins do not display scrambling activities8, although purified Q559K shows scrambling activities in liposomes2. Taken together, we believe the shifting of permeability ratio is independent of scrambling. However, we could not exclude the possibility that there could be "slightly different conformations" on top of the “charge screening effect”, so we rephrased our statement as "although it remains possible that TMEM16F might undergo miniscule conformational change at different Ca2+ concentrations that contributes to the selectivity transition". In fact, our discussion regarding the relationship between ion selectivity and scrambling function also includes this point.
3) A technical concern I have is that the measured currents are relatively large (~1 nA) and the stimulation protocols used are long. Can the authors rule out that the effects they see are due to ion accumulation/depletion effects? The currents in 15 μm Ca2+ are naturally smaller than those in 1 mM Ca2+, and therefore these effects are less pronounced leading to the observed differences. Did the authors use different directs of the ramp and/or tail current protocols to measure reversal potentials? Is there an effect on the direction of the ion switch (i.e. going from 150 NaCl to 15 NaCl is the same as going from 15 NaCl to 150 NaCl)? Do they observe a dependence of the magnitude of the effects as a function of the current in the patch?
We thank the reviewer for the helpful suggestion. The effects we observe are unlikely due to ion accumulation/depletion. We used a hyperpolarizing ramp following holing the membrane potential at +80 mV (See Figure 1—figure supplement 2). This will cause Na+ efflux and/or Cl- influx, supposedly leading to Na+ accumulation on the extracellular side of the channel and Cl- accumulation on the intracellular side (or intracellular Na+ depletion and extracellular Cl- depletion). All of these should push ENa and ECl to “more positive” values, leading to a positive shift of Erev. This is opposite to the shift we observed between 15 µM and 1 mM Ca2+,where the Erev in 1 mM Ca2+ is more negative. Also, In Figure 6D, a more depolarized holding potential should exacerbate the accumulation/depletion effect (if there is any), also pushing Erev to more positive values. The data show the opposite.
We thank the reviewer for the helpful suggestion. We have answered this question in our responses to all reviewers: the effects we observe are unlikely due to ion accumulation/depletion, which actually can result in an opposite shift from what has been observed in our study.
We did not use a different protocol because we predict the measured values will surely be different due to our hypothesis that membrane potential will drive ion movement into/away from the electric field. There is no correlation between Erev with current magnitude (Figure 1—figure supplement 2D, J).
4) Subsection “Q559K channel ion selectivity varies with intracellular Ca2+ concentration”. The reversal potential of the QK/EQ mutant suggest this mutant is less Cl- selective than the QK mutant alone. Thus, at an intermediate Po the selectivity is also intermediate. This is more consistent with a model where the pore can adopt multiple open states with different selectivity. What happens to the currents of the QK mutant alone (or WT) when measured at a Po~0.5? I do not think that the authors' conclusion that "This indicates either that TMEM16F ion selectivity is not correlated with its open state, or that the E667Q mutation circumvents the intermediate open state (if any) and causes the mutant channel to directly enter a fully-open conformation" is warranted by the data.
We thank the reviewer for making this point. We measured the Erev values of WT TMEM16F and Q559K in 6 µM Ca2+ (a condition where Po is smaller than 0.5) and they were more positive than those in 15 µM Ca2+ respectively (revised Figure 2). What we intended to express is: If the transition to being more permeable to Cl- (versus Na+) reflects different activation states, the "half-activation" mutant (Q559K_E667Q) should have more "positive" Erev (than Q559K in 15 µM Ca2+, the latter in a "more fully" open state) - which is not the case. We have revised the text to clarify the point. The "less negative shift" of Q559K_E667Q compared to Q559K can be attributed to the "cross talk" of the electrostatic field resulting from Ca2+-binding to the binding pocket and ion entry into the permeation pathway, to which a similar result has been shown in a recent paper for TMEM16A.10
5) Subsection “The switch of ion selectivity correlates with electrostatic change in permeating pathway”. If the shift in Vrev depends on divalent ions (Ca2+, Zn2+) then the shift should depend in a graded manner on their concentration. Did the authors test what happens when using intermediate increases between the 15 and 1000 μm concentrations shown?
We thank the reviewer for this question. We revised Figure 2 and added a new Figure 3 to show there is a "dose-dependent" shift.
6) Are divalent anions inert? Since the channel is permeable to anions under all conditions (even when it is in its "cation selective" state, its selectivity is modest), these ions can enter the pore and therefore should have the opposite effect of the divalent cations.
This is a very interesting question. As part of the new experiments included in the revised manuscript, we compared NMDG-MES and NMDG-SO4, which did not show different impact, likely reflecting their inaccessibility to the permeation pathway.
7) The inactivation in Figure 4A is slow (tau~30s – 1 min). Why weren't the reversal potentials measured after reaching activation but before inactivation sets in? Is inactivation dependent on voltage? If the patches are held at a membrane voltage closer to reversal is there a similar effect?
We thank the reviewer for the insight. Although the rundown of TMEM16F WT current magnitude in 1 mM Ca2+ is "slow", the change of its rectification is relatively fast (Figure 1—figure supplement 2, the trace in 45 mM NaCl was recorded ~5 s after solution change to 1 mM Ca2+). Combining these changes together, we cannot draw convincing conclusions from these data. But interestingly, we noticed that if the patch was exposed to 1 mM Ca2+ in 15 mM NaCl, the change of rectification was slower, enabling us to obtain data as shown in Figure 1—figure supplement 4. We speculate that the inactivation indeed depends on the difference between voltage and Erev, and more specifically, the amount of permeating cation.
8) I find the effects of Zn2+ confusing where they regard the rapid run-down that is PIP2 independent. Are there multiple run-down mechanisms?
We thank the reviewer for mentioning this point. From Figure 5—figure supplement 1, the Zn2+-induced rundown was reversed in ~1 minute. We thus believe Zn2+-induced rundown was not caused by degradation of PIP2, which is irreversible, although we are not sure whether Zn2+ can shield the charges of PIP2 headgroups in a reversible manner. We have added this statement in the manuscript.
9) Discussion section. The authors state "However, TMEM16F does not have an "Ohmic" state: the channel always requires depolarization to be activated." What does this mean? That the pore is intrinsically rectifying? Ohmic state would refer to conductance, not gating.
We apologize for the confusing statement. We intended to express that TMEM16A conductance is Ohmic at high Ca2+ while TMEM16F is outward rectifying at all tested Ca2+ concentrations, which could be owing to the "intrinsically rectifying" (i.e. non-Ohmic) conductance and/or the voltage-dependent gating. The former is shown with an "instantaneous rectification index" 12, and our steady-state activation curve (Figure 1—figure supplement 1) shows the latter. We have re-written this part in the discussion.
Reviewer #2:
[…] 1) Experimental artifacts: To combat channel rundown and voltage-dependent activation, the authors have resorted to protocols with sizeable resting membrane currents and conductance, conditions that can easily lead to ion accumulation/depletion artifacts ("Calcium-calmodulin does not alter the anion permeability of the mouse TMEM16A calcium-activated chloride channel", JGP 2014 Jul; 144(1): 115-124.).
I am sure the authors have thought carefully about this issue and probably already have data to exclude this possibility. For example, since the channel undergoes desensitization, they should have recordings in which early ramps have a much larger conductance than later ramps recorded under identical conditions (e.g. [Ca2+], holding voltage). If the reversal potential for each condition is essentially independent of the holding current/conductance, ion accumulation/depletion artifacts are unlikely. Reporting key experimental details (e.g. complete protocol and order in which conditions/ramps were performed, leak subtraction protocol, series resistance compensation, composition of 15mM NaCl solution, control experiments to exclude effects of Ca2+, HEPES, EDTA permation, etc.) would help address these concerns.
We thank the reviewer for these helpful comments and his trust that we have thought carefully about the issues raised. We have taken the advice and explained our methods with more details in the revised manuscript. As we stated in our responses to all reviewers, the concern regarding the ion accumulation/depletion artifacts can be alleviated by the experimental protocols and controls implemented in this study so our conclusion is valid.
2) Proposed mechanisms for holding voltage changing ionic selectivity:
The authors seem to be proposing that Ca2+ (and perhaps also Na+) ions driven into the permeation pathway by the electric fields/driving force during the holding/activation voltage somehow modify permeation during the subsequent voltage ramp step. I have two concerns with this idea. Firstly, the authors have previously reported that TMEM16F is quite permeable to calcium. Larger depolarizations will drive more calcium out through the channel which could lower the calcium concentration on the intra-cellular side of the permeation pathway, rather than increasing it. Secondly, for the permeation pathway to act as a channel, ions must be able to enter and leave it on the microsecond timescale and thus one would expect rapid turnover of all permeating ions during the voltage ramp. For the channel to "remember" the holding voltage, it seems like voltage would either have to induce a conformational change or modulate the binding of ions to specific sites that turnover slowly enough to remain present during the subsequent ramp.
We thank the reviewer for the question. First, although the Ca2+ permeation may potentially reduce Ca2+ concentration at the intracellular interface of the pore, it is not fast enough to deplete Ca2+. This can be inferred from our data in a previous publication13: holding the excised patch at a more depolarized membrane potential increases Ca2+ sensitivity of TMEM16F. If local intracellular Ca2+ depletion took place at a faster rate than Ca2+ entry into the membrane electric field, greater depolarization would lead to an increase of the EC50 for Ca2+ activation, which is opposite to what we found in our previous study. We have added this sentence into our manuscript: "The reduction of EC50 of Ca2+ activation by depolarization is also observed in TMEM16F, although TMEM16F permeates Ca2+, suggesting Ca2+ efflux is not fast enough to deplete Ca2+ in the electric field at the intracellular side."
The second question concerns the structure basis for TMEM16F ion selectivity shift. The model proposed by the reviewer is based on a "conventional" channel selectivity filter exemplified by that in potassium channels, in which a few permeating ions "line up" and move along the pore. At this point we do not have a TMEM16F open-channel structure, but we might infer from the structure of TMEM16A and the possibly closed TMEM16F. Instead of a conventional selectivity filter similar to that in voltage-gated ion channels, the TMEM16 permeation pathway has amino acids that are critical for ion selectivity distributed along the pore; with a few relatively narrow constrictions, the permeation pathway has a wide vestibule10,14-16. This structural feature is compatible with the possibility that ions can enter the permeation pathway and remain as "resident at specific sites" without "leaving the pore", but still allow other permeating ions to move "beside them", reminiscent of schemes included in early editions of Bertil Hille’s book. We have considered this mechanism as an "electrostatic gating" mechanism instead of calling it a "selectivity filter", and we have added extensive discussion in the manuscript.
Reviewer #3:
[…] While resolving the controversy in the cation/anion selectivity of TMEM16F is important, the authors' conclusion that the controversy results from different recording conditions used in various labs (such as different holding voltages, ionic conditions, or Ca2+ concentrations used) is a little bit hand waiving. In the literature, the permeability difference in TMEM16F between Na+ and Cl- is not huge. Even accepting the results in this study as face value, the TMEM16F's PNa/PClratios range from 0.5 to 2 (Figure 5D). It is therefore strange that the authors would call such a several-fold difference of Na+/Cl- permeability as Na+ selective (or Cl- selective in the other way around). Even worse, the changes of the PNa/PClpermeability ratios reported here may actually be artefacts.
We have taken the editors’ suggestion to refer to the channel as being “more Na+(or Cl-) permeable” instead of “selective”, and to reduce the discussion of physiological implication. Since the expression and localization of the channel is not known, we could not assert that such a change in channel permeability is “not huge”. In a hypothetical cell with Cl- equilibrium potential of -60 mV and cation “equilibrium potential” (under the assumption that PK = PNa) of 0 mV, a shift of PNa/PCl from 0.5 to 2 can alter the membrane potential from -22 mV to -9 mV (assuming that this channel is the predominant local membrane conductance), big enough to regulate some signaling molecules. It has also been reported that TMEM16F is localized in primary cilia, a special cellular compartment with elevated Ca2+ level and greater depolarization, providing a condition for TMEM16F to function dynamically. We believe our research can help unravel more physiological functions of TMEM16F.
In the present study and the Yang et al. paper cited by the authors (Yang et al., 2012), there are at least two serious technical problems that could contribute to the controversy. In fact, the result from Yang et al., 2012 and the result in this paper, both from the same lab, already contradict each other. Here is a striking example: in the present study, the authors show that with a high concentration (1 mM) of Ca2+, when [NaCl]i is changed from 150 mM to 15 mM, the reversal potentials (in both Q559K and wild-type TMEM16F) shift from ~ 0 mV to ~ -15 mV (Figure 1). In Yang et al., 2012, a similar 10-fold change of [NaCl]i in the presence of 0.5 mM Ca2+ generated a right shift of the reversal potential to ~+20 mV (Figure 6D and 6G in Yang et al., 2012). Both experiments are excised inside-out patch recordings, and the solutions are similar (150 mM/15 mM vs 140 mM/14 mM). The [Ca2+]i in Yang et al. was 0.5 mM, which should be closer to 1 mM Ca2+ than to 15 µM Ca2+. Why did the authors obtain a left shift of the reversal potential while in Yang et al., 2012, the reversal potential shifted to the right?
We thank the reviewer for the scrutiny. Actually, this question has already been answered in this manuscript: membrane potential matters. In the Yang et al paper, "A voltage ramp from −80 to +100 mV with a rate (dV/dt) = 0.36 V/s was used to determine the reversal potentials for the wild-type mTMEM16A and mTMEM16F channels" - this is a slow depolarizing ramp. By contrast, in the current manuscript, "The traces were recorded with a hyperpolarizing ramp from +80 mV to -80 mV (-1 V/s) following holding at +80 mV" – a fast hyperpolarizing ramp. The protocol used in our manuscript reflects the channel permeability when it is at a more depolarized membrane potential. Inspired by reviewer 2, we now show in the revised Figure 7 that TMEM16F can briefly "memorize" the ion selectivity at the preceding holding potential.
Given that TMEM16F (and most of the mutants) is outwardly rectifying, in the experiments shown in this manuscript, we mostly performed hyperpolarizing ramps to obtain "more-opened" current to minimize the contamination by endogenous current. Due to the different experimental protocols used in the two studies, it is understandable that the measurements yielded different results.
Two technical issues in both the current study and Yang et al., 2012, are not seriously dealt with.
The first serious technical problem is the junction potential correction. Throughout the whole paper of Yang et al., 2012, there was no description of junction potential correction. In the present study, the authors mention that "the liquid junction potentials for 15 mM NaCl, (and) 45 mM NaCl were -1.7 mV and -1.0 mV respectively.……". I suppose that the authors calculated these values with respect to the 150 mM NaCl solution. If so, these values are severely under-estimated. In fact, using the same calculator (Clamplex), the value of liquid junction potential for 15 mM NaCl (with respect to 150 mM NaCl) is -11 mV (I confirm this value by actually measuring the liquid junction potential between 15 mM NaCl and 150 mM NaCl solution). Since the data points in the figures (For example, Figure 1F and G) are not corrected for the junction potential, the reversal potential of ~ -15 mV in 1 mM Ca2+ (see Figure 1G) should only be ~ -4 mV (with a 10-fold NaCl gradient). The reversal potential shift in Q559K in 15 µM Ca2+ in the paper is ~ +10 mV (Figure 1G). After junction potential correction, this should be ~+20 mV.
The reviewer might have neglected the fact that we formed the membrane seal with the patch electrode in 150 mM NaCl-based bath solutions and used a 3 M KCl agar bridge as a reference electrode (so-called "salt bridge”) in both papers. The reviewer might have obtained the liquid junction potential (-11 mV) with the following parameters:
The -11 mV actually reflects the offset of the commanding voltage for the liquid junction potential before sealing (rather than the liquid junction potential during solution exchange).
With our methods of forming giga-ohm seal in 150 mM NaCl and using a salt bridge at solution exchange, the correct setting should be:
This significantly reduces the liquid junction potential.
We have also included the experiments where the osmolarity of 15 mM NaCl solution was balanced with NMDG-MES and NMDG2-SO4 (Figure 6—figure supplement 1), where the liquid junction potentials are both smaller than 2 mV. Despite the potential complication resulting from NMDG permeation, the channel still displayed a shift in permeability ratio.
Last but not least, we respectfully point out that we do not agree with reviewer’s correction by “adding 10 mV to the measured value”, which coincidently is the method used in a recent paper9. Assuming that the authors of that paper did not use the salt bridge and that during the solution exchange there was an interface between the new and old baths, the “10 mV” should be subtracted from rather than added to the measured value (the situation comparable to the usage of a 150 mM NaCl reference electrode, picture below). If they had performed the correction correctly, they would have obtained the result showing that TMEM16F (recorded in 1 mM Ca2+) had reversed at a negative potential, corresponding to a channel more permeable to Cl-.
The second and even more problematic issue is a lack of background current subtraction. Throughout the whole manuscript (and also in Yang et al., 2012), I do not see a description of background current subtraction for the presented I-V curves (and thus the measured reversal potentials). In the absence of TMEM16F conductance, the HEK293 cells have a cation-selective endogenous conductance. The authors actually show this fact from the background current measurement where the reversal potentials under 150 mM/15 mM NaCl condition were ~+20 mV (in 1 mM Ca2+) and ~ +60 mV (in 15 µM Ca2+) (see B and C in Figure 1—figure supplement 1). The conductance of the untransfected cell patches includes the leak conductance and the conductance from the endogenous channels/transporters. If we sum the two as the background conductance (abbreviated as gb), and the conductance from TMEM16F (the channel conductance) is denoted as gc, the measured reversal potential (Erev) should be a weighted sum of the reversal potential of gc (abbreviated as Ec) and that of gb (abbreviated as Eb) according to the following equation:
Erev= [gc/(gc+gb)] × Ec + [gb/(gc+gb)] × Eb
We thank the reviewer for expressing the concern of background contamination with considerable length (starting from here). We have included the new data together with the background current (the current recorded in 0 Ca2+, 15 mM NaCl, see responses to all reviewers) recorded from the same patch in the revised manuscript. The shift of Erev could be observed regardless of background subtraction. We also have revised our manuscript with more detailed description about our methods of data acquisition and quality control. We believe our conclusion is now convincing given the additional controls and explanations. In the following parts, we will also list the supplementary points that we have addressed.
Reducing [NaCl] or Ca2+ will reduce the TMEM16F conductance (gc), and therefore, Erev will approach Eb (which is +20 mV or +60 mV). When the gc is much larger than gb (this is the case when TMEM16F is activated by 1 mM Ca2+), the contribution of gb to the measured Erev is less significant (as shown in Figure 1—figure supplement 1A, blue and grey curve). However, when gc is small relative to gb, the measured Erev will be severely contaminated by Eb. The example is no better than the one provided by the authors in Figure 6, where when the holding voltage is more positive (the TMEM16F conductance is larger because of its outward rectification property), the reversal potential is less positive (less contaminated by Eb). This phenomenon is consistent with all the results throughout the paper. Various manipulations in the paper (including several mutations or even experiments in TMEM16A) would not change this trend-the larger the gc, the less positive the measured Erev.
We respectfully disagree with the statement that "Reducing [NaCl] or Ca2+ will reduce the TMEM16F conductance (gc)". Please note that the Q559K currents activated by 15 µM Ca2+ or by 1 mM Ca2+ are similar in magnitude (Figure 1B, D). The reviewer might have misinterpreted Figure 1F: the current activated by 15 µM in 15 mM NaCl at +80 mV “looks” small, but that is because the driving force of cation efflux is smaller, while there is no evidence showing that the conductance is small. In 1 mM Ca2+, the current at +80 mV is not reduced because now the outward current is mainly carried by Cl- influx. This does not disprove our hypothesis, but instead, is consistent with our conclusion.
Without subtracting the background current obtained in the absence of Ca2+, how large the total current should be so that the measured Erev is good enough to reflect the true TMEM16F reversal potential (Ec)? The equation above indicates that gc needs to be larger than 90% of the total conductance (gc + gb) in order to have a measurement where <10% of Eb (namely +2 mV to +6 mV, according to the measured Eb) is added to the measured reversal potential.
The reviewer’s equation, derived from the chord conductance equation, should only be applied if the conductance is constant at all voltages. But nonetheless, we made sure that the data such as those in Figure1, for which we did not perform background correction, met the criteria that gc is 9 times larger than gb (Figure 1—figure supplement 2). We would also like to remind the reviewer that according to this equation, given that gb is a cation current, we can extrapolate that for a linear current (such as Q559K_G615A, Figure 4, or wild type activated in 1 mM Gd3+,Figure 5), performing background subtraction will expand the shifting range of the Erev when Ca2+ level changes.
The authors show that the background current from untransfected cell patches at +80 mV is 50-80 pA (Figure 1—figure supplement 1B and C). If the total current at +80 mV is 500 pA (0.5 nA) in the solution with 15 µM Ca2+ and 15 mM NaCl, as in many of the authors' recording traces, the conductance of TMEM16F at +80 mV is ~ 9-10 fold that of the background current. However, since WT TMEM16F and Q559K mutant are outwardly rectifying, their conductances are quickly reduced by several fold near the reversal potential (the outward rectification is even more severe in low NaCl and low Ca2+ condition). Therefore, the 9-10 fold gc/gb ratio at +80 mV may reduce to 2-3 near Ec (gb is constant at different voltages). Suppose the true value of Ec is 0 mV in the 150 mM/15 mM NaCl condition (namely, PNa/PCl =1), and the value of Eb is +60 mV (as shown in the supplementary figure), a gc/gb ratio of 2-3 will give a measured reversal potential of +20 mV – +30 mV. If the total current at +80 mV is less than 0.5 nA, the situation will be even worse. Interestingly, the reversal potentials measured in 150 mM/15 mM NaCl condition in many experiments in this manuscript are in this range.
Given that TMEM16F current is outwardly rectifying, the background contamination would cause a stronger deviation at a lower membrane potential. Thus, TMEM16F recorded in 1 mM Ca2+ would have reversed at an even more negative potential if the background current could be adequately removed, thus expanding the shifting magnitude (extrapolation, see Figure 1—figure supplement 3F). That was why we chose to “take a safer step by not performing background subtraction”. But nonetheless, for the new data included in the revised manuscript, we have demonstrated that our conclusion is upheld even with background subtraction.
The above example therefore emphasizes the importance of subtracting the background current in order to evaluate EC more precisely. However, I am only using the data provided by the authors to make the above estimate. Since the background currents vary from patch to patch, the easy way to minimize the contribution of the background conductance is to subtract the current obtained in the absence of Ca2+ from current obtained in the presence of Ca2+. By doing background current subtraction, the authors would eliminate the shift in Erev caused by the background conductance and thus isolate the shift in Erev caused by Ca2+.
We thank the reviewer for the suggestion. We have added the requested experiments with background subtraction into our revised manuscript. We also have discussed the disadvantage of background subtraction, namely expanding the shifting range in comparisons involving recordings in 1 mM Ca2+.
It is interesting that similar background current contamination of the reversal potential measurement is also shown in TMEM16A and its K584Q mutant in this manuscript (Figure 6—figure supplement 1). However, it appears that the authors have not noticed this problem. Taking K584Q recordings as an example (see Figure 6—figure supplement 1), the K584Q conductance is bigger in 1 mM Ca2+ than in 0.4 µM Ca2+. Therefore, the reversal potential is more shifted to the right in 0.4 µM Ca2+. Here, the measured reversal potentials (10 fold NaCl gradient) of K584Q in 0.4 µM and 1 mM Ca2+ are both far from the perfect Cl- Nernst potential. It has already been shown (see Supplementary figure 2 in Jeng et al., 2016) that after background current subtraction, the K584Q mutant, like the wild-type TMEM16A, is perfectly Cl- selective in 20 µM Ca2+. In other words, based on the measured reversal potentials, K584Q in 20 µM Ca2+ in Jeng et al., 2016, is more Cl- selective than the K584Q current activated by 1 mM Ca2+ shown in this paper. The key difference between the two studies is the background current subtraction.
We thank the reviewer for the security. We have performed extensive experiments (Figure 8—figure supplement 1) to show that Erev of TMEM16A recorded in low NaCl balanced with salts (NMDG-MES) is more negative than that in low NaCl with mannitol, with the former corresponding to a channel more selective for Cl- (versus Na+). This was also reported in a paper in the same issue as the one cited by the reviewer, where the authors reported that TMEM16A recorded in low NaCl balanced with NMDG2-SO4 is more selective for Cl- than that in low NaCl balanced with sucrose16. In other words, “the key difference” is the recording condition.
With these technical flaws, the reported reversal potentials in this manuscript are simply not correct. I am not sure if the authors have measured background I-V curve in every recorded patch. If not, I do not think the problem can be corrected within a short time. If these two technical problems are corrected, I anticipate that conclusion of the paper is probably not going to hold.
We have articulated why we initially did not perform background subtraction. We also included in the revised manuscript experiments with background subtraction, in which we demonstrated that the shift of Erev still holds. We would like to take the opportunity to friendly express our thoughts to reviewer 3: In scientific research, it happens that different groups might come out with distinct results, under which circumstances we should carefully compare the experimental details to figure out the inherent reasons. Simply distrusting and arbitrarily “anticipating” will not expand our knowledge and are thus not beneficial.
[Editors' note: further revisions were requested prior to acceptance, as described below.]
1) The term "electrostatic gate" seems out of place. The ordinary meaning of a "gate" is to control a flux in an all-or-none way. It is very odd to read a sentence like “…the "closed state" of the electrostatic gate allows the permeation of cations.”. Throughout the whole paper, there are no results showing that TMEM16F is only conducting cations or only conducting anions. It seems inappropriate to use the concept of "gate" to represent the control by a change of electrostatic potential. Controlling the cation versus anion selectivity by altering the pore potential (through charge residue mutations) is well documented in pentameric ligand-gated channels. The authors may want to reference those papers to strengthen the main conclusion in this paper.
We thank the reviewers for the critiques. We now have changed all those statements to "modulation/alteration of electrostatic fields" throughout the text. We also have followed the great suggestion to add the reference to other ion channels which have comparable machineries: "Controlling the selectivity between cations and anions by altering the pore potential, referred to as a charge-screening mechanism, is also documented in other ion channels, such as ligand-gated channels and bacterial porins, through charged residues lining the pore and/or through permeating ions within the pore".
2) Synergy of Ca2+ and Depolarization: The authors propose that depolarization indirectly modifies permeation by "driving Ca2+ into the membrane electric field" (p16). While the conceptual simplicity of this idea is appealing, the authors observe that depolarization still alters the relative permeability even at high (i.e. 1mM) calcium concentrations where the site of action for calcium should be saturated.
We thank the reviewer for the insight. We actually are not sure whether 1 mM Ca2+ "saturates" the relative permeability of Cl-. A comparison against the trace recorded in 1 mM Gd3+ (Figure 5E, wild type) may indicate that the relative Cl- permeability as in Figure 7E (Q559K) can be even higher, although it is technically hard to test it by further increasing Ca2+ concentration without introducing other ion species in the solution (the NaCl concentration should be maintained at ~15 mM). We now avoid using the word "saturated", and only make the point that the current is now more carried by Cl- than by Na+.
References
1 Yu, Y., Kuan, A. S. and Chen, T. Y. Calcium-calmodulin does not alter the anion permeability of the mouse TMEM16A calcium-activated chloride channel. J Gen Physiol 144, 115-124, doi:10.1085/jgp.201411179 (2014).
2 Sapar, M. L. et al. Phosphatidylserine Externalization Results from and Causes Neurite Degeneration in Drosophila. Cell Rep 24, 2273-2286, doi:10.1016/j.celrep.2018.07.095 (2018).
3 Forschbach, V. et al. Anoctamin 6 is localized in the primary cilium of renal tubular cells and is involved in apoptosis-dependent cyst lumen formation. Cell Death Dis 6, e1899, doi:10.1038/cddis.2015.273 (2015).
4 Henkel, B. et al. Co-expression of anoctamins in cilia of olfactory sensory neurons. Chem Senses 40, 73-87, doi:10.1093/chemse/bju061 (2015).
5 Delling, M., DeCaen, P. G., Doerner, J. F., Febvay, S. and Clapham, D. E. Primary cilia are specialized calcium signalling organelles. Nature 504, 311-314, doi:10.1038/nature12833 (2013).
6 Bricogne, C. et al. TMEM16F activation by Ca(2+) triggers plasma membrane expansion and directs PD-1 trafficking. Sci Rep 9, 619, doi:10.1038/s41598-018-37056-x (2019).
7 Fine, M., Bricogne, C. and Hilgemann, D. Massive surface membrane expansion without involvement of classical exocytic mechanisms. BioRxiv, doi:10.1101/249284 (2018).
8 Jiang, T., Yu, K., Hartzell, H. C. and Tajkhorshid, E. Lipids and ions traverse the membrane by the same physical pathway in the nhTMEM16 scramblase. eLife 6, doi:10.7554/eLife.28671 (2017).
9 Nguyen, D. M., Chen, L. S., Yu, W. P. and Chen, T. Y. Comparison of ion transport determinants between a TMEM16 chloride channel and phospholipid scramblase. J Gen Physiol, doi:10.1085/jgp.201812270 (2019).
10 Lam, A. K. and Dutzler, R. Calcium-dependent electrostatic control of anion access to the pore of the calcium-activated chloride channel TMEM16A. eLife 7, doi:10.7554/eLife.39122 (2018).
11 Peters, C. J. et al. The Sixth Transmembrane Segment Is a Major Gating Component of the TMEM16A Calcium-Activated Chloride Channel. Neuron 97, 1063-1077 e1064, doi:10.1016/j.neuron.2018.01.048 (2018).
12 Alvadia, C. et al. Cryo-EM structures and functional characterization of the lipid scramblase TMEM16F. BioRxiv 455261, doi:https://doi.org/10.1101/455261 (2018).
13 Ye, W. et al. Phosphatidylinositol-(4, 5)-bisphosphate regulates calcium gating of small-conductance cation channel TMEM16F. Proc Natl Acad Sci U S A 115, E1667-E1674, doi:10.1073/pnas.1718728115 (2018).
14 Dang, S. et al. Cryo-EM structures of the TMEM16A calcium-activated chloride channel. Nature 552, 426-429, doi:10.1038/nature25024 (2017).
15 Paulino, C., Kalienkova, V., Lam, A. K. M., Neldner, Y. and Dutzler, R. Activation mechanism of the calcium-activated chloride channel TMEM16A revealed by cryo-EM. Nature 552, 421-425, doi:10.1038/nature24652 (2017).
16 Paulino, C. et al. Structural basis for anion conduction in the calcium-activated chloride channel TMEM16A. eLife 6, doi:10.7554/eLife.26232 (2017).
17 Bushell, S. et al. The structural basis of lipid scrambling and inactivation in the endoplasmic reticulum scramblase TMEM16K. BioRxiv 447417, doi:https://doi.org/10.1101/447417 (2018).
18 Yang, H. et al. TMEM16F forms a Ca2+-activated cation channel required for lipid scrambling in platelets during blood coagulation. Cell 151, 111-122, doi:10.1016/j.cell.2012.07.036 (2012).
19 Yu, K. et al. Identification of a lipid scrambling domain in ANO6/TMEM16F. eLife 4, e06901, doi:10.7554/eLife.06901 (2015).
https://doi.org/10.7554/eLife.45187.025Article and author information
Author details
Funding
National Institute of Neurological Disorders and Stroke (R01NS069229)
- Lily Yeh Jan
Jane Coffin Childs Memorial Fund for Medical Research
- Tina W Han
Eunice Kennedy Shriver National Institute of Child Health and Human Development (F32HD089639)
- Mu He
Howard Hughes Medical Institute
- Yuh Nung Jan
- Lily Yeh Jan
The funders had no role in study design, data collection and interpretation, or the decision to submit the work for publication.
Acknowledgements
We thank Dr. Christian Peters (University of Illinois, Chicago, IL) and Dr. Huanghe Yang (Duke University, Durham, NC) for their critical reading of the manuscript and for helpful discussions. This study is supported in part by NIH Grants R01NS069229 (to LYJ), F32HD089639 (to MH) and by a grant from The Jane Coffin Childs Memorial Fund for Medical Research (to TWH). YNJ and LYJ are Howard Hughes Medical Institute investigators.
Senior Editor
- Richard Aldrich, The University of Texas at Austin, United States
Reviewing Editor
- Kenton Jon Swartz, National Institute of Neurological Disorders and Stroke, National Institutes of Health, United States
Reviewer
- Gilman Toombes, National Institute of Neurological Disorders and Strokes, United States
Version history
- Received: January 14, 2019
- Accepted: July 17, 2019
- Accepted Manuscript published: July 18, 2019 (version 1)
- Version of Record published: August 12, 2019 (version 2)
Copyright
© 2019, Ye et al.
This article is distributed under the terms of the Creative Commons Attribution License, which permits unrestricted use and redistribution provided that the original author and source are credited.
Metrics
-
- 2,698
- Page views
-
- 461
- Downloads
-
- 18
- Citations
Article citation count generated by polling the highest count across the following sources: Crossref, PubMed Central, Scopus.
Download links
Downloads (link to download the article as PDF)
Open citations (links to open the citations from this article in various online reference manager services)
Cite this article (links to download the citations from this article in formats compatible with various reference manager tools)
Further reading
-
- Cell Biology
- Neuroscience
The amyloid beta (Aβ) plaques found in Alzheimer’s disease (AD) patients’ brains contain collagens and are embedded extracellularly. Several collagens have been proposed to influence Aβ aggregate formation, yet their role in clearance is unknown. To investigate the potential role of collagens in forming and clearance of extracellular aggregates in vivo, we created a transgenic Caenorhabditis elegans strain that expresses and secretes human Aβ1-42. This secreted Aβ forms aggregates in two distinct places within the extracellular matrix. In a screen for extracellular human Aβ aggregation regulators, we identified different collagens to ameliorate or potentiate Aβ aggregation. We show that a disintegrin and metalloprotease a disintegrin and metalloprotease 2 (ADM-2), an ortholog of ADAM9, reduces the load of extracellular Aβ aggregates. ADM-2 is required and sufficient to remove the extracellular Aβ aggregates. Thus, we provide in vivo evidence of collagens essential for aggregate formation and metalloprotease participating in extracellular Aβ aggregate removal.
-
- Computational and Systems Biology
- Neuroscience
The cerebellar granule cell layer has inspired numerous theoretical models of neural representations that support learned behaviors, beginning with the work of Marr and Albus. In these models, granule cells form a sparse, combinatorial encoding of diverse sensorimotor inputs. Such sparse representations are optimal for learning to discriminate random stimuli. However, recent observations of dense, low-dimensional activity across granule cells have called into question the role of sparse coding in these neurons. Here, we generalize theories of cerebellar learning to determine the optimal granule cell representation for tasks beyond random stimulus discrimination, including continuous input-output transformations as required for smooth motor control. We show that for such tasks, the optimal granule cell representation is substantially denser than predicted by classical theories. Our results provide a general theory of learning in cerebellum-like systems and suggest that optimal cerebellar representations are task-dependent.