Protein quality control in the nucleolus safeguards recovery of epigenetic regulators after heat shock
- University Medical Center Groningen, University of Groningen, Netherlands
- Inserm U908, University of Lille, France
- Radboud University Nijmegen, Netherlands
Figures
Figure 1 with 3 supplements
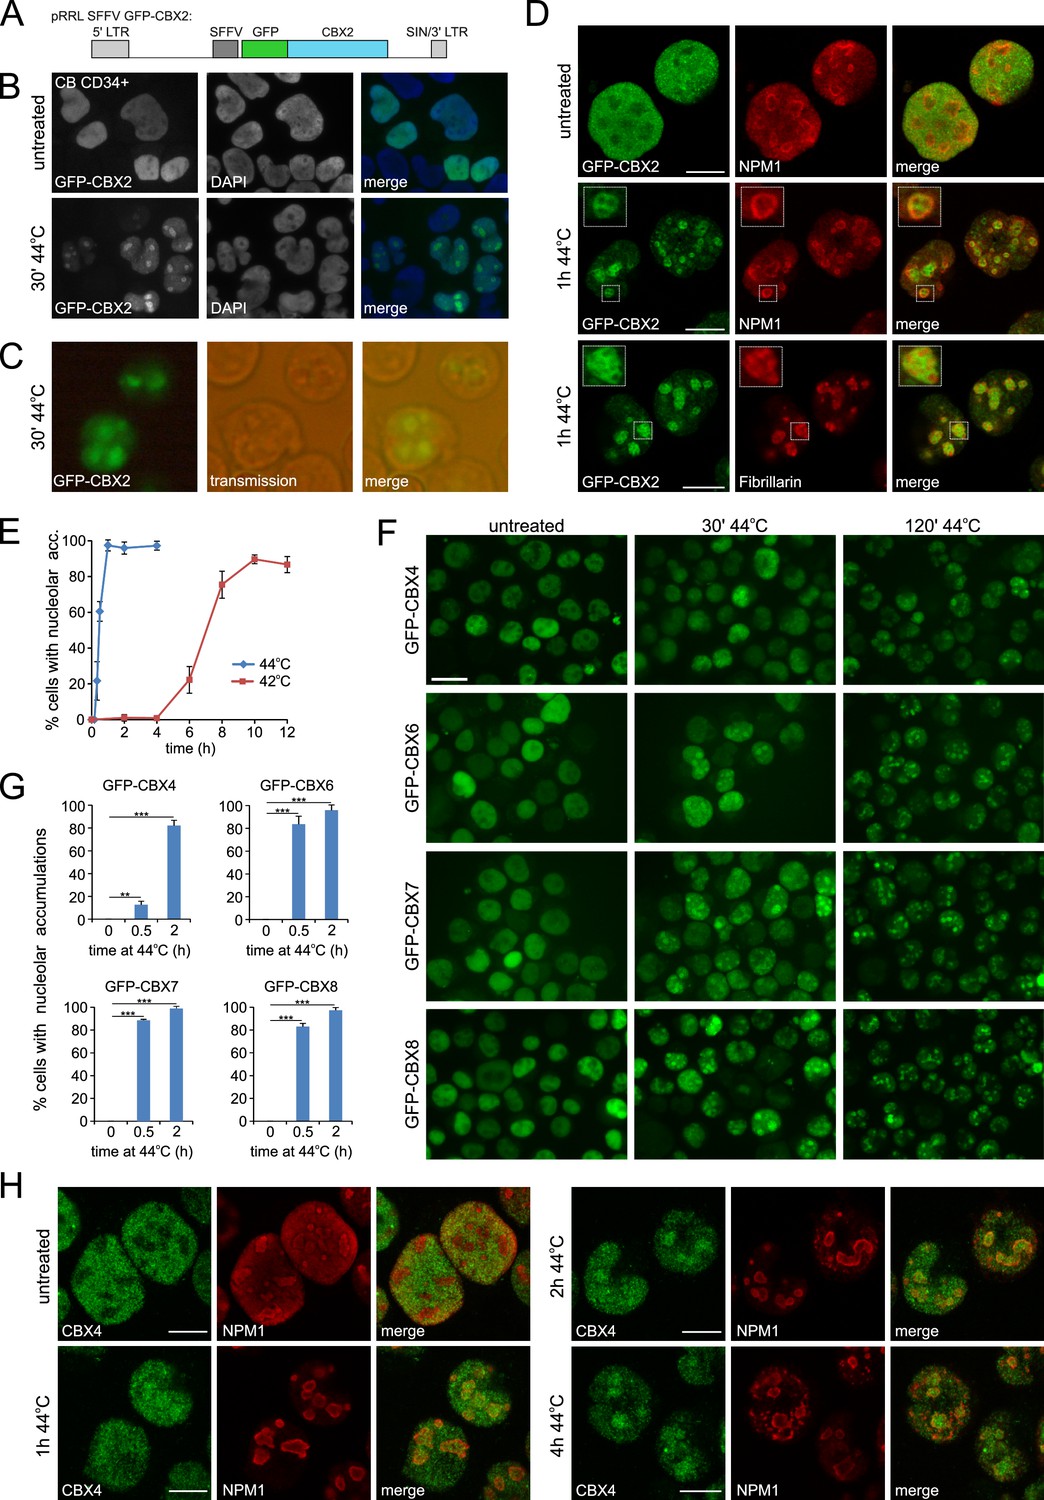
Heat shock induces nucleolar relocalization of CBX proteins.
(A) Graphical representation of the pRRL SFFV GFP-CBX2 lentiviral vector that was used in this study. (B) GFP-CBX2 localization in fixed untreated or heat shocked (30 min, 44°C) cord blood (CB) CD34+ cells. (C) GFP-CBX2 localization in live K562 GFP-CBX2 cells directly after HS. (D) Confocal images of untreated and heat shocked K562 GFP-CBX2 cells that were fixed and stained with either anti-NPM1 or anti-Fibrillarin antibodies. Scale bar represents 10 μm. (E) Percentage of cells with nucleolar accumulation of GFP-CBX2 at continuous exposure at 42°C or 44°C. Error bars indicate the mean ± SD calculated from independent microscopical images (n = 4; total cell number 70–220). Similar results were obtained in independent experiments. (F) GFP-CBX4, GFP-CBX6, GFP-CBX7 and GFP-CBX8 localization in K562 cells in untreated or heat shocked (30 min, 44°C) cells. Scale bar represents 25 μm. (G) Quantification of percentage of cells with nucleolar accumulations in designated K562 cell lines after HS (30 min or 2 hr, 44°C). Error bars indicate the mean ± SD calculated from independent microscopical images (n = 3; total cell number 70–100). Statistical analysis was performed using Student’s t-test, **p<0.01 and ***p<0.001. (H) Confocal images of untreated and heat shocked K562 cells that were fixed and stained with anti-CBX4 and anti-NPM1. Scale bar represents 10 μm.
Figure 1—figure supplement 1

GFP-CBX2 is incorporated in the PRC1 complex and shows overlapping chromatin binding compared to endogenous CBX2 and H2AK119ub.
(A) Western analysis of GFP pull-outs performed on K562 GFP and K562 GFP-CBX2 cells showing co-preciptation of endogenous RING1B and BMI1 with GFP-CBX2. (B) Venn diagram showing overlap between identified target genes based on peak calling on tracks for GFP-CBX2 (K562 GFP-CBX2 cells, this paper), endogenous CBX2 (K562 cells, ENCODE/Broad) and H2AK119ub (K562 cells, described in van den Boom et al., 2016.
Figure 1—figure supplement 2
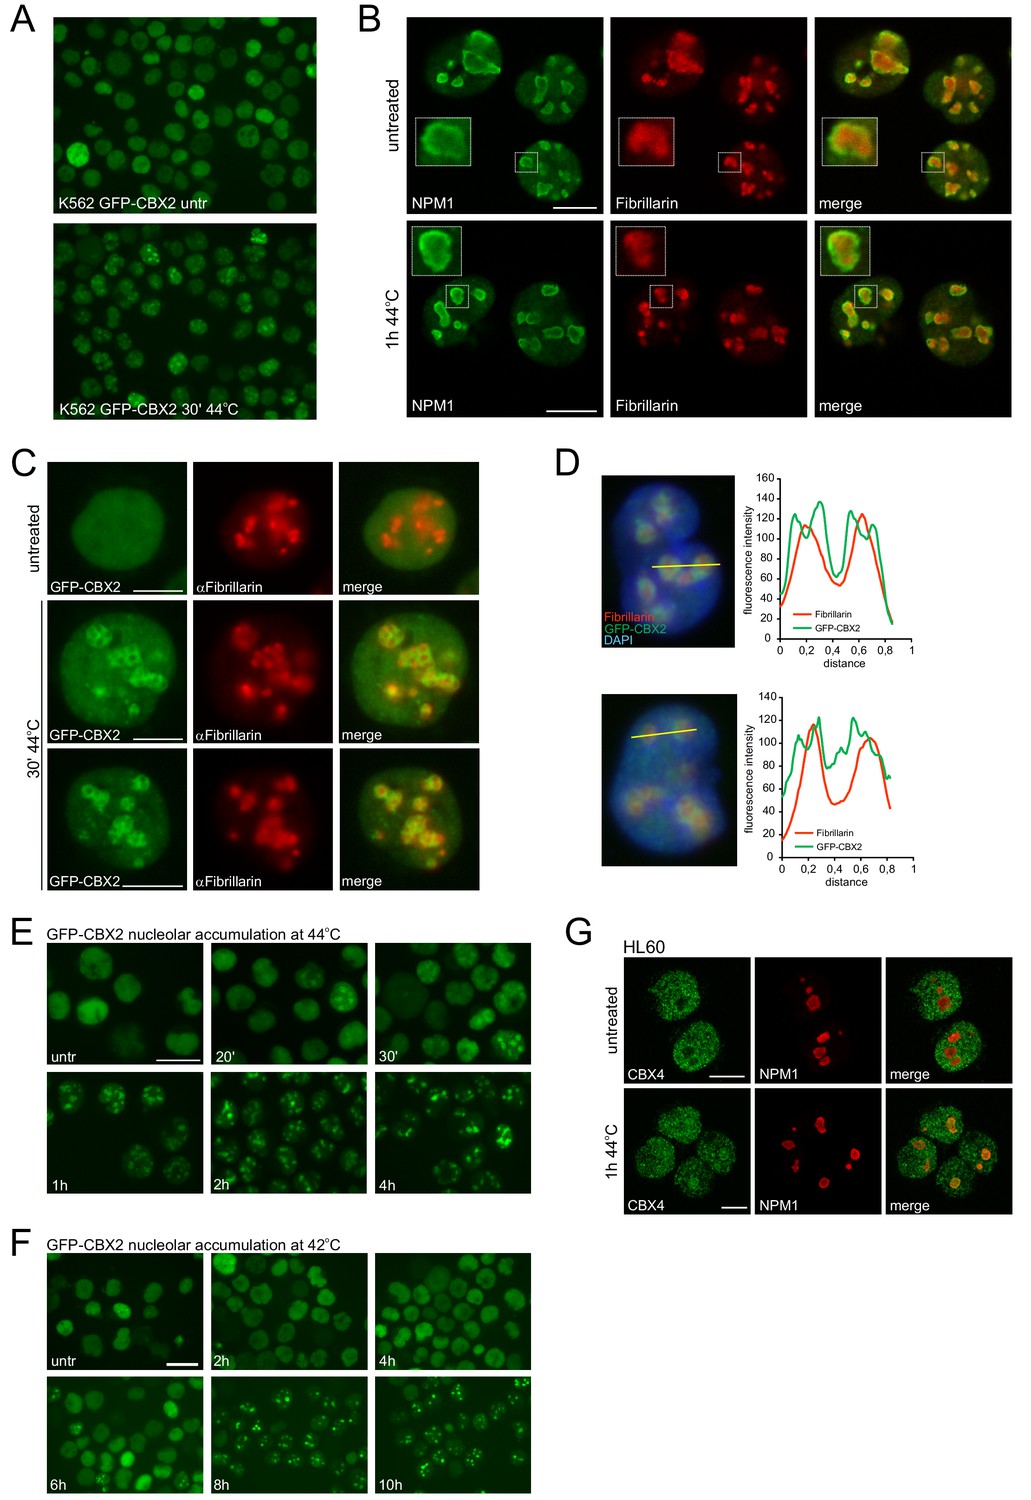
Heat-shock-induced GFP-CBX2 nucleolar localization kinetics are temperature dependent.
(A) GFP-CBX2 localization in untreated and heat shocked (30 min, 44°C) K562 cells. (B) Confocal images of untreated and heat shocked K562 cells stained with antibodies directed against NPM1 and Fibrillarin. Scale bar represents 10 μm. (C) Immunofluorescence analysis of untreated and heat shocked K562 GFP-CBX2 cells that were fixed and stained with an anti-Fibrillarin antibody. Scale bar represents 10 μm. (D) Representative images of heat shocked K562 GFP-CBX2 cells stained with an anti-Fibrillarin antibody that were subjected to line scan analysis. (E) Representative images of K562 GFP-CBX2 cell continuously exposed to 44°C and fixed at the indicated time points. (F) Representative images of K562 GFP-CBX2 cell continuously exposed to 42°C and fixed at the indicated time points. (G) Confocal images of untreated and heat shocked (1 hr, 44°C) HL60 cells stained with anti-CBX4 and anti-NPM1. Scale bar represents 10 μm.
Figure 1—figure supplement 3
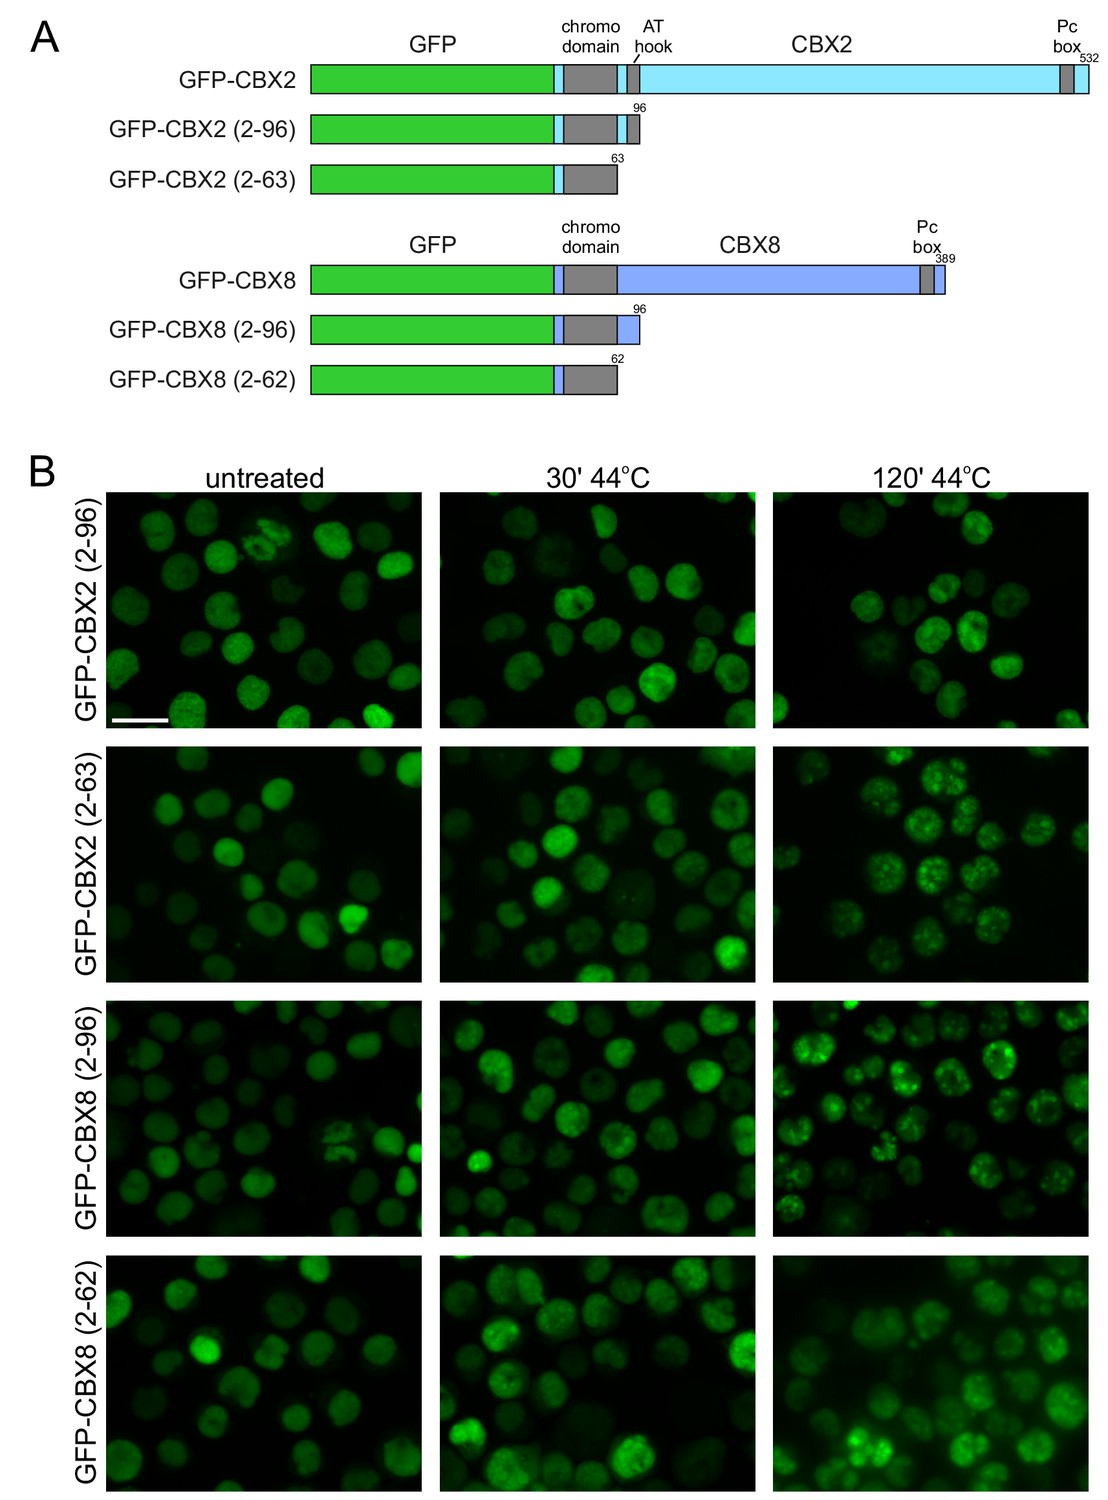
The N-terminus of CBX2 and CBX8 including the chomo domain is sufficient for HS-induced nucleolar localization.
(A) Schematic representation of full length GFP-CBX2 and GFP-CBX8 and generated truncated GFP-fusion constructs. (B) Representative images of K562 cells stably expressing GFP-CBX2 (2–96), GFP-CBX2 (2–63), GFP-CBX8 (2–96), or GFP-CBX8 (2–62) that are either untreated or exposed to a 30 min or 2 hr HS at 44°C.
Figure 2

Cellular fractionation shows HS-induced nucleolar relocalization of endogenous Polycomb proteins.
(A) Graphical representation of isolation of cytoplasmic, nucleoplasmic and nucleoli fractions and transmission images of isolated nuclei and nucleoli. Scale bar represents 40 μm. (B) Representative images of non-fixed nucleoli isolated from untreated or heat-shocked (1 hr, 44°C) K562 GFP-CBX8 cells. Scale bar represents 10 μm. (C) Quantification of the GFP-CBX8 fluorescent signal of nucleoli isolated form untreated (n = 47) or heat-shocked (n = 92) cells. Error bars indicate mean ± SEM. Statistical analysis was performed using Student’s t-test, ***p<0.001. (D) Representative image from fixed nucleoli isolated from untreated or heat-shocked (1 hr, 44°C) K562 GFP-CBX8 cells and counterstained with DAPI. Scale bar represents 5 μm. (E) Western blot analyses of cytoplasmic, nucleoplasmic and nucleoli fractions from untreated and heat-shocked K562 GFP-CBX8 cells stained with anti-Fibrillarin (FBL) and anti-GFP antibodies. (F) Western blot analyses of cytoplasmic, nucleoplasmic and nucleoli fractions from untreated and heat-shocked K562 cells stained with anti-Fibrillarin (FBL), anti-CBX4, anti-CBX8, anti-RING1B and anti-β-ACTIN antibodies. (G) Western blot analyses of cytoplasmic, nucleoplasmic and nucleoli fractions from untreated and heat-shocked HL60 cells stained with anti-Fibrillarin (FBL), anti-CBX4, anti-CBX8, anti-RING1B, anti-DNAJB1, anti-HSP70 and anti-β-ACTIN antibodies.
Figure 3 with 4 supplements

Heat shock induces nucleolar accumulation of Polycomb proteins, chromatin regulators and heat-shock proteins.
(A) Venn diagrams showing overlap of significantly enriched/depleted proteins in nucleoli after HS (1 hr, 44°C) as identified in two independent experiments. Nucleolar fractionations were performed on K562 cells (untreated, HS) and samples were analyzed using liquid chromatography-tandem mass spectrometry (LC-MS/MS) in triplicates, followed by data analysis using MaxQuant and Perseus software. (B) Gene ontology (GO) analysis of overlapping proteins that were significantly enriched in the nucleolus after HS. (C) Volcano plot showing nucleolar proteins in untreated and heat shocked K562 cells and highlighting enriched PRC1 and PRC2 subunits. Statistical analysis was performed using Student’s t-test (false discovery rate (FDR) < 0.01; fold change (FC) > 2). Significantly changed proteins are marked in red. (D) Western blot analyses of cytoplasmic, nucleoplasmic and nucleoli fractions from untreated and heat-shocked K562 and HL60 cells stained with anti-EZH2 and anti-SUZ12 antibodies. (E) Western blot analyses of cytoplasmic, nucleoplasmic and nucleoli fractions from untreated and heat-shocked K562 cells stained with antibodies directed against histone H3, H3K27me3 and H2AK119ub. (F) Volcano plot showing (significantly) enriched subunits of the PAF and FACT complex and CHD proteins. (G) Volcano plot displaying significantly enriched BRD family members and the JMJD6 protein. (H) Volcano plot showing (significantly) enriched HSP70 and DNAJ heat shock proteins. (I) Volcano plot highlighting all (significantly) enriched proteasomal subunits.
Figure 3—figure supplement 1

LC-MS/MS analysis of isolated nucleoli shows enrichment for nucleolar proteins.
(A) Ranking of proteins based on LFQ value shows that classical nucelolar proteins like NPM1 and Fibrillarin (both indicated in green) are among the top enriched proteins in nucleoli. (B) GO analysis of the top ten percent (based on LFQ value) of identified proteins, shows enrichment for nucleolus-related processes like ribosome biogenesis and rRNA processing.
Figure 3—figure supplement 2
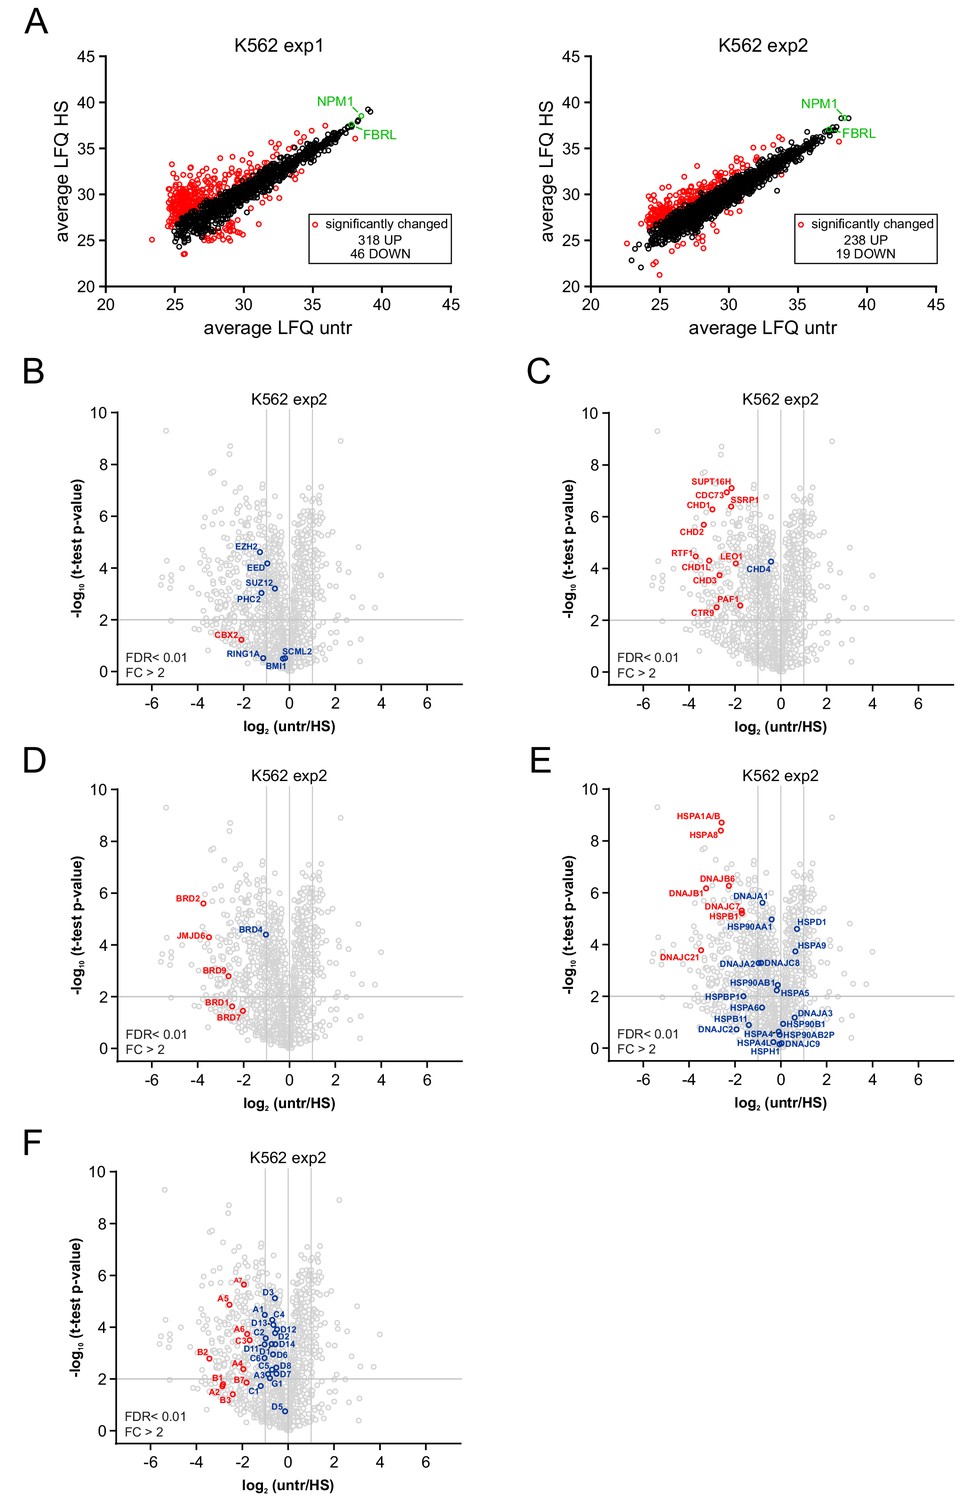
LC-MS/MS-based identification of significantly changed proteins in the nucleolus upon heat shock.
(A) Scatter plots from two independent experiments showing average LFQ values, based on triplicate measurements, for each identified protein in nucleoli isolated from untreated or heat shocked K562 cells. Red circles indicate all significantly changed proteins after HS. NPM1 and Fibrillarin are indicated in green. (B) Volcano plot showing nucleolar proteins in untreated and heat shocked K562 cells and highlighting PRC1 and PRC2 subunits that were detected. Statistical analysis was performed using Student’s t-test (false discovery rate (FDR) < 0.01; fold change (FC) > 2). Significantly changed proteins are marked in red. (C) Volcano plot highlighting (significantly) enrichedsubunits of the PAF and FACT complex and CHD proteins. (D) Volcano plot showing (significantly) enriched BRD family members and the JMJD6 protein. (E) Volcano plot displaying (significantly) enriched HSP70 and DNAJ heat shock proteins. (F) Volcano plot highlighting all (significantly) enriched proteasomal subunits.
Figure 3—figure supplement 3
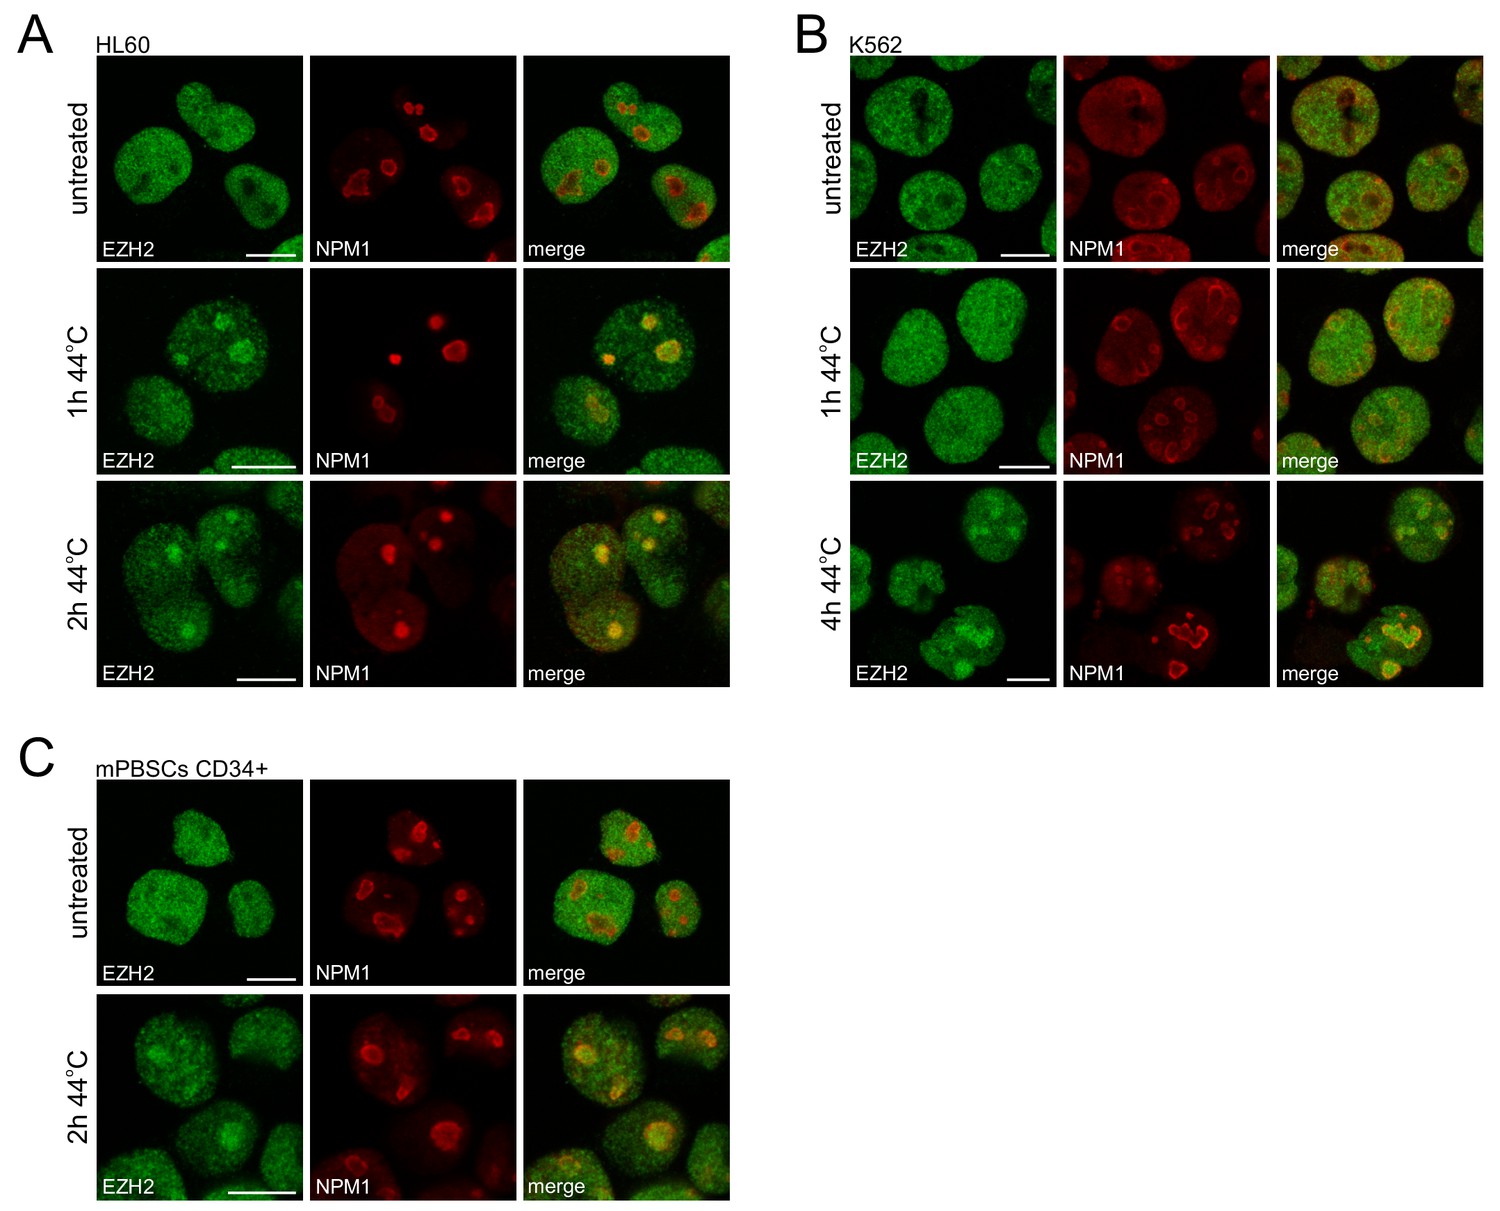
HS induces nucleolar accumulation of EZH2 in leukemic cells and primary human peripheral blood stem cells.
(A–C) Confocal images of immunofluorescence staining of endogenous EZH2 and NPM1 in untreated and heat shocked (44°C) HL60 (A), K562 (B) and mobilized peripheral blood stem cells (mPBSCs; C). Scale bar represents 10 μm.
Figure 3—figure supplement 4
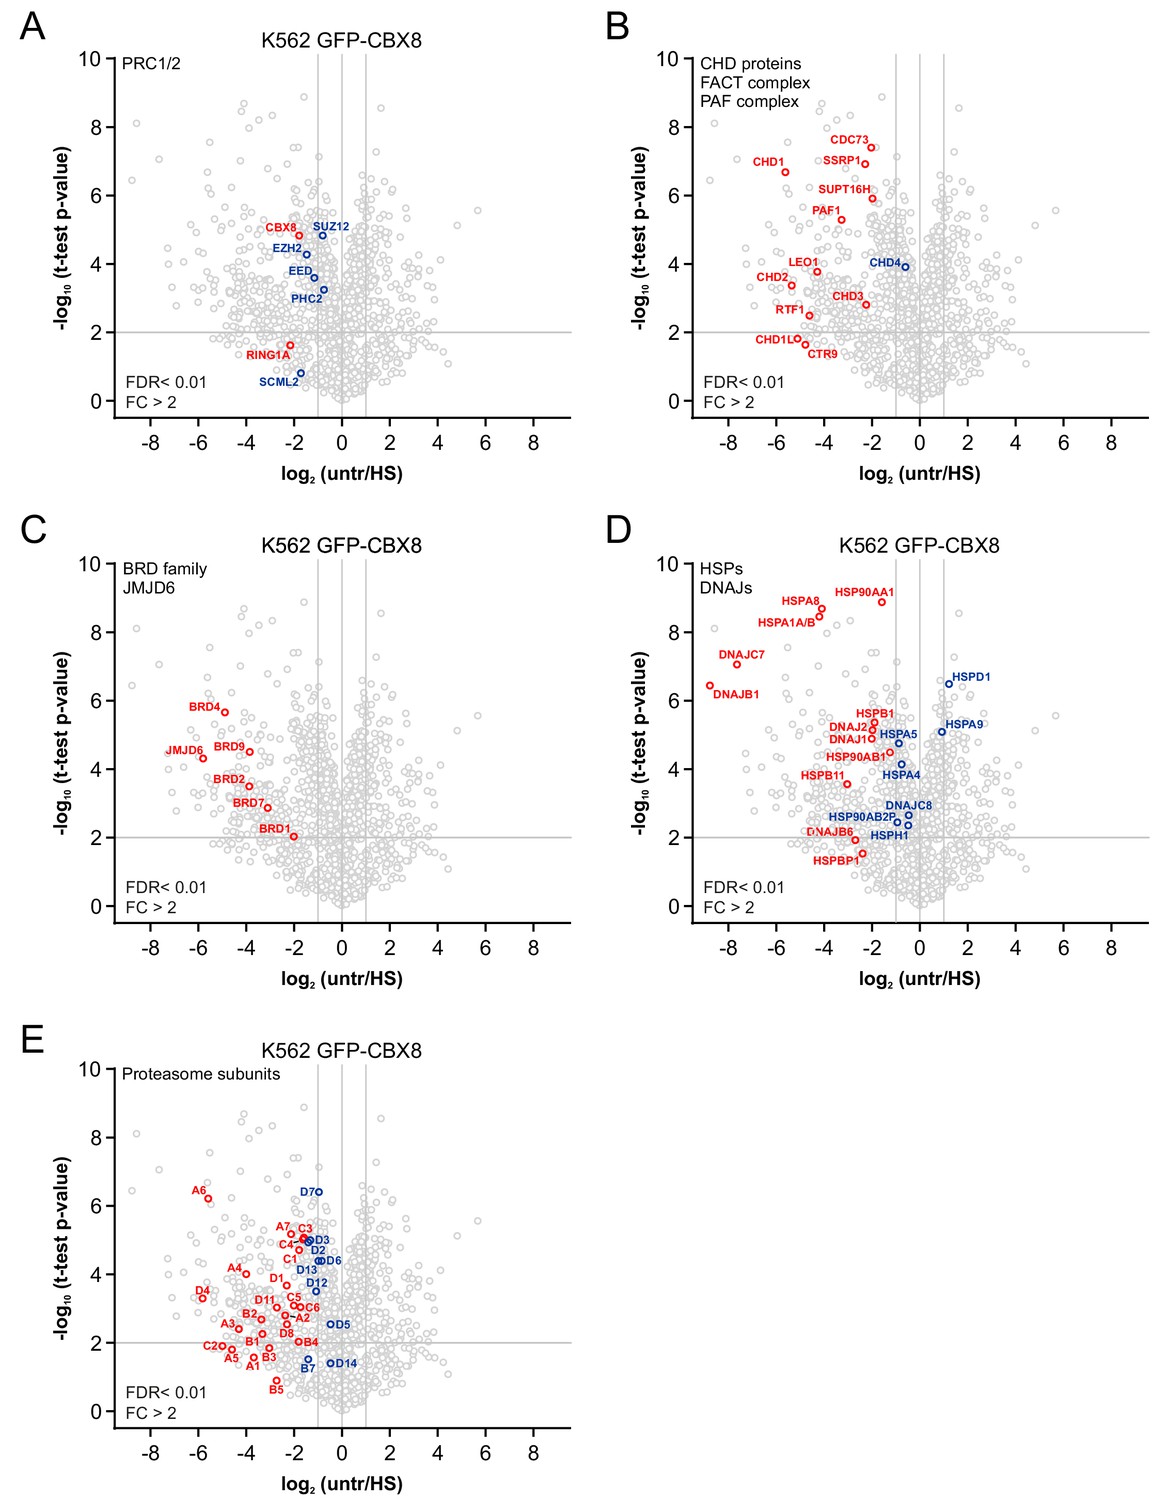
Identification of changes in the nucleolar proteome in untreated and heat shocked K562 GFP-CBX8 cells.
(A) Volcano plot from nucleolar proteomes from untreated and heat shocked K562 GFP-CBX8 cells highlighting PRC1 and PRC2 subunits that were detected in the isolated nucleoli. Statistical analysis was performed using Student’s t-test (false discovery rate (FDR) < 0.01; fold change (FC) > 2). Significantly changed proteins are marked in red. (B) Volcano plot highlighting (significantly) enriched subunits of the PAF and FACT complex and CHD proteins. (C) Volcano plot showing (significantly) enriched BRD family members and the JMJD6 protein. (D) Volcano plot displaying (significantly) enriched HSP70 and DNAJ heat shock proteins. (E) Volcano plot highlighting all (significantly) enriched proteasomal subunits.
Figure 4 with 1 supplement
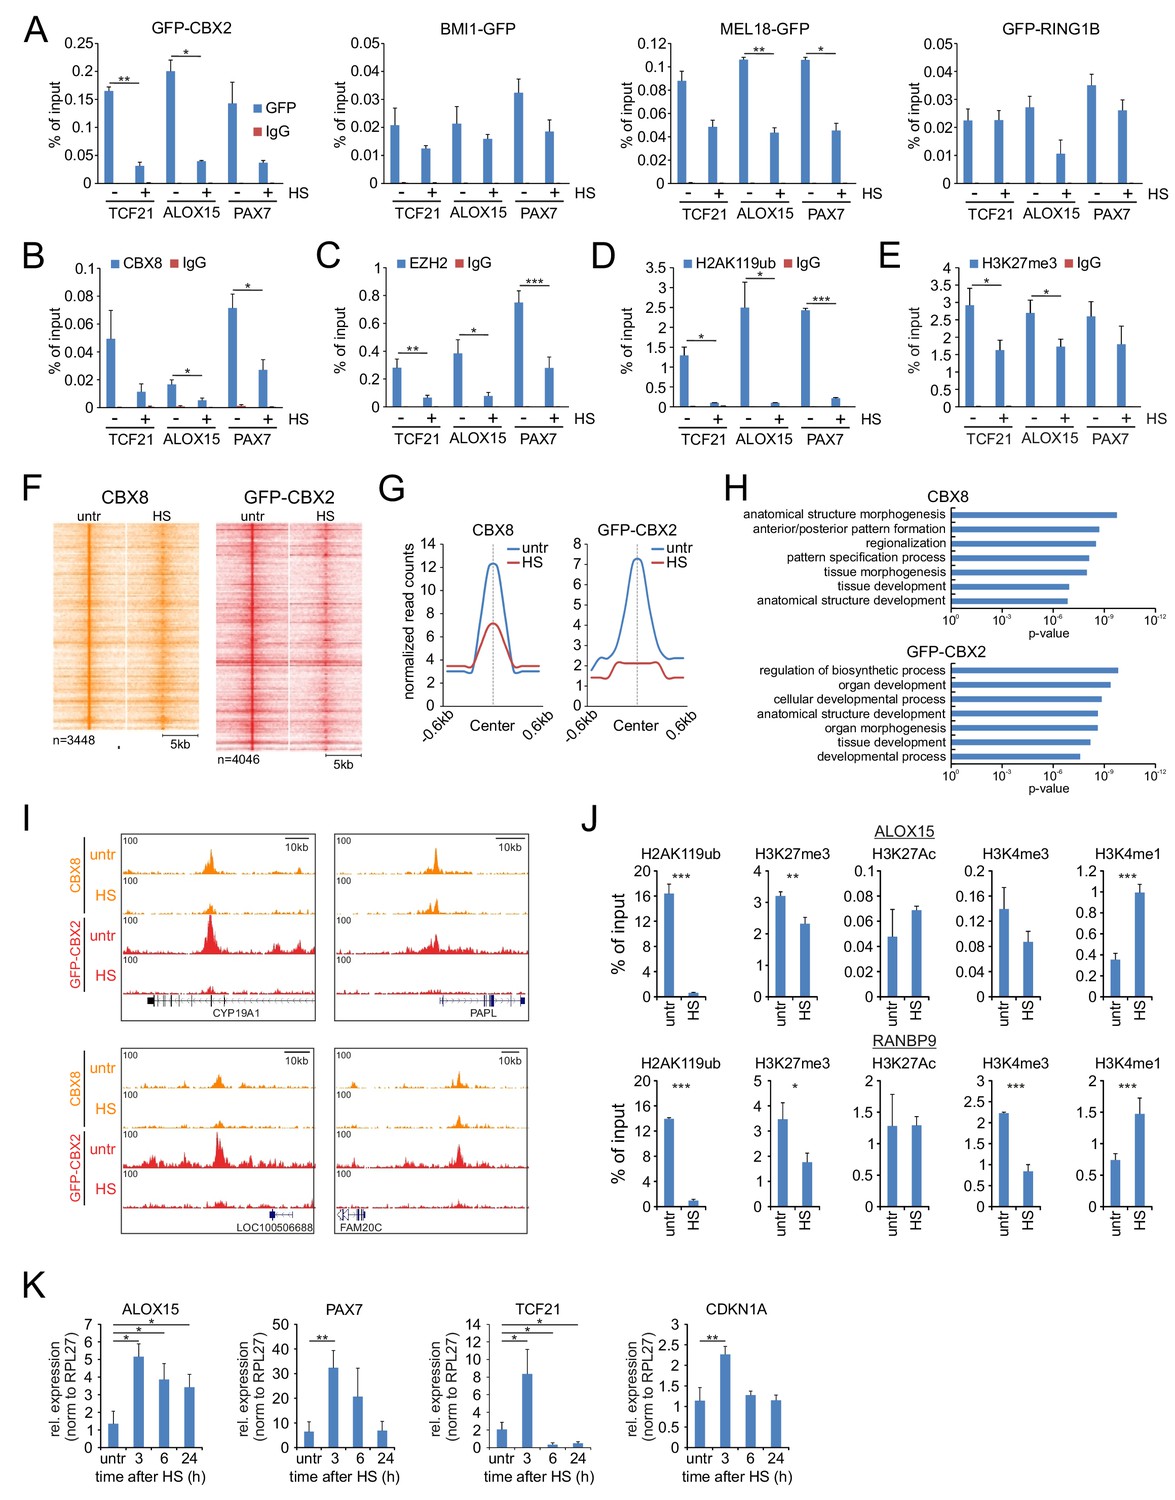
Heat shock induces loss of PRC1 and PRC2 binding to target genes and changes in epigenetic marks.
(A) ChIP-qPCR analyses of GFP-CBX2, BMI1-GFP, MEL18-GFP and GFP-RING1B binding to Polycomb target genes in untreated and heat shocked (1 hr, 44°C) cells. ChIP reactions were performed using an anti-GFP antibody on cells expressing the respective GFP-fusion protein. Error bars represent mean ±range (n = 2, independent replicates, statistical analysis was performed using Student’s t-test, *p<0.05 and **p<0.01). (B) ChIP-qPCR analyses of Polycomb target genes using an antibody directed against endogenous CBX8 in untreated and heat shocked (1 hr, 44°C) K562 cells. Error bars represent mean ±range (n = 2 independent replicates, *p<0.05). (C) ChIP-qPCR analyses of Polycomb target genes using an antibody directed against endogenous EZH2 in untreated and heat shocked (1 hr, 44°C) K562 cells. Error bars represent mean ± SD (n = 4 independent replicates, *p<0.05, **p<0.01 and ***p<0.001). (D) ChIP-qPCR analyses of H2AK119ub levels at Polycomb target genes in untreated and heat shocked (1 hr, 44°C) K562 cells. Error bars represent mean ± SD (n = 3 independent replicates, *p<0.05 and ***p<0.001). (E) ChIP-qPCR analyses of H3K27me3 levels at Polycomb target genes in untreated and heat shocked (1 hr, 44°C) K562 cells. Error bars represent mean ± SD (n = 3 independent replicates, *p<0.05). (F) ChIP-seq heatmap of endogenous CBX8 peaks (K562) and GFP-CBX2 peaks (K562 GFP-CBX2) and surrounding regions (−5 to + 5 kb) as identified in untreated cells and the respective signal in heat shocked cells (1 hr, 44°C). (G) Band plots showing the median CBX8 and GFP-CBX2 signal (relative read counts) in untreated and heat shocked cells. (H) GO analyses of genes associated with endogenous CBX8 of GFP-CBX2 peaks in untreated cells show enrichment for developmental processes. (I) Characteristic examples of loci that show reduced binding of CBX8 and GFP-CBX2 upon HS. (J) ChIP-qPCR analyses of H2AK119ub, H3K27me3, H3K27Ac, H3K4me3 and H3K4me1 levels in untreated and heat shocked (1 hr, 44°C) K562 cells. Error bars represent mean ± SD (technical triplicates, *p<0.05, **p<0.01 and ***p<0.001). qPCR analyses of the expression of Polycomb target genes in wild type K562 cells (untreated and in time after HS [1 hr, 44°C]). Error bars represent mean ± SD (n = 3 independent replicates, *p<0.05 and **p<0.01).
Figure 4—figure supplement 1
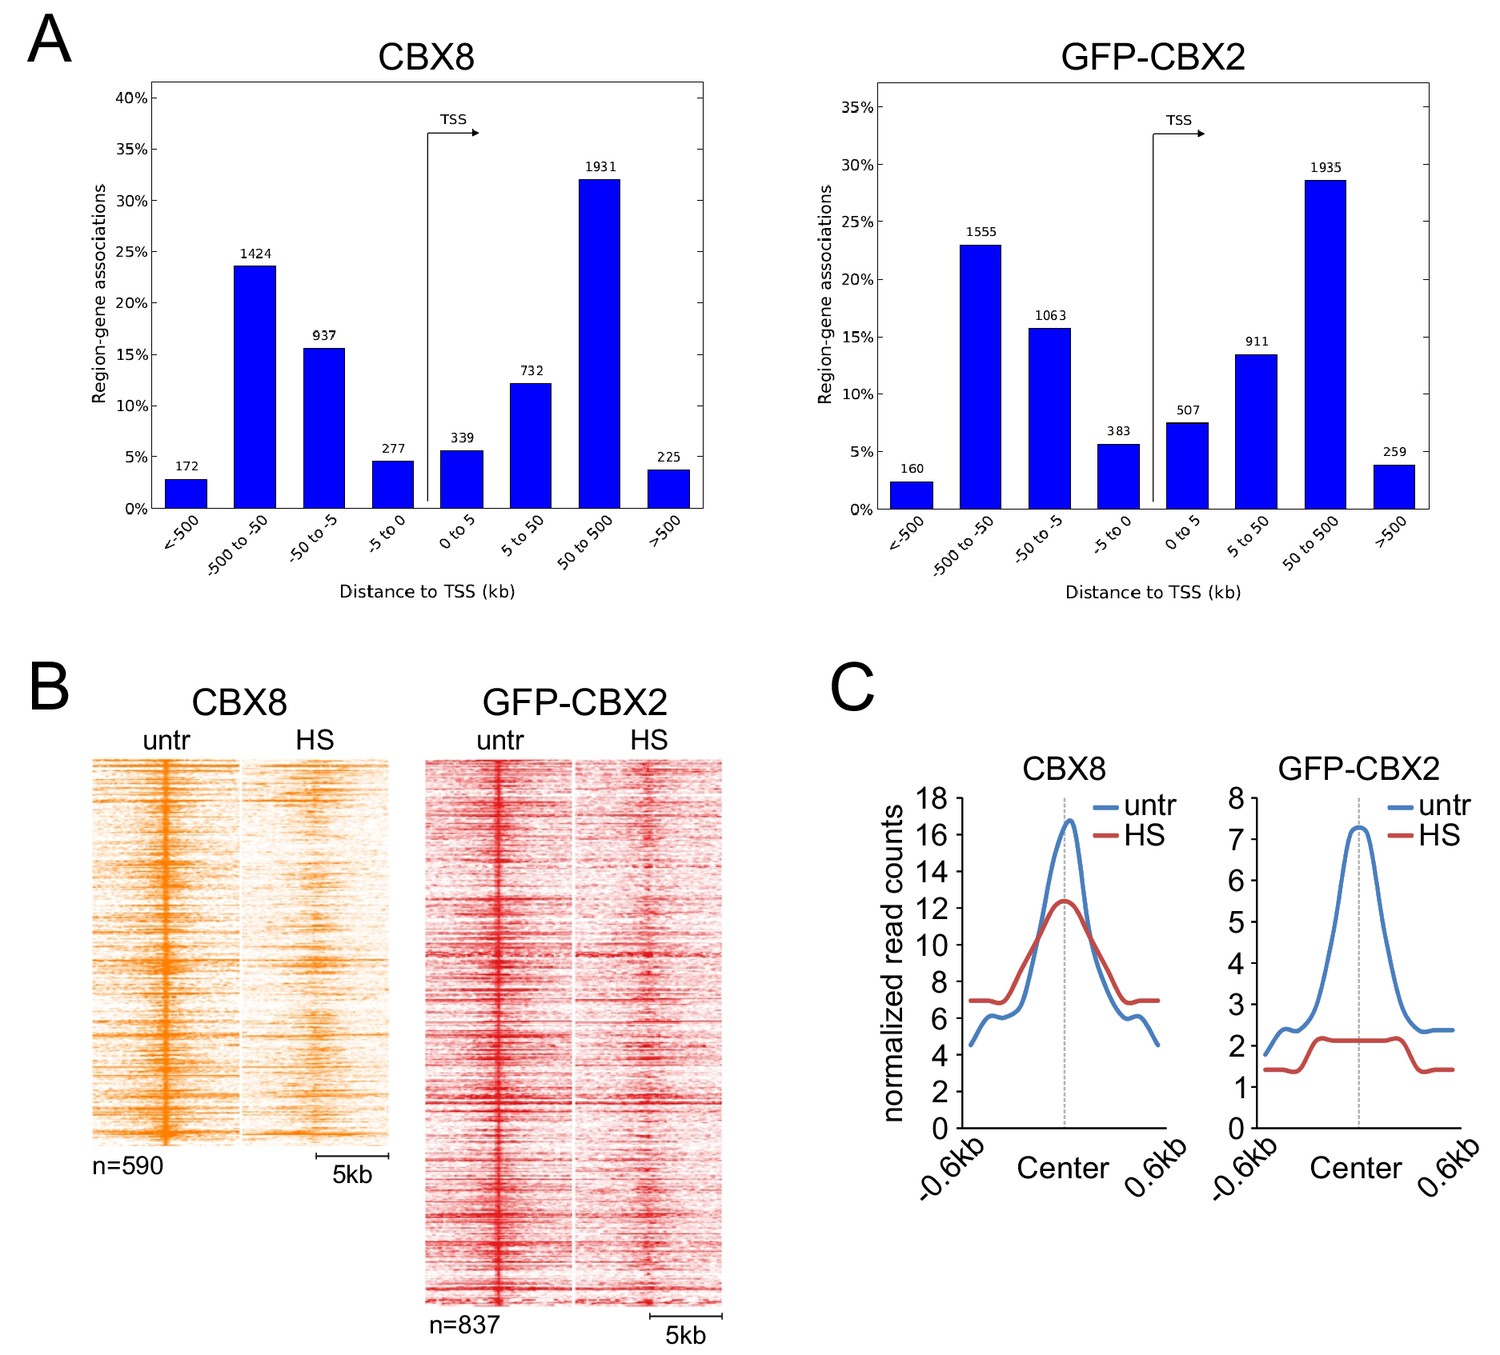
CBX8 and GFP-CBX2 genome-wide peak localization analysis and CBX8 and GFP-CBX2 ChIP-seq signals at TSS-associated peaks.
(A) Analysis of CBX8 and GFP-CBX2 peak distance from transcription start sites (TSS) in kilobase (kb) using GREAT (McLean et al., 2010). (B) ChIP-seq heatmap of TSS-associated endogenous CBX8 peaks (K562) and GFP-CBX2 peaks (K562 GFP-CBX2) and surrounding regions (−5 to + 5 kb) as identified in untreated cells and the respective signal in heat shocked cells (1 hr, 44°C). (C) Band plots showing the median TSS-associated CBX8 and GFP-CBX2 signals (relative read counts) in untreated and heat shocked cells.
Figure 5
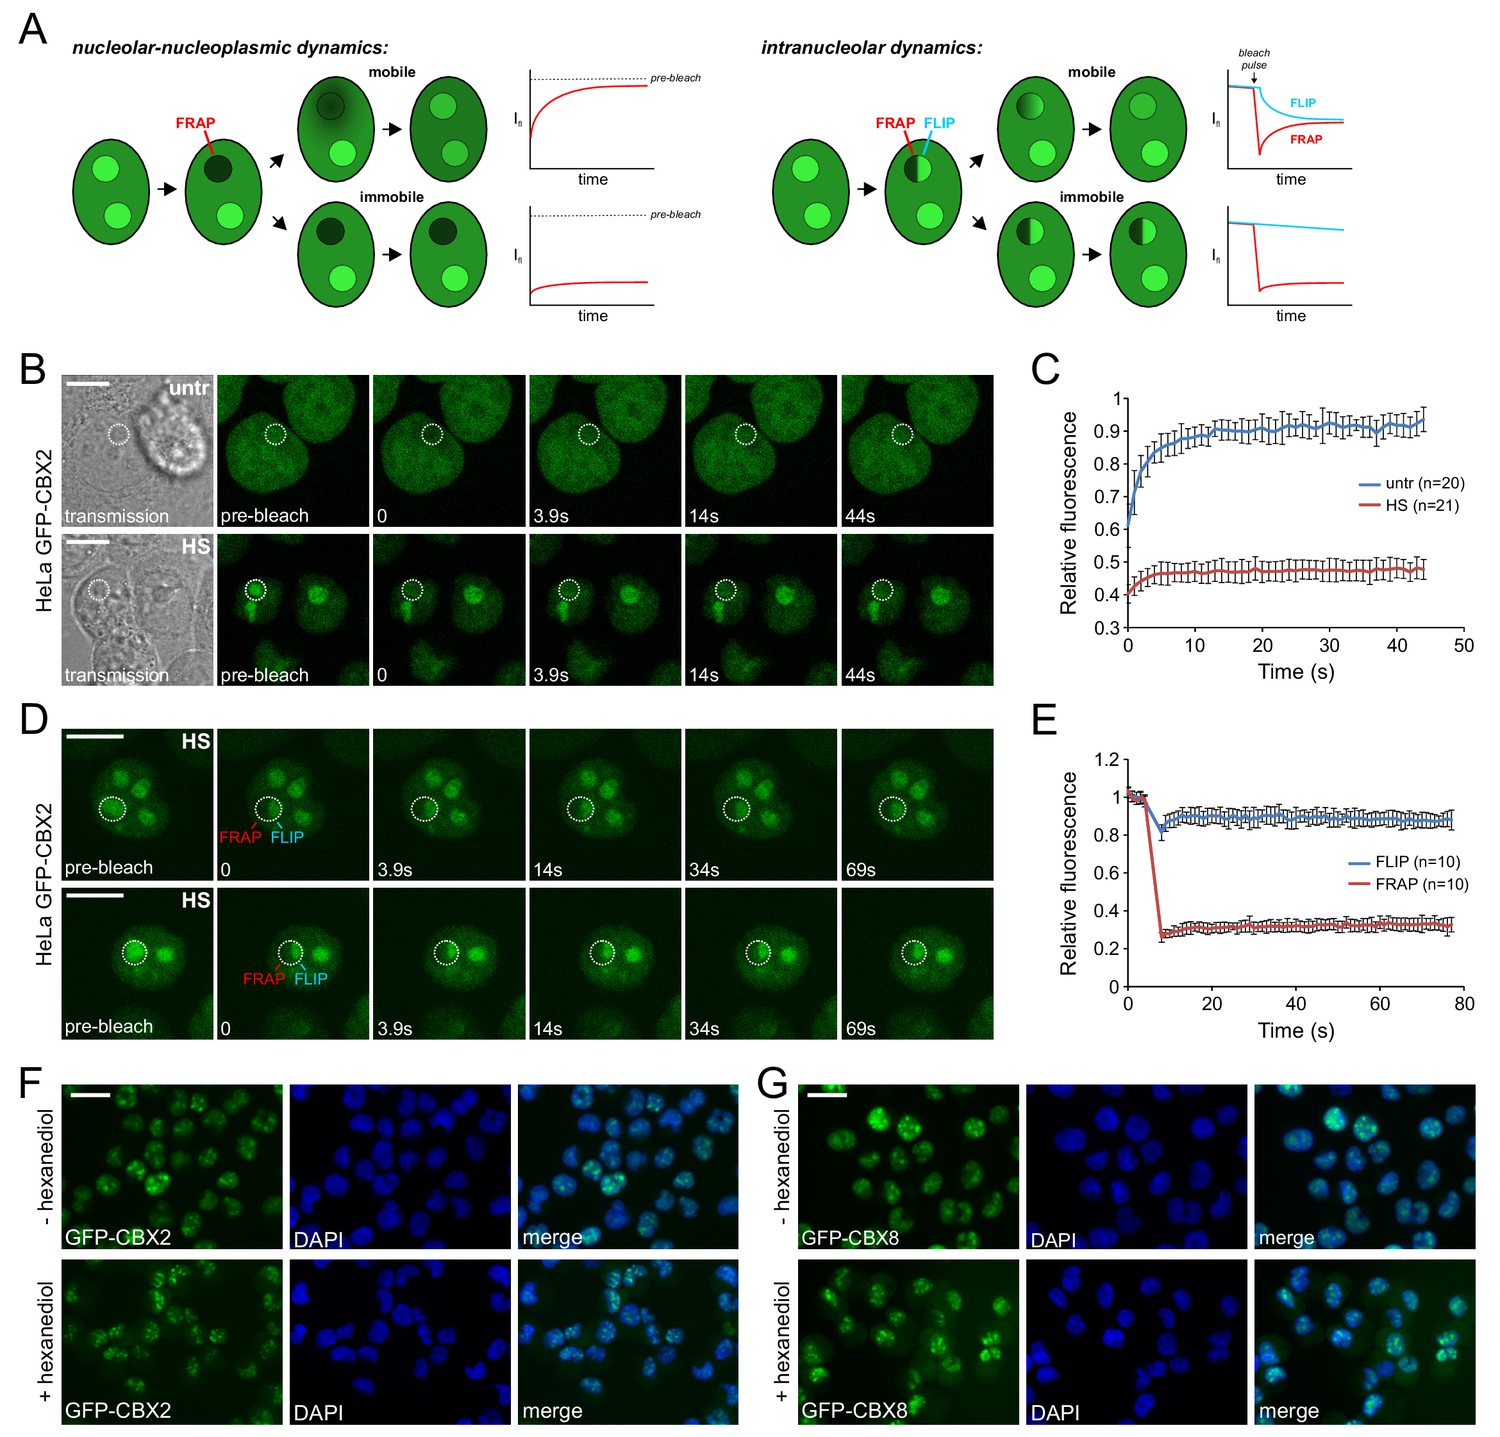
Heat shock strongly immobilizes GFP-CBX2 in the nucleolus in a 1,6-hexanediol insensitive manner.
(A) Graphical summary of photobleaching experiments. (B) Representative example of Spot-FRAP analysis on HeLa GFP-CBX2 cells that were either untreated or heat shocked (30 min, 44°C). Confocal analysis was performed at 37°C directly after HS. FRAP region is indicated in the pre-bleach and transmission image. Scale bar represents 10 μm. (C) Average FRAP signals in the bleached nucleolar areas, starting directly after photobleaching. Error bars indicate mean ± SD. (D) Two representative examples of FLIP/FRAP analyses within the nucleolus of HeLa GFP-CBX2 cells that were either untreated or heat shocked (30 min, 44°C). FRAP and FLIP regions are indicated in the pre-bleach images. Scale bar represents 10 μm. (E) Average FLIP and FRAP signals in the nucleolus, starting before photobleaching. Error bars indicate mean ± SD. (F) GFP-CBX2 localization in K562 GFP-CBX2 cells that were heat shocked (1 hr, 44°C) and subsequently cultured at 37°C for 1 hr in the presence or absence of 10% 1,6-hexanediol. Scale bar represents 25 μm. (G) GFP-CBX8 localization in K562 GFP-CBX8 cells that were heat shocked (1 hr, 44°C) and subsequently cultured at 37°C for 1 hr in the presence or absence of 10% 1,6-hexanediol. Scale bar represents 25 μm.
Figure 6 with 2 supplements
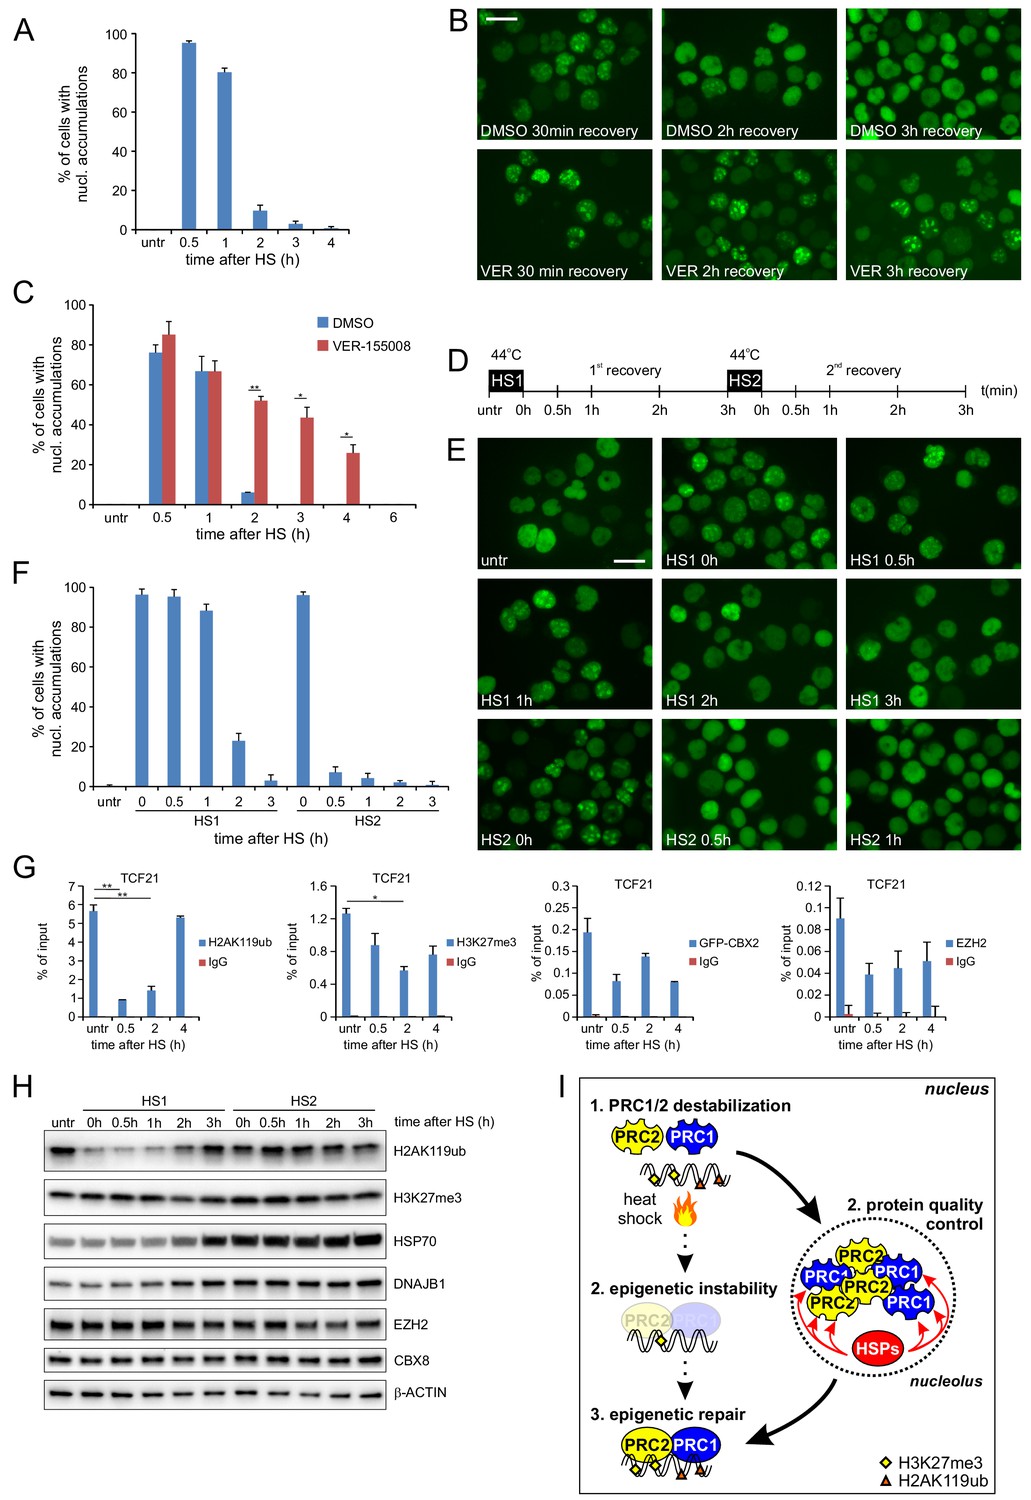
Post-HS nucleolar recovery of CBX proteins and epigenetic recovery depends on heat-shock protein activity.
(A) Percentage of cells with nucleolar accumulation of GFP-CBX2 during recovery at 37°C after HS (30 min, 44°C). Error bars indicate the mean ± range calculated from independent microscopical images (n = 2; total cell number 100–170) (B) Representative images of fixed K562 GFP-CBX2 cultured at 37°C after HS (30 min, 44°C) for indicated time intervals in the presence of 5 μM VER-155088 or DMSO. Scale bar represents 25 μm. (C) Percentage of K562 GFP-CBX2 cells with nucleolar accumulations. Cells are cultured at 37°C after HS (30 min, 44°C) in the presence of 5 μM VER-155088 or DMSO. Error bars indicate the mean ± range calculated from independent microscopical images (n = 2; total cell number 50–90). Statistical analysis was performed using Student’s t-test, *p<0.05, **p<0.01. Similar results were obtained in independent experiments. (D) Experimental design of thermotolerance experiment. (E) Representative images of K562 GFP-CBX2 cells fixed at indicated time points according to panel D. Scale bar represents 25 μm. (F) Quantification of percentage of K562 GFP-CBX2 cells with nucleolar accumulations at time points according to panel D. Error bars indicate the mean ± SD calculated from independent microscopical images (n = 5; total cell number 230–350). (G) ChIP-qPCR analyses of H2AK119ub, H3K27me3, GFP-CBX2 and endogenous EZH2 levels at the TCF21 locus in K562 GFP-CBX2 cells, either untreated or cross-linked at indicated time-points after a heat shock (30 min, 44°C). Error bars represent mean ± range (n = 2, independent replicates, *p<0.05 and **p<0.01). (H) Western blot analysis of H2AK119ub, H3K27me3, HSP70, DNAJB1, EZH2, CBX8 and β-ACTIN levels in K562 GFP-CBX2 cells samples isolated at indicated time points according to panel D. (I) Schematic representation of the effects of heat shock on PRC1/2 chromatin binding and epigenetic marks. Protein quality control in the nucleolus leads to refolding of Polycomb proteins, resulting in reinstallation of epigenetic modifications at Polycomb target genes.
Figure 6—figure supplement 1
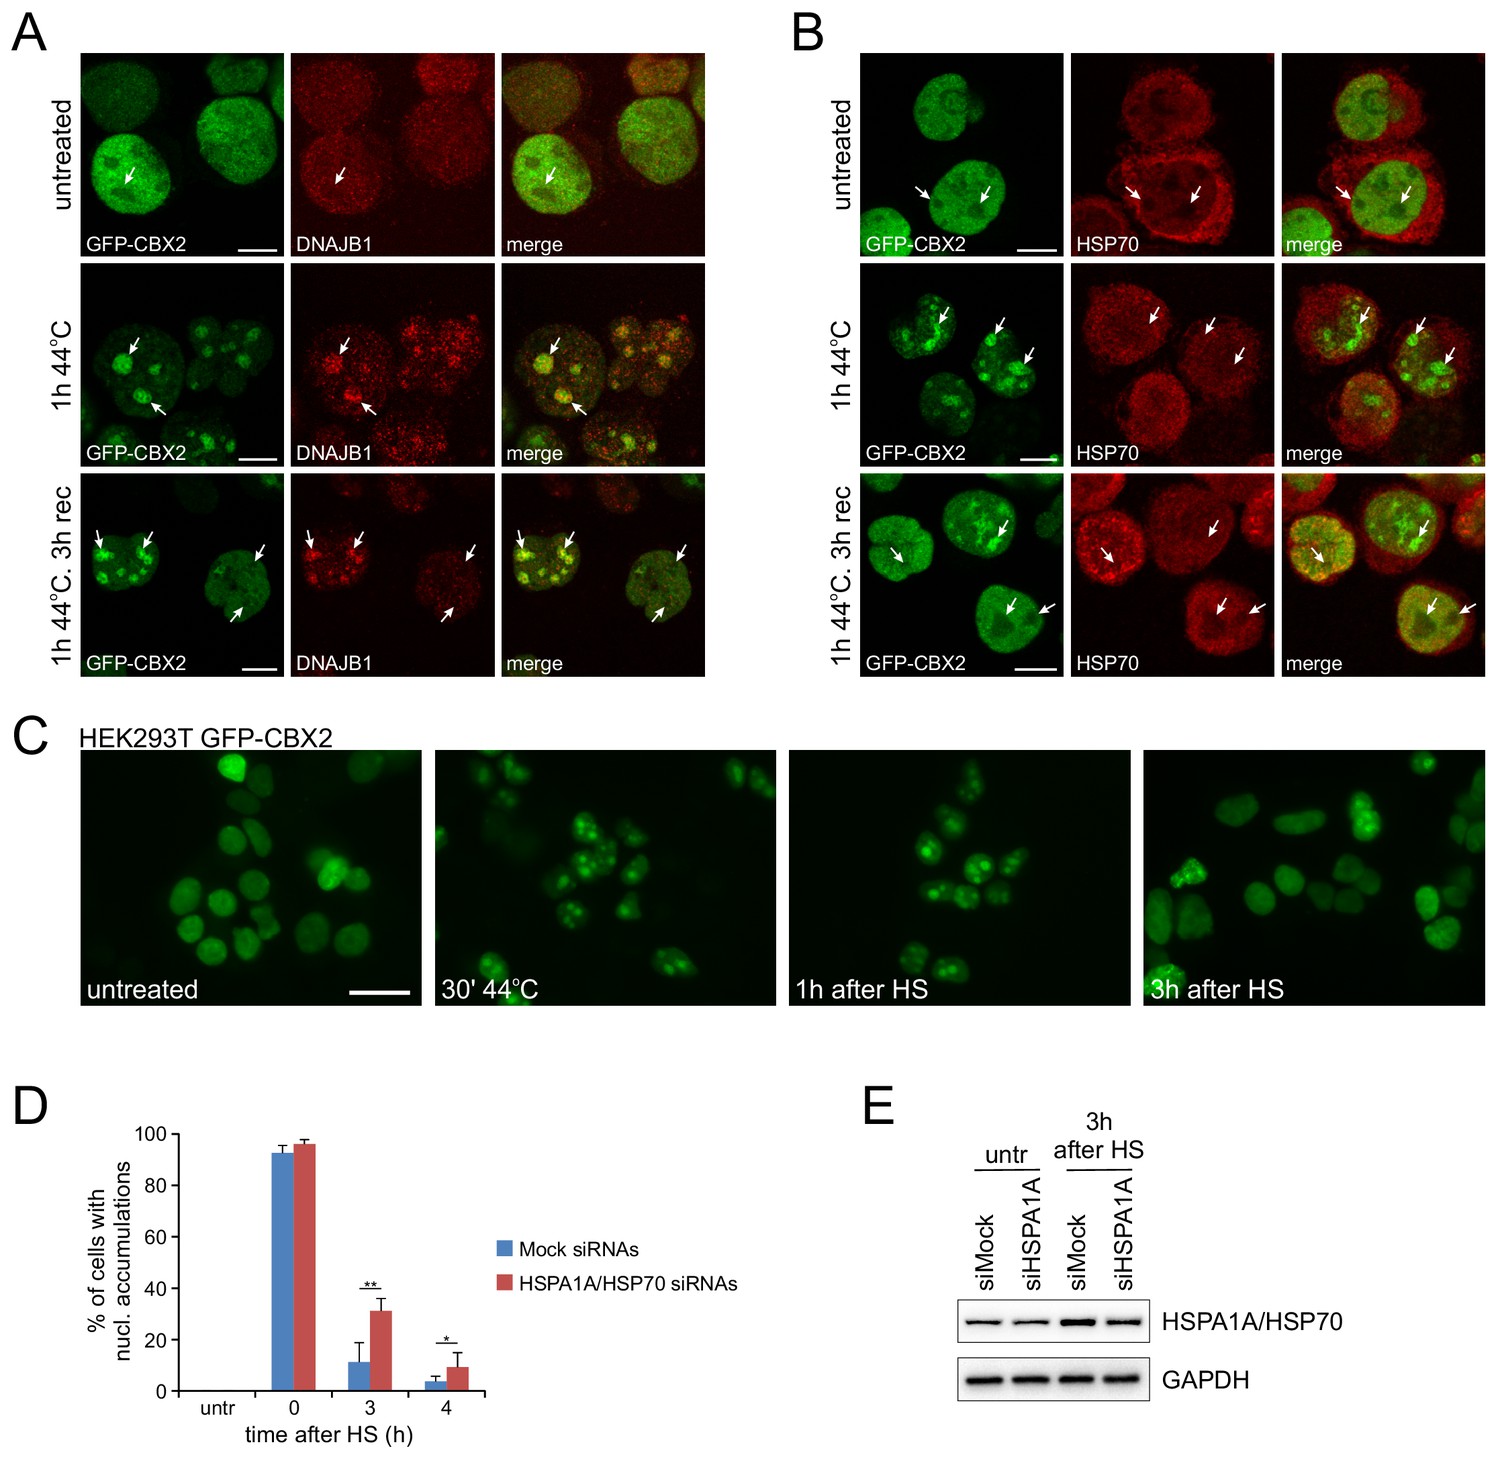
GFP-CBX2, DNAJB1 and HSP70 show comparable HS-induced relocalization kinetics and post-HS GFP-CBX2 recovery is delayed upon HSP70 knockdown.
(A) Confocal images of K562 GFP-CBX2 cells (untreated, directly after HS [1 hr, 44°C], or 3 hr after HS) stained with anti-DNAJB1. White arrows indicate the nucleoli. Scale bar represents 10 μm. (B) Confocal images of K562 GFP-CBX2 cells (untreated, directly after HS [1 hr, 44°C], or 3 hr after HS) stained with anti-HSP70. White arrows indicate the nucleoli. Scale bar represents 10 μm. (C) Fluorescent images of HEK293T GFP-CBX2 cells, either untreated, directly after HS (30’, 44°C), 1 hr after HS, or 3 hr after HS. Scale bar represents 25 μm. (D) Quantification of post-HS (30’, 44°C) GFP-CBX2 recovery in control and HSP70 siRNA transfected HEK293T GFP-CBX2 cells. Error bars indicate the mean ± SD calculated from independent microscopical images (n = 5; total cell number 175–460). Statistical analysis was performed using Student’s t-test, *p<0.05, **p<0.01. (E) Western analysis of HEK293T GFP-CBX2 cells, transfected with control or HSP70 siRNAs, both untreated and 3 hr after HS (30’, 44°C), using HSPA1A/HSP70 and GAPDH antibodies.
Figure 6—figure supplement 2
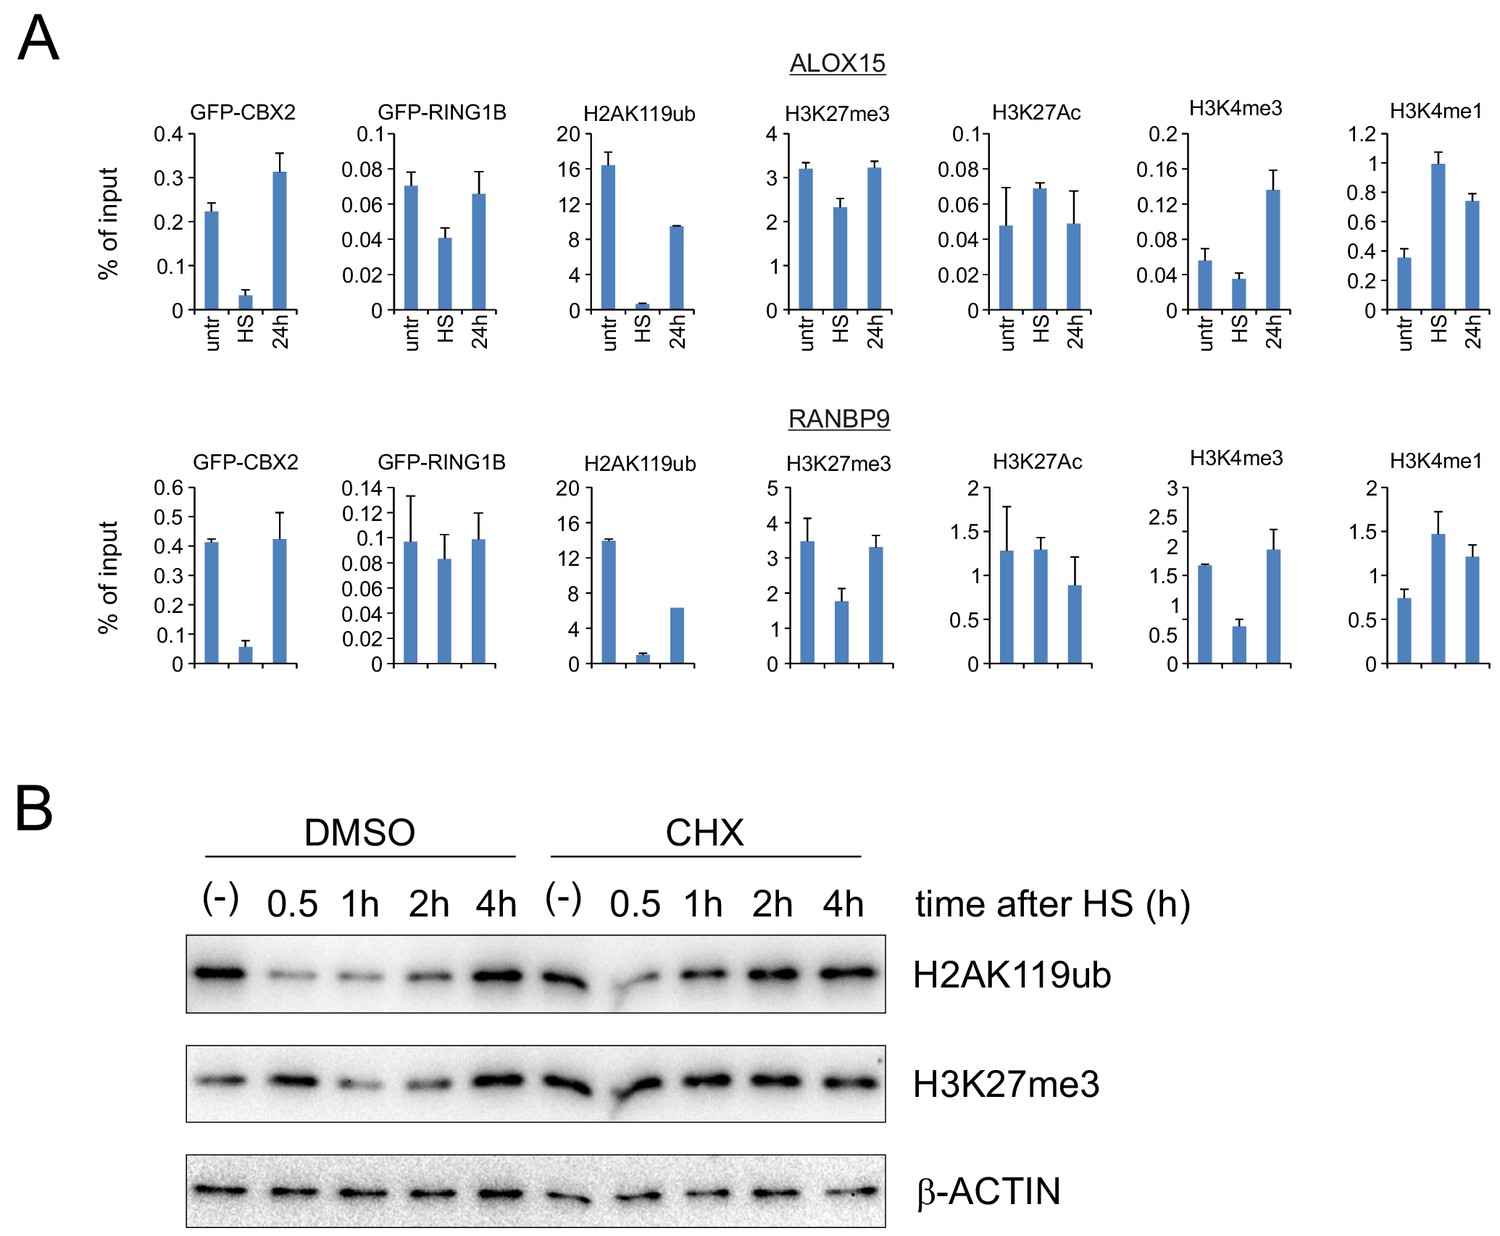
HS-induced epigenetic changes are reversible and H2AK119ub recovery is not dependent on de novo protein synthesis.
(A) ChIP-qPCR analyses of GFP-CBX2, H2AK119ub, H3K27me3, H3K4me3 and H3K4me1 levels in untreated, heat shocked (1 hr, 44°C), and 24 hr post-HS K562 cells. Error bars are calculated on the basis of technical replicates. Error bars represent mean ± SD. (B) Western analysis of H2AK119ub, H3K27me3, and β-ACTIN in untreated and heat-shocked K562 cells (30 min, 44°C) treated with DMSO or 10 μg/ml cycloheximide (CHX; 1 hr pretreatment before HS). Heat-shocked cells were isolated at the indicated time points.
Tables
Key resources table
| Reagent type (species) or resource | Designation | Source or reference | Identifiers | Additional information |
|---|---|---|---|---|
| Cell line (H. sapiens) | K562 | ATCC | CCL-243 RRID:CVCL_0004 | |
| Cell line (H. sapiens) | HL60 | ATCC | CCL-240 RRID:CVCL_0002 | |
| Cell line (H. sapiens) | HeLa | ATCC | CCL-2 RRID:CVCL_0030 | |
| Cell line (H. sapiens) | HEK293T | ATCC | CRL-3216 RRID:CVCL_0063 | |
| Transfected construct (H. sapiens) | pRRL SFFV GFP-CBX2 | van den Boom et al., 2016; PMID: 26748712 | Lentivirally transduced in K562, HeLa and HEK293T, stable cell lines | |
| Transfected construct (H. sapiens) | PC182 GFP-CBX4 | Vandamme et al. (2011); PMID: 21282530 | Retrovirally transduced, stable cell line | |
| Transfected construct (H. sapiens) | PC182 GFP-CBX6 | Vandamme et al. (2011); PMID: 21282530 | Retrovirally transduced, stable cell line | |
| Transfected construct (H. sapiens) | PC182 GFP-CBX7 | Vandamme et al. (2011); PMID: 21282530 | Retrovirally transduced, stable cell line | |
| Transfected construct (H. sapiens) | PC182 GFP-CBX8 | Vandamme et al. (2011); PMID: 21282530 | Retrovirally transduced, stable cell line | |
| Transfected construct (H. sapiens) | pRRL SFFV GFP-CBX2 (aa2-63) | This study | Lentivirally transduced, stable cell line | |
| Transfected construct (H. sapiens) | pRRL SFFV GFP-CBX2 (aa2-96) | This study | Lentivirally transduced, stable cell line | |
| Transfected construct (H. sapiens) | pRRL SFFV GFP-CBX8 (aa2-62) | This study | Lentivirally transduced, stable cell line | |
| Transfected construct (H. sapiens) | pRRL SFFV GFP-CBX8 (aa2-96) | This study | Lentivirally transduced, stable cell line | |
| Antibody | GFP | Abcam | Cat# ab290 RRID:AB_303395 | WB (1:1000); ChIP 2 μg |
| Antibody | EZH2 | Cell Signalling Technology | Cat# 5246 (D2C9) RRID:AB_2797901 | WB (1:1000);IF (1:200); ChIP 5 μg |
| Antibody | SUZ12 | Abcam | Cat# ab12073 RRID:AB_442939 | WB (1:1000) |
| Antibody | CBX4 | Merck | Cat# 09–029 RRID:AB_1977084 | WB (1:1000) |
| Antibody | CBX4 | Cell Signalling Technology | Cat# 30559 (E6L7X) RRID:AB_2798991 | IF (1:100) |
| Antibody | CBX8 | Diagenode | Cat# C15410333 RRID:AB_2801424 | ChIP 2 μg |
| Antibody | CBX8 | Cell Signalling Technology | Cat# 14696 (D2O8C) RRID:AB_2687589 | WB (1:1000); IF (1:100) |
| Antibody | BMI1 | Merck | Cat# 05–637 RRID:AB_309865 | WB (1:1000) |
| Antibody | RING1B | Abcam | Cat# ab181140 (EPR12245) RRID:AB_2801425 | WB (1:1000) |
| Antibody | Fibrillarin | Abcam | Cat# ab5821 RRID:AB_2105785 | WB (1:1000), IF (1:100) |
| Antibody | NPM1 | Thermo Fisher Scientific | Cat# 32–5200 (FC-61991) RRID:AB_2533084 | IF (1:500) |
| Antibody | DNAJB1 | Enzo Life Sciences | Cat# ADI-SPA-450 RRID:AB_10621843 | IF (1:100) |
| Antibody | DNAJB1 | Enzo Life Sciences | Cat# ADI-SPA-400 RRID:AB_10631418 | WB (1:5000) |
| Antibody | HSP70 | Enzo Life Sciences | Cat# ADI-SPA-810 RRID:AB_10616513 | WB (1:5000); IF (1:100) |
| Antibody | HSP70 | StressMarq | Cat# C92F3A-5 RRID:AB_2570713 | WB (1:1000) |
| Antibody | H3K4me3 | Diagenode | Cat# C15410003 RRID:AB_2616052 | ChIP 2 μg |
| Antibody | H3K4me1 | Diagenode | Cat# C15410194 RRID:AB_2637078 | ChIP 2 μg |
| Antibody | H3K27me3 | Diagenode | Cat# C15410195 RRID:AB_2753161 | WB (1:1000); ChIP 2 μg |
| Antibody | H3K27Ac | Diagenode | Cat# C15410196 RRID:AB_2637079 | ChIP 2 μg |
| Antibody | H2AK119ub | Cell Signalling Technology | Cat# 8240 (D27C4) RRID:AB_10891618 | WB (1:1000); ChIP 2 μg |
| Antibody | H3 | Abcam | Cat# ab1791 RRID:AB_302613 | WB (1:1000) |
| Antibody | β-Actin | Santa Cruz Biotechnology | Cat# sc-47778 (C4) RRID:AB_2714189 | WB (1:1000) |
| Antibody | GAPDH | Fitzgerald Industries International | Cat# 10R-G109A RRID:AB_1285808 | WB (1:3000) |
| Antibody | Alexa Fluor 647 goat-anti-rabbit | Thermo Fisher Scientific | Cat# A-21244 RRID:AB_2535812 | IF (1:1000) |
| Antibody | Alexa Fluor 647 goat-anti-mouse | Thermo Fisher Scientific | Cat# A-21235 RRID:AB_2535804 | IF (1:1000) |
| Antibody | Alexa Fluor 488 goat-anti-rabbit | Thermo Fisher Scientific | Cat# A-11008 RRID:AB_143165 | IF (1:1000) |
| Antibody | Alexa Fluor 488 goat-anti-mouse | Thermo Fisher Scientific | Cat# A-11001 RRID:AB_2534069 | IF (1:1000) |
| Antibody | Goat Anti-Rabbit Immunoglobulins/HRP | Agilent Dako | Cat# P044801-2 RRID:AB_2617138 | WB (1:5000) |
| Antibody | Rabbit Anti-Mouse Immunoglobulins/HRP | Agilent Dako | Cat# P026002-2 RRID:AB_2801427 | WB (1:5000) |
| Sequence- based reagent | HSPA1A siRNAs | Dharmacon | Cat# M-005168–01 | |
| Chemical compound, drug | VER-155008 | Sigma-Aldrich | Cat# SML0271 | |
| Software, algorithm | GraphPad Prism | GraphPad Prism (https://graphpad.com) | RRID:SCR_015807 | Version 7.02 |
| Software, algorithm | ImageJ | ImageJ (http://imagej.nih.gov/ij/) | RRID:SCR_003070 | |
| Software, algorithm | MaxQuant | MaxQuant (http://www.biochem.mpg.de/5111795/maxquant) | RRID:SCR_014485 | Version 1.5.2.8 |
| Software, algorithm | Perseus | Perseus (http://www.perseus-framework.org) | RRID:SCR_015753 | Version 1.5.8.5 |
Additional files
-
Supplementary file 1
Label-free quantification of proteins detected in nucleoli from untreated and heat shocked K562 cells (exp 1).
Table contains LC-MS/MS data, and label-free quantification data of identified proteins in nucleoli isolated from untreated and heat shocked K562 cells (experiment 1).
- https://doi.org/10.7554/eLife.45205.019
-
Supplementary file 2
Label-free quantification of proteins detected in nucleoli from untreated and heat shocked K562 cells (exp 2).
Table contains LC-MS/MS data, and label-free quantification data of identified proteins in nucleoli isolated from untreated and heat shocked K562 cells (experiment 2).
- https://doi.org/10.7554/eLife.45205.020
-
Supplementary file 3
Label-free quantification of proteins detected in nucleoli from untreated and heat shocked K562 GFP-CBX8 cells.
Table contains LC-MS/MS data, and label-free quantification data of identified proteins in nucleoli isolated from untreated and heat shocked K562 GFP-CBX8 cells.
- https://doi.org/10.7554/eLife.45205.021
-
Supplementary file 4
Endogenous CBX8 peaks detected in K562 cells.
Table contains positional information of identified endogenous CBX8 peaks based on CBX8 ChIP-seq data in K562 cells.
- https://doi.org/10.7554/eLife.45205.022
-
Supplementary file 5
GFP-CBX2 peaks detected in K562 GFP-CBX2 cells.
Table contains positional information of identified GFP-CBX2 peaks based on GFP-CBX2 ChIP-seq data in K562 GFP-CBX2 cells.
- https://doi.org/10.7554/eLife.45205.023
-
Supplementary file 6
Primer sequences.
Table contains sequence information of all primers used for quantitative RT-PCR and ChIP-qPCR.
- https://doi.org/10.7554/eLife.45205.024
-
Transparent reporting form
- https://doi.org/10.7554/eLife.45205.025
Download links
A two-part list of links to download the article, or parts of the article, in various formats.
Downloads (link to download the article as PDF)
Open citations (links to open the citations from this article in various online reference manager services)
Cite this article (links to download the citations from this article in formats compatible with various reference manager tools)
Protein quality control in the nucleolus safeguards recovery of epigenetic regulators after heat shock
eLife 8:e45205.
https://doi.org/10.7554/eLife.45205


