Opto-magnetic capture of individual cells based on visual phenotypes
- Maisonneuve-Rosemont Hospital, Canada
- University of Montreal, Canada
Figures
Figure 1 with 4 supplements
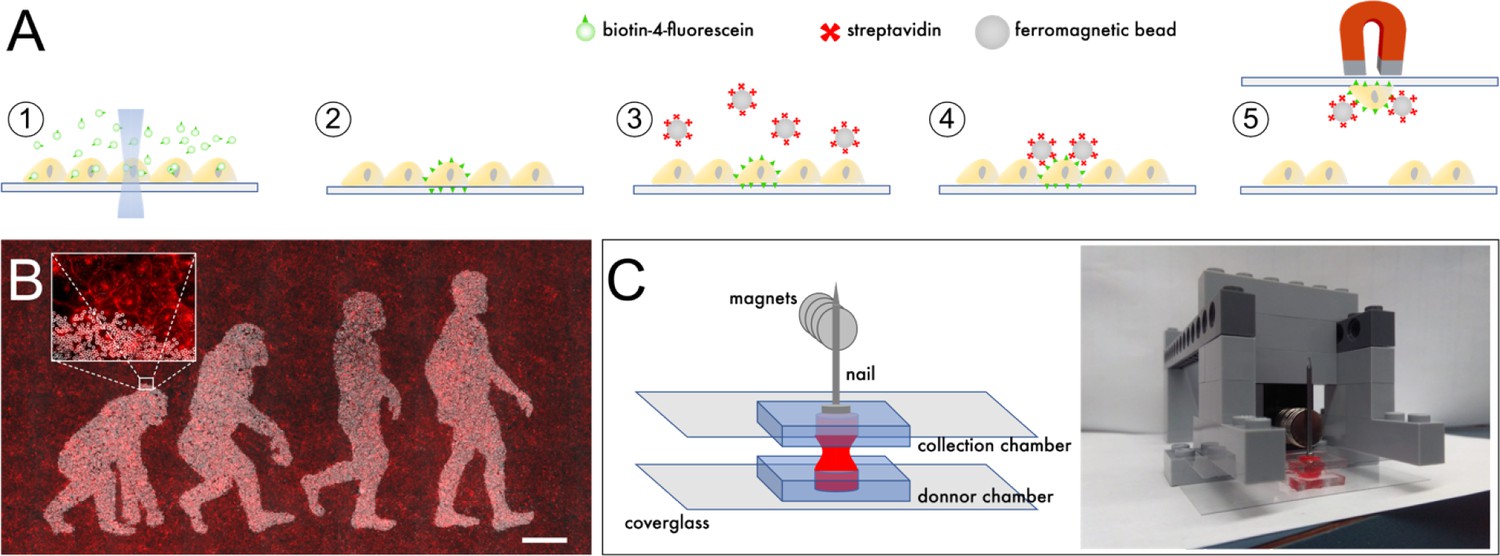
Outline of scMOCa.
(A) Biotin-4-fluorescein is crosslinked to cell membranes with a laser. Biotin-tagged cells are labeled with streptavidin-coated ferromagnetic beads and captured with a magnet. (B) Example of a confluent U2OS cell culture where only cells illuminated with the lasers of a confocal microscope are densely decorated with magnetic particles. Beads appear in white, and all cellular membranes in red, tagged with WGA-Alexa647. Scale bar: 500 µm. (C) Schematic illustrating the simple tools needed to implement the protocol. Two small cell culture chambers cast in silicone and adhered to coverglasses are positioned one on top of the other. Cells in the bottom chamber are attracted to the top collection chamber by a magnetic field. A nail is placed above the collection chamber to guide the field generated by magnets to the donor chamber in which the cell suspension is kept. The collection chamber is held between two Lego bricks, filled with a solution of Trypsin (held in place by surface tension), and then slowly approached 6 mm above the bottom chamber, at which point the two drops merge.
Figure 1—figure supplement 1
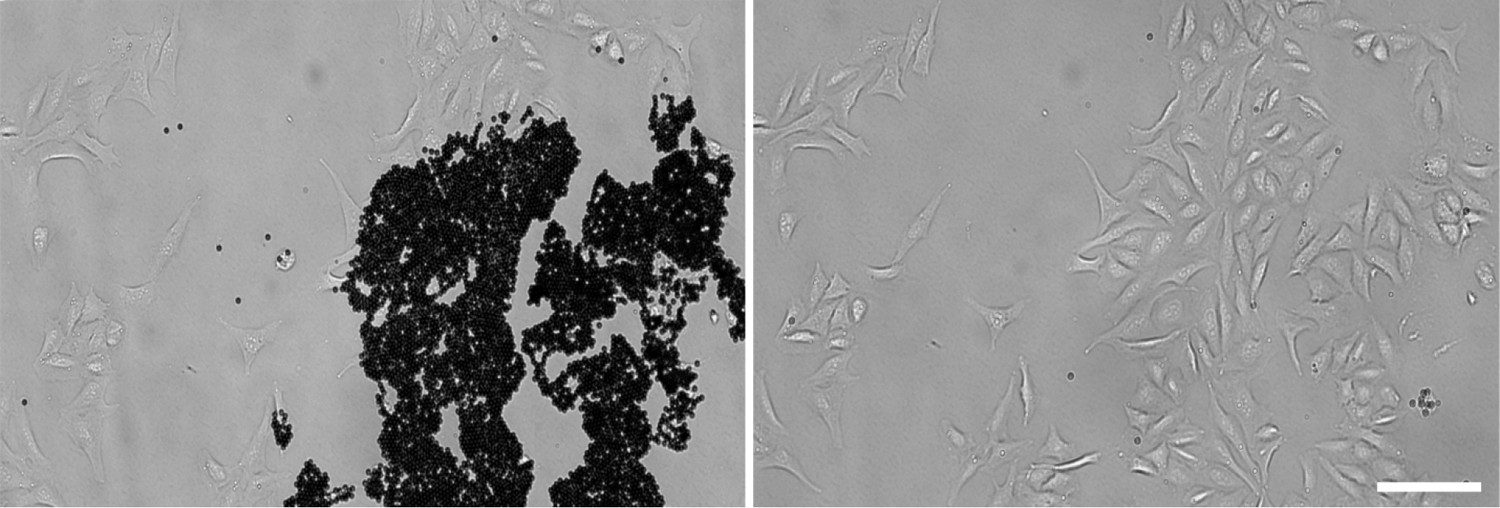
Dettachment of magnetic beads.
Left: A fraction of cells in a culture was tagged with cleavable magnetic beads using scMOCa. Right: after incubation with DNAse, beads are cleaved and cells remain free of beads. Scale bar: 200 µm.
Figure 1—figure supplement 2
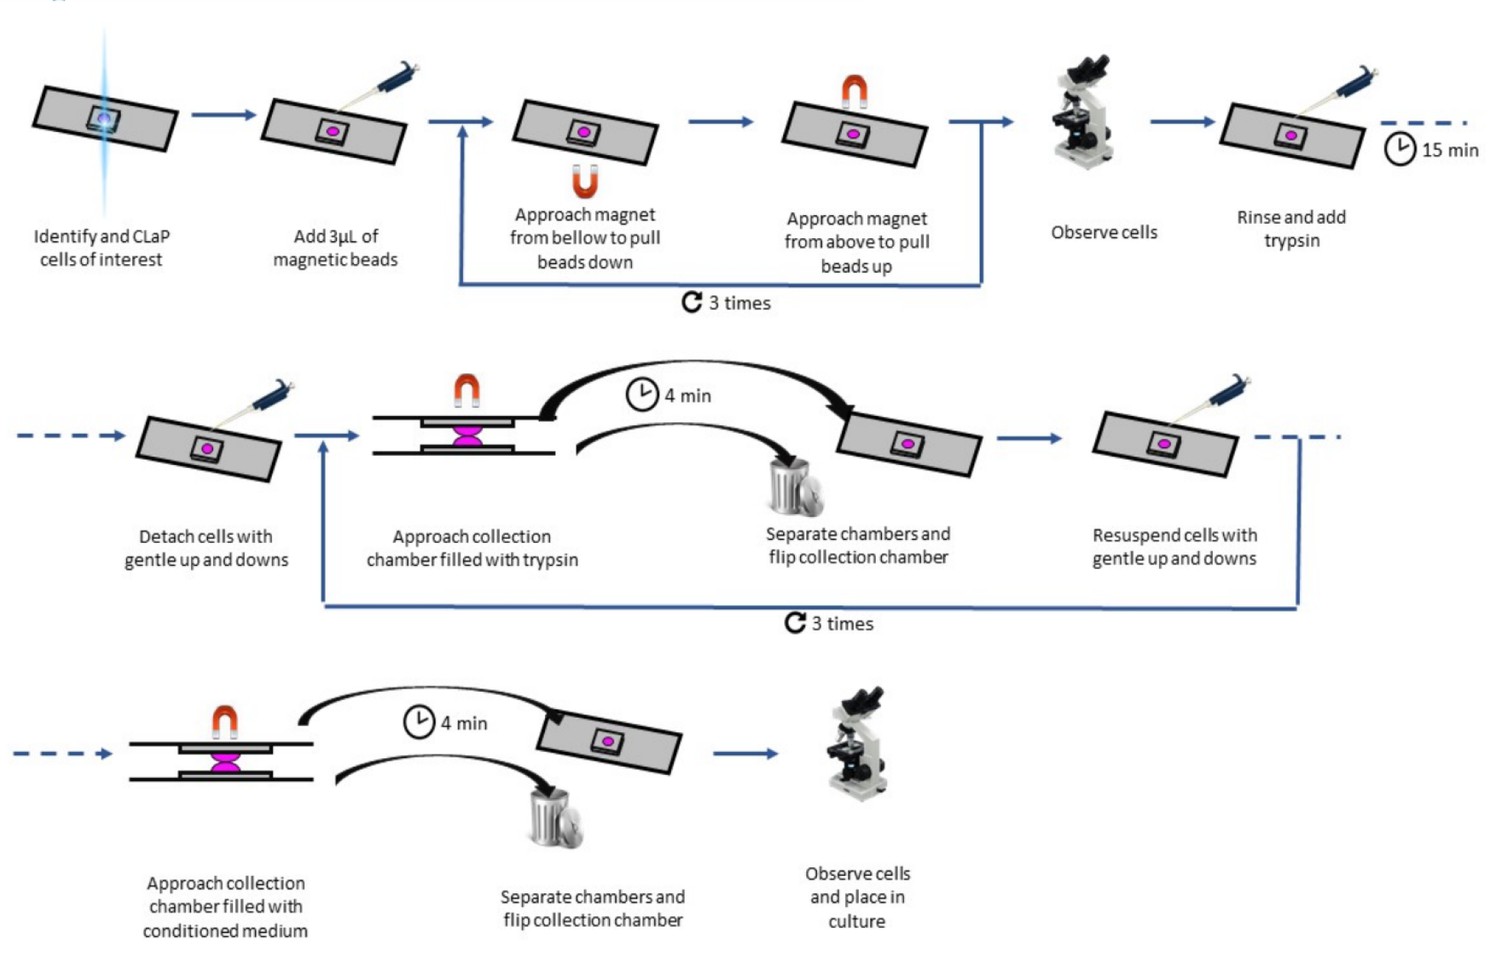
Step by step protocol to tag and isolate cells using scMOCa.
https://doi.org/10.7554/eLife.45239.005
Figure 1—figure supplement 3
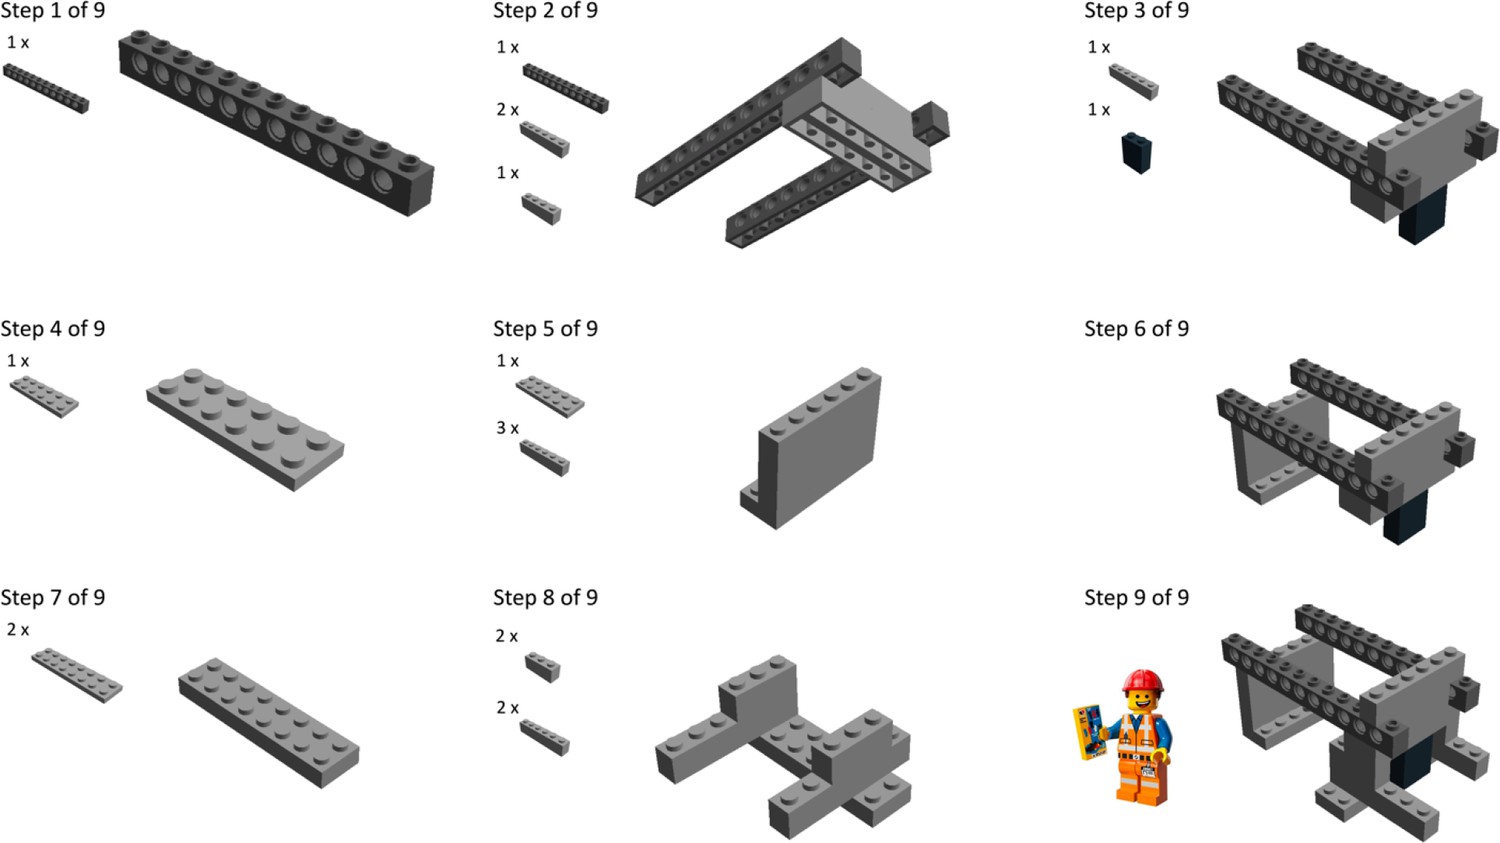
Instructions to create a simple platform to hold both chambers, the magnets and the nail.
https://doi.org/10.7554/eLife.45239.006
Figure 1—figure supplement 4
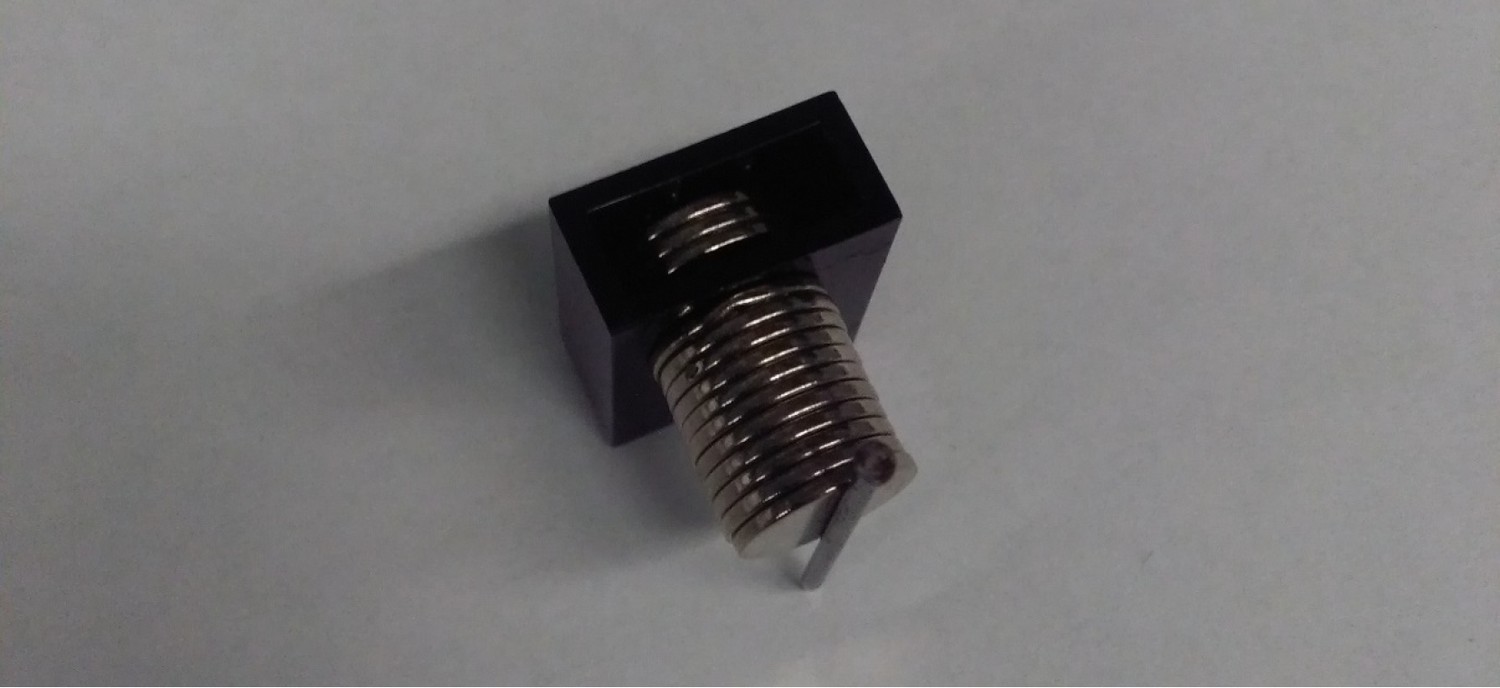
Three magnets were inserted inside a hollow Lego brick to magnetically hold the rest of the pile in position for sorting.
https://doi.org/10.7554/eLife.45239.007
Figure 2

Images of cells functionalized with magnetic beads before (left, original chamber) and after (right, collection chamber) sorting.
Beads appear in white (transmission image), and plasma membranes, tagged with WGA-Alexa555, in red (fluorescence image). Experiments were performed by tagging and sorting one cell (A) or five cells (B). In each case, it is apparent that all selected cells (left) are efficiently extracted (right) without contamination as the number of cells on the images on the right corresponds to the number of cells tagged. Tagged cells are easily recognized as they are covered with beads in both images. Scale bars: 50 µm.
Figure 3 with 1 supplement

Capture efficiency and specificity.
(A) Capture efficiency for 1, 5, 10, and 50 selected cells for a total of 27 experiments. Red dots represent experiments performed with glass as a cell culture substrate and blue dots correspond to experiments using Aclar as a substrate. The horizontal axis represents the number of target cells, considered as the number of cells illuminated with the laser. Ordinate axis shows the number of cells detected on the collection chamber after capture, and the line corresponds to 100% success rate. A linear fit of the data yielded a slope of 0.99, demonstrating that scMOCa is highly efficient in retrieving all target cells, after testing 1 to 50 cells. (B, C) Mouse (fluorescent) and dog (non-fluorescent) cell lines were co-cultured and only dog cells were illuminated and captured. PCR on a mitochondrial gene shows that all extracted cells form a pure sample and are exclusively dog cells. Table C shows the number of cells detected in each condition in three repeats of the experiment. These numbers are calculated from the amount of detected DNA normalized to the expected amount in one cell. A and B are independent experiments in which two different dishes were prepared, tagged and sorted prior to PCR.
Figure 3—figure supplement 1
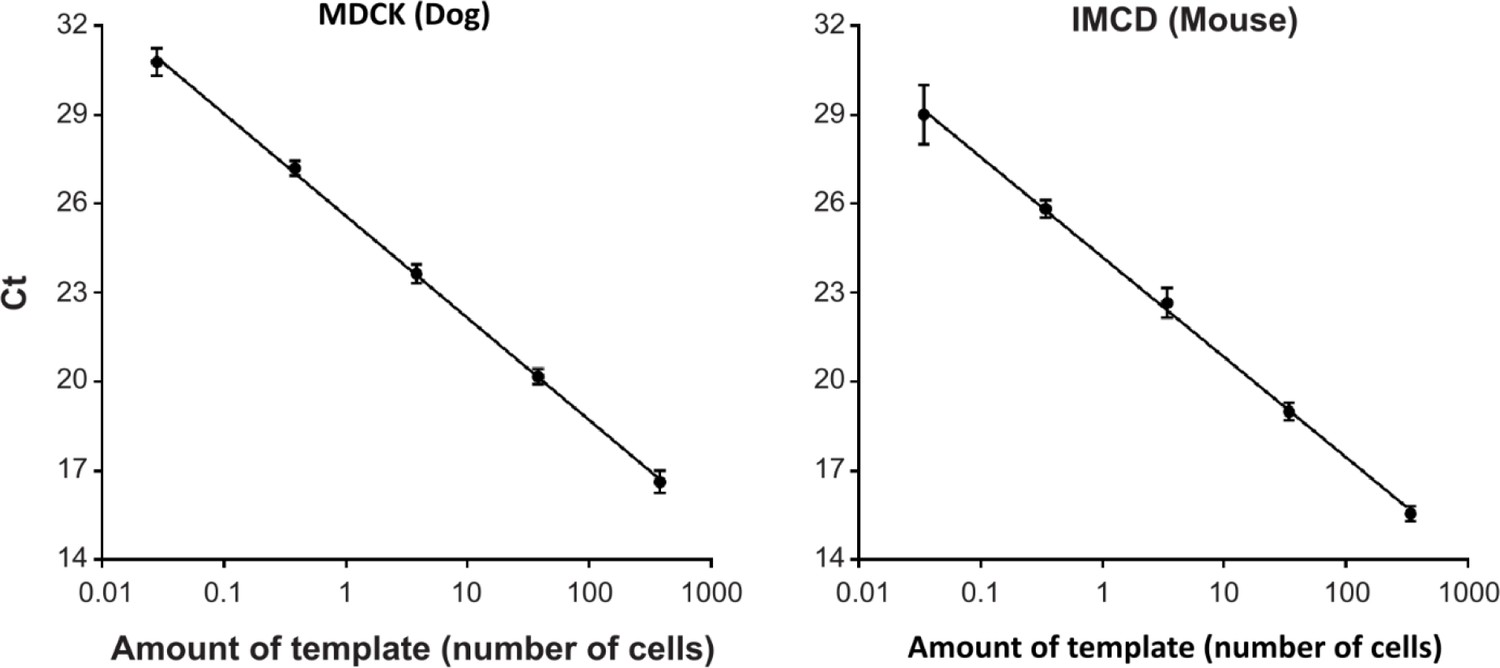
Calibration curves used to calculate the number of cells from qPCR product.
Abscises values are in the range of 1/100th of a cell to 100 cells which highlight that our experimental conditions allow detection of an amount of DNA corresponding to less than a cell.
Figure 4
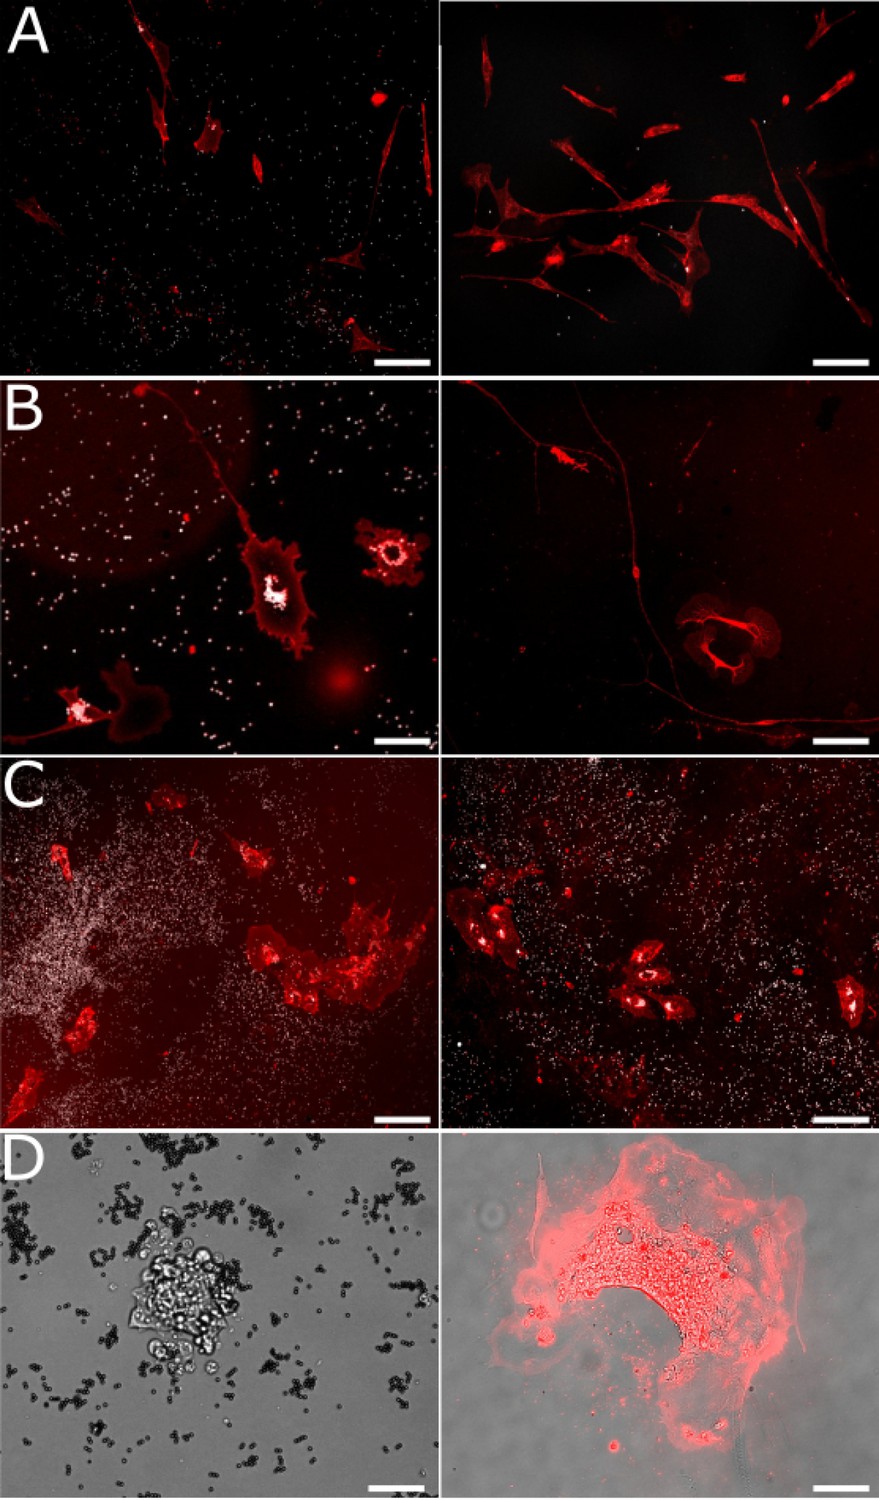
Cells remain viable and proliferate after capture.
Images showing scMOCa-captured cells stained with WGA-Alexa-647. (A) LF-1 fibroblasts 1 (left) and 4 (right) days after sorting. Scale bar 80 µm. (B) Primary DRG neurons 2 (left) and 4 (right) days after sorting. Scale bars: 25 µm (left) and 80 µm (right) (C) HUVECs 3 (left) and 6 (right) days after sorting. Scale bar: 80 µm. (D) Mouse embryonic stem cells 7 days after sorting (left) and 5 days after starting differentiation (15 days after sorting) (right). Prior to differentiation, only a bright-field image is shown to preserve cell viability. After differentiation, we stained cells with WGA-Alexa647, and merged the image with a bright-field photo to increase contrast and better see cellular extensions. Scale bar: 40 µm.
Figure 5
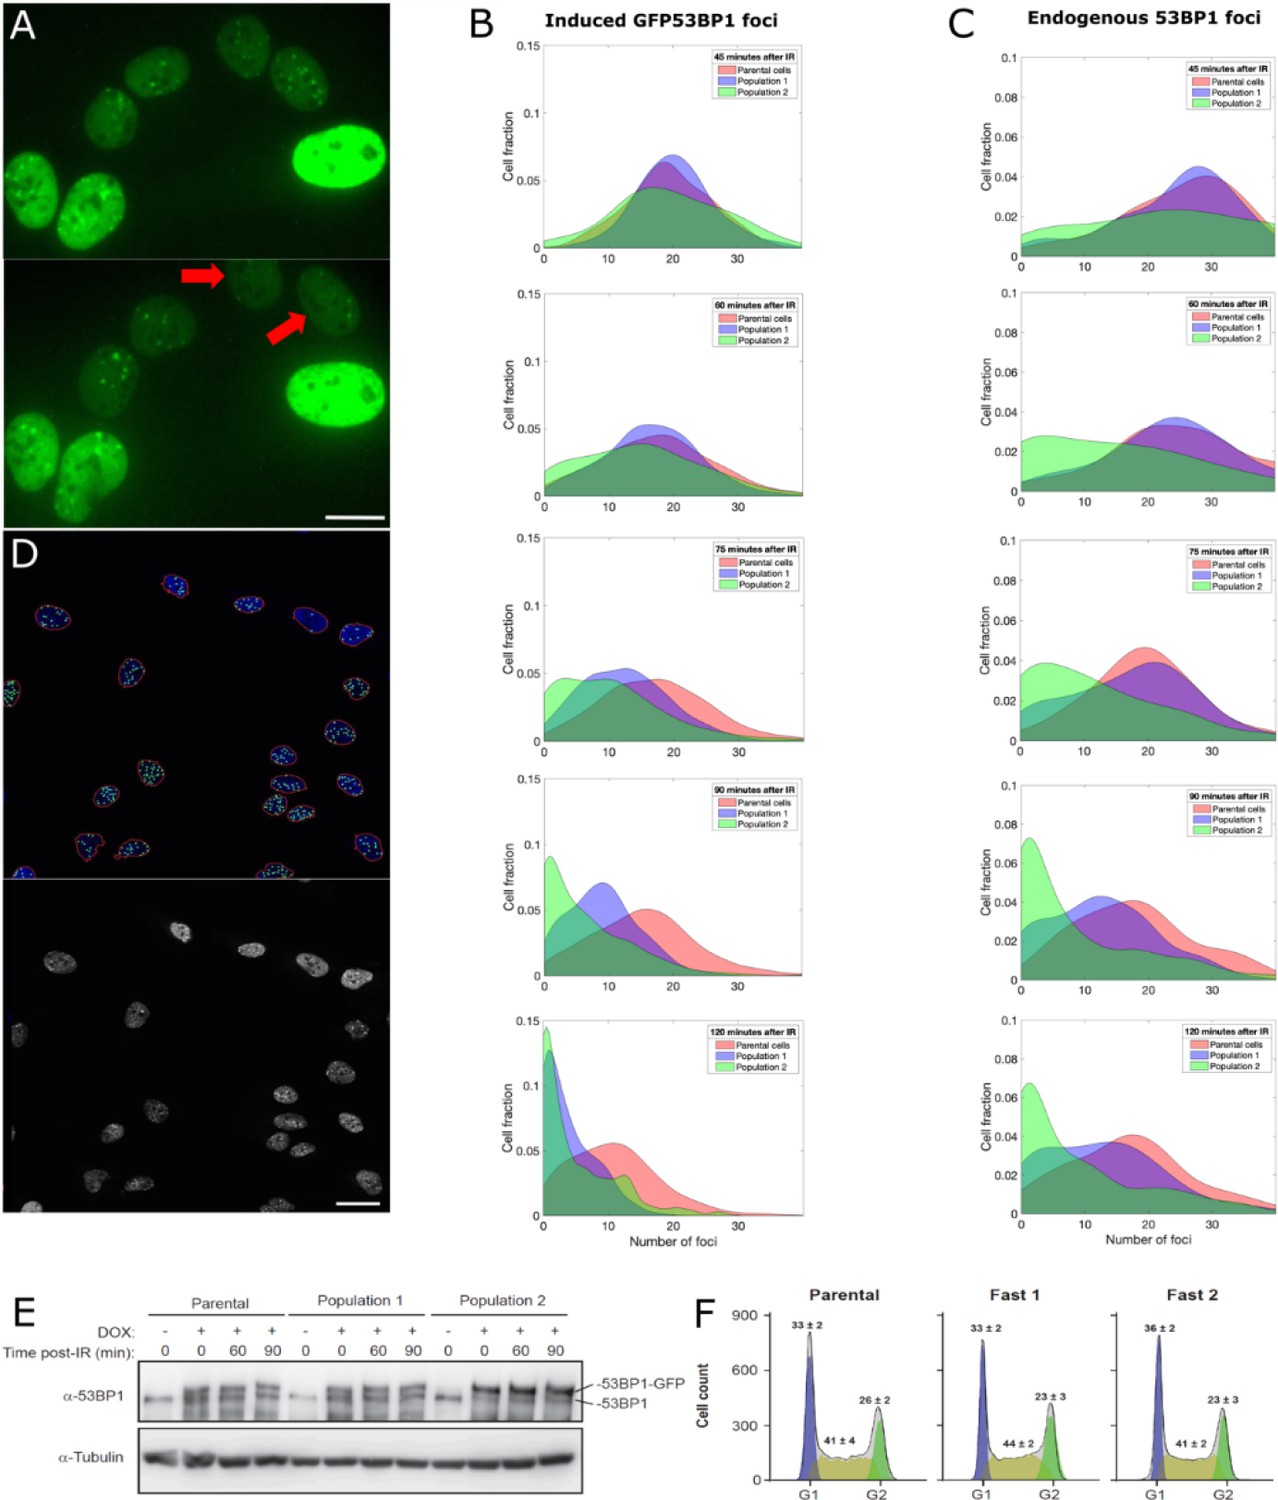
Capture and expansion of individual cells that differ in their capacity to resolve ionizing radiation-induced 53BP1 foci.
(A) Nuclei from irradiated cells 40 min (top) and 90 min (bottom) post-irradiation. Two cells (red arrows) resolved 53BP1 foci more rapidly and were selected for capture. Scale bar: 14 µm. (B, C) Smoothed normalized histograms showing the fraction of cells detected as a function of the number of induced GFP-53BP1 (B) or endogenous 53BP1 (C) foci for five time points. Sorted Populations #1 and #2 resolve foci faster than their parental counterpart as illustrated by the more rapid shift toward the left (zero foci per cell) observed for these two populations. (D) Illustration of automatic nuclei segmentation and detection of foci (top) and source image (bottom). Objects detected as nuclei are circled in red, segmented foci appear as green circles. Scale bar 25 µm. (E) Immunoblot showing the amount of 53BP1 at 0, 60, 90 min post-irradiation in doxycycline induced cells (+) and non-induced cells (-). 53BP1 levels are not altered in Populations #1 or #2 compared to the parental cells. (F) Cell cycle profiles of U2OS GFP-53BP1 parental cell lines and two extracted populations. Cultures were induced with Dox for 48 hr and cell cycle was analyzed by DNA content flow cytometry (see Material and methods). Values represent the means ± SEM of three independent experiments. All focus quantification graphs represent the average of 3 experiments, where in each case at least 200 cells were scored.
Figure 6 with 1 supplement
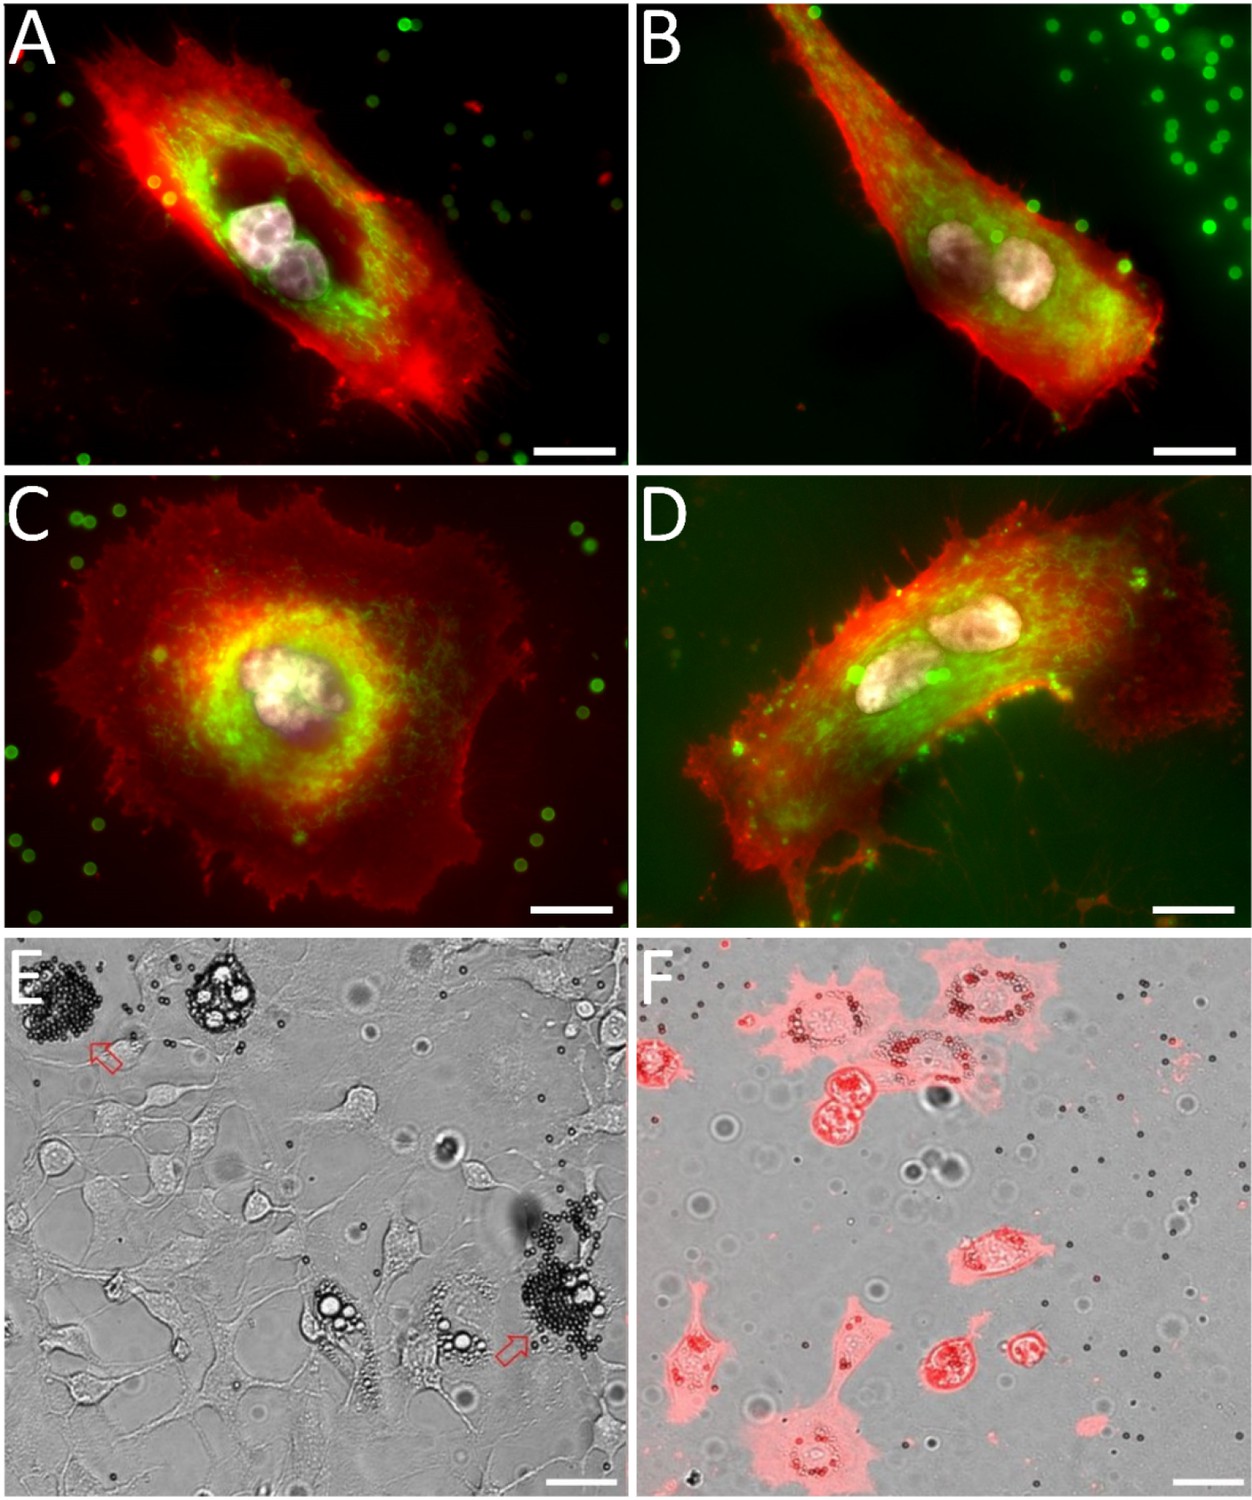
Examples of sorted multinucleated H226 cells (A, C) 1 and 2 (B, D) days after scMOCa.
Active mitochondria (Mitotracker) appear in green, plasma membrane (WGA-Alexa 647) in red, an nuclei (Hoechst) in white. Scale bar: 15 µm. (E) 3T3 cell population partially differentiated into adipocytes. Two cells (pointed by arrows) have been tagged with magnetic beads. Three other cells are also differentiated in adipocytes in this field of view but were not selected. (F) Cells were captured using scMOCA and kept in culture for 6 days before imaging. Cells were stained with WGA-Alexa 647 to highlight membranes. Small black circles are magnetic beads while lipid vesicles appear as small clear circles. Scale bar: 30 µm.
Figure 6—figure supplement 1
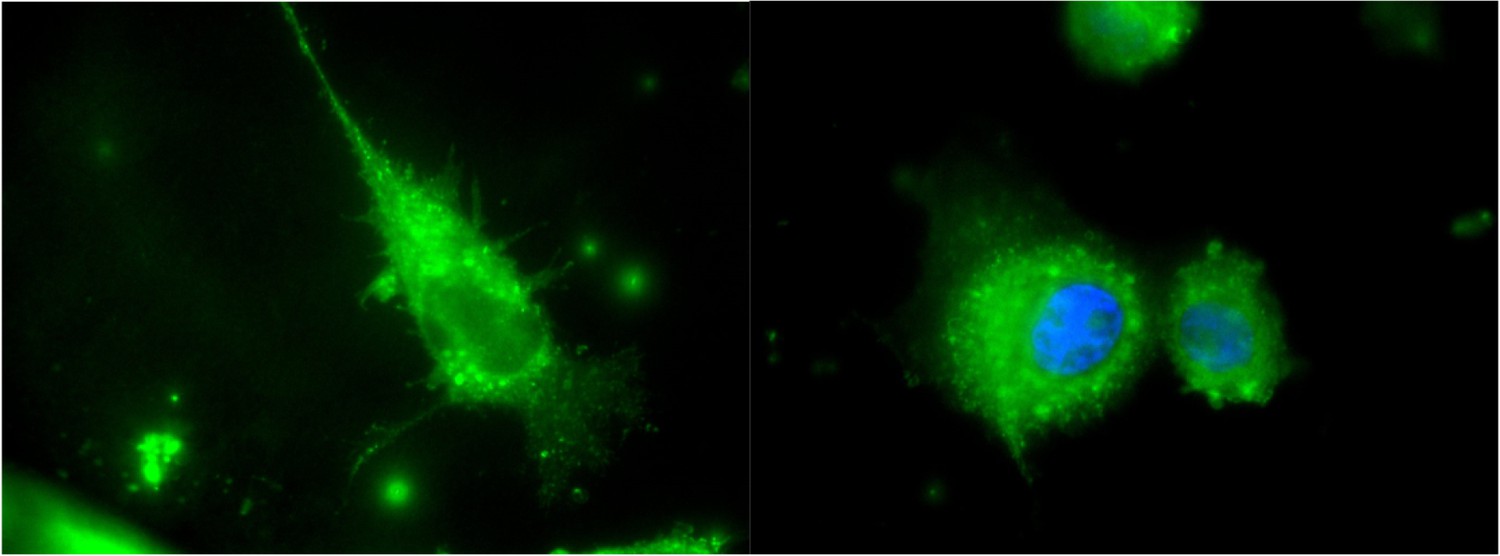
Two examples of cells that were killed with sodium azide then stained with mitotracker green and Hoechst.
This negative control confirms the cells shown in Figure 6 are live cells. When cells are alive, mitotracker green stains filament shaped mitochondria, whereas when cells are dead, the spotty signal it generates is distributed everywhere within the cytoplasm.
Tables
Key resources table
| Reagent type (species) or resource | Designation | Source or reference | Identifiers |
|---|---|---|---|
| Cell line (Homo sapiens) | U2OS | ATCC | RRID: CVCL_0042 |
| Cell line (Canis familiaris) | MDCK | ATCC | RRID: CVCL_0422 |
| Cell line (Mus musculus) | IMCD | ATCC | RRID: CVCL_0429 |
| Cell line (Homo sapiens) | h226 | ATCC | RRID: CVCL_1544 |
| Cell line (Homo sapiens) | LF-1 | Dr John Sedivy | RRID: CVCL_C120 |
| Cell line (Homo sapiens) | HUVECS | ATCC | TCC PCS-100–013 |
| Cell line (Mus musculus) | 3t3-L1 | ATCC | RRID:CVCL_0123 |
| Chemical compound, drug | IMBMX | Sigma-aldrich | cat #: I5879-100MG |
| Chemical compound, drug | Dexamethasone | Sigma-aldrich | cat #: D1756-25MG |
| Chemical compound, drug | Magnetic beads | Thermofisher | cat #: 65305 |
| Chemical compound, drug | b4f | Sigma-aldrich | cat #:B9431-5MG |
| Commercial assay or kit | 2X SYBR Green Master Mix | Bimake | cat #: B21203 |
| Antibody | Rabbit anti-53BP1 | Santa-cruz | cat #: sc-22760 |
| Antibody | Rat anti-tubulin | Abcam | cat #: ab6161 |
Additional files
-
Transparent reporting form
- https://doi.org/10.7554/eLife.45239.015
Download links
A two-part list of links to download the article, or parts of the article, in various formats.
Downloads (link to download the article as PDF)
Open citations (links to open the citations from this article in various online reference manager services)
Cite this article (links to download the citations from this article in formats compatible with various reference manager tools)
Opto-magnetic capture of individual cells based on visual phenotypes
eLife 8:e45239.
https://doi.org/10.7554/eLife.45239


