Transcriptional control of subtype switching ensures adaptation and growth of pancreatic cancer
- University of California, San Francisco, United States
- Harvard Medical School, United States
Figures
Figure 1 with 2 supplements

Expression and activity of GLI proteins is anti-correlated with Hh ligand levels in PDA.
(A) Immunoblots showing expression of the indicated proteins in 14 human PDA cell lines. Cell lines denoted with an asterisk represent GLIhi/Hhlo lines. (B) The indicated cell lines were transfected with the 8 × 3’Gli-binding site luciferase plasmid and luciferase activity was measured 48 hr post-transfection. For each box-and-whisker plot, center asterisk indicates the mean of n = 3 experiments with a total of 10 independently transfected cultures for each cell line. (C) GLI activity as measured by GLI luciferase assay (B) is anti-correlated with SHH protein levels (A). Linear regression line is shown in red along with corresponding statistics. (D,E) High expression of GLI2 predicts shorter overall (D: left; GLI2 high n = 147, GLI2 low n = 38) and disease-free (D: right; GLI2 high n = 114, GLI2 low n = 27) survival while high SHH expression predicts extended disease-free survival (E: SHH high n = 11, SHH low n = 130) for patients with PDA from The Cancer Genome Atlas (TCGA). Data from 185 patients. p-Value calculated by Log-rank test.
-
Figure 1—source data 1
GLI proteins are expressed in basal-like PDA.
- https://doi.org/10.7554/eLife.45313.005
Figure 1—figure supplement 1
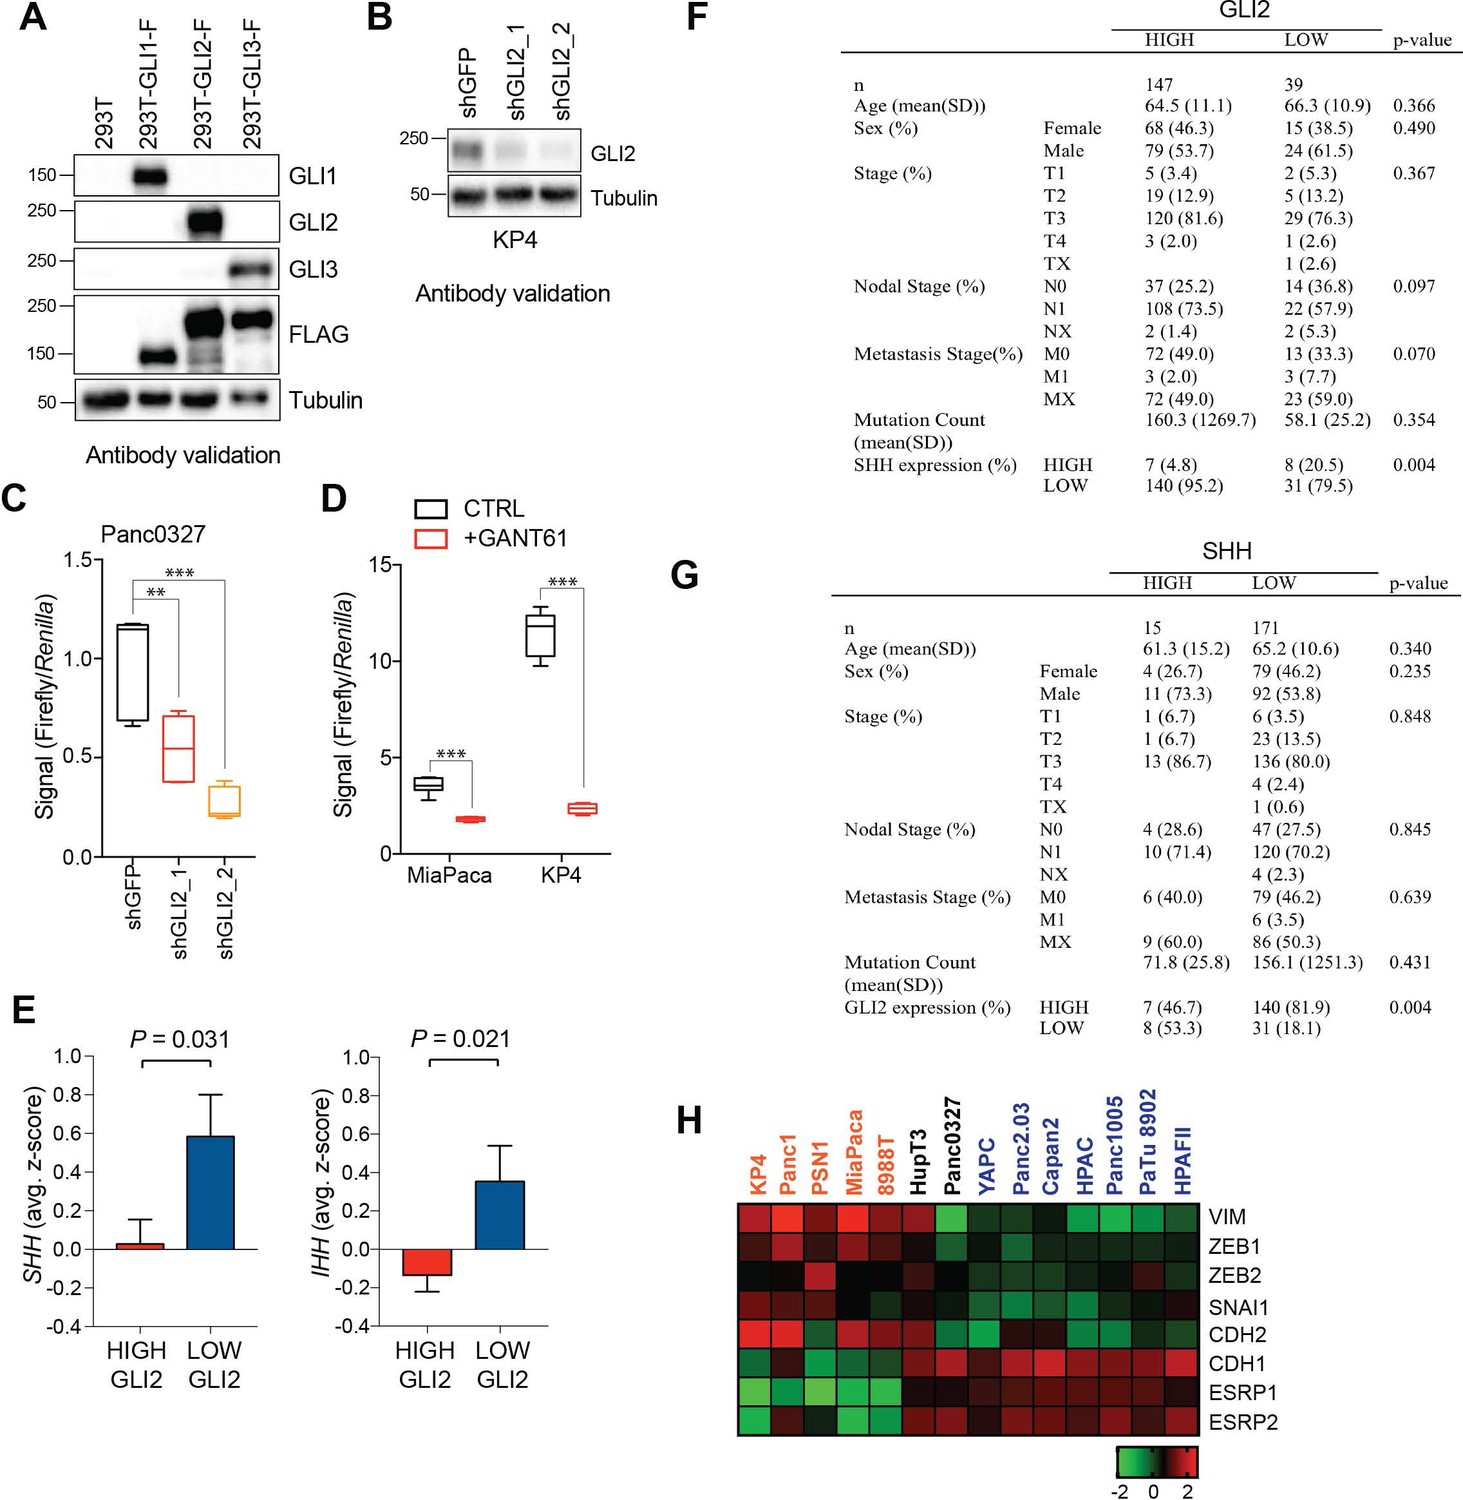
GLI proteins are expressed in basal-like PDA.
(A) Lysates from 293 T cells transiently transfected with Flag tagged GLI constructs were probed with GLI-specific antibodies as indicated. (B) Immunoblot showing loss of the GLI2-specific band following knockdown of GLI2 with two distinct shRNA constructs in KP4 cells. (C,D) GLI luciferase activity in Panc0327 cells following shRNA-mediated knockdown of GLI2 (C) and in MiaPaca and KP4 cells following treatment with 5 μM GANT61 for 3 days (D). p-Values were calculated by two-tailed unpaired t test. *p<0.05; **p<0.01; ***p<0.001. (E) Comparison of SHH (left) and IHH (right) mRNA expression in RNA-seq data from TCGA PDA tumors binned into GLI2 high (n = 51) and GLI2 low (n = 41) groups. (F,G) Demographic and clinical information stratified by GLI2 (high: z > −1) (F), and stratified by SHH (high: z > 2) (G). (H) mRNA expression of epithelial to mesenchymal transition (EMT) markers as indicated. Data corresponds to Figure 2A.
Figure 1—figure supplement 2
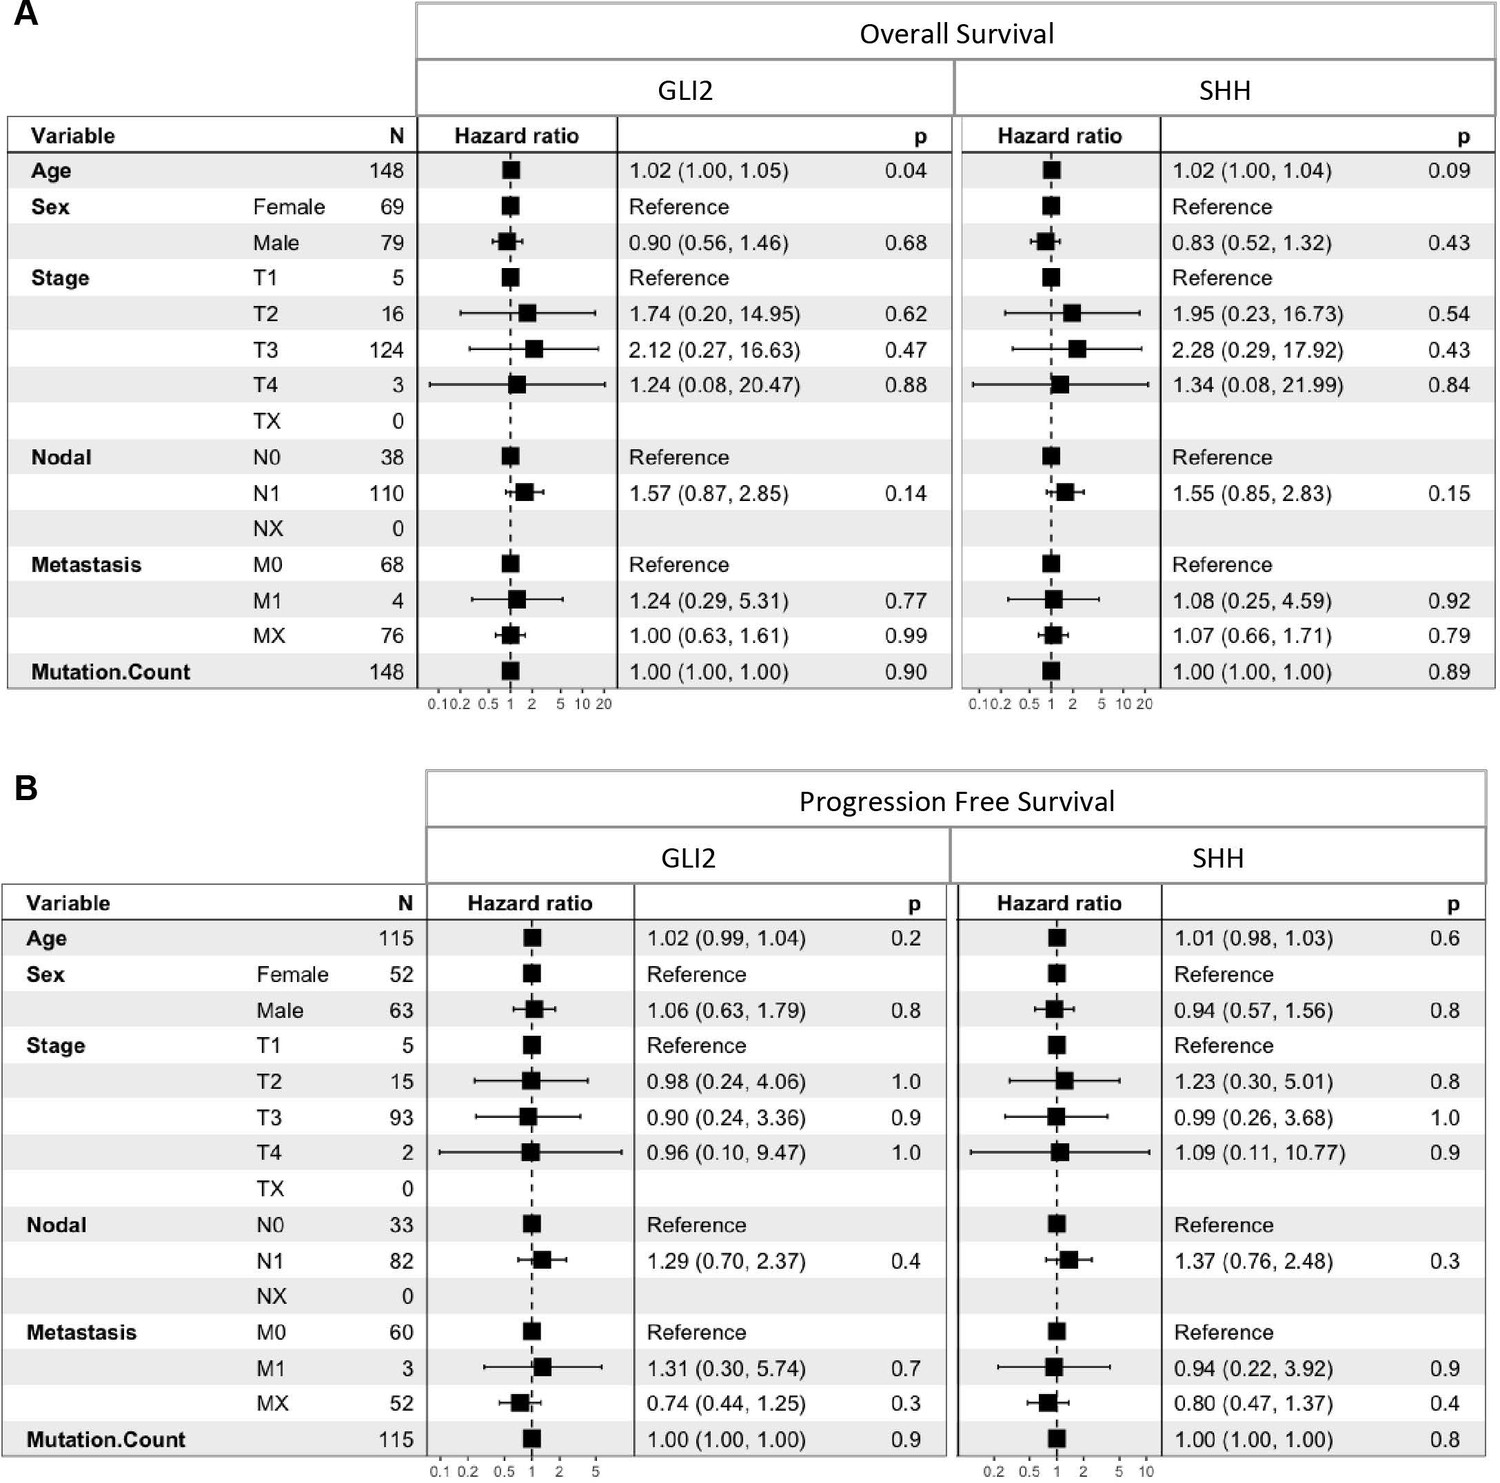
Cox proportional hazards regression models for predictors of overall survival and progression-free survival.
(A) Cox regression model for overall survival stratified by GLI2 and SHH expression reveals age at diagnosis as a significant predictor of overall survival in GLI2 high samples while no covariates are significant predictors of overall survival in SHH high samples (B) Cox regression model for progression free survival stratified by GLI2 high and SHH high reveals no covariates as significant predictors. Differences in sample sizes (n) attributed to missing clinical data.
Figure 2
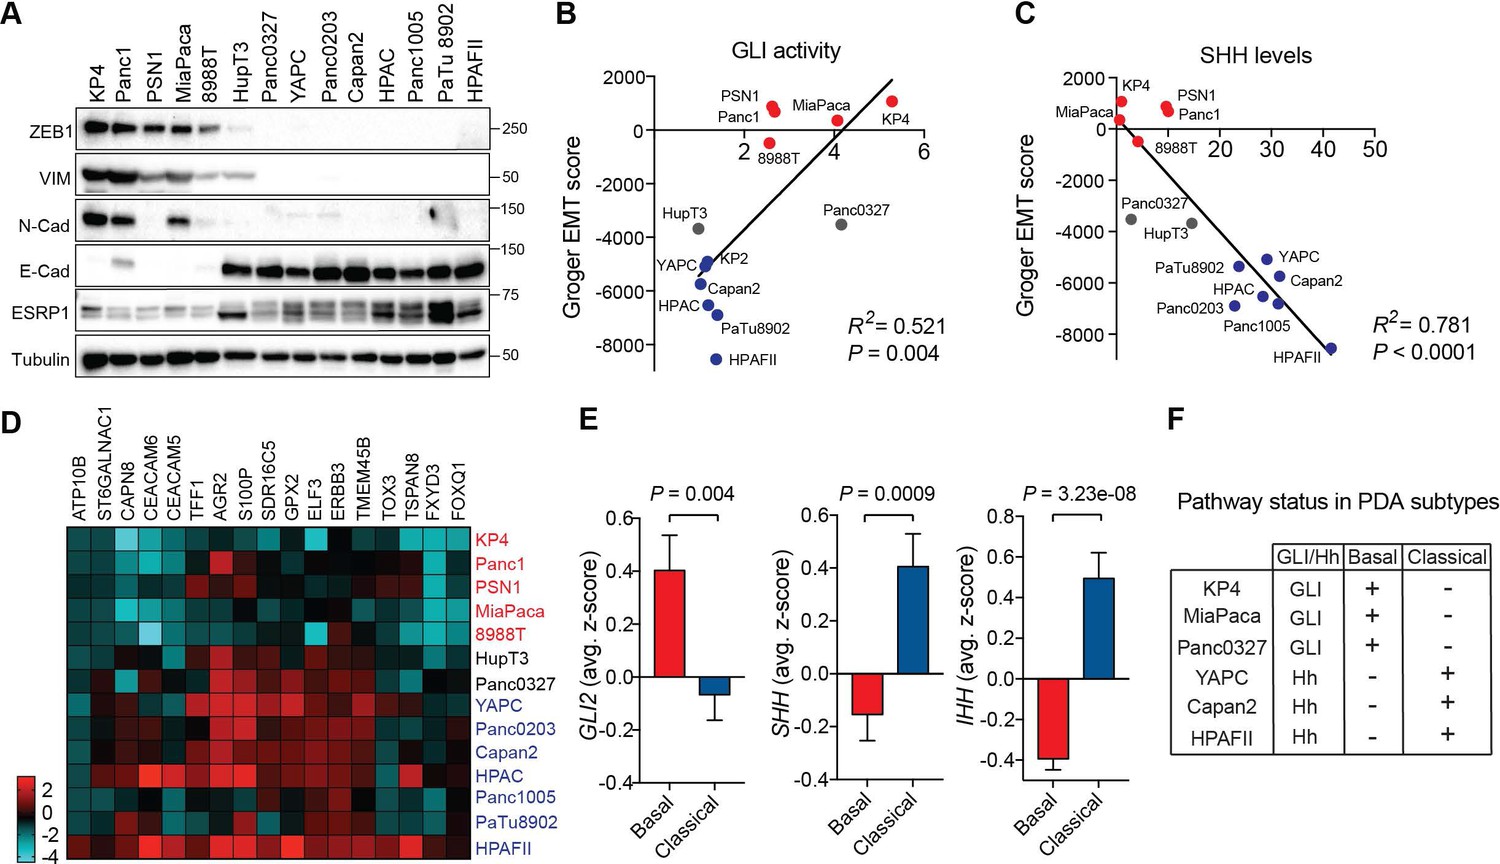
GLI expression and activity correlates with EMT and the basal-like subtype of PDA.
(A) Human PDA cell lines segregate into two groups based on protein expression of EMT associated markers as indicated. Mesenchymal markers (ZEB1, VIM, N-Cadherin), epithelial markers (E-Cadherin, ESRP1). (B,C) GLI activity (B) as measured by GLI luciferase assay and SHH protein levels (see Figure 1) (C) correlated to EMT score. Linear regression line is shown in red along with corresponding statistics. Epithelial cell lines are indicated in blue, and mesenchymal cell lines are indicated in red. Intermediate lines are indicated in grey. (D) mRNA expression of the classical subtype gene set (see Materials and methods) across 14 human PDA cell lines. Epithelial cell lines (blue) express higher levels of the classical gene program. (E) Expression of Hh pathway components correlates with PDA subtypes. GLI2 mRNA expression is higher in TCGA PDA samples (n = 149) classified as basal-like (n = 65), while SHH and IHH expression is higher in samples classified as classical (n = 84). Bar represents average normalized z-score. (F) Table outlining the relationship between GLI and Hh expression to PDA subtypes in PDA human cell lines.
-
Figure 2—source data 1
GLI expression and activity correlates with EMT and the basal-like subtype of PDA.
- https://doi.org/10.7554/eLife.45313.007
Figure 3 with 1 supplement
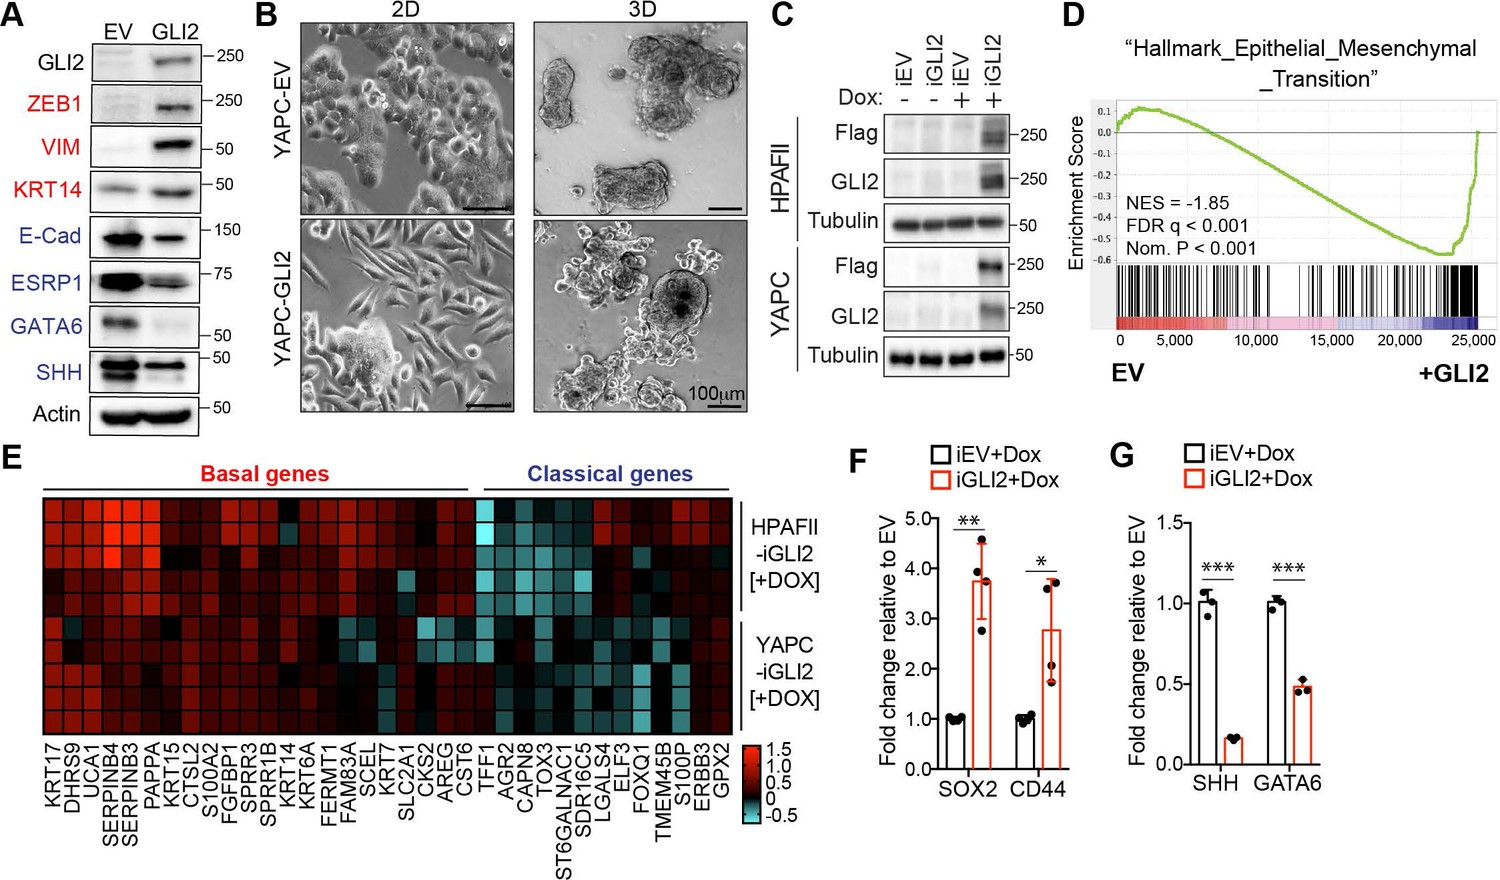
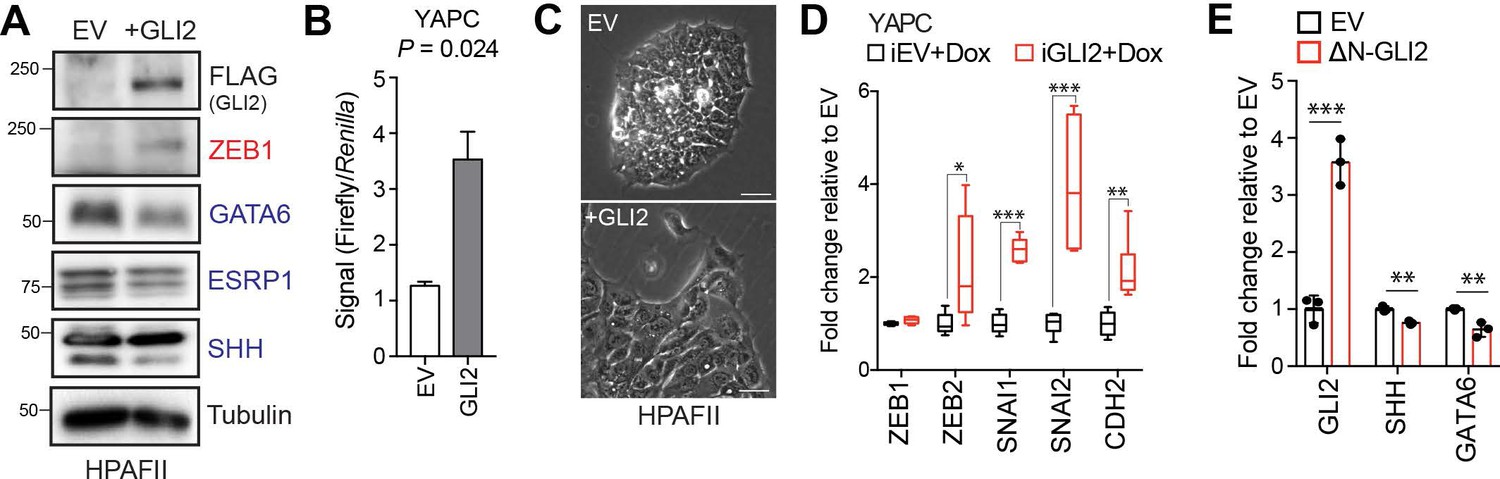
GLI2 is sufficient to drive basal-like subtype switching.
(A) Immunoblot shows expression of the indicated proteins in YAPC cells stably expressing empty vector (EV) or Flag-tagged GLI2 (GLI2). (B) Images show the effect of stable expression of Flag-tagged GLI2 in YAPC cells on morphology when grown in 2D (left) and as 3D cultures (right). Note the switch to a mesenchymal phenotype in the GLI2-expressing cells. Scale bars, 100 μm. (C) Immunoblot shows GLI2 induction in HPAFII- and YAPC-iGLI2 cells following treatment with Dox. (D) Gene set enrichment analysis (GSEA) of RNA-sequencing data shows significant enrichment of the ‘Hallmarks_Epithelial_Mesenchymal_Transition’ gene set in YAPC-iGLI2 cells treated with 1 μg/ml Dox for 6 days to induce expression of GLI2, compared to identically treated YAPC-iEV control cells, (n = 3). (E) Heatmap shows expression of basal-like (red) and classical (blue) subtype associated genes determined by qRT-PCR following 1 μg/ml Dox treatment of replicate HPAFII-iGLI2 (top) and YAPC-iGLI2 (bottom) cells for 3 days. Values from n = 5 replicates per cell are normalized to gene expression in identically treated iEV control cells and log10 transformed. (F,G) Graph shows the effect of GLI2 induction in YAPC-iGLI2 cells treated with 1 μg/mL Dox for 3 days on SOX2 and CD44 (F) and SHH and GATA6 (G) mRNA expression, displayed as fold change normalized to identically treated iEV control cells, (data represent n = 3 experiments). p-Values were calculated by two-tailed unpaired t test. *p<0.05; **p<0.01; ***p<0.001.
-
Figure 3—source data 1
GLI proteins promote the basal-like phenotype.
- https://doi.org/10.7554/eLife.45313.010
Figure 3—figure supplement 1
GLI proteins promote the basal-like phenotype.
(A) Immunoblot of HPAFII cells stably expressing empty vector (EV) or Flag-tagged GLI2 (+GLI2). (B) Luciferase assay measuring GLI activity in YAPC cells ectopically expressing EV or Flag-tagged GLI2 (GLI2). (C) Effect of ectopic GLI2 expression on morphology of HPAFII cells relative to EV control cells. Scale bar = 50 μm. (D) Graph shows mRNA levels of the indicated genes following Dox induced expression of GLI2 in YAPC-iGLI2 cells after 3 days. Values represent fold change normalized to identically treated iEV control cells, (n = 3). (E) Effect of stable over-expression of ΔN-GLI2 in YAPC cells on GLI2, SHH and GATA6 mRNA levels, displayed as fold change normalized to EV control cells. p-Values were calculated by two-tailed unpaired t test. *p<0.05, **p<0.01, ***p<0.001.
Figure 4 with 1 supplement
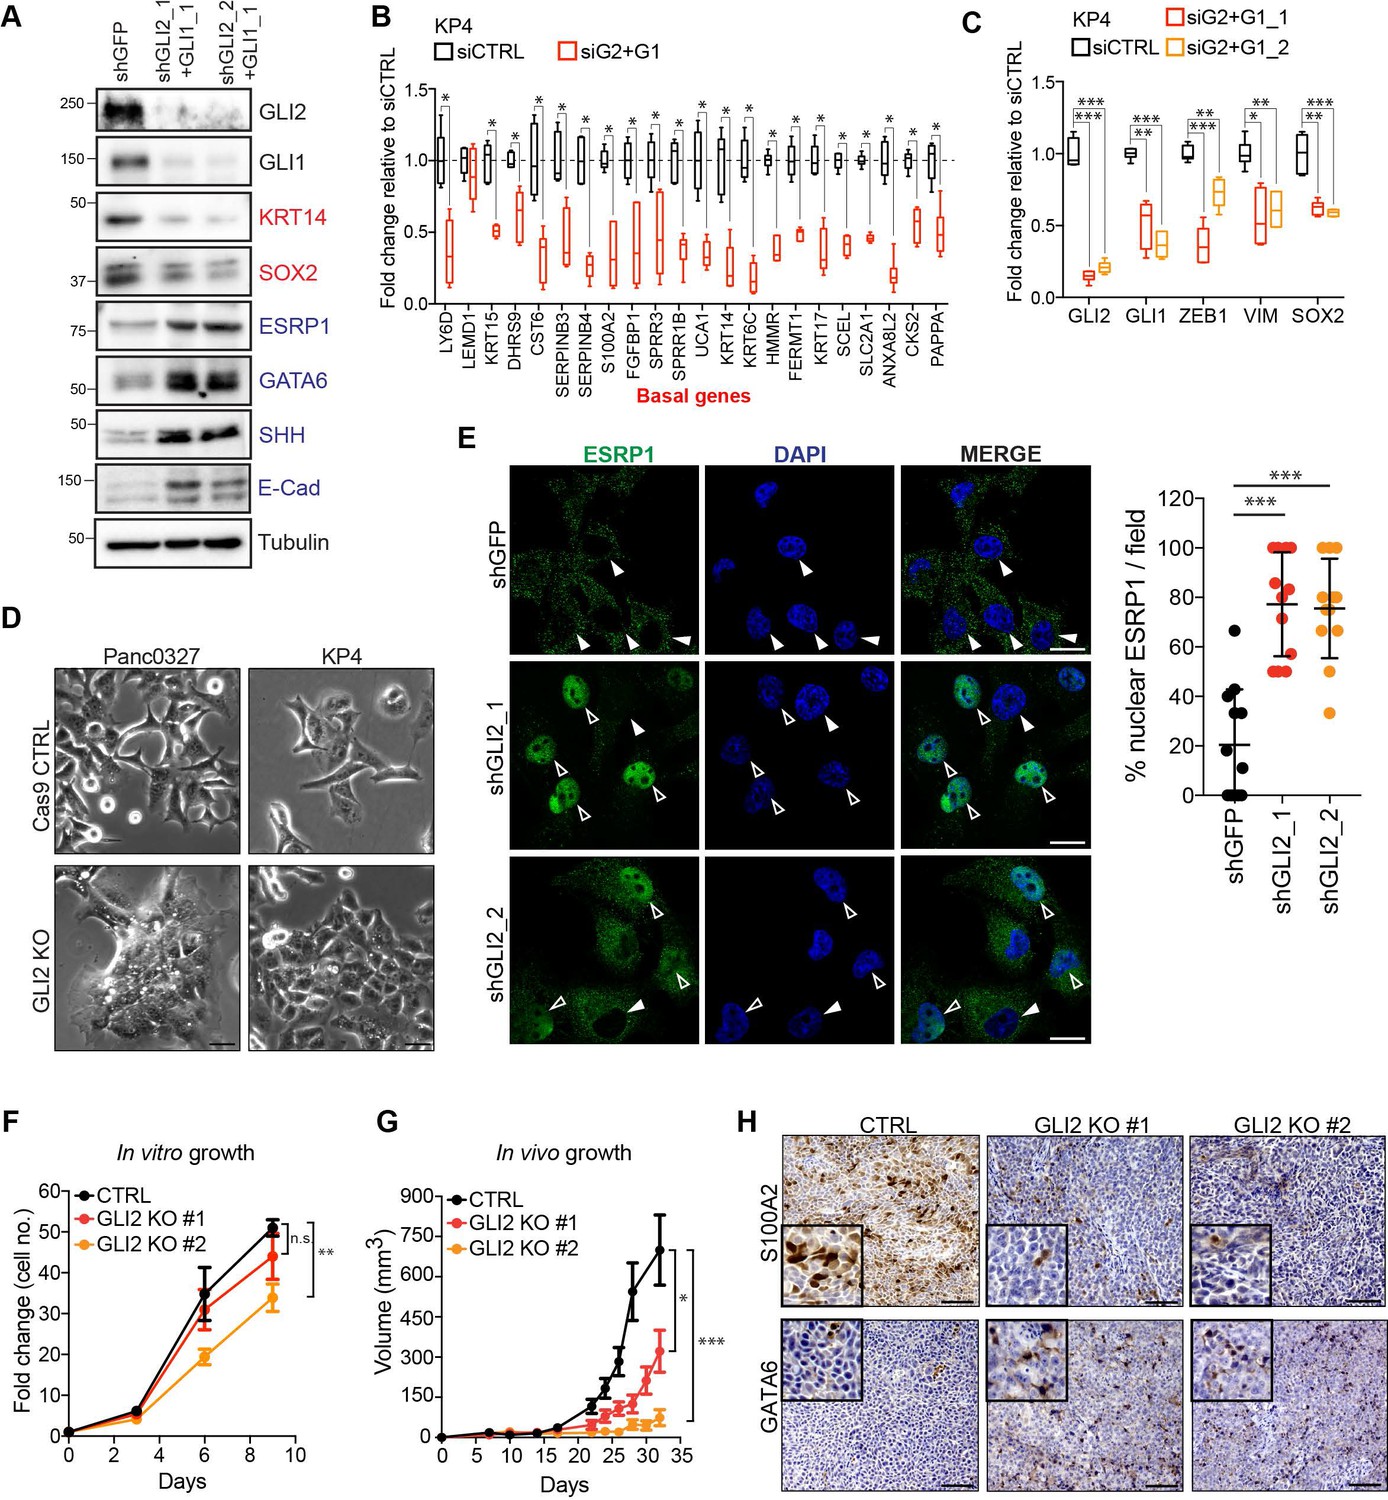
GLI2 is required to maintain the basal-like state in PDA.
(A) Immunoblot shows the effect of shRNA-mediated GLI2 and GLI1 combined knockdown on expression of the indicated proteins in KP4 cells. (B,C) Graph shows the effect of siRNA mediated GLI2 and GLI1 combined knockdown on EMT associated gene expression (B) and basal-like subtype gene expression (C) determined by qRT-PCR, displayed as fold change normalized to a scrambled siRNA control in KP4 cells (n = 2). (D) Brightfield images of Panc0327 and KP4 cells grown in 2D monolayer show loss of a mesenchymal phenotype upon GLI2 knockout (GLI2 KO) compared to Cas9 control cells (CTRL). Scale bar, 100 μm. (E) Immunofluorescence staining (left) and quantification (right) of percentage ESRP1 nuclear localization in KP4 control (shGFP) and shRNA mediated GLI2 knockdown cells. Data represent 10 fields from two independent experiments. Solid arrowheads indicate absence of nuclear ESRP1; open arrowheads indicate nuclear ESRP1. Scale bar, 50 μm. (F) Quantification of in vitro growth rate of KP4 Cas9 CTRL and GLI2 KO cells. (G) Quantification of in vivo growth of KP4 CTRL and GLI2 KO subcutaneous xenografts. Error bars represent s.e.m. (H) Immunohistochemistry of KP4 xenografts show downregulation of basal-like marker S100A2 (top) and upregulation of GATA6 (bottom) in GLI2 KO cells compared to CTRL, consistent with loss of the basal-like state. Scale bars, 200 μm. p-Values were calculated by two-tailed unpaired t test. n.s. = not significant; *p<0.05; **p<0.01; ***p<0.001.
-
Figure 4—source data 1
GLI2 is required to maintain a basal-like state in PDA.
- https://doi.org/10.7554/eLife.45313.013
Figure 4—figure supplement 1
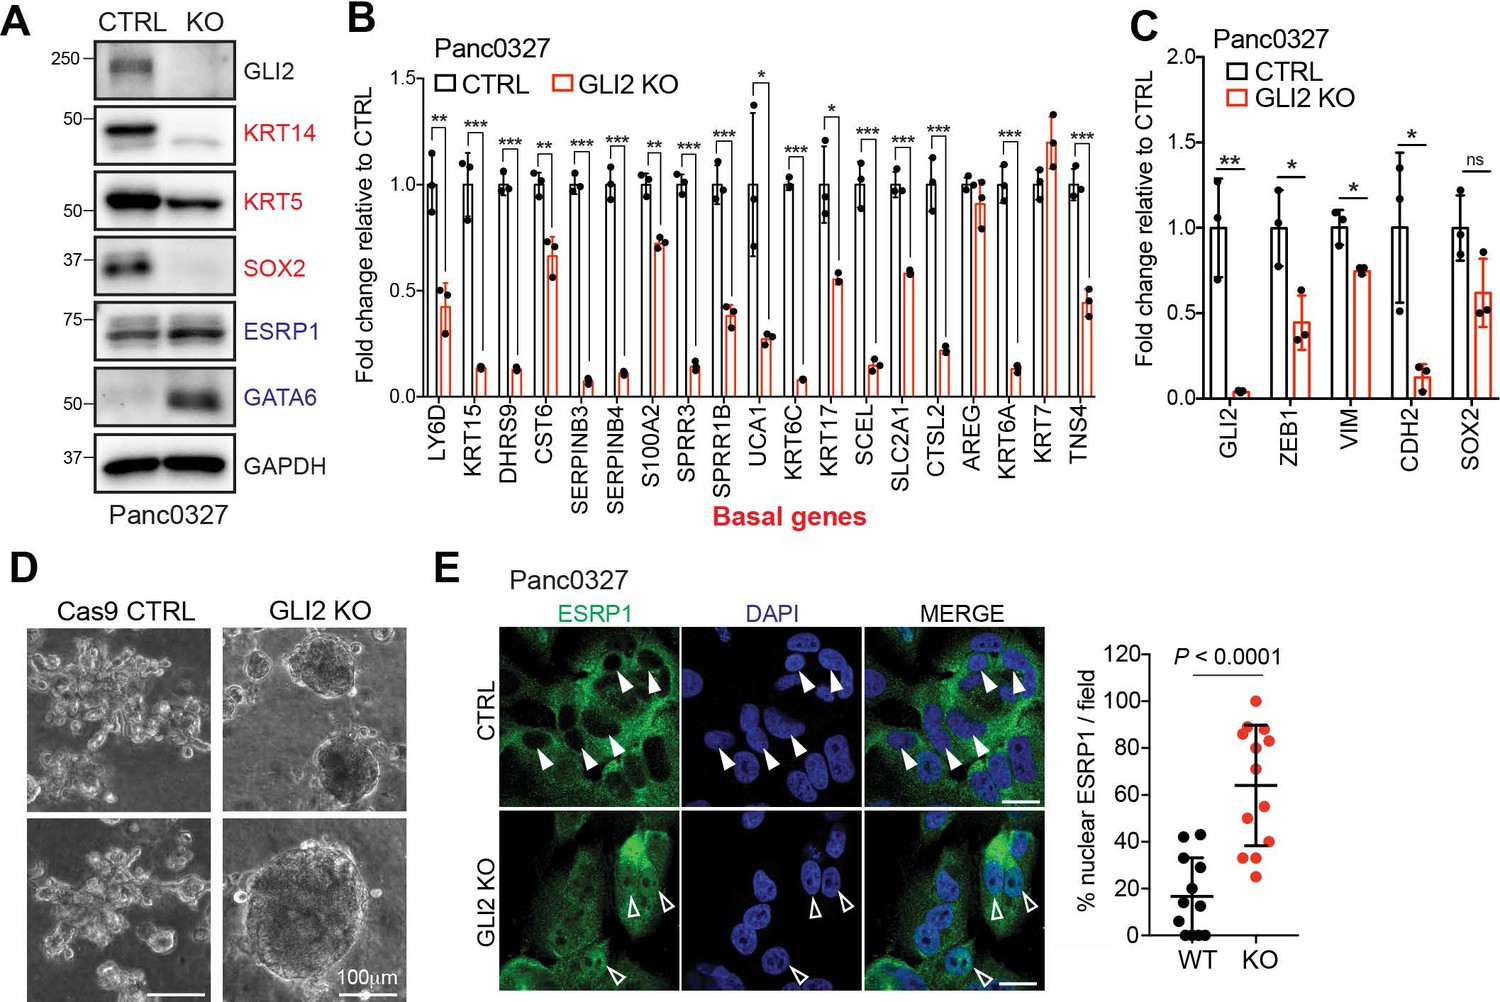
GLI2 is required to maintain a basal-like state in PDA.
(A) Immunoblot shows the effect of GLI2 knockout (KO) in Panc0327 cells on protein expression of the indicated markers. (B,C) Graph shows the effect of CRISPR-Cas9 mediated GLI2 knockout (GLI2 KO) in Panc0327 cells on mRNA expression of the basal-like subtype genes (B) and EMT markers (C) determined by qRT-PCR, displayed as fold change normalized to Cas9 control (CTRL) cells. (D) Images show the effect of GLI2 KO in KP4 cells grown in 3D matrigel culture. Note the change from a mesenchymal to an epithelial phenotype. Scale bar = 100 μm. (E) Immunofluorescence staining (left) and quantification (right) of percentage ESRP1 nuclear localization in Panc0327 Cas9 control (CTRL) and GLI2 KO cells. Data represent 10 fields from two independent experiments. Solid arrowheads indicate absence of nuclear ESRP1; open arrowheads indicate nuclear ESRP1. Scale bar, 50 μm. p-Values were calculated by two-tailed unpaired t test. *p<0.05; **p<0.01; ***p<0.001.
Figure 5 with 2 supplements
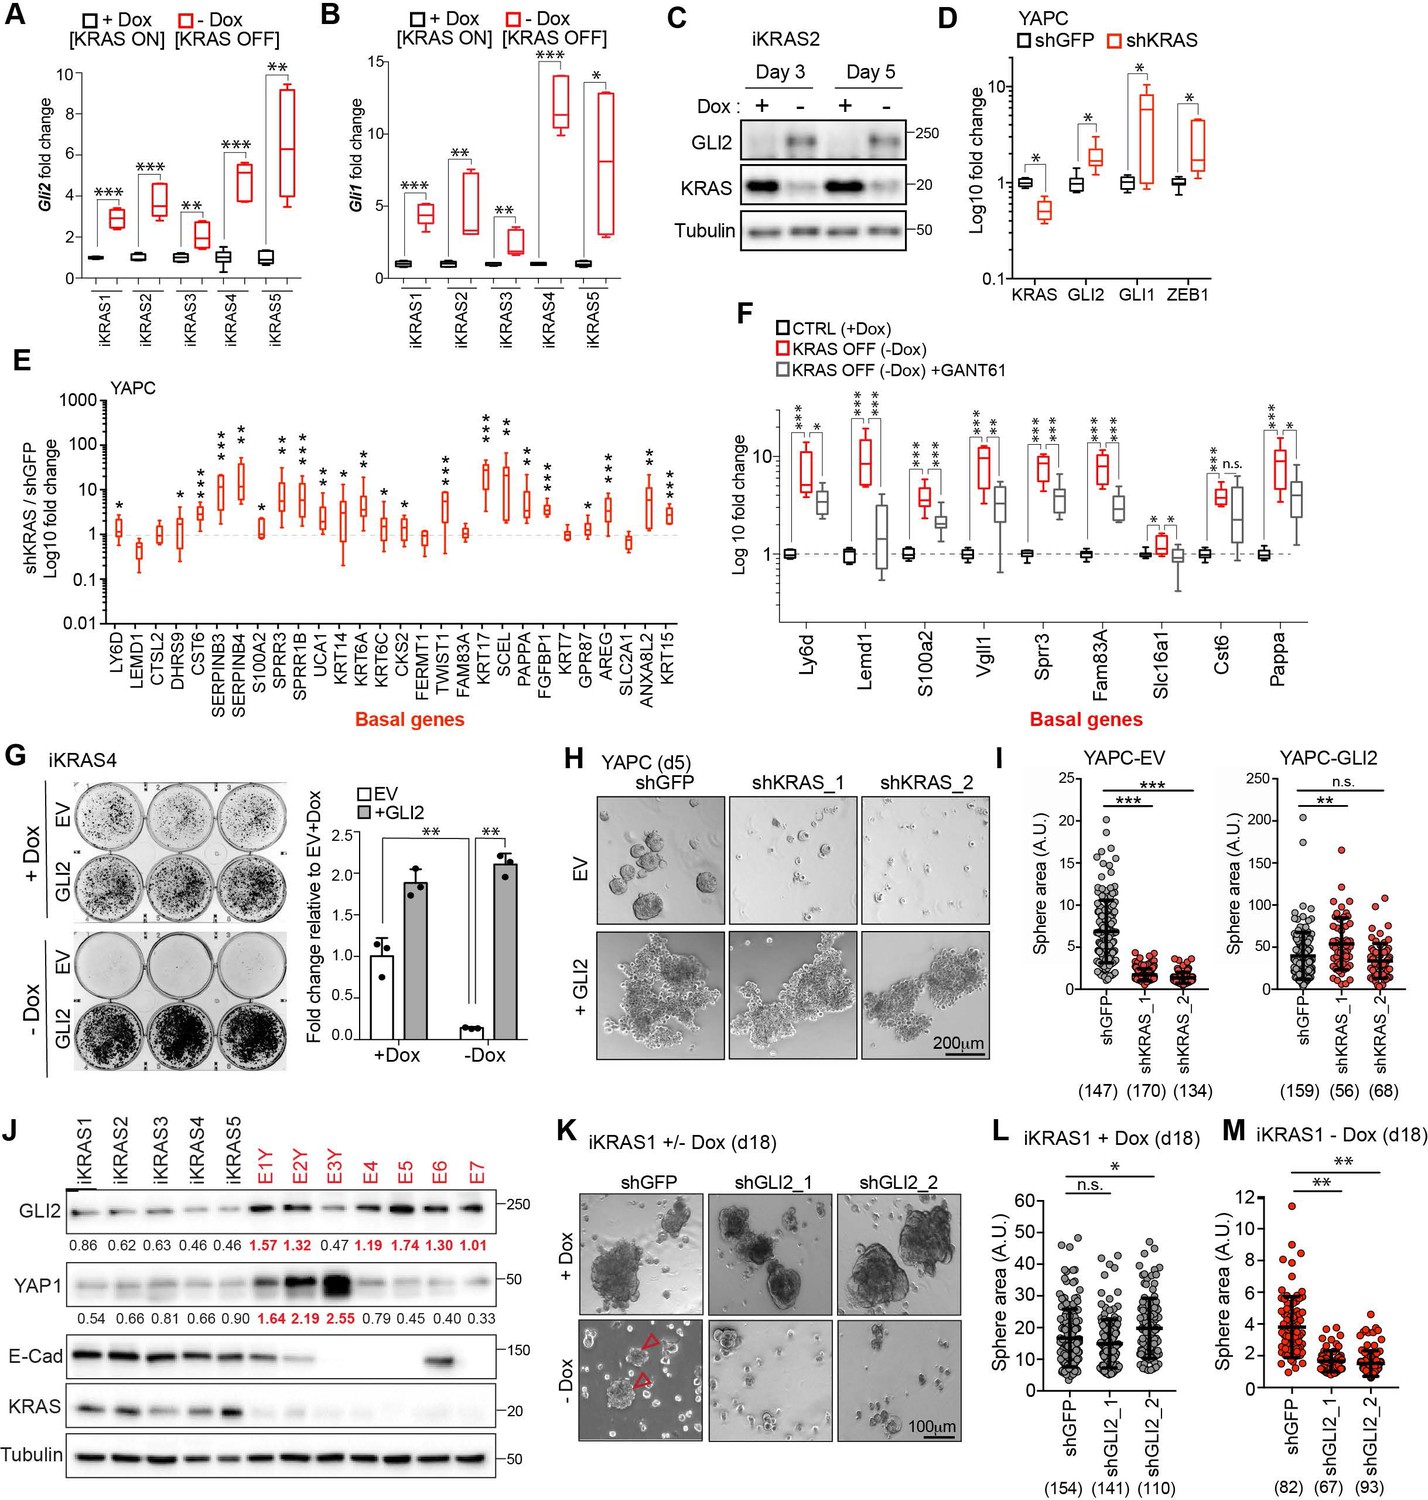
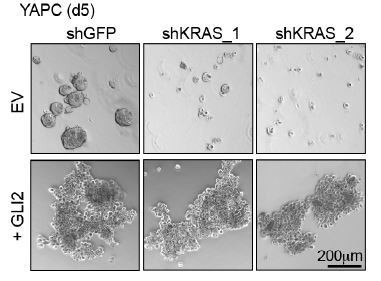
GLI2-mediated basal-like subtype switching rescues viability of PDA cells following KRASG12D ablation.
(A,B) Effect of Dox depletion for 3 days on levels of Gli2 (A) and Gli1 (B) mRNA as measured by qRT-PCR in the indicated iKRAS cell lines, (n = 3). (C) Immunoblot shows expression of GLI2 and KRAS in iKRAS2 cells + Dox and – Dox for 3 and 5 days. (D,E) Effect of shRNA-mediated knockdown of KRAS on GLI2, GLI1, ZEB1 mRNA levels (D) and basal-like gene expression (E) as measured by qRT-PCR in YAPC cells. (n = 3). (F) Fold change in the basal-like gene signature in iKRAS4 cells following Dox removal (red plot) for 3 days or Dox removal in conjunction with 5 μM GANT61 treatment (grey plot). qRT-PCR measurement of the indicated genes in both conditions are normalized to the +Dox control condition (black plot) (n = 3). (G) Colony-forming ability of iKRAS4 cells stably expressing empty vector (EV) or Flag-tagged mGLI2 (GLI2) grown in the presence (top) or absence (bottom) of Dox for 6 days, followed by staining with crystal violet. Graph shows the fold change in growth relative to the EV +Dox setting. Results shown are representative of n = 3 experiments. (H,I) Images (H) show the effect of stable expression of EV (top) or Flag tagged GLI2 (bottom) on YAPC sphere formation 5 days post shRNA-mediated knockdown of KRAS compared to control cells (shGFP). Quantification of sphere area for each condition is shown (I). Number of spheres measured per condition is indicated in parenthesis. Scale bar, 200 μm. (J) Immunoblots show expression of the indicated proteins in iKRAS (black) and Escaper (red) cell lines. Numerical values indicate levels of GLI2 and YAP1 normalized to Tubulin. Escaper cell lines denoted with ‘Y’ harbor genomic amplification of Yap1. (K–M) Images (K) show the effect of shRNA-mediated knockdown of Gli2 using two separate hairpins on iKRAS1 sphere formation when grown in the presence (top) or absence (bottom) of Dox for 18 days. Quantification of sphere area in the presence (L) and absence (M) of Dox is shown. Number of spheres measured per condition is indicated in parenthesis. Arrowheads indicate growth of KRASG12D independent spheroids. Scale bar, 100 μm. p-Values were calculated by two-tailed unpaired t test. n.s. = not significant, *p<0.05; **p<0.01; ***p<0.001.
-
Figure 5—source data 1
GLI2-mediated basal-like subtype switching in response to KRASG12D ablation.
- https://doi.org/10.7554/eLife.45313.017
Figure 5—figure supplement 1

GLI2 is upregulated in response to KRASG12D ablation.
(A) Graph shows effect of Dox withdrawal for 1, 3 and 5 days on Kras and Gli2 mRNA expression in iKRAS2 cells as measured by qRT-PCR. Results are representative of n = 3 experiments. (B) Graph shows the effect of Dox depletion for 3 days on mRNA expression of Kras in iKRAS cell lines as measured by qRT-PCR. (C) Graph shows the effect of Dox depletion for 5 days on Vim and Zeb1 mRNA expression in iKRAS2 cells as measured by qRT-PCR. Results are representative of n = 3 experiments. (D) Effect of Dox depletion for 3 days on mRNA expression of basal-like genes in the indicated iKRAS cell lines as measured by qRT-PCR. Results are shown as fold change relative to the +Dox condition. Significantly upregulated genes are indicated for each iKRAS cell line. (E) Effect of shRNA-mediated knockdown of KRAS on the indicated genes as measured by qRT-PCR in HPAFII cells. p-Values were calculated by two-tailed unpaired t test. *p<0.05; **p<0.01; ***p<0.001; # p<0.001.
Figure 5—figure supplement 2
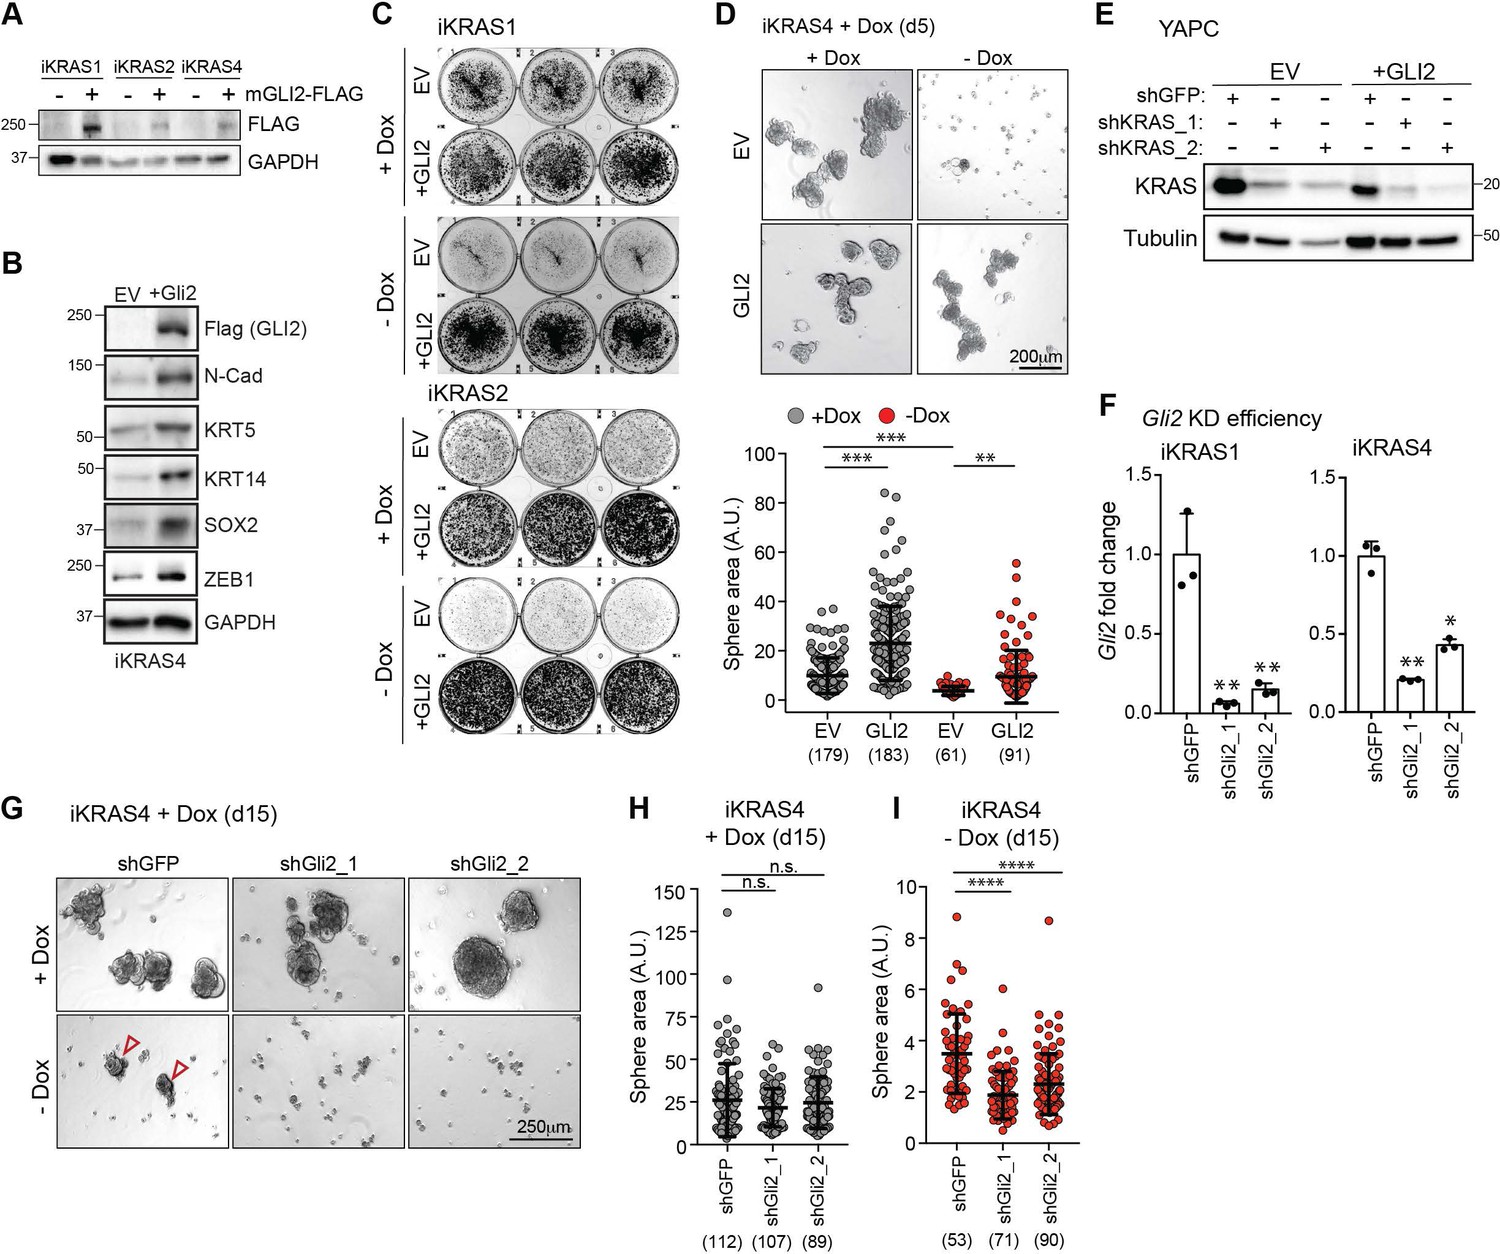
GLI2 is necessary and sufficient to promote bypass of KrasG12D-mediated oncogene addiction.
(A) Immunoblot shows expression of Flag in iKRAS cells stably expressing empty vector or Flag-tagged mouse GLI2 (mGLI2-FLAG). (B) Immunoblot shows the effect of ectopically expressing empty vector (EV) or Flag tagged mGli2 (+Gli2) in iKRAS4 cells on indicated EMT markers. (C) Colony-forming ability of iKRAS1 and iKRAS2 cells stably expressing EV or mGLI2-FLAG (+GLI2) grown in the presence (top) or absence (bottom) of Dox for 6 days, followed by staining with crystal violet. (D) Images (top) show the effect of stable expression of EV or mGLI2-FLAG on iKRAS4 sphere formation when grown in the presence (left) or absence (right) of Dox for 5 days. Quantification of sphere area for each condition is shown (below). Number of spheres measured per condition is indicated in parenthesis. Scale bars, 200 μm. (E) Immunoblot shows shRNA-mediated knockdown efficiency of KRAS in YAPC-EV and YAPC-GLI2 cells. (F) qRT-PCR measuring Gli2 transcript in iKRAS1 (left) and iKRAS4 (right) cells following infection with shRNA targeting mouse Gli2. (G) Images show the effect of shRNA-mediated knockdown of Gli2 on iKRAS4 sphere formation in the presence (top) or absence (bottom) of 1 μg/ml Dox for 15 days. Arrowheads indicate growth of KRASG12D independent spheroids. Scale bars, 250 μm. (H, I) Quantification of sphere area shown in ‘G’. Area of spheres grown in the presence (H) or absence (I) of Dox following infection with shGFP control hairpin or shGli2 in iKRAS4 cells. Number of spheres measured is indicated in parenthesis. p-Values were calculated by two-tailed unpaired t test. n.s. = not significant, *p<0.05; **p<0.01; ***p<0.001; ****p<0.0001.
Figure 6 with 1 supplement
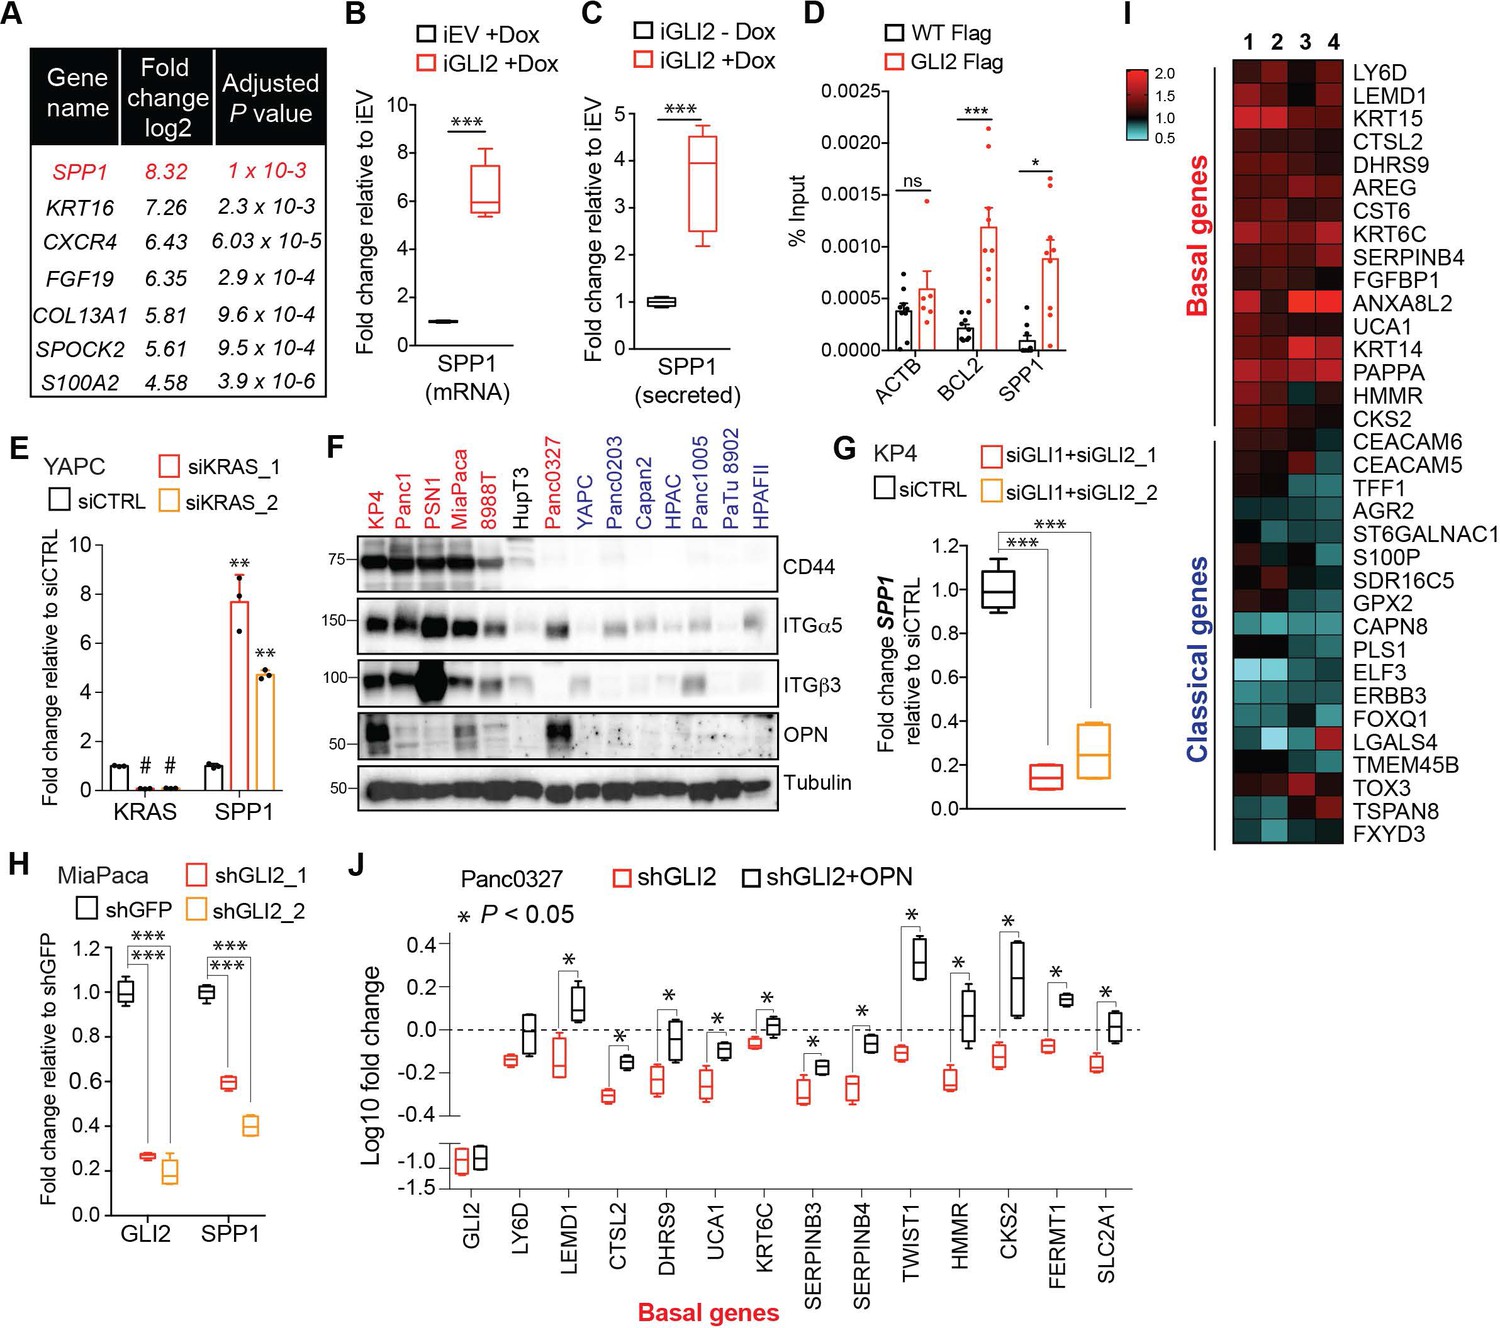
OPN is a downstream effector of GLI2 that promotes a basal-like subtype switch.
(A) Top altered genes identified via RNA-sequencing analysis of YAPC-iGLI2 cells + Dox relative to YAPC-iEV +Dox, (n = 3). (B,C) Graph shows the relative fold change in human SPP1 mRNA (B) and secreted protein (OPN) in the conditioned media as measured by ELISA (C) of HPAFII-iGLI2 cells treated with 1 μg/mL Dox for 3 days normalized to identically treated HPAFII-iEV. (D) Chromatin immunoprecipitation of Flag-tagged GLI2 in 293 T cells shows enrichment of binding to the BCL2 and SPP1 promoter relative to WT control cells (n = 3). Error bars indicate s.e.m. (E) Effect of siRNA-mediated knockdown of KRAS in YAPC cells on SPP1 mRNA expression as measured by qRT-PCR. (F) Western blot of OPN receptors, CD44, integrin α5 and integrin β3 in basal-like (red) and classical (blue) PDA cell lines. (G,H) Effect of GLI2 knockdown in KP4 (G) and MiaPaca (H) cells, on mRNA expression of the indicated genes. (I) Heatmap shows the effect of treating Capan2 cells with 1 μg/mL recombinant human OPN for 3 days on expression of the basal-like and classical subtype genes as measured by qRT-PCR (n = 4). Values are normalized to no treatment and log2 transformed. (J) Effect of shRNA-mediated knockdown of GLI2 alone (red) or in conjunction with 1 μg/mL OPN treatment (black) on expression of basal genes in Panc0327 cells. Values are normalized to no treatment and log10 transformed. p-Values were calculated by two-tailed unpaired t test. *p<0.05; **p<0.01; ***p<0.001.
-
Figure 6—source data 1
GLI2-mediated basal-like subtype switching in response to KRASG12D ablation.
- https://doi.org/10.7554/eLife.45313.020
Figure 6—figure supplement 1
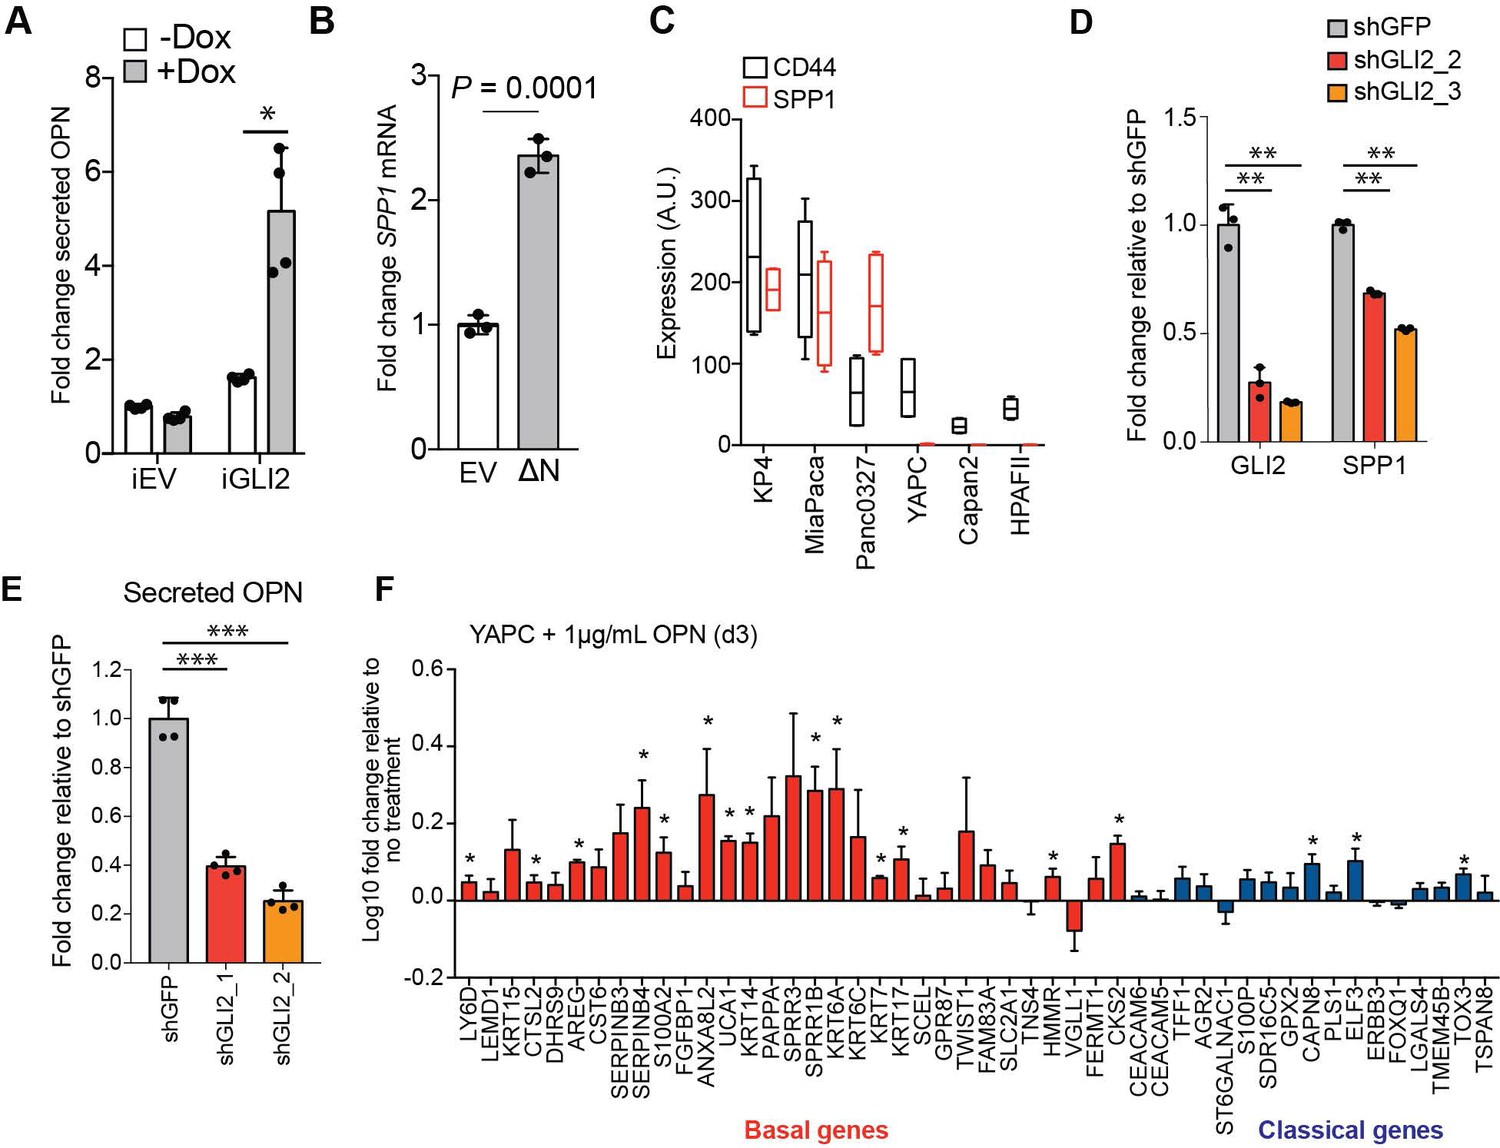
OPN is a downstream effector of GLI2 and promotes the basal-like subtype of PDA.
(A) Graph shows the relative fold change in human OPN in the conditioned media of YAPC-iEV and -iGLI2 cells treated with 1 μg/mL Dox for 3 days as measured by ELISA. All values are normalized to OPN levels in YAPC-iEV grown in the absence of Dox. (B) Graph shows relative fold change in SPP1 mRNA levels following transient expression of ΔN-GLI2 (ΔN) in YAPC cells. (C) Graph represents mRNA levels of SPP1 and CD44 in the indicated human PDA cell lines as measured by qRT-PCR. (D,E) Effect of shRNA-mediated knockdown of GLI2 with two distinct hairpins on the mRNA expression of the indicated genes (D) and secreted OPN as measured by ELISA (E) in Panc0327 cells. (F) Expression of basal-like and classical subtype genes as measured by qRT-PCR following treatment of YAPC cells with 1 μg/mL recombinant human OPN for 3 days. Values are normalized to no treatment and log10 transformed. Error bars are plotted as s.e.m. p-Values were calculated by two-tailed unpaired t test. *p<0.05; **p<0.01; ***p<0.001.
Figure 7
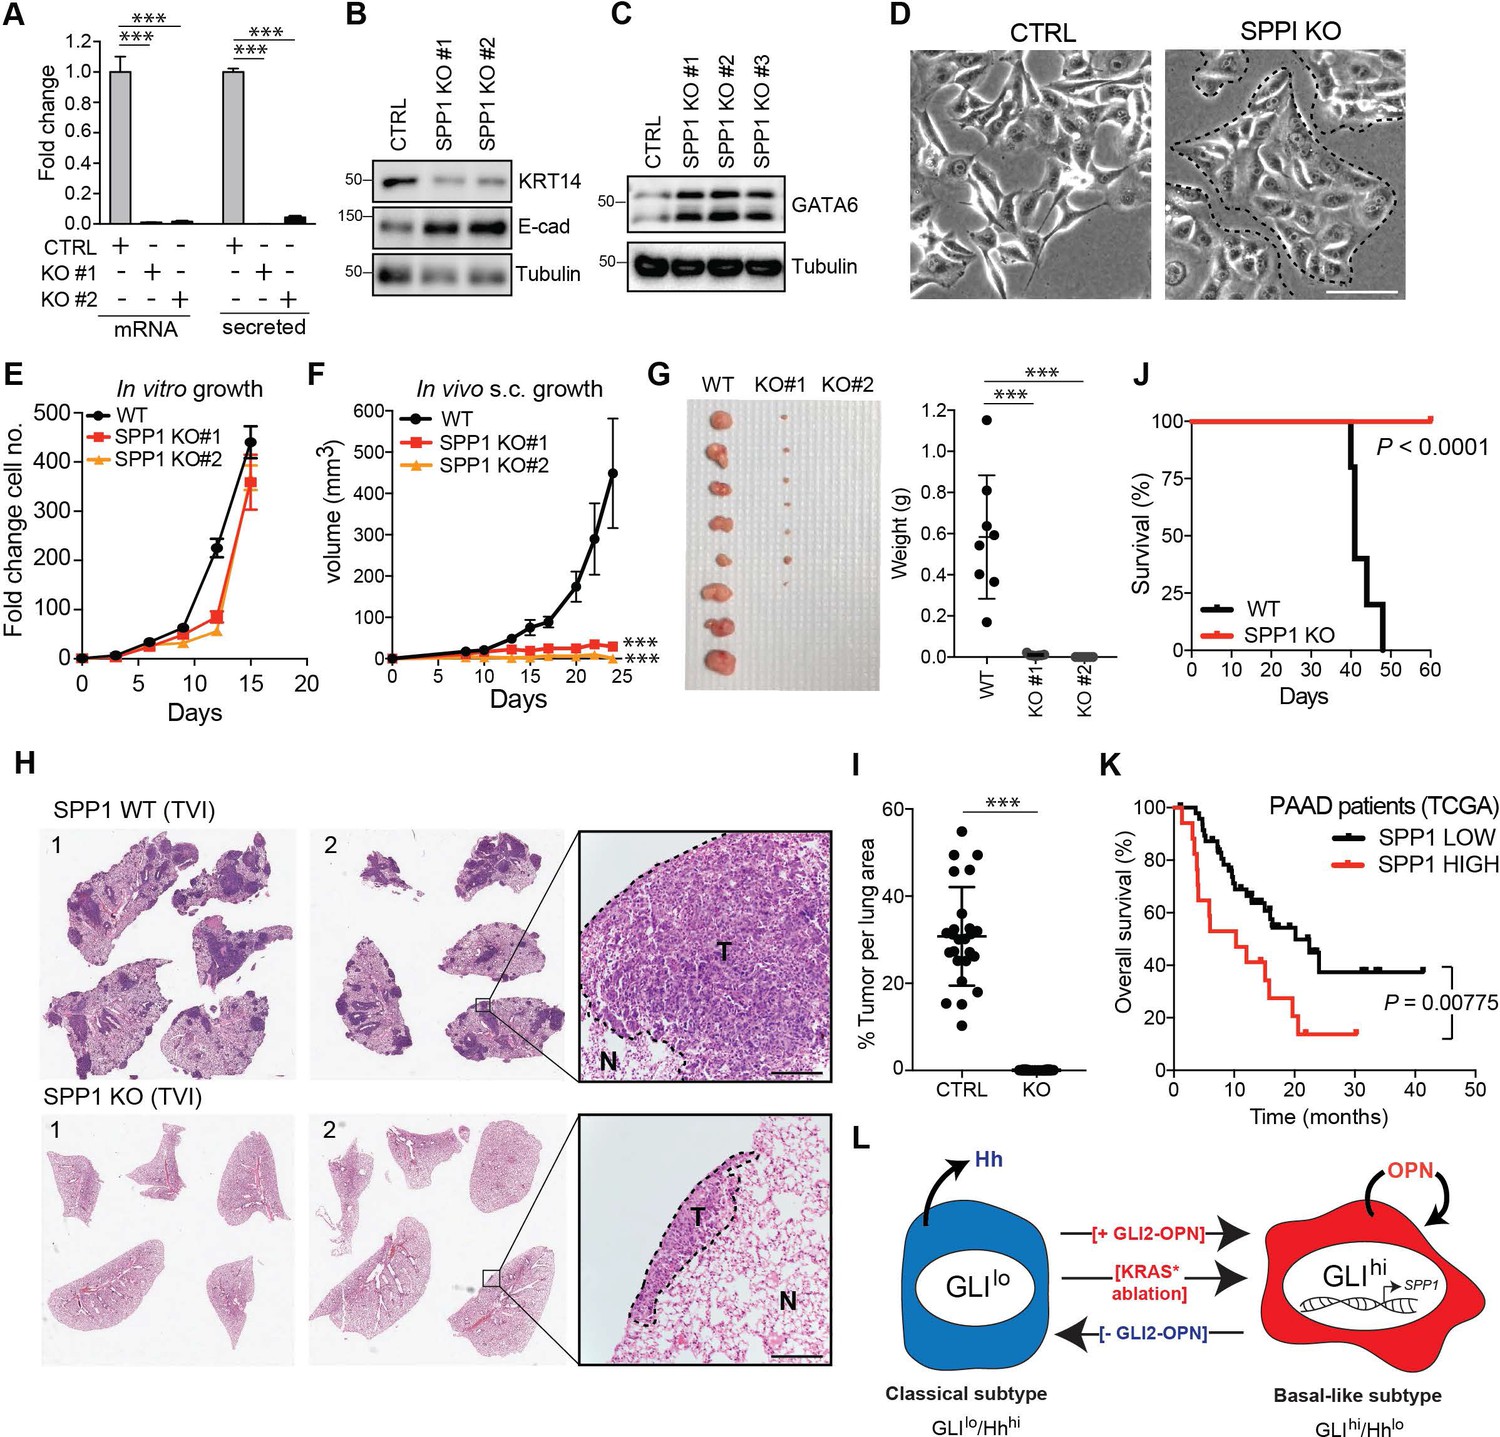
OPN loss impairs growth of basal-like PDA.
(A) CRISPR-Cas9-mediated knockout of SPP1 in KP4 cells leads to a decrease in mRNA expression and secreted Osteopontin in two independent clones. (B,C) Immunoblot of KRT14 and E-cadherin (B) and GATA6 (C) levels following KO of SPP1 in KP4 cells. (D) Brightfield images of KP4 cell morphology when grown in 2D monolayer following KO of SPP1. Note the switch to a more epithelial phenotype in the KO cells. Scale bars, 100 μm. (E) In vitro growth rate of KP4 control versus SPP1 KO cell lines. Error bars represent s.e.m. (F) Growth rate of control and SPP1 KO KP4 cells following subcutaneous injection into the flank of NOD/SCID mice. Error bars represent s.e.m. (G) Relative size of control and SPP1 KO KP4 xenografts resected at day 25 (left) and comparative tumor weight (graph at right). (H) Representative H and E stained sections of lungs at endpoint following tail vein injection (TVI) of 2 × 10⁶ KP4 control cells (WT; top) or SPP1 KO (bottom) into NOD/SCID mice. Scale bars, 400 μm. (I) Quantification of metastatic tumor burden in the lungs as a percentage of total lung area per mouse (n = 5 CTRL; n = 10 SPP1 KO). (J) Kaplan-Meier graph depicting survival of NOD/SCID mice following TVI of KP4 WT (black) or SPP1 KO cells (red). (K) High expression of SPP1 in basal-like PDA patient tumors from TCGA predicts shorter overall survival (SPP1 high n = 17, SPP1 low n = 48). Data from 65 patients. (L) Model depicting a classical to basal-like switch mediated by a GLI2-OPN signaling axis and in response to KRASG12D ablation. The classical and basal-like subtypes are marked by GLIlo/Hhhi and GLIhi/Hhlo expression, respectively. p-Value calculated by Log-rank test and by two-tailed unpaired t test. *p<0.05; **p<0.01; ***p<0.001.
-
Figure 7—source data 1
OPN loss impairs growth of basal-like PDA.
- https://doi.org/10.7554/eLife.45313.022
Author response image 1
Additional files
-
Supplementary file 1
Human and mouse primer sequences used in the study.
- https://doi.org/10.7554/eLife.45313.023
-
Supplementary file 2
Basal-like and classical gene signatures.
List of genes associated with the classical and basal-like gene signatures and their expression in the corresponding Moffitt, Collisson and Bailey signatures.
- https://doi.org/10.7554/eLife.45313.024
-
Transparent reporting form
- https://doi.org/10.7554/eLife.45313.025
Download links
A two-part list of links to download the article, or parts of the article, in various formats.
Downloads (link to download the article as PDF)
Open citations (links to open the citations from this article in various online reference manager services)
Cite this article (links to download the citations from this article in formats compatible with various reference manager tools)
Transcriptional control of subtype switching ensures adaptation and growth of pancreatic cancer
eLife 8:e45313.
https://doi.org/10.7554/eLife.45313


