Neural crest-specific deletion of Rbfox2 in mice leads to craniofacial abnormalities including cleft palate
- Duke-NUS Medical School, Singapore
- National Heart Center, Singapore
Figures
Figure 1

Rbfox2 is expressed in the neural crest cells during mouse embryonic development.
Immunostaining for Rbfox2 was performed on E9.5, E10.5, E11.5 and E12.5 transverse sections at different rostrocaudal axis (A–R). Magnified view of the neural tube shows Rbfox2 expression in the pre-migratory (white arrows) and migratory (red arrows) neural crest cells (K–M). Rbfox2 expression in neural crest-derived tissues such as OFT and palate shelves (D-E, I-J, and N-O). Non-specific autofluorescence due to blood cells is observed in DA, MDA, OFT, RA and LA. Immunostaining for Rbfox2 and Pax3 was performed on adjacent sections from E9.5, E10.5, and E11.5 mouse embryos (P–U). Rbfox2 is expressed in the premigratory neural crest cells (white arrows) of the dorsal neural tube as well as in the migratory neural crest cells (red arrows). Nuclei were visualized by DAPI staining (blue). CAC, common atrial chamber and CV, cardinal vein; DGR, dorsal root ganglion; DM, dorsal mesocardium; DA, dorsal aorta; FV, fourth ventricle; LA, left atrium; MDA, midline dorsal aorta; NT, neural tube; OFT, outflow tract; PS, palatal shelves; RA, right atrium; S, somite; T, Tongue; TG, trigeminal ganglion; UV, umbilical vein; V, ventricle. Scale bars are 100 μm respectively.
Figure 2 with 1 supplement
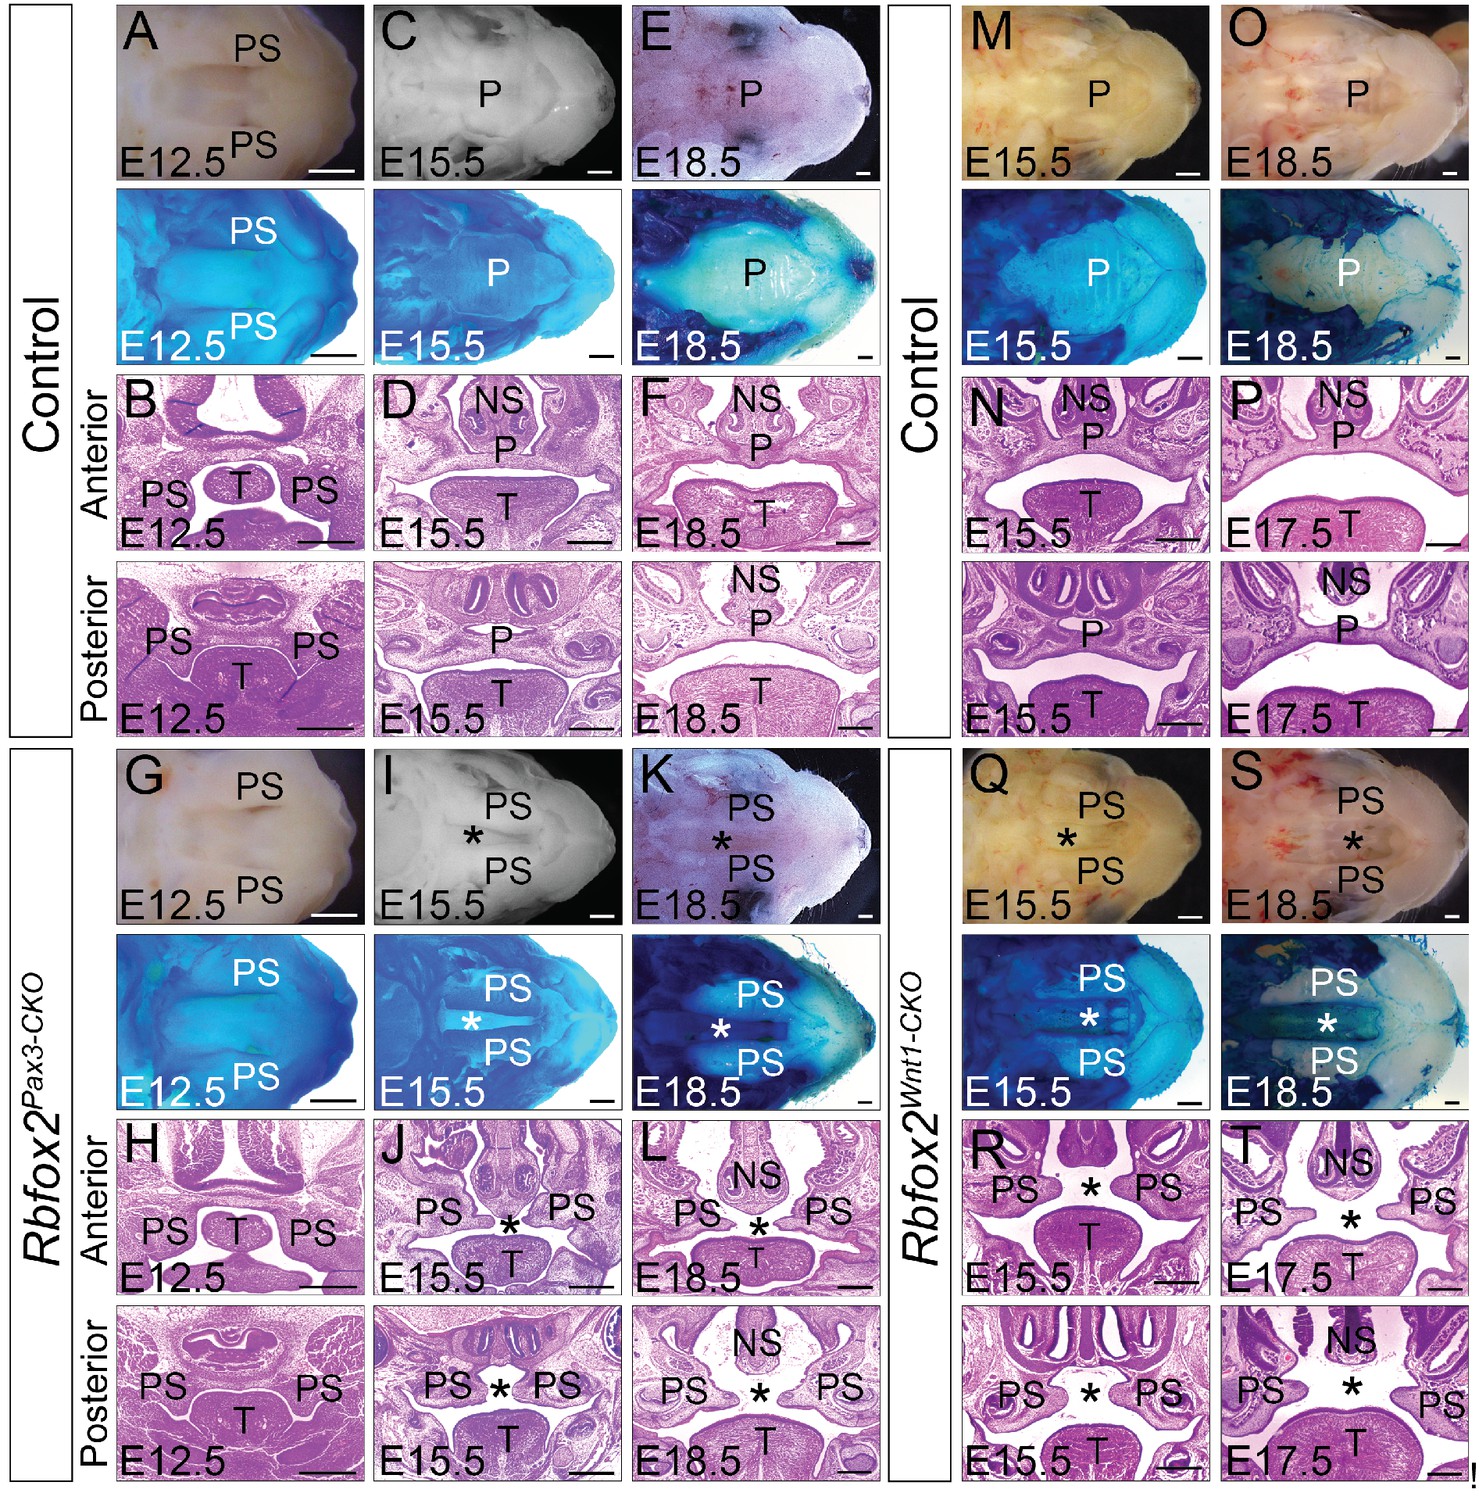
Cleft palate defects in Rbfox2 mutant embryos.
Gross morphology and Alcian blue staining of control (A, C and E) and Rbfox2Pax3-CKO (G, I and K) palates at E12.5 (n = 7 controls, n = 7 Rbfox2Pax3-CKO), E15.5 (n = 6 controls, n = 6 Rbfox2Pax3-CKO) and E18.5 (n = 7 controls, n = 7 Rbfox2Pax3-CKO). H and E stained transverse sections of control (B), (D), and (F) and Rbfox2Pax3-CKO (H), (J), and L) embryos at the level of the anterior and posterior palatal shelves. Gross morphology and Alcian blue staining of control (M and O) and Rbfox2Wnt1-CKO (Q and S) palates at E15.5 (n = 6 controls, n = 6 Rbfox2Wnt1-CKO) and E18.5 (n = 7 controls, n = 6 Rbfox2Wnt1-CKO). H and E stained sections of control (N and P) and Rbfox2Wnt1-CKO (R and T) E15.5 and E17.5 embryos at the level of the anterior and posterior palatal shelves. Asterisks (*) represent cleft palate in Rbfox2 mutant embryos (I–L and Q–T). P, palate; PS, palatal shelves; NS, Nasal septum; T, Tongue. Scale bars are 200 μm respectively.
Figure 2—figure supplement 1
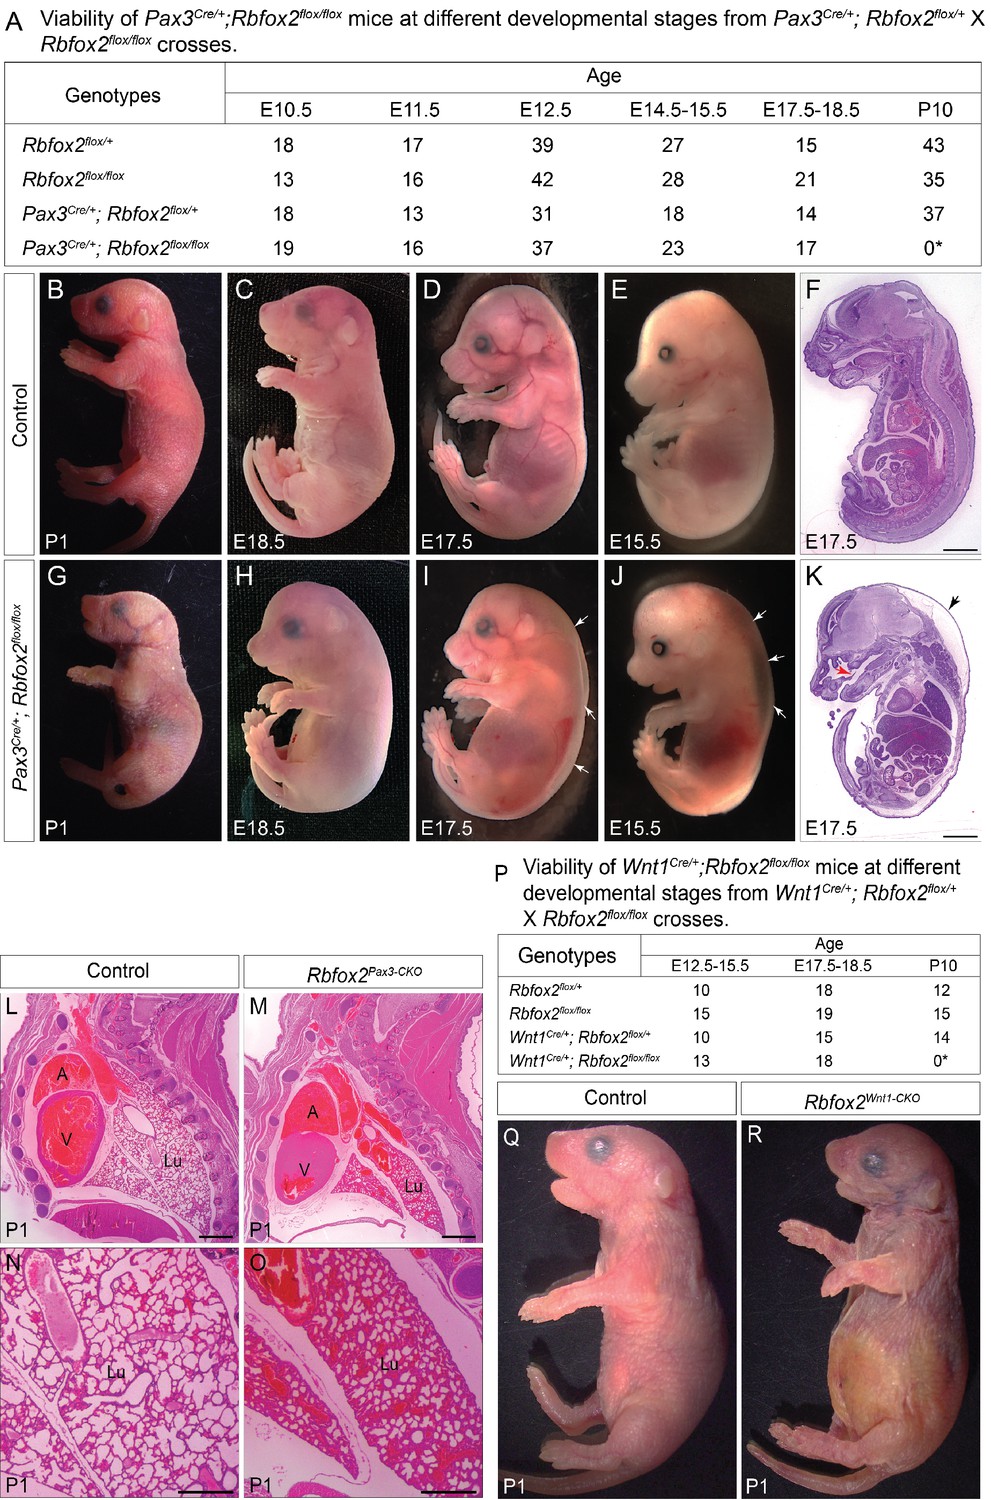
Rbfox2 deletion leads to neonatal lethality.
Genotyping results from embryos and pups generated by a cross between Pax3Cre/+; Rbfox2flox/+ and Rbfox2flox/flox mice (A). Gross morphology and histology of control (B–F) and mutant (G–K) embryos and pups at different embryonic and neonatal time points. Pax3Cre/+;Rbfox2flox/flox (Rbfox2Pax3-CKO) embryos show subcutaneous edema (white arrows) compared to controls (n = 40 controls, n = 40 Rbfox2Pax3-CKO). H and E staining of sections detects cleft palate (red arrow) and thin dermal layer in the skin of Rbfox2Pax3-CKO embryos (black arrow) than in littermate controls due to subcutaneous edema (n = 5 controls, n = 5 Rbfox2Pax3-CKO) (F and K). Scale bars are 1 mm respectively. Hematoxylin and eosin stained sagittal sections of control (L, N) and Rbfox2Pax3CKO (M, O) pups at P1 (n = 4 each genotype). Scale bars are 200 μm respectively. Genotyping results from embryos and pups generated by a cross between Wnt1Cre/+;Rbfox2flox/+ and Rbfox2flox/flox mice (P). Gross morphology of control (Q) and Rbfox2Wnt1-CKO (R) pups at P1 (n = 4 each genotype). The mutant lungs are not inflated compared to controls. A, atrium; V, ventricle; Lu, lung.
Figure 3 with 1 supplement

Cleft palate defects in Rbfox2 mutant embryos result from impaired cell proliferation in the neural crest-derived palatal shelves.
Immunohistochemistry for Ki67 was performed on transverse sections through the middle palatal regions of E12.5 (n = 4 controls, n = 4 Rbfox2Pax3-CKO) and E15.5 (n = 5 controls, n = 5 Rbfox2Pax3-CKO) control (A, D) and Rbfox2Pax3-CKO (B, E) embryos. Immunohistochemistry for Ki67 was performed on E15.5 control (G) and Rbfox2Wnt1-CKO (H) middle palatal shelves sections (n = 5 controls, n = 5 Rbfox2Wnt1-CKO). Quantification of cell proliferation was calculated as the ratio of Ki67-positive cells to the total number of cells as determined by DAPI counterstain in the defined area of palatal shelves (C, F and I). TUNEL assay was performed on E15.5 control (J) and Rbfox2Pax3-CKO (K) sections (n = 4 controls, n = 4 Rbfox2Pax3-CKO). E-cadherin immunostaining on E15.5 control (L) and Rbfox2Pax3-CKO (M) sections (n = 4 controls, n = 4 Rbfox2Pax3-CKO). GFP immunostaining on E15.5 Wnt1Cre/+;Rbfox2flox/+;R26mTmG/+ (N) and Wnt1Cre/+;Rbfox2flox/flox;R26mTmG/+ (O) sections showing neural crest derivatives cells in the palatal shelves (n = 4 each genotype). NS, Nasal septum; PS, palatal shelves; T, Tongue. Scale bars are 100 μm respectively.
Figure 3—figure supplement 1
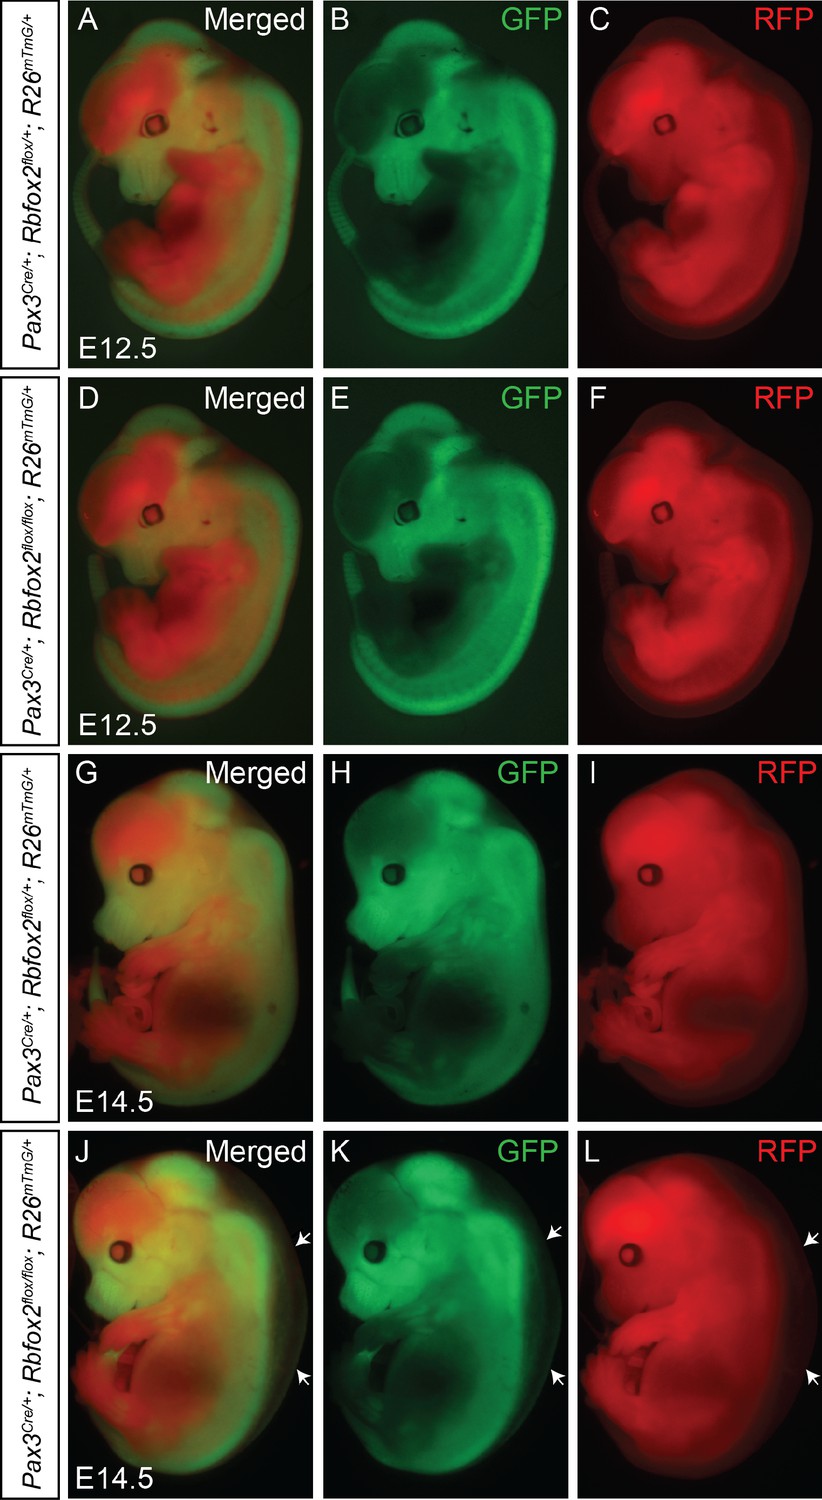
Neural crest cell migration is not affected in Rbfox2 mutant embryos.
Lineage tracing of Pax3-derived cells at E12.5 (A–F, n = 3 each genotype) and E14.5 (G–L, n = 3 each genotype) using control (Pax3Cre/+:Rbfox2flox/+:R26mTmG/+) and mutant (Pax3Cre/+:Rbfox2flox/flox:R26mTmG/+) embryos. The white arrow indicates edema present in mutant embryos (J–L).
Figure 4 with 6 supplements
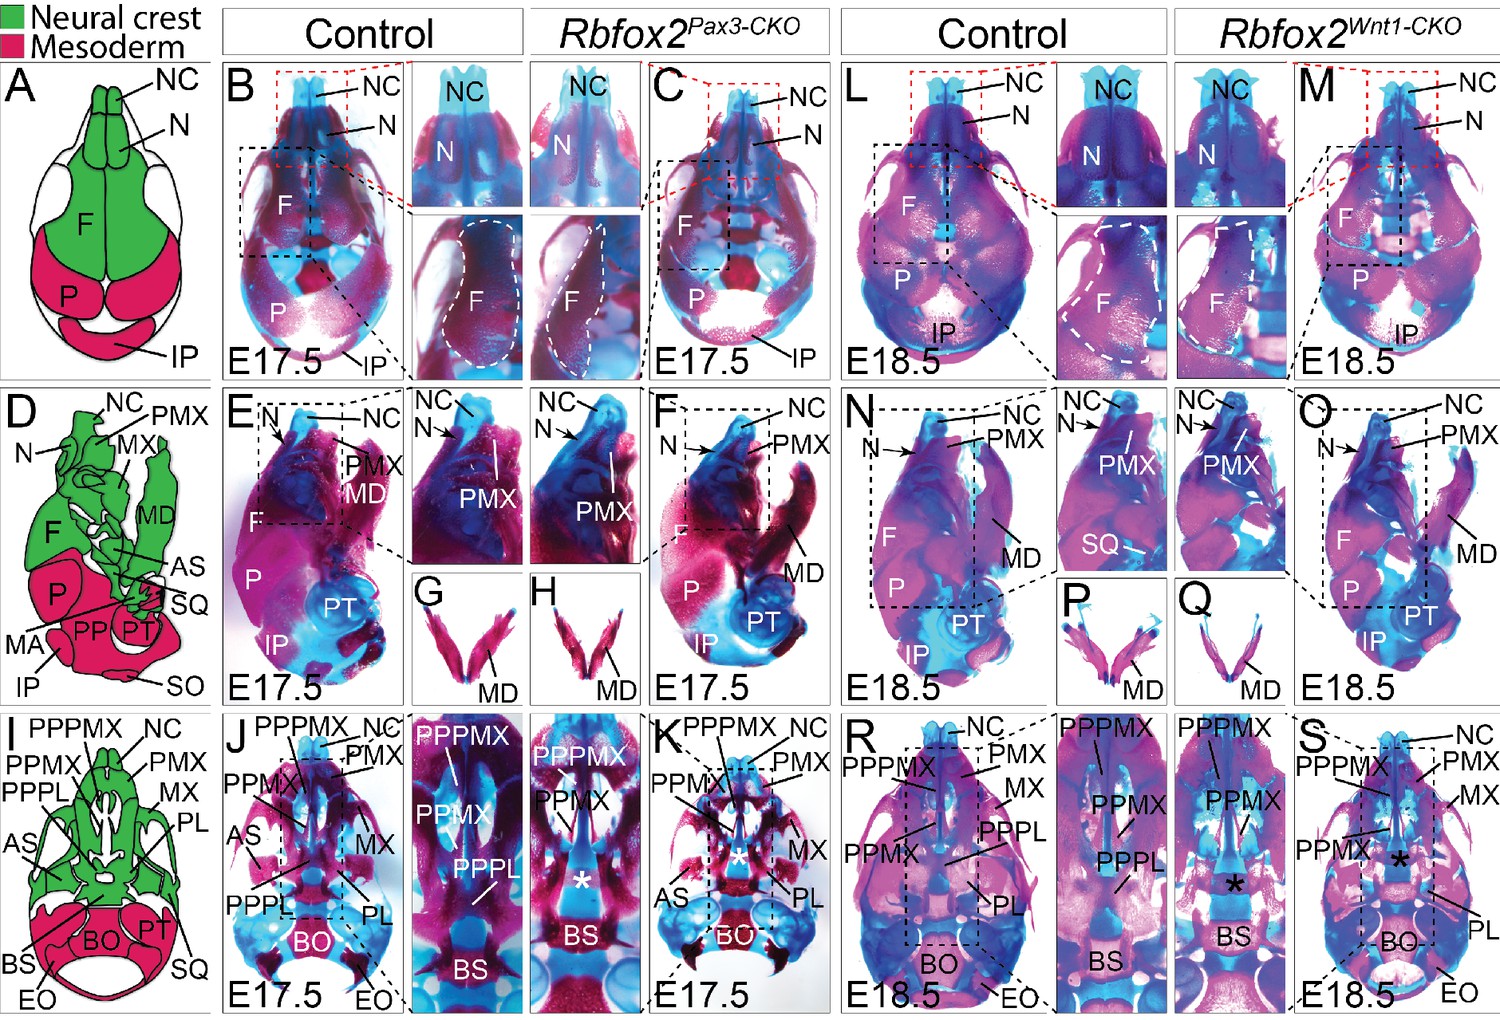
Craniofacial skeleton defects in Rbfox2 mutant embryos.
Alizarin red and Alcian blue stainings for ossified and chondrified tissues, respectively, of control (A–B), (D–E), (G), and I–J) and Rbfox2Pax3-CKO (C), (F), (H), and (K) skeleton at E17.5 (n = 8 controls, n = 6 Rbfox2Pax3-CKO). Alizarin red and Alcian blue stainings of control (L), (N), (P), and (R) and Rbfox2Wnt1-CKO (M, O, Q and S) skeleton at E18.5 (n = 8 controls, n = 5 Rbfox2Wnt1-CKO). Neural crest and mesoderm contribution to craniofacial bones are represented in green and pink color respectively (A, D and I). Dorsal (A–C and L–M), lateral (D–F and N–O) and ventral (I–K and R–S) view of skulls. Both Rbfox2Pax3-CKO (C), (F), (H), and K) and Rbfox2Wnt1-CKO (M), (O), (Q), and S) embryos demonstrate severe hypoplasia and diminished ossification of many neural crest-derived bones. Asterisks (*) represent the missing PPPL bone in Rbfox2 mutant embryos (K and S). AS, alisphenoid; BO, basioccipital; BS, basisphenoid; EO, exoccipital; F, frontal bone; IP, interparietal; MD, mandible; MX, maxilla; N, nasal; NC, nasal capsule; P, parietal bone; PL, palatine; PMX, premaxilla; PPMX, palatal process of maxilla; PPPL, palatal process of palatine; PPPMX, palatal process of premaxilla; PT, petrous part of temporal bone; SO, supraoccipital; SQ, squamous.
Figure 4—figure supplement 1
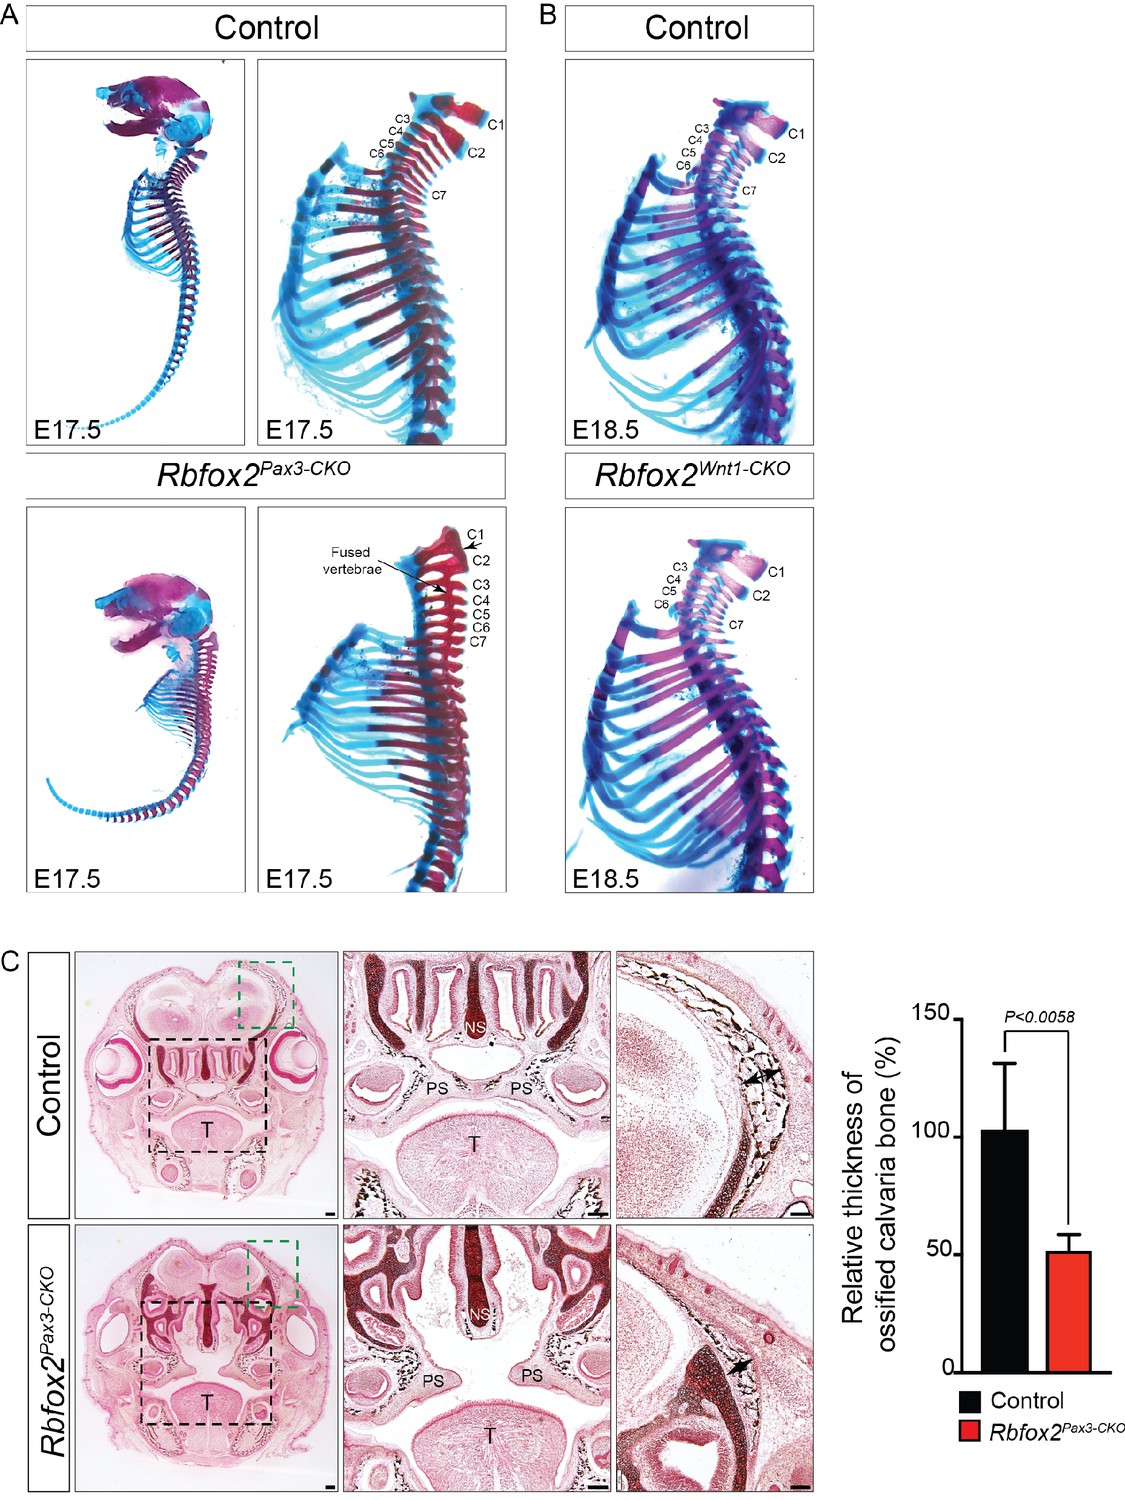
Skeletal defects in Rbfox2 mutant embryos.
Alizarin red and Alcian blue stainings for ossified and chondrified tissues, respectively, of control and Rbfox2Pax3-CKO skeleton at E17.5 (n = 8 controls, n = 6 Rbfox2Pax3-CKO). Lateral view of full skeletons and higher magnification of cervical and thoracic parts of the vertebral column (A). Cervical and thoracic parts of control and Rbfox2Wnt1-CKO skeleton at E18.5 (n = 8 controls, n = 6 Rbfox2Wnt1-CKO) (B). Transverse sections through the palatal regions of E17.5 control and Rbfox2Pax3-CKO embryos are stained for mineralized bone (black) by Von Kossa staining (C). Black staining represents bone and red staining represents connective tissues (n = 4 controls, n = 4 Rbfox2Pax3-CKO). In comparison to controls, there was a reduced thickness of ossified calvaria bone in the Rbfox2Pax3-CKO embryos (double-headed black arrow). Scale bars are 100 μm respectively.
Figure 4—figure supplement 2

Neural crest contribution to the cardiac OFT is not affected in Rbfox2 knockout embryos.
Gross morphology and histological analyses show no change in the patterning of the great vessels between controls (A–C and G–H) and Rbfox2Pax3-CKO (D–F); n = 10 controls, n = 10 Rbfox2Pax3-CKO) or Rbfox2Wnt1-CKO (I–J); n = 7 controls, n = 5 Rbfox2Wnt1-CKO) mouse embryos. Images of aortic arches in E18.5 control (A) and Rbfox2Pax3-CKO (D) embryos. H and E staining (B and E) and SMA immunohistochemistry (C and F) on sections through aortic arches from control (B–C) and Rbfox2Pax3-CKO (E–F) embryos. Images of aortic arches in E17.5 control (G) and Rbfox2Wnt1-CKO (I) embryos. H and E staining on sections through aortic arches from control (H) and Rbfox2Wnt1-CKO (J) embryos. Hearts from E12.5 and E14.5 Pax3Cre/+;Rbfox2flox/+;R26mTmG/+ (K and M; n = 4) and Pax3Cre/+;Rbfox2flox/flox;R26mTmG/+ (L and N; n = 5) embryos show labeled Pax3-derived neural crest derivatives (green) in the outflow tract. Heart from E15.5 Wnt1Cre/+;Rbfox2flox/+;R26mTmG/+ (O; n = 5) and Wnt1Cre/+;Rbfox2flox/flox;R26mTmG/+ (P); n = 5) embryos show labeled Wnt1-derived neural crest derivatives (green) in the outflow tract. A, Aorta; P, Pulmonary trunk; RA, right atrium; LA, left atrium; RV, right ventricle; LV, left ventricle. Scale bars are 200 μm respectively.
Figure 4—figure supplement 3
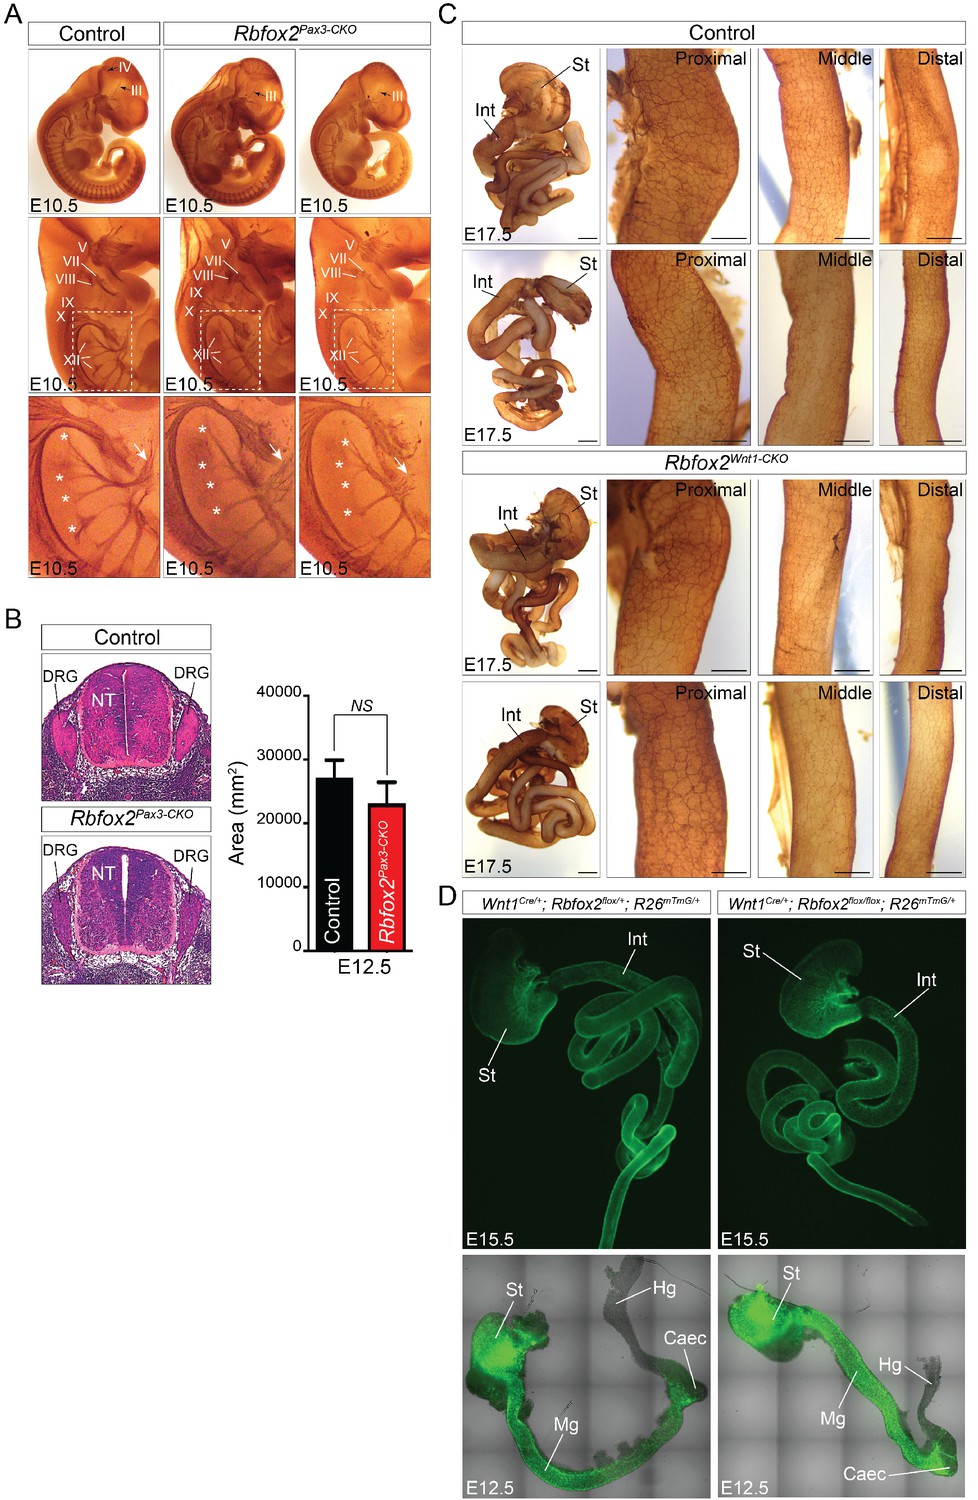
Development of peripheral and enteric nervous system in Rbfox2 mutant embryos.
Whole mount neurofilament (2H3) immunostaining of one E10.5 control and two Rbfox2Pax3-CKO embryos are presented (A). White asterisks indicate nerve roots exiting the ventral neural tube. Cranial nerves are referred to as oculomotor (III), trochlear (IV), trigeminal (V), facial/vestibulocochlear (VII/VIII), glossopharyngeal (IX), vagal (X) and hypoglossal (XII). Oculomotor (III) and trochlear (IV) nerves are deformed (black arrow). The hypoglossal nerve (XII) is disorganized and sometime shorter (white arrows) in Rbfox2Pax3-CKO embryos (n = 6 controls, n = 5 Rbfox2Pax3-CKO) (A). Quantitation of dorsal root ganglia in control and Rbfox2Pax3-CKO embryos (n = 4 controls, n = 4 Rbfox2Pax3-CKO) (B). Whole-mount immunostaining of the gastrointestinal tract at E17.5 in two controls and two Rbfox2Wnt1-CKO embryos with the anti-neurofilament antibody 2H3 are presented (C). Scale bars are 500 μm respectively. Higher magnification of the proximal, middle and distal part of the intestine is presented (n = 4 controls, n = 4 Rbfox2Wnt1-CKO). Scale bars are 200 μm respectively. Enteric neural crest lineage tracing in E12.5 and E15.5 control (Wnt1Cre/+:Rbfox2flox/+:R26mTmG/+, n = 3) and Rbfox2 mutant (Wnt1Cre/+:Rbfox2flox/flox:R26mTmG/+, n = 3) embryos (D). DRG, dorsal root ganglion; NT, neural tube; St, stomach; Int, intestine; Mg, midgut; Hg, hindgut; Caec, Caecum.
Figure 4—figure supplement 4
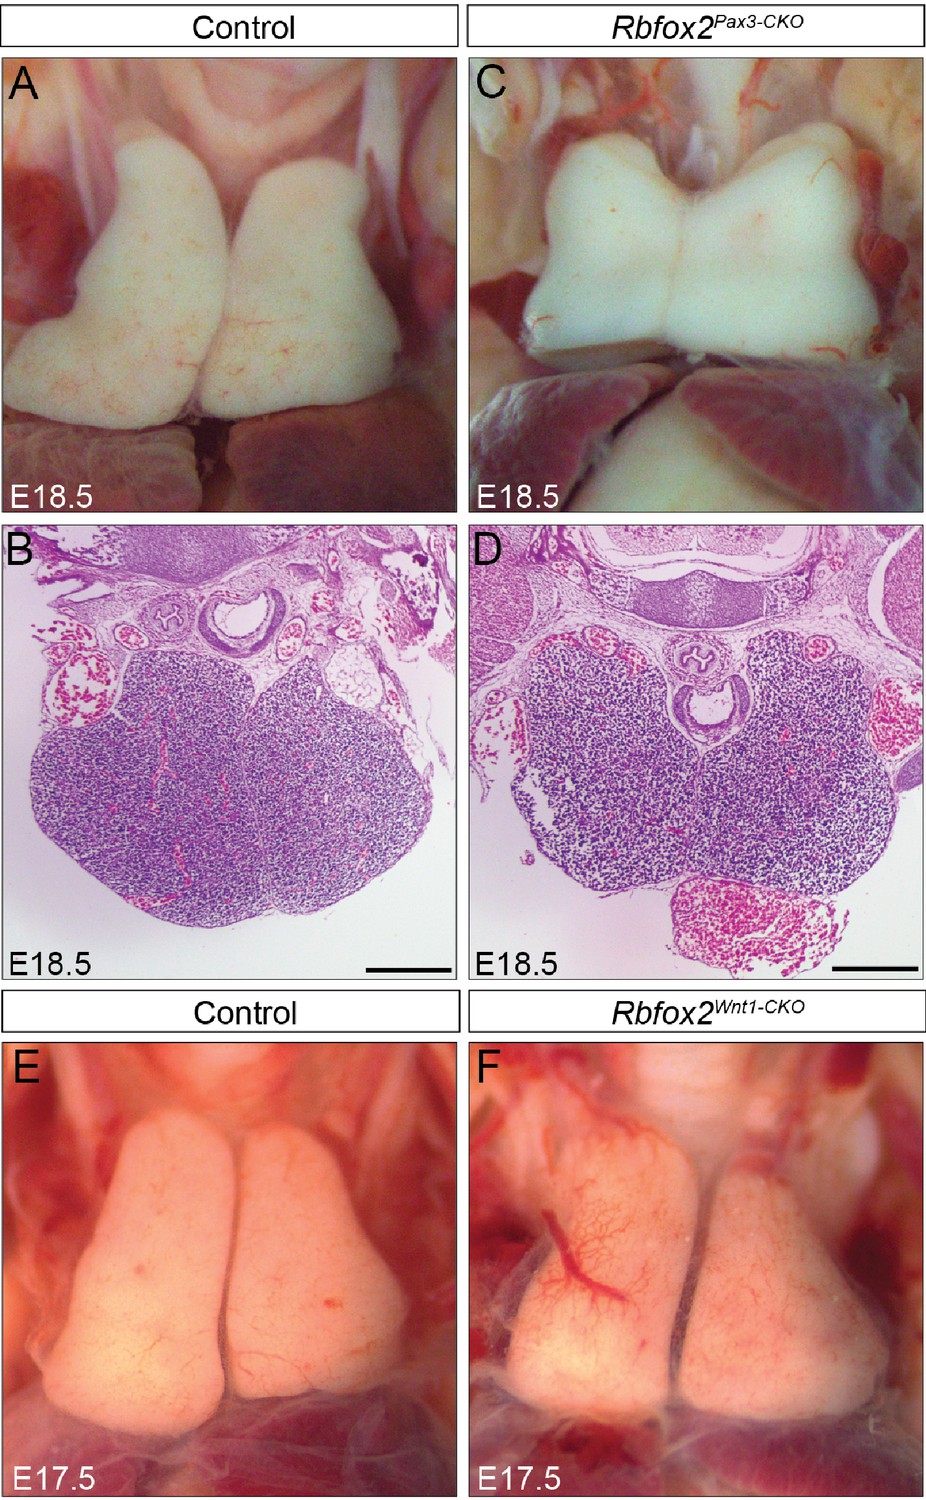
Thymus development is grossly intact in Rbfox2 mutant embryos.
Gross morphology and histology of thymus from E18.5 control (A–B) and Rbfox2Pax3-CKO (C–D) embryos (n = 6 controls, n = 6 Rbfox2Pax3-CKO). Morphology of the thymus from E17.5 control (E) and Rbfox2Wnt1-CKO (F) embryos (n = 6 controls, n = 5 Rbfox2Wnt1-CKO). Scale bars are 200 μm respectively.
Figure 4—figure supplement 5
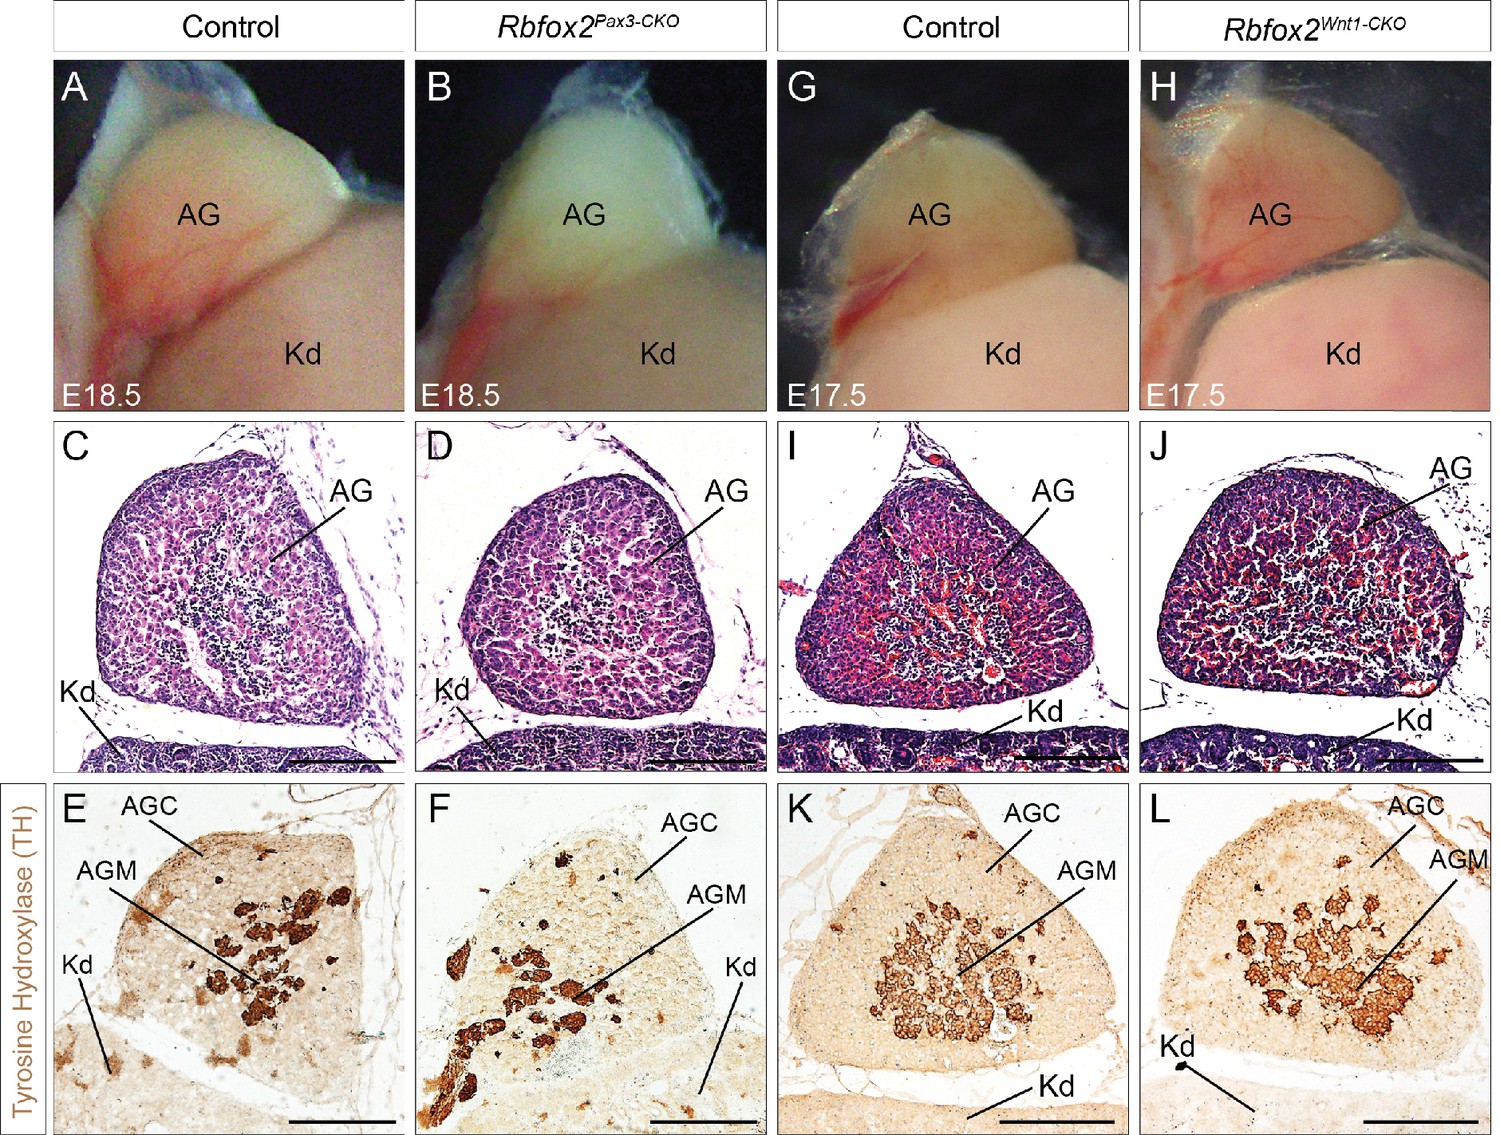
Neural crest contribution to adrenal gland is not affected in Rbfox2 knockout embryos.
Morphological (A–B) and histological analyses (C–D) of the adrenal gland from E18.5 control (A, C and E) and Rbfox2 Pax3-CKO (B), (D), and F) embryos (n = 8 controls, n = 6 Rbfox2Pax3-CKO). Morphological (G–H) and histological analyses (I–J) of the adrenal gland from E17.5 control (G, I and K) and Rbfox2Wnt1-CKO (H), (J), and L) embryos (n = 4 controls, n = 4 Rbfox2Wnt1-CKO). Immunohistochemistry for tyrosine hydroxylase (E–F and K–L), a marker of neural crest-derived chromaffin cells, in sagittal sections of adrenal glands. Chromaffin cells of the adrenal medulla develop normally in the absence of Rbfox2 (F and L). AG, adrenal glands; Kd, kidney; AGC, adrenal gland cortex and AGM, adrenal gland medulla. Scale bars are 100 μm respectively.
Figure 4—figure supplement 6

Limb and diaphragm musculature are not affected in Rbfox2Pax3-CKO embryos.
Histological analysis of forelimb musculature from E17.5 control and Rbfox2Pax3-CKO embryos (n = 4 controls, n = 4 Rbfox2Pax3-CKO) (A–B). Histological analysis of forelimb musculature from P1 control and Rbfox2Pax3-CKO pups (n = 3 controls, n = 3 Rbfox2Pax3-CKO) (C–D). Histological analysis of diaphragm musculature from E15.5 (C and D) and E17.5 (E and F) control and Rbfox2Pax3-CKO embryos. H, Humerus; R, radius; U, Ulna; Lu, Lung; Li, Liver; D, Diaphragm. Scale bars are 200 μm (A–D) and 100 μm (E–H) respectively.
Figure 5 with 1 supplement
Rbfox2-dependent splicing and transcriptional changes in neural crest cells.
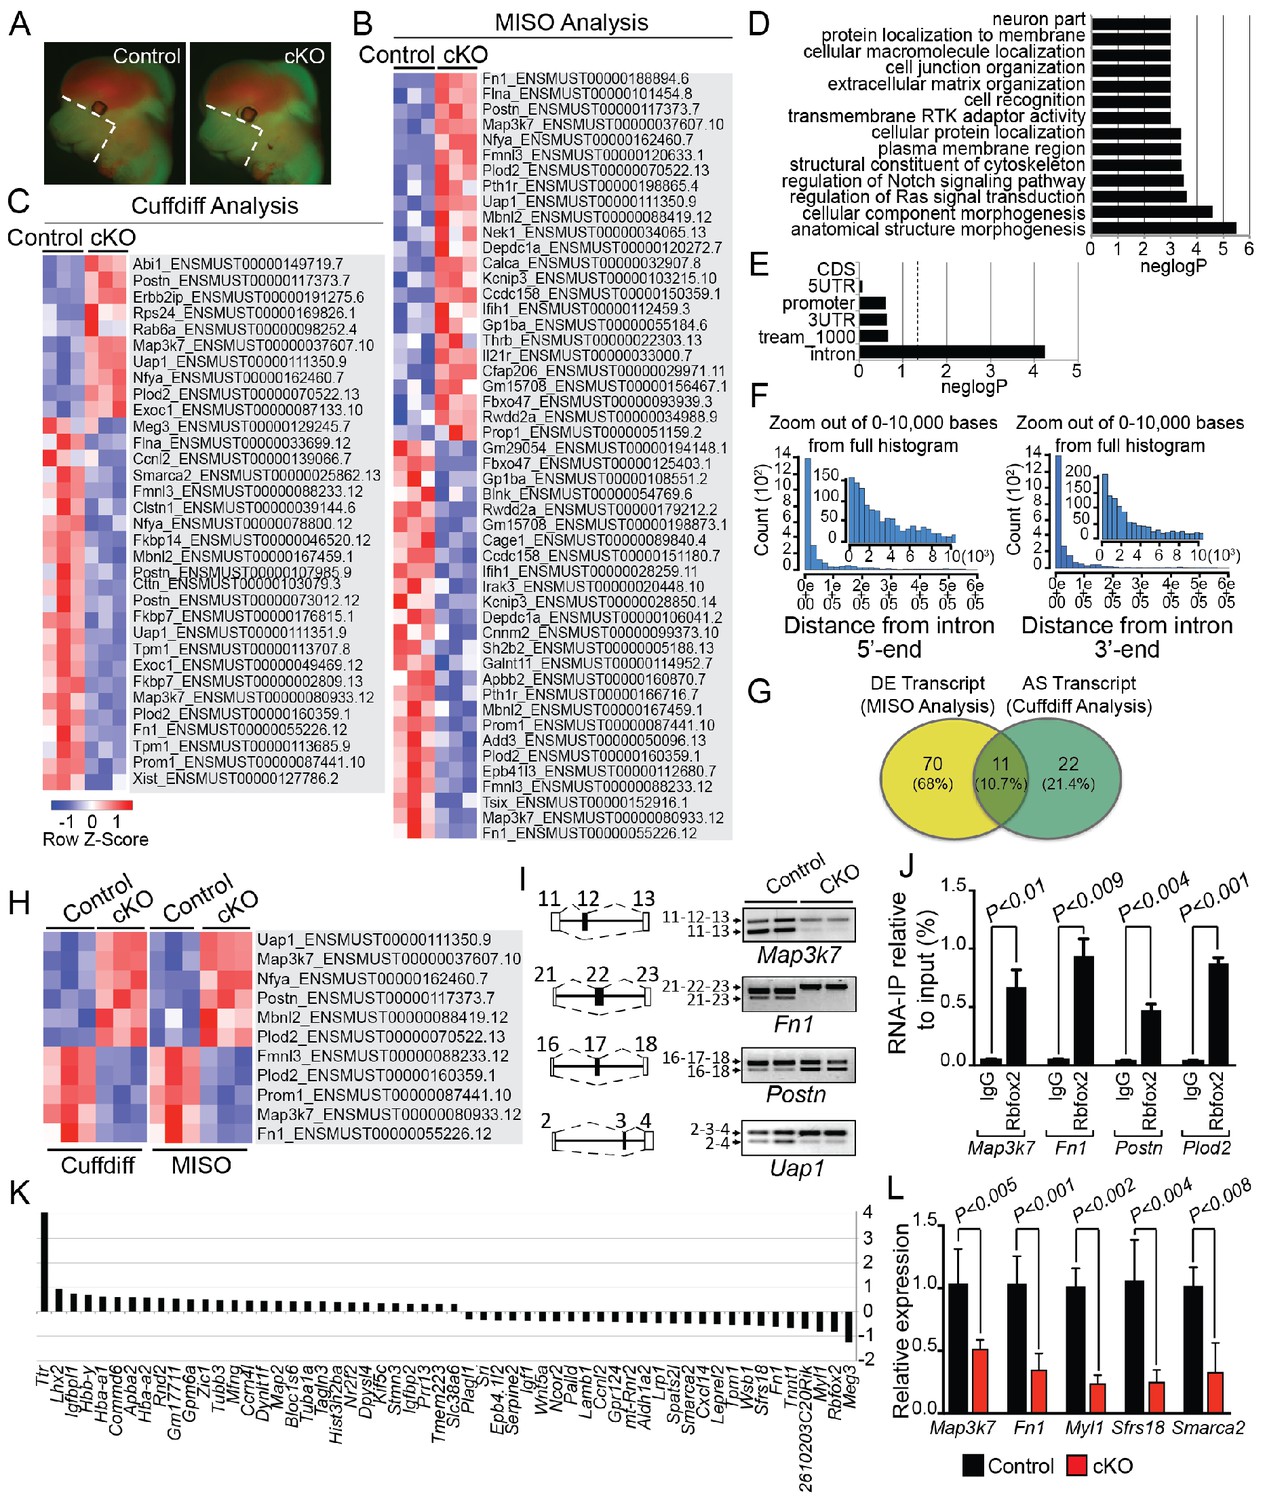
Representative fluorescent images from E12.5 control (n = 3) and Rbfox2Pax3-CKO mutant (represented as cKO, n = 3) embryos showing the area (white, dotted line) of craniofacial tissue microdissected for RNA-Seq analysis (A). Heat map of 50 differentially expressed transcripts (out of a total of 81 transcripts) identified by MISO analysis of RNA-Seq data (B). Heat map of 33 alternatively spliced transcripts identified by Cuffdiff analysis of RNA-Seq data (C). Pathway enrichment analysis of Rbfox2 target genes (D). Motif (UGCAUG) enrichment analysis. Significant enrichment was observed only in the introns of the target genes (E). Location of the intronic UGCAUG sequences in the Rbfox2 target genes (F). Venn diagram showing the overlap of transcripts identified by MISO and Cuffdiff analysis of RNA-Seq data (G). Heat map representation of 11 transcripts identified by both MISO and Cuffdiff analysis (H). RT-PCR analysis of alternative splicing of Rbfox2 targets in control and Rbfox2 mutant cranial mesenchyme from two independent replicates for each genotype (I). The gene structure, illustrating the alternative exons is presented on left. RNA-IP on palatal mesenchymal cells (J). Differentially expressed genes control and Rbfox2 mutants (K). qRT-PCR validation of differentially spliced and differentially expressed genes (L).
-
Figure 5—source data 1
A complete list of transcripts identified by MISO analysis.
- https://doi.org/10.7554/eLife.45418.017
-
Figure 5—source data 2
A complete list of transcripts identified by Cuffdiff analysis.
- https://doi.org/10.7554/eLife.45418.018
Figure 5—figure supplement 1
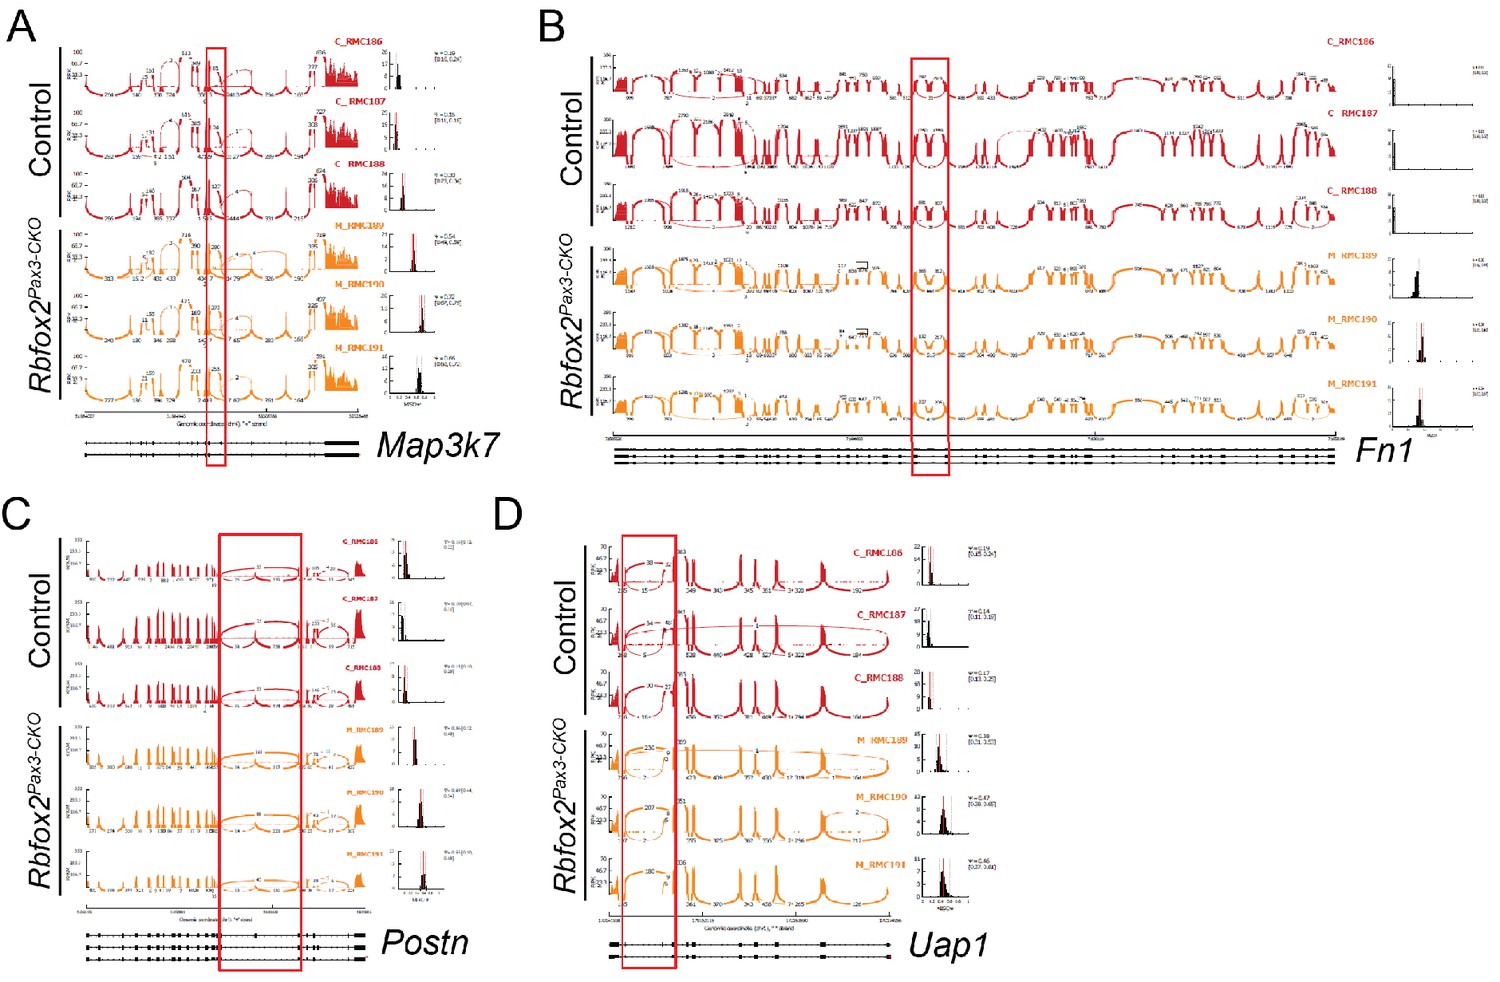
Changes in alternative splicing of Rbfox2 target genes.
Sashimi plot of selected Rbfox2 targets (Map3k7, Fn1, Postn and Uap1) were generated in MISO, depicting the distribution of raw RNA-Seq densities mapped to the exons and splice junctions of gene isoforms across control and mutant samples.
Figure 6 with 2 supplements
Deregulation of Rbfox2-TGFβ-Tak1 signaling axis in Rbfox2 mutant embryos.
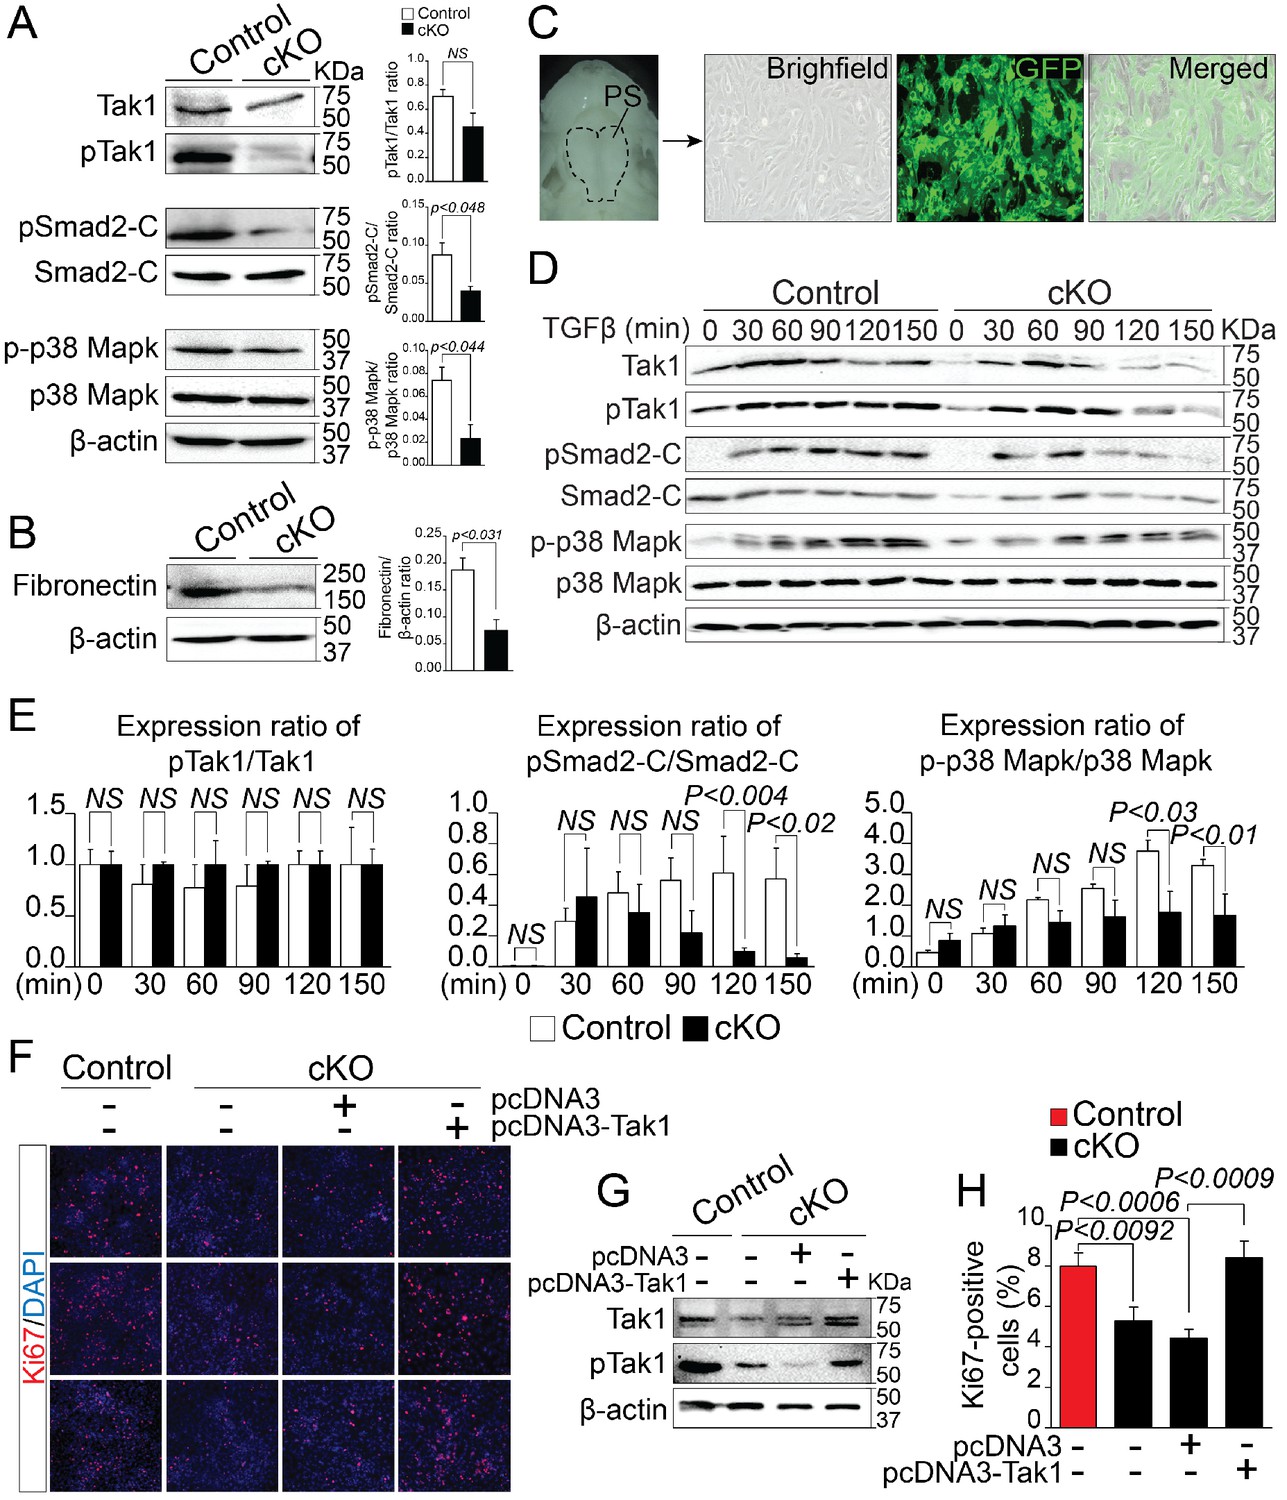
Representative western blot and quantification from microdissected palatal shelves from control and Rbfox2Pax3-CKO embryos (represented as cKO) at E14.5 and analyzed for Tak1, phospho-Tak1, Smad2, phospho-Smad2-C, p38 Mapk and phospho- p38 Mapk (A). Western blot and quantification for fibronectin on control and Rbfox2 mutant embryos at E14.5 (B). Primary palatal mesenchymal cell cultures were established from E14.5 Pax3Cre/+; Rbfox2flox/+; R26mTmG/+ embryos. Representative bright field and fluorescent images were taken. The majority of the cultured cells are GFP positive demonstrating their neural crest origin (C). Representative western blot and quantification from control and Rbfox2 mutant primary palatal mesenchymal cells stimulated with recombinant TGFβ and analyzed for Tak1, phospho-Tak1, Smad2, phospho-Smad2-C, p38 Mapk and phospho-p38 Mapk (D). Quantification of western blot (E). Overexpression of Tak1 in Rbfox2 mutant palatal mesenchymal cells. Ki67 immunostaining to determine palatal mesenchymal cell proliferation (F). Representative western blot for Tak1 and pTak1 (G). Quantification of the percentage of Ki67 positive cells (H). β-Actin was used as loading control. PS, palatal shelves; NS, not significant.
Figure 6—figure supplement 1
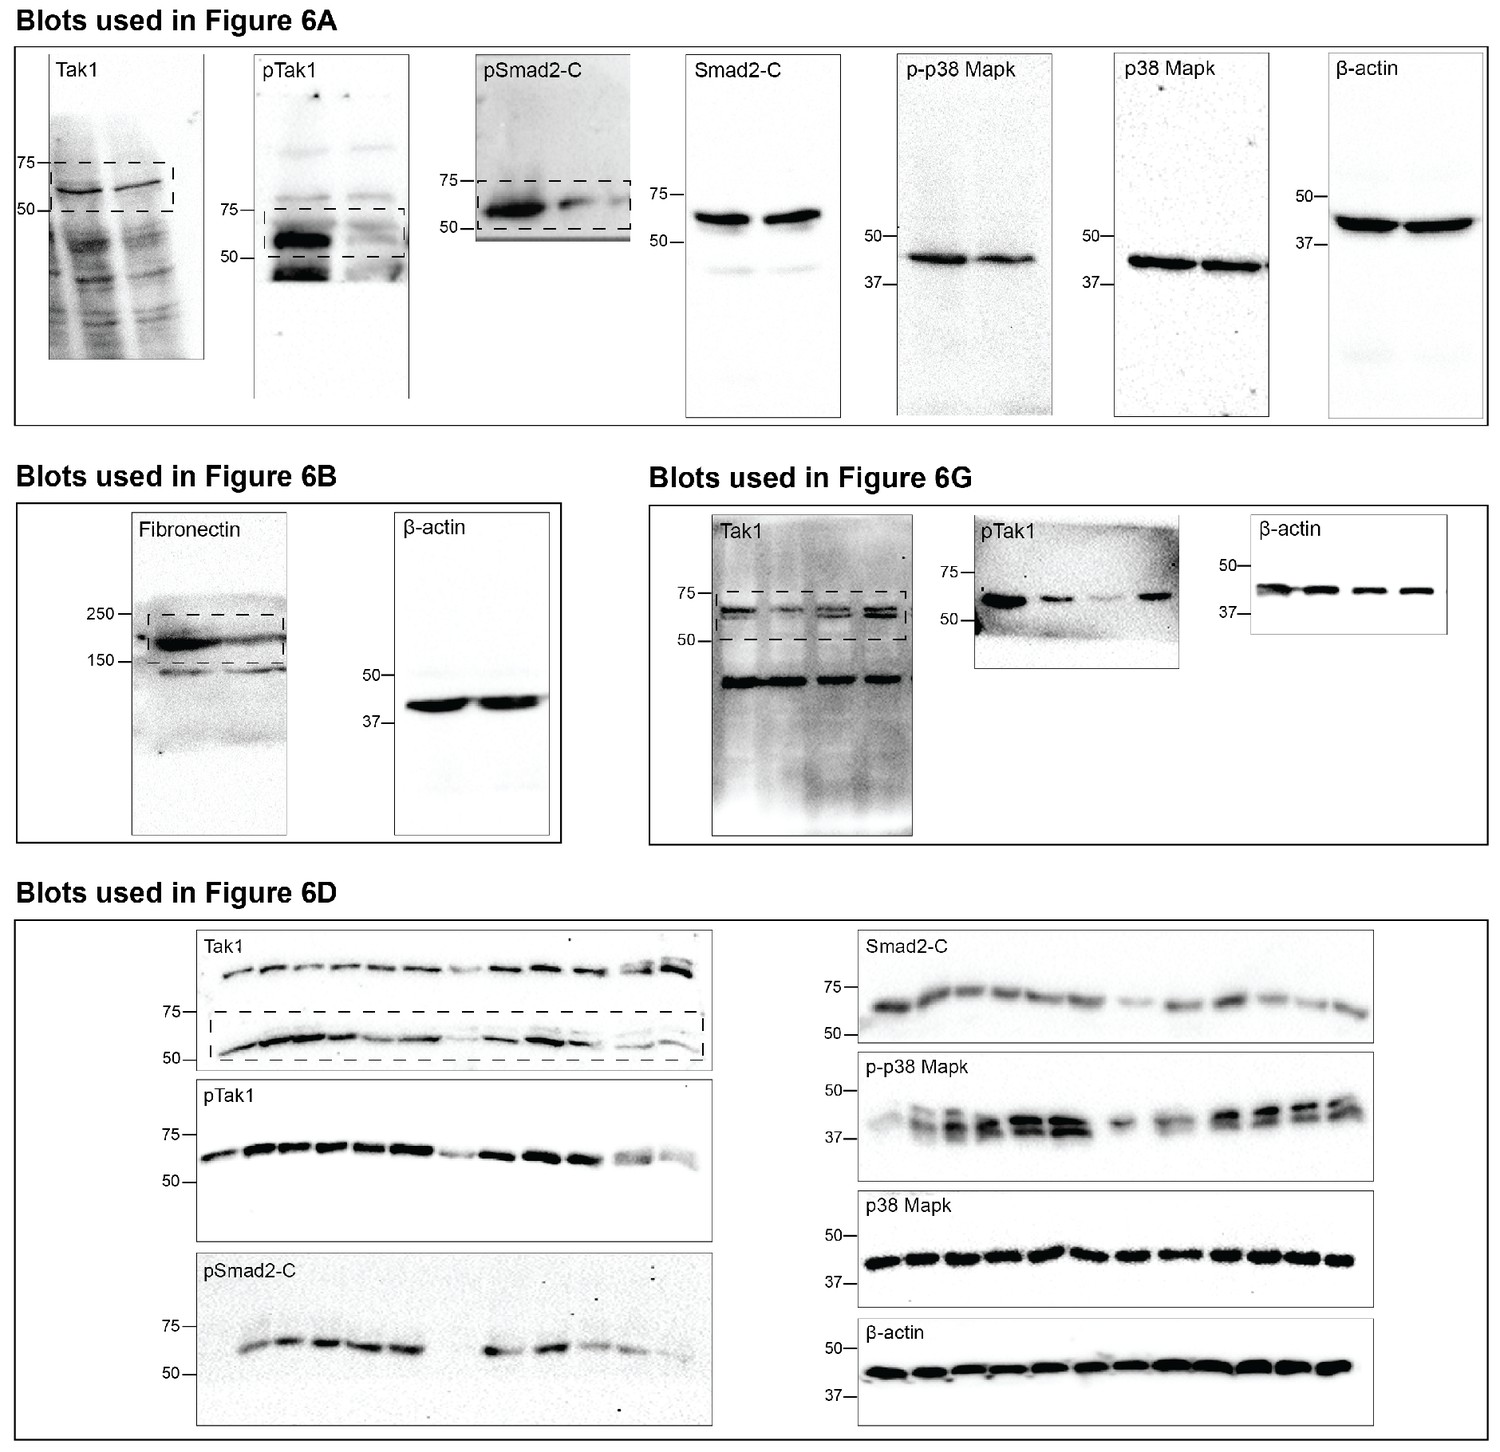
Impaired Rbfox2-TGFβ-Tak1 signaling axis due to Rbfox2 deletion.
Uncropped western blot images presented in Figure 6 of this manuscript. Dotted box indicates areas that were cropped for use in figures when multiple bands observed.
Figure 6—figure supplement 2
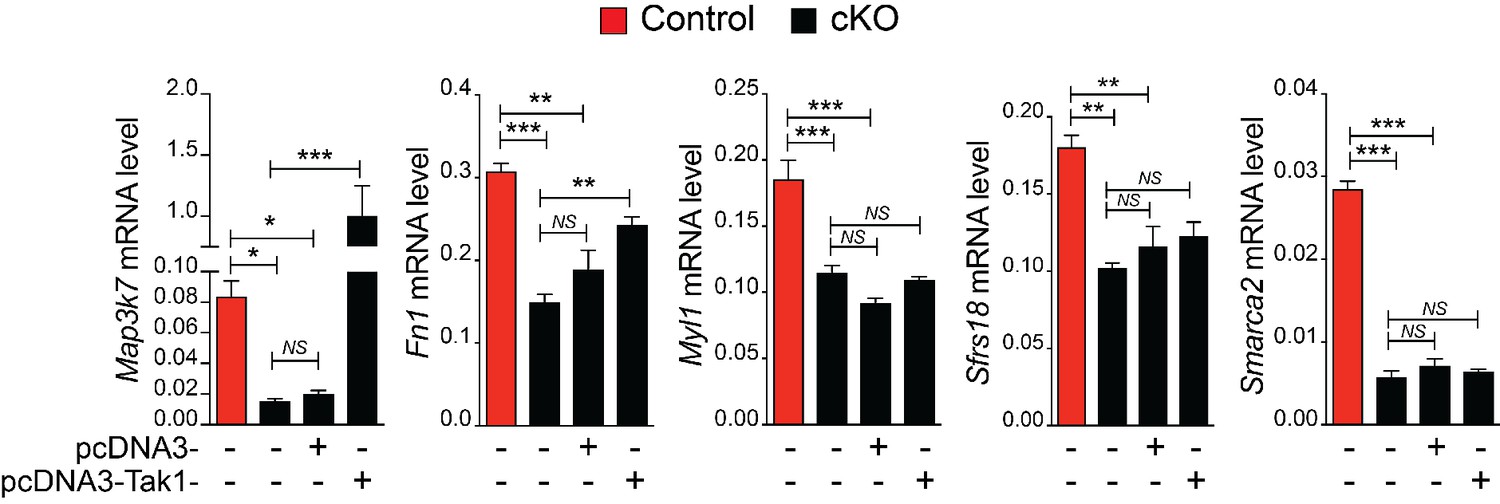
Effect of Tak1 overexpression on Rbfox2 target genes.
Overexpression of Tak1 in Rbfox2 mutant palatal mesenchymal cells. RNA was isolated from control and Rbfox2 mutant cells transfected with either empty plasmid (pcDNA3) or plasmid expressing Tak1 (pcDNA3-Tak1) for qRT-PCR analysis. qRT-PCR analysis for Map3k7, Fn1, Myl1, Sfrs18 and Smarca2. NS, not significant. *, p<0.05; **, p<0.01; ***, p<0.001 (one-way ANOVA between groups, Bonferroni's multiple comparisons test).
Figure 7 with 2 supplements
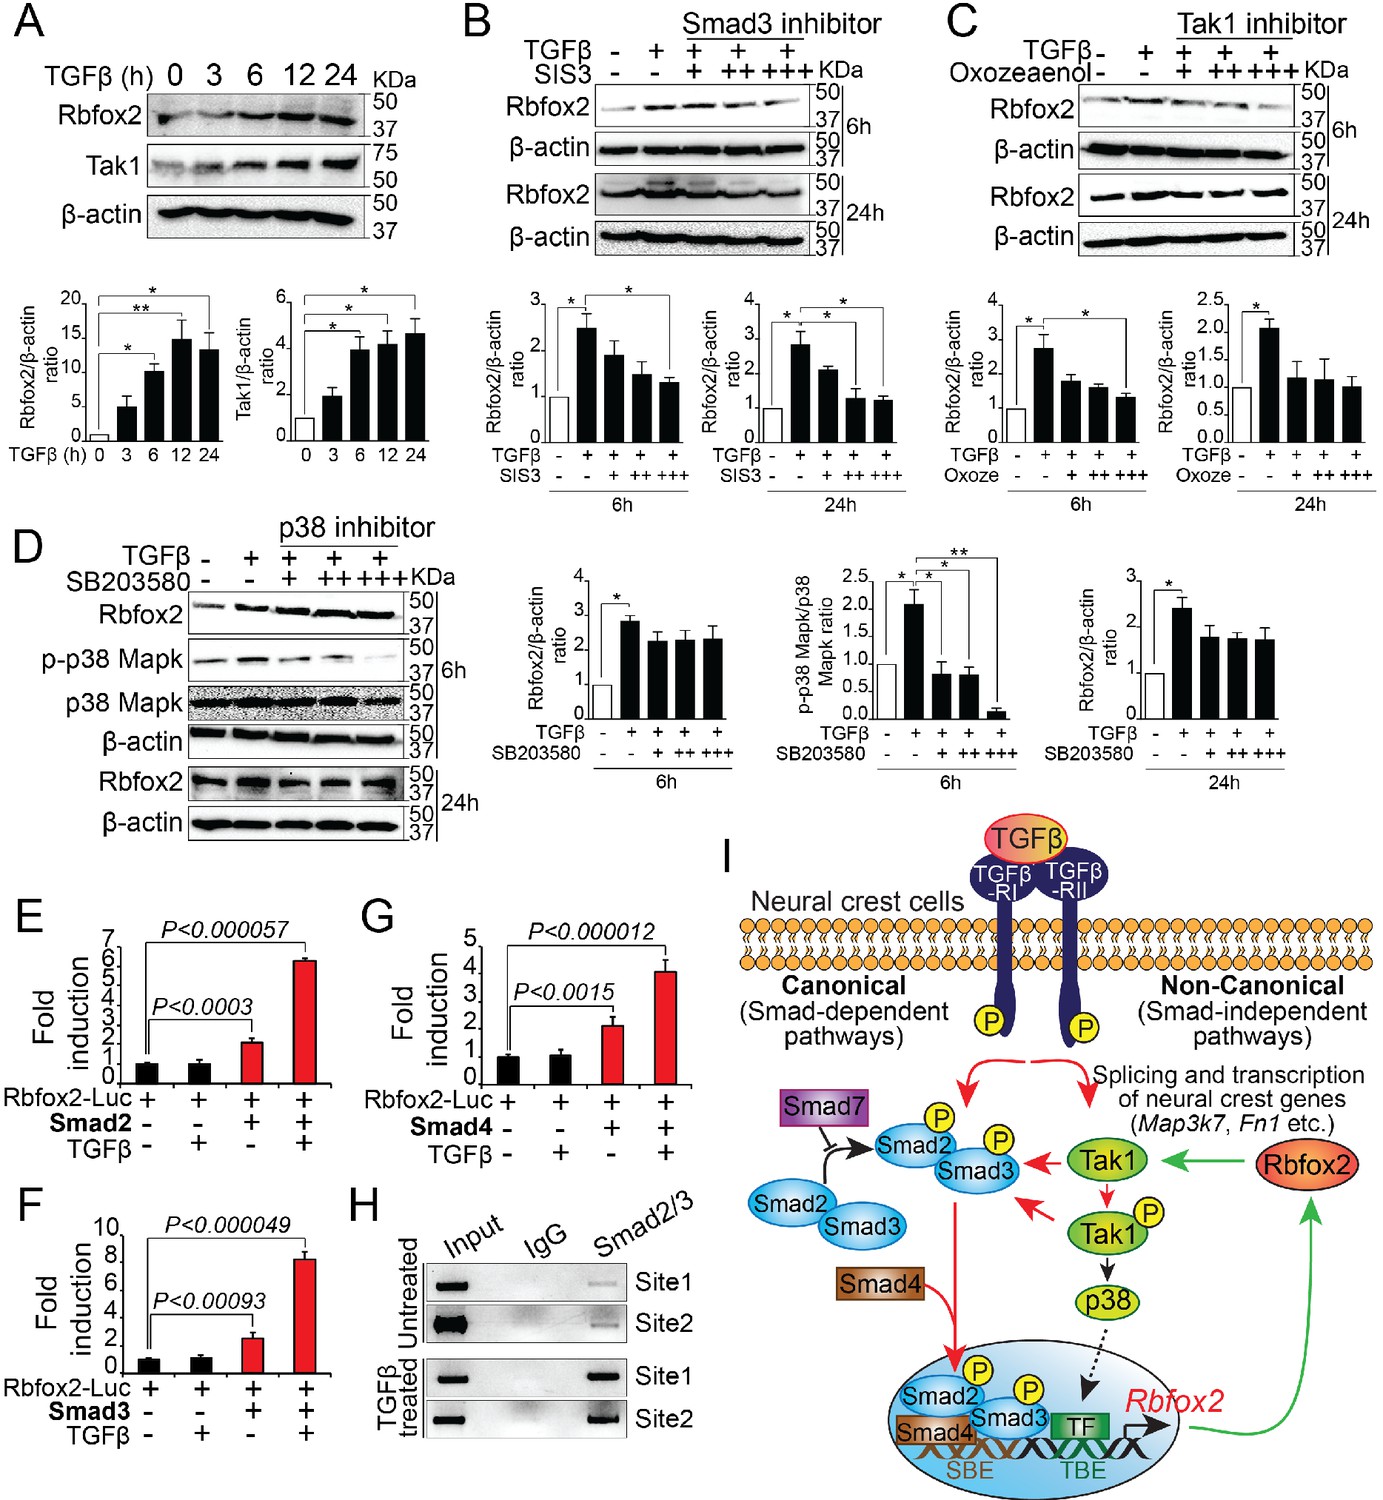
Rbfox2 expression is regulated by TGFβ signaling pathway in neural crest-derived palatal cells.
Representative western blot and quantification demonstrating induction of Rbfox2 in primary palatal mesenchymal cells stimulated with recombinant TGFβ. β-Actin was used as a loading control (A). Representative Rbfox2 western blot and quantification from primary palatal mesenchymal cells stimulated with recombinant TGFβ with and without, Smad3 inhibitor (SIS3) or Tak1 inhibitor (5Z-7-Oxozeaenol) or p38 inhibitor (SB203580) at 6 and 24 hr time points. β-Actin was used as a loading control (B–D). *, p<0.05; **, p<0.01 (one-way ANOVA between groups, Bonferroni's multiple comparisons test). The Rbfox2-luciferase reporter was transfected in HEK293T cells with or without recombinant TGFβ in the presence or absence of Smad2 (E) or Smad3 (F) or Smad4 (G). ChIP assay using chromatin from untreated or TGFβ treated primary palatal mesenchymal cells and Smad2/3 antibody. Predicted binding sites in Rbfox2 promoter were tested (H). Model depicting the interaction between the TGF-β signaling pathway and alternative splicing factor Rbfox2 in neural crest cells. Rbfox2 regulates alternative splicing and transcription of neural crest genes. In a feedback loop, Rbfox2 expression is regulated by the canonical TGFβ signaling pathway (red arrows) (I).
Figure 7—figure supplement 1

Rbfox2 expression is regulated by TGFβ signaling pathway.
Uncropped western blot images presented in Figure 7 of this manuscript. Dotted box indicates areas that were cropped for use in figures when multiple bands observed.
Figure 7—figure supplement 2
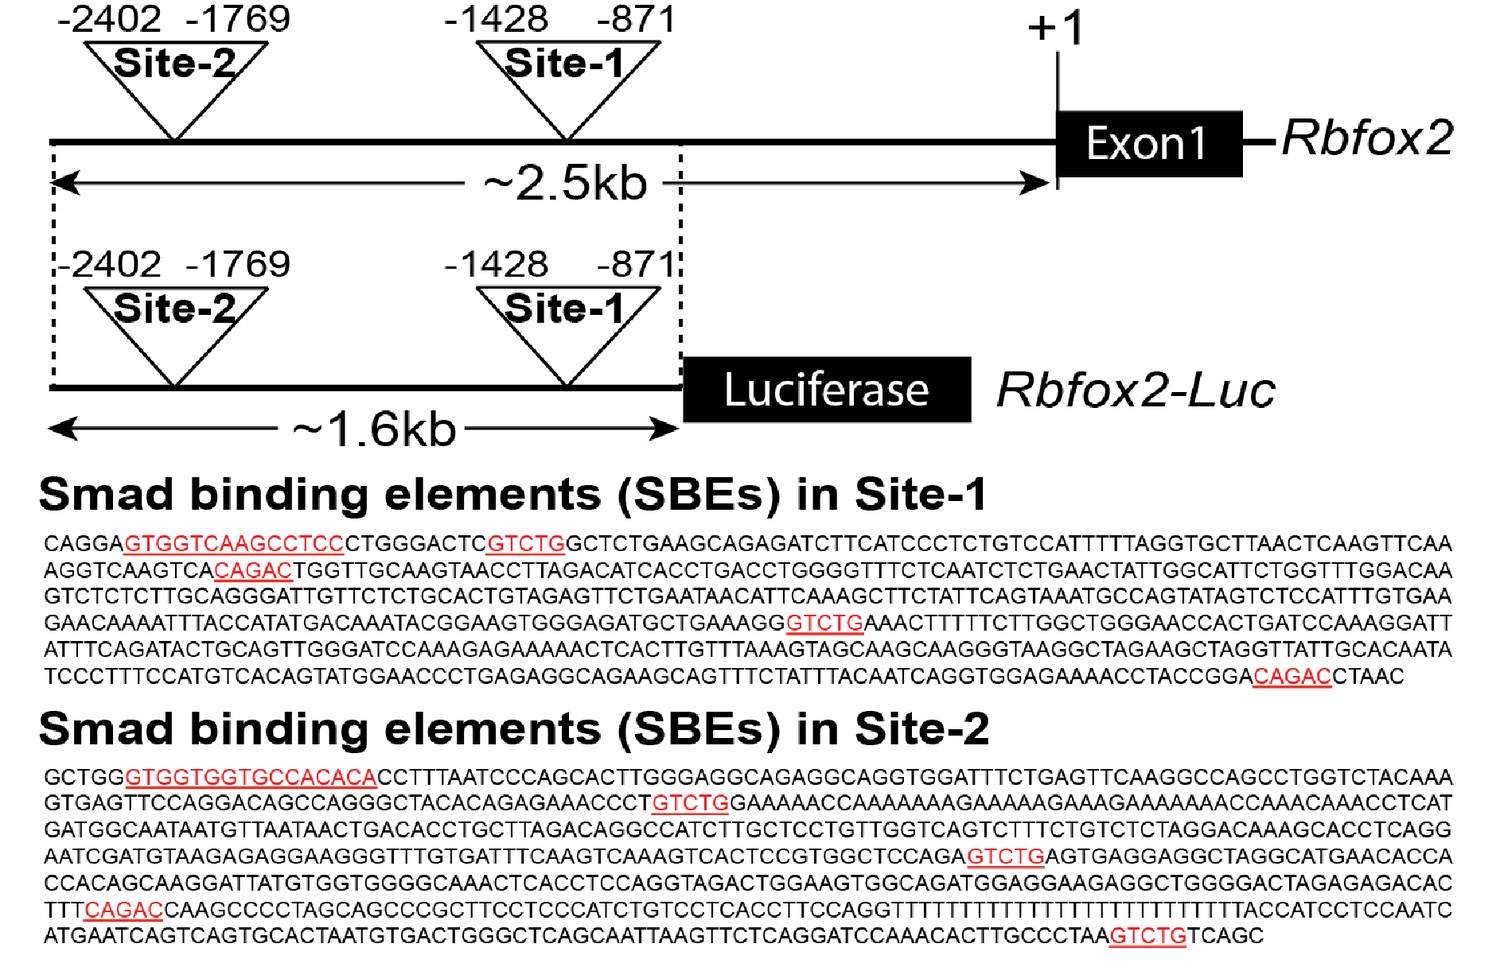
Rbfox2 promoter analysis.
Predicted sites (Site1 and Site2) in 2.5 kb Rbfox2 promoter containing Smad binding elements (SBEs). Schematic of the Rbfox2-luciferase (Luc)-reporter construct. Multiple SBEs present in predicted sites (Site1 and Site2) are highlighted in red color.
Tables
Key resources table
| Reagent type (species) or resource | Designation | Source or reference | Identifiers | Additional information |
|---|---|---|---|---|
| Genetic reagent (M. musculus) | Rbfox2flox/flox | (Gehman et al., 2012) | IMSR Cat# JAX:014090, RRID:IMSR_JAX:014090 | |
| Genetic reagent (M. musculus) | Pax3Cre/+ | (Engleka et al., 2005) | IMSR Cat# JAX:005549, RRID:IMSR_JAX:005549 | |
| Genetic reagent (M. musculus) | Wnt1Cre2 | (Lewis et al., 2013) | IMSR Cat# JAX:022137, RRID:IMSR_JAX:022137 | |
| Genetic reagent (M. musculus) | R26mTmG/+ | (Muzumdar et al., 2007) | IMSR Cat# JAX:007676, RRID:IMSR_JAX:007676 | |
| Antibody | anti-Tak1 (mouse monoclonal) | Santa Cruz Biotechnology | Cat# sc-166562, RRID:AB_2140220 | WB (1:300) |
| Antibody | anti-Fibronectin (mouse monoclonal) | Santa Cruz Biotechnology | Cat# sc-8422, RRID:AB_627598 | WB (1:300) |
| Antibody | anti-β-actin (mouse monoclonal) | Santa Cruz Biotechnology | Cat# sc-47778, RRID:AB_626632 | WB (1:1000) |
| Antibody | anti-pTak1 (rabbit polyclonal) | Cell Signaling Technology | Cat# 9339, RRID:AB_2140096 | WB (1:500) |
| Antibody | anti-Smad2-C (rabbit monoclonal) | Cell Signaling Technology | Cat# 5339, RRID:AB_10626777 | WB (1:500) |
| Antibody | anti-pSmad2-C (rabbit monoclonal) | Cell Signaling Technology | Cat# 3108, RRID:AB_490941 | WB (1:500) |
| Antibody | anti-p38 Mapk (rabbit polyclonal) | Cell Signaling Technology | Cat# 9212, RRID:AB_330713 | WB (1:500) |
| Antibody | anti-p-p38 Mapk (rabbit monoclonal) | Cell Signaling Technology | Cat# 4631, RRID:AB_331765 | WB (1:500) |
| Antibody | anti-Rbfox2 (mouse monoclonal) | Abcam | Cat# ab57154, RRID:AB_2285090 | WB (1:500), IF (1:25) |
| Antibody | anti-Ki67 (rabbit monoclonal) | Abcam | Cat# ab16667, RRID:AB_302459 | IHC (1:100) |
| Antibody | anti-αSMA (mouse monoclonal) | Sigma-Aldrich | Cat# A2547, RRID:AB_476701 | IHC (1:100) |
| Antibody | anti-Neurofilament (mouse monoclonal) | DSHB | Cat# 2H3, RRID:AB_531793 | Wholemount staining (1:50) |
| Recombinant DNA reagent | pCMV5B-HA-Smad2 plasmid | Addgene | RRID:Addgene_11734 | |
| Recombinant DNA reagent | pCMV5B-Flag-Smad3 plasmid | Addgene | RRID:Addgene_11742 | |
| Recombinant DNA reagent | pCMV5B-Smad4 plasmid | Addgene | RRID:Addgene_11743 | |
| Recombinant DNA reagent | pcDNA3-TAK1/F plasmid | Addgene | RRID:Addgene_44161 |
Additional files
-
Transparent reporting form
- https://doi.org/10.7554/eLife.45418.025
Download links
A two-part list of links to download the article, or parts of the article, in various formats.
Downloads (link to download the article as PDF)
Open citations (links to open the citations from this article in various online reference manager services)
Cite this article (links to download the citations from this article in formats compatible with various reference manager tools)
Neural crest-specific deletion of Rbfox2 in mice leads to craniofacial abnormalities including cleft palate
eLife 8:e45418.
https://doi.org/10.7554/eLife.45418


