DDR2 controls breast tumor stiffness and metastasis by regulating integrin mediated mechanotransduction in CAFs
- Washington University, United States
Figures
Figure 1
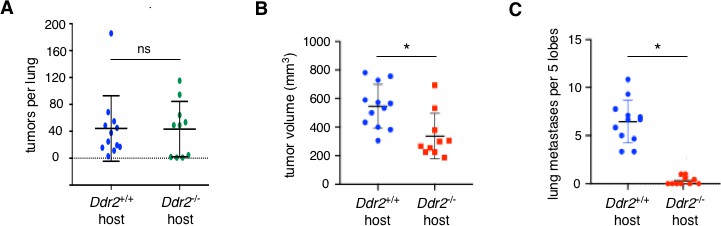
The primary effect of DDR2 in stromal cells is at the primary tumor site not lung metastatic site.
(A) Lung colonization assay. Number of tumors per lung at 2 weeks after tail vein injection of GFP-Luciferase PyMT breast tumor cells (Ddr2+/+) into syngeneic FVB/n Ddr2 WT (Ddr2+/+) mice (11 mice; n = 11) or ubiquitous Ddr2 null (Ddr2-/-) mice (10 mice; n = 10). (B and C) Orthotopic transplant metastasis assay. DDR2 +ve 4T1 breast tumor cells were transplanted into the breast of syngeneic Balb/c Ddr2+/+ (12 mice; n = 12) or ubiquitous Ddr2-/- (10 mice;n = 10) recipients. Primary tumor volume (B) and number of lung metastases (C) were scored at 3 weeks after transplant. In all experiments, tumors were scored and enumerated histologically. Statistics were one-way ANOVA with Tukey’s post hoc test. *p<0.05, ns - no significant difference.
Figure 2 with 3 supplements
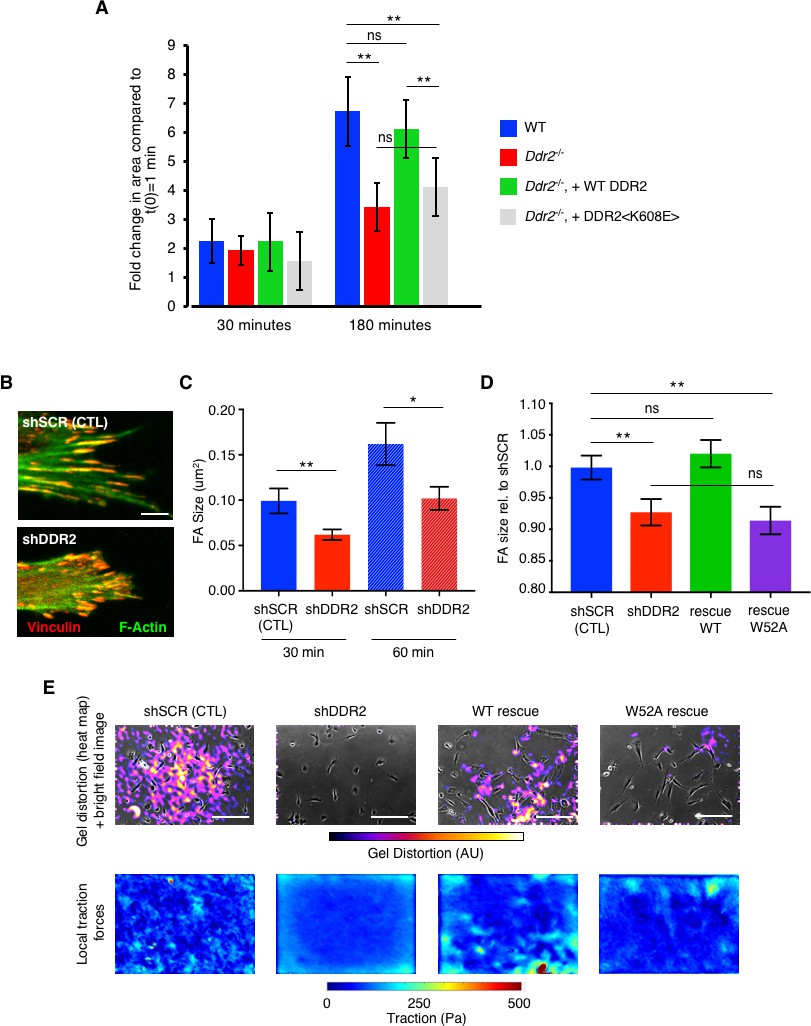
DDR2 influences mechanotransduction by cancer associated fibroblasts.
(A) Cell Spreading Assay. Mouse breast CAFs were added to collagen I coated plates for 30 or 180 min. Blue columns WT CAFs; red columns Ddr2-/- CAFs; green columns Ddr2-/- CAFs rescued with WT DDR2; gray columns Ddr2-/- CAFs rescued with tyrosine kinase dead mutant DDR2 <K608E>. Cell area was determined from phase contrast image in movies. Time = 0 was the area of each cell 10 min after plating. All values are normalized to t = 0 for each cell type which was arbitrarily set to equal 1. At least 100 cells for each genotype were analyzed. (B) Representative confocal images of focal adhesions (as detected by Vinculin (red) and F-Actin (green) immunofluorescence) in WT (shSCR) or Ddr2-depleted (shDDR2) hCAFs plated on collagen I coated coverslips overnight. Scale bar = 10 um. (C) Quantification of focal adhesion size of indicated hCAFs plated on collagen I coated coverslips after 30 or 60 min. (D) Quantification of focal adhesion size of indicated hCAFs after plating on collagen I for 18 hr. For all focal adhesion measurements in each cell type and time point, >600 total focal adhesions from 20 different cells were measured. (E) Traction forces generated by indicated hCAF plated on collagen I-coated soft polyacrylamide gels embedded with fluorescent beads. Top row- heat map of bead displacement field overlaid on bright field image of cells; bottom row- field of calculated forces. Scale bars = 100 um. In all panels, statistics were one-way ANOVA with Tukey’s post hoc test. Unless otherwise noted, *p<0.05, **p<0.01, ***p<0.001, ns no significant difference.
Figure 2—figure supplement 1
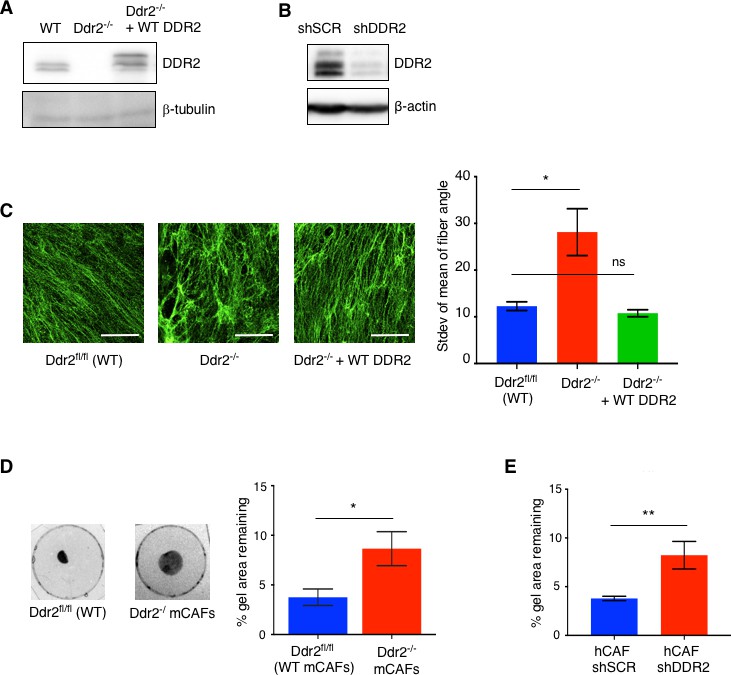
DDR2 influences mechanotransduction by cancer associated fibroblasts supplement 1.
(A) Western blot of WT, Ddr2-/- (FSP1-Cre) and Ddr2-/- mouse CAFs (mCAF) rescued with WT DDR2 with indicated antibodies. (B) Western blot of control shSCR or shDDR2 infected human CAFs (hCAFs) with indicated antibodies. (C) Representative collagen immunofluorescence images of ECM produced by WT, Ddr2-/- FSP1cre; and Ddr2-/- mCAFs rescued with WT DDR2. Scale bar = 50 um. Graph (right) is quantification of fiber angles relative to the horizontal. Plotted as the standard deviation of the mean of fiber angles in each image, higher stdev indicates a more disorganized state. n = 4–6 fields per genotype and 15 fibers analyzed per field. *p=0.0199. (D) Collagen gel contraction by WT and Ddr2-/- FSP1cre mCAFs. Quantified on right and presented as percent gel remaining. n = 6 per group. *p<0.05. (E) Collagen gel contraction of human control shSCR and shDDR2 hCAFs. n = 3 per group. **p<0.01.
Figure 2—figure supplement 2
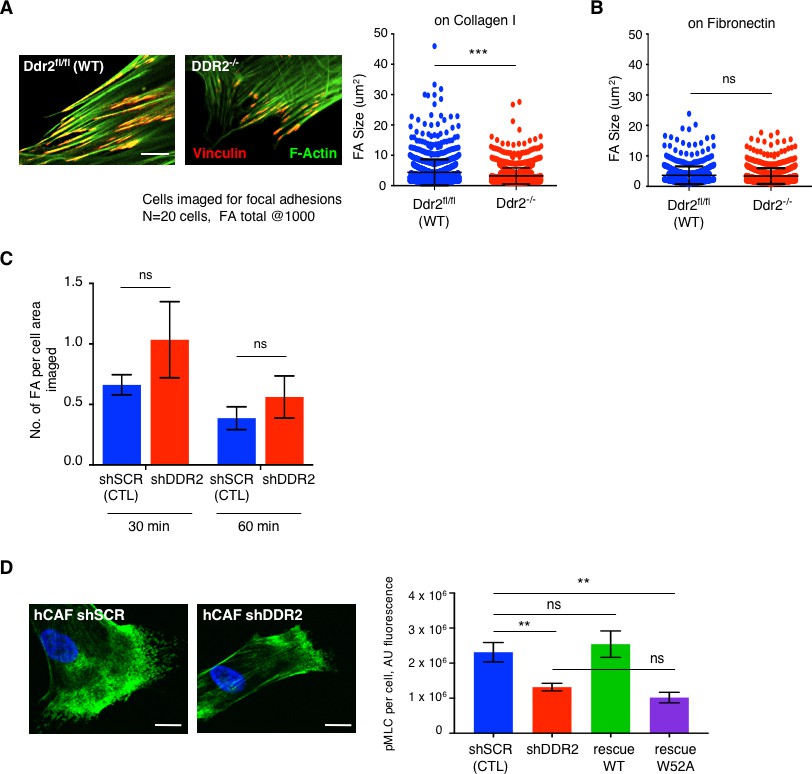
DDR2 influences mechanotransduction by cancer associated fibroblasts supplement 2.
(A) Representative immunofluorescence images of focal adhesions formed by WT and Ddr2-/- FSP1cre mCAF plated on collagen I for 60 min. Scale bar = 10 um. Focal adhesions were detected with vinculin (red) and F-actin (green) staining. For each genotype 20 cells were analyzed and @1,000 FA scored. (B) FA size of same cells as in (A) after plating on Fibronectin coated plates for 60 min. (C) Number of FA formed in control shSCR and shDDR2 hCAFs plated on collagen for 30 and 60 min. (D) pMLC staining of control shSCR and shDDR2 hCAFs plated on collagen I for 60 min. Scale bar = 10 um. Graph on right is a quantification of pMLC staining (fluorescence) for indicated cells. p-MLC levels were corrected for cell area. 5 cells per genotype were analyzed. *p<0.05, **p<0.01, ***p<0.001; ns = no significant difference.
Figure 2—figure supplement 3

DDR2 influences mechanotransduction by cancer associated fibroblasts supplement 3.
(A) Amount of exogenously expressed rescue DDR2 isoforms in mouse CAFs, as indicated, as determined by total cellular fluorescence normalized to cell area. ns = no significant difference. (B) Western blot of Ddr2 deficient hCAFs rescued with WT DDR2, DDR2 <K608E> (Kinase dead), or DDR2 <W52A> without (-) or with (+) collagen I stimulation for 6 hr, with indicated antibodies. (C) Western blot with anti-DDR2 antibodies of cell surface cross-linking of the indicated DDR2 isoforms expressed in Ddr2-/- mCAFs using a cell impermeable covalent cross-linker BS3. Cells were treated with collagen I (+) or not (-) before analysis.
Figure 3 with 1 supplement
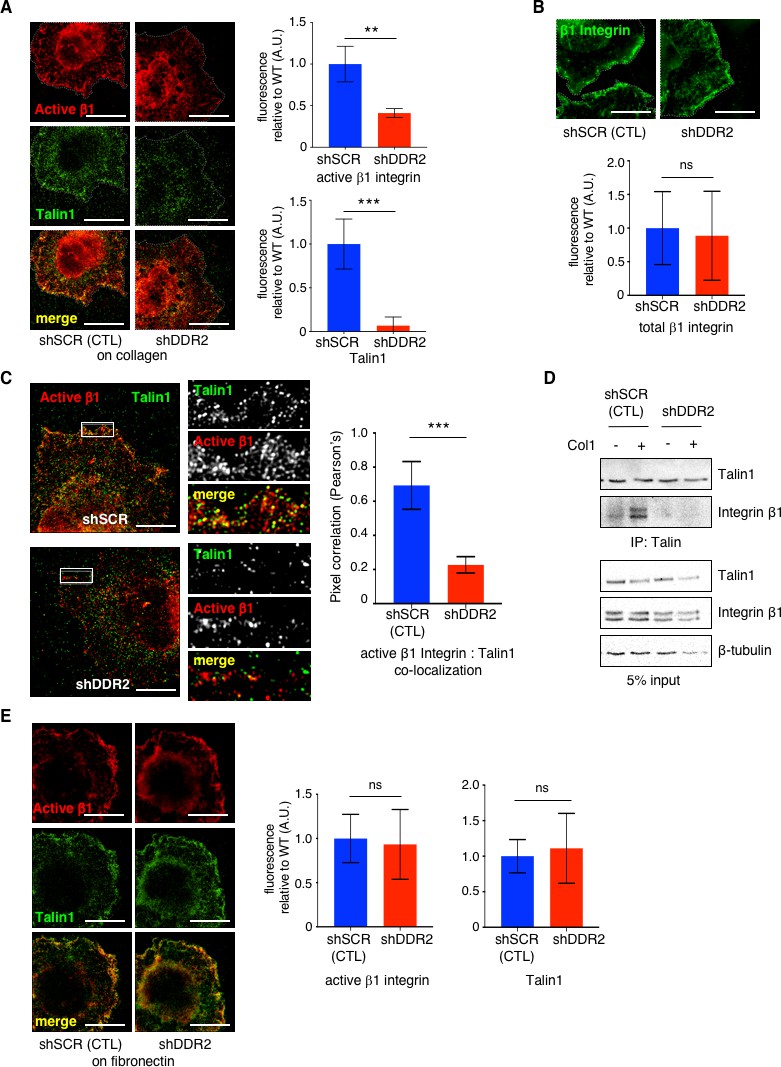
DDR2 is required for full activation of collagen binding β1 Integrin in CAFs.
(A) Representative n-SIM super-resolution microscopy images of control hCAFs (shSCR) or hCAFs depleted of Ddr2 (shDDR2) showing active integrin β1 (9EG7; red) and Talin1 (green) immunofluorescence after plating cells for 15 min on collagen I coated coverslips. Quantified in graphs on right. Fluorescence of each protein at cell surface of protrusions in WT cells was arbitrarily set = 1, and at least 20 cells for each genotype were analyzed. (B) Representative n-SIM super-resolution microscopy images of control hCAFs (shSCR) or hCAFs depleted of Ddr2 (shDDR2) showing total integrin β1 (green) immunofluorescence after plating cells for 15 min on collagen I coated coverslips. Quantified in graph below. Fluorescence at cell surface of protrusions in WT cells was arbitrarily set = 1 and at least 20 cells were analyzed. (C) Representative n-SIM super-resolution microscopy images of control hCAFs (shSCR) or hCAFs depleted of Ddr2 (shDDR2) showing active integrin β1 (9EG7; red) and Talin1 (green) immunofluorescence after plating cells for 15 min on collagen I coated coverslips. Images on right are higher resolution images of area within the white box. Quantification of active integrin β1 (9EG7) and Talin1 co-localization (Pearson’s coefficient) is presented in graph on right. At least 20 cells of each genotype were analyzed. ***p<0.0004. (D) Coimmunoprecipitation of Talin1 and integrin β1 (upper panel) and 5% input control (lower panel) from control hCAF (shSCR) and hCAF depleted of DDR2 (shDDR2) cells plated on collagen I coated plates (+) or no collagen (-) for 1 hr. This a representative result of 1 of 3 separate experiments. (E) Representative n-SIM super-resolution microscopy images of control hCAF (shSCR) or hCAF depleted of Ddr2 (shDDR2) plated on fibronectin coated coverslips for 15 min showing active integrin β1 (9EG7, red) or Talin1 (green) immunofluorescence. Bar graphs (right) are immunofluorescent quantification of active integrin β1 (left) or Talin1 (right) at cell surface of protrusions. All analyses of total fluorescence were normalized by cell area and at least 20 cells of each genotype were analyzed. Scale bars = 10 um. In all panels, statistics were one-way ANOVA with Tukey’s post hoc test. Unless otherwise noted, **p<0.01, ***p<0.001, ns no significant difference.
Figure 3—figure supplement 1
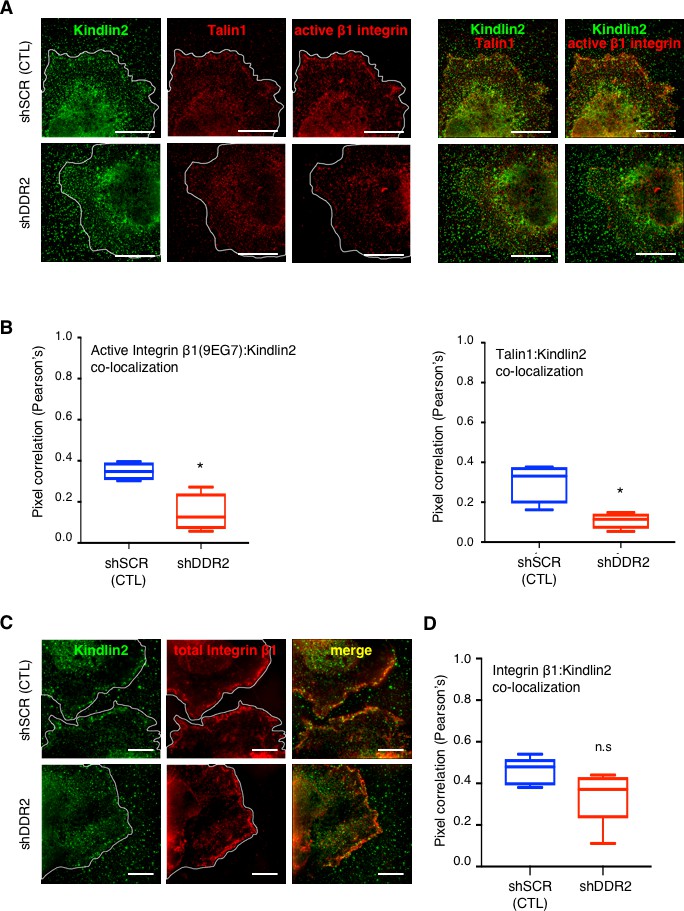
DDR2 is required for full activation of collagen binding b1 Integrin in CAFs supplement 1.
(A) Representative n-SIM super-resolution microscopy images of control shSCR WT (upper panels) and shDDR2 (lower panels) hCAFs plated on collagen I for 15 min and stained for active integrin β1 (red), Kindlin2 (green), or Talin1 (red) as indicated. Scale bar = 10 um. (B) Quantification of co-localization of active integrin β1:Kindlin2 (left) and Talin1:Kindlin2 (right). Co-localization was measured from n-SIM super-resolution images and quantified by Pearson’s coefficient. 10 cells of each genotype were analyzed. (C) Representative n-SIM super-resolution microscopy images of control shSCR WT (upper panels) and shDDR2 (lower panels) hCAFs plated on collagen I for 15 min and stained for total integrin β1 (red) and Kindlin2 (green) as indicated. Scale bar = 10 um. (D) Quantification of co-localization of total integrin β1: Kindlin2. Co-localization was measured from n-SIM super-resolution images and quantified by Pearson’s coefficient. 10 cells of each genotype were analyzed. **p=0.0078, *p=0.0123.
Figure 4 with 1 supplement
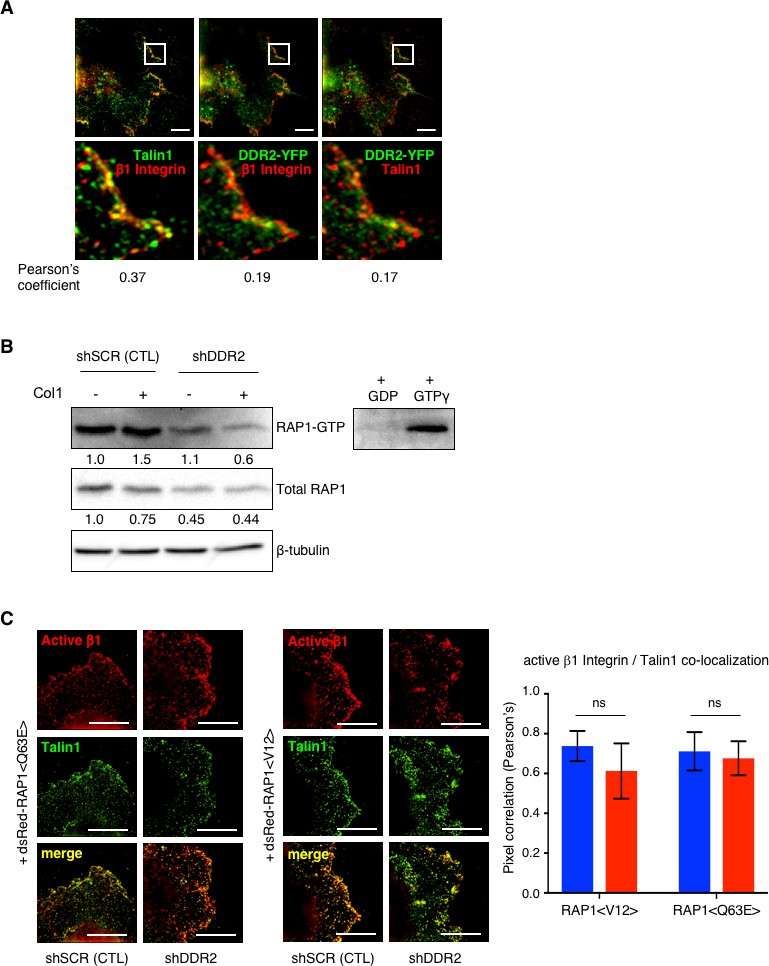
Collagen I stimulated DDR2 activates Rap1 that controls Talin1 activation and recruitment to collagen binding β1 Integrins.
(A) n-SIM super resolution microscopy images of Talin1 (green) and total integrin β1 (red) (left panels), DDR2-YFP (green) and total integrin β1 (red) (middle panels), or DDR2-YFP (green) and Talin1 (red) (right panels) immunofluorescence in WT hCAFs plated on collagen I. All lower panels are a higher resolution image of white boxed region in upper panels. Co-localization was quantified by Pearson’s coefficient which is listed below each set of panels. All analyses of total fluorescence were normalized by cell area and at least 20 cells were analyzed. Scale bars = 5 um. (B) RAP1 activation assay. RAP1-GTP pulldown with RAL GDS RAP1 binding domain attached to agarose was Western blotted with an anti-RAP1 antibody (upper panel), input control (5%) RAP1 level (middle panel) and loading control (lower panel). Control hCAF (shSCR) and hCAF depleted of Ddr2 (shDDR2) cells were plated on collagen I (+) or no collagen (-) for 15 min. GDP and GTPγ negative and positive controls on right. Results were quantified by densitometry in ImageJ and normalized to β-tubulin and total RAP1. Shown is a representative experiment of 3 replicates. (C) Representative n-SIM super-resolution microscopy images of control hCAF (shSCR) and hCAF depleted of Ddr2 (shDDR2) transfected with dsRed-RAP1 <Q63E> or dsRed-RAP1 <V12> plated on collagen I for 15 min, fixed, and stained for active integrin β1 (9EG7 - red) or Talin1 (green) antibodies. Scale bars = 10 um. Graph on right shows quantification of active integrin β1:Talin1 colocalization at cell surface of cell protrusions following introduction of constitutively active versions of RAP1. At least 20 cells were analyzed. In all panels, statistics were one-way ANOVA with Tukey’s post hoc test. Unless otherwise stated, **p<0.01, ***p<0.001, ns - no significant difference.
Figure 4—figure supplement 1
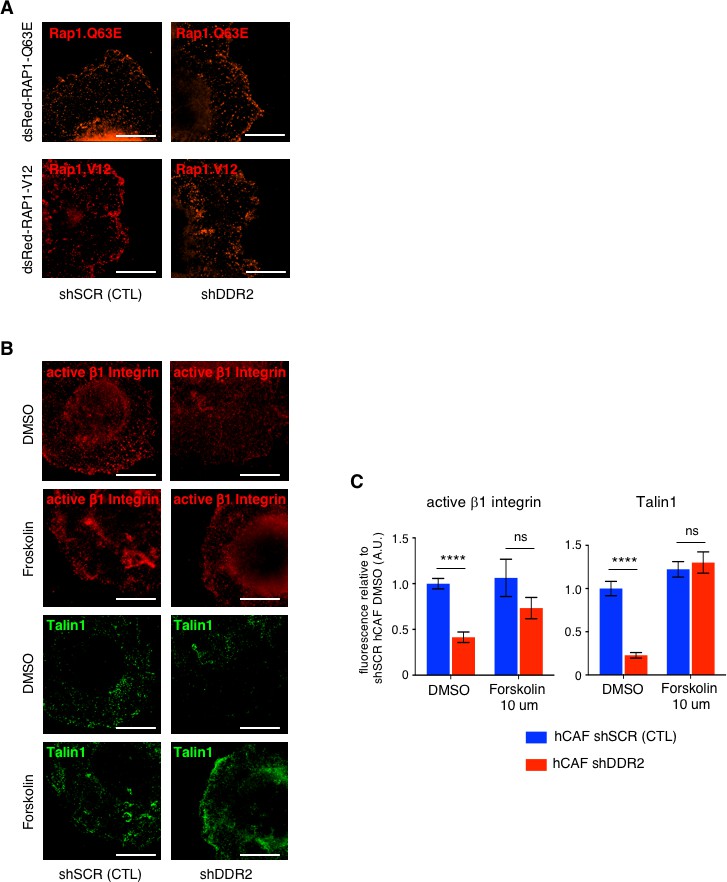
Collagen I stimulated DDR2 activates Rap1 that controls Talin1 activation and recruitment to collagen binding b1 Integrins supplement 1.
(A) Representative n-SIM super-resolution microscopy images of dsRed-RAP1 <Q63E> or dsRed-RAP1 <V12> transfected shSCR WT or shDDR2 hCAFs. Scale bars = 10 um. (B) Representative n-SIM super-resolution microscopy images showing expression of active β1 integrin (9EG7-red) and Talin1 (green) in control shSCR WT or shDDR2 hCAFs treated with 10 um forskolin or DMSO control for 4 hr and then plated on collagen I coated coverslips for 15 min. Scale bars = 10 um. (C) Quantification of the amount of active β1 integrin (left) and Talin1 (right) at cell surface of protrusions, normalized to cell area. From results in (B). 10 cells of each genotype were analyzed. ****p<0.0001, ns = no significant difference.
Figure 5 with 1 supplement
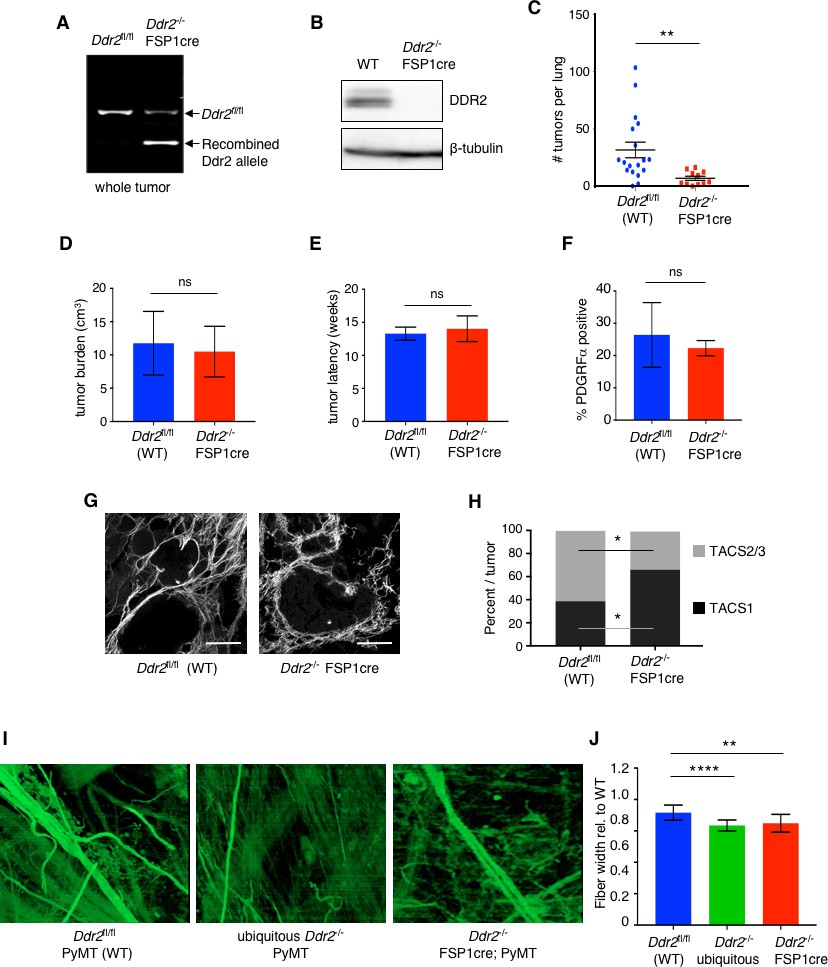
Deletion of Ddr2 in breast tumor CAFs results in altered collagen fiber organization and decreased lung metastases.
(A) DNA PCR genotyping of Ddr2 alleles from whole tumors from indicated mice. (B) Western blot of CAFs isolated from MMTV-PyMT (WT) or FSP1cre; Ddr2fl/fl; MMTV-PyMT (Ddr2-/- FSP1cre) mice with the indicated antibodies. (C) Number of total lung metastases in MMTV-PyMT (WT) (n = 18 mice) or FSP1cre; Ddr2fl/fl; MMTV-PyMT (Ddr2-/-; FSP1cre) (n = 10 mice) mice at termination (@20 weeks or when a single tumor reached 2 cm). **p=0.0095. All mice were >99% FVB/n. Lung tumors were enumerated histologically. (D) Primary tumor growth rate in MMTV-PyMT (WT) (n = 18 mice) or FSP1cre; Ddr2fl/fl; MMTV-PyMT (Ddr2-/- FSP1cre) (n = 10 mice) as represented by time in weeks to end stage (single tumor 2 cm in largest dimension). (E) Total primary tumor burden in WT; MMTV-PyMT (WT) (n = 18 mice) or FSP1cre; Ddr2fl/fl; MMTV-PyMT (Ddr2-/- FSP1cre) (n = 10 mice). Represented as the total volume of all primary tumors per mouse. (F) FACS quantification of percent PDGFRα positive cells (i.e., CAFs) per total primary tumor in size- and age-matched MMTV-PyMT (WT) or FSP1cre; Ddr2fl/fl; MMTV-PyMT (Ddr2-/- FSP1cre) tumors. Four tumors each from four different mice were analyzed (total of 16 tumors). (G) Representative second harmonic images (SHG) of 10–12 week MMTV-PyMT (WT) or FSP1cre; Ddr2fl/fl; MMTV-PyMT (Ddr2-/- FSP1cre) tumors. Scale bars = 100 um. (H) Quantification of TACS1 and TACS2/3 phenotype in tumor analyzed in (H). Six tumors from three different mice per genotype were analyzed (total of 18 tumors). *p<0.05. (I) 2D en face rendering of 3D reconstructed FIB-SEM images of tumor-stromal boundary (2–5 μM) from 12 week old MMTV-PyMT (WT), ubiquitous Ddr2-/- null; MMTV-PyMT, or Ddr2-/-; FSP1cre; MMTV-PyMT tumors. Collagen fibers are green. Three tumors of each genotype were analyzed (n = 3 for each). See also Videos 1, 2 and 3. (J) Quantification of fiber width in pixels relative to WT from FIB-SEM images in (I) for indicated tumors (n = 3 for each genotype). Fibers were quantified with CT-FIRE software (LOCI, Madison, WI). ****p<0.0001, **p=0.0041. In all panels, statistics were one-way ANOVA with Tukey’s post hoc test. Unless otherwise noted, *p<0.05, **p<0.01, ***p<0.001, ns no significant difference.
Figure 5—figure supplement 1

Deletion of Ddr2 in breast tumor CAFs results in altered collagen fiber organization and decreased lung metastases supplement 1.
(A) Representative immunofluorescence images of cell lineage marker (green), as indicated, of FSP1cre; ROSA-LSL-TdTomato (red) PyMT breast tumors. Pie graphs indicate percentage of each cell type which express FSP1cre (TdT+). For quantification, n = at least five images per group. Scale bar = 5 μm. (B) Representative images of picosirius red (top) and trichrome staining (bottom) in 10 to 12 week WT; MMTVPyMT, FSP1cre; Ddr2fl/fl; MMTV-PyMT, or Ddr2-/-; MMTV-PyMT tumors. Quantification of picosirius red staining per area of tumor (right). n = 8 per group. (C) Representative fluorescence images of total pMLC staining in Ddr2fl/fl; PyMT (WT) or Ddr2-/-; FSP1cre); PyMT breast tumors. Quantification of pMLC staining (right). n = 10 and 7, respectively. Images were gated to equal intensity in ImageJ and quantified by pMLC positive pixels/DAPI staining positive pixels. **p=0.0037, ns = no significant difference.
Figure 6
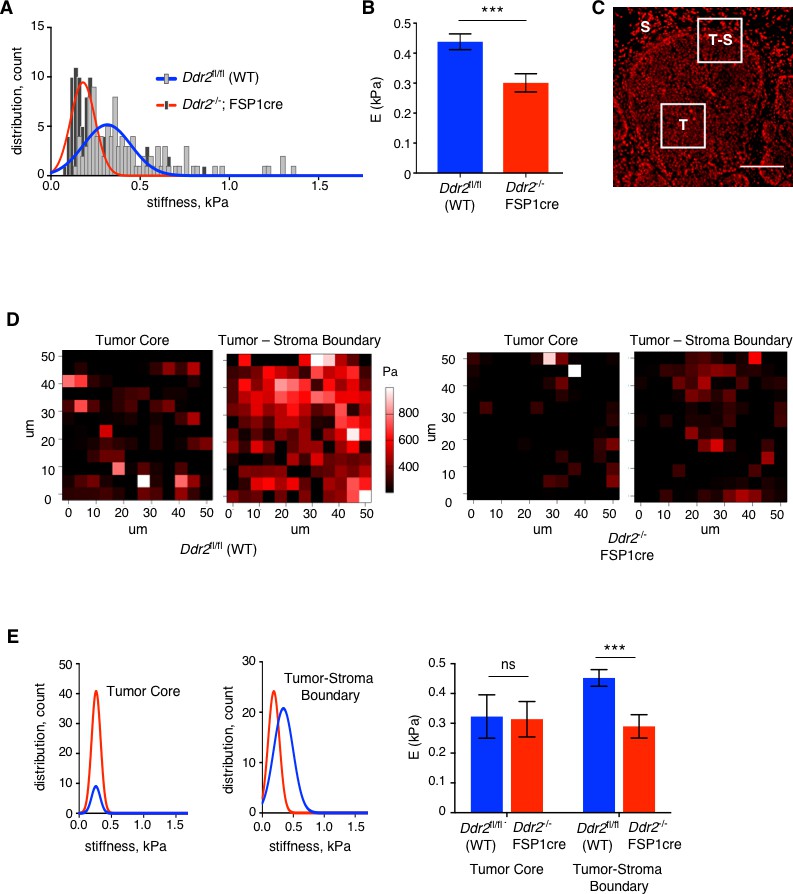
Deletion of Ddr2 in breast tumor CAFs results in decreased tumor stiffness.
(A) Compiled total tumor stiffness measurements represented as a histogram fit with a Gaussian curve (kPA, Young’s elastic modulus) for WT PyMT (blue line) and Ddr2-/- FSP1cre (red line) tumors. Six (6) breast tumors from six different mice were analyzed for each genotype. (B) Bar graph quantifying average of tumor stiffness (elastic modulus) for WT PyMT primary breast tumors and Ddr2-/- FSP1cre primary breast tumors. Six (6) breast tumors from six different mice were analyzed as in (A) to generate the averages. ***p=0.0008. (C) Image of Propidium Iodine staining of a tumor slice that was used to identify tumor core (T), tumor-stromal boundary (T–S), and stromal compartments (S) regions used for measurements of stiffness. (D) Representative AFM stiffness heat map from MMTV-PyMT (WT) (left two panels) or FSP1cre; Ddr2fl/fl; MMTV-PyMT (Ddr2-/- FSP1cre) (right two panels) breast tumors. In each set of panels, tumor core (left) and tumor-stromal boundary (right) measurements are shown. (E) Compiled stiffness data of tumor core (left) or tumor-stroma boundary (middle) for MMTV-PyMT (WT – blue lines and blue columns) or FSP1cre; Ddr2fl/fl; MMTV-PyMT (Ddr2-/- FSP1cre - red lines and red columns) tumors. Data are represented as the Gaussian curve which was fitted to a histogram. Right is a bar graph showing averages of data for both tumor nodules and tumor-stromal boundary. ***p=0.0003. E = Young’s elastic modulus. Six (6) tumors from six different mice per genotype were analyzed and data plotted are the top 100 best fitting curves per group. The Hertz method was used to calculate elasticity and Poisson’s ratio of 0.5 was used to calculate Young’s elastic modulus. In all panels, statistics were one-way ANOVA with Tukey’s post hoc test. Unless otherwise noted, *p<0.05, **p<0.01, ***p<0.001, ns no significant difference.
Figure 7
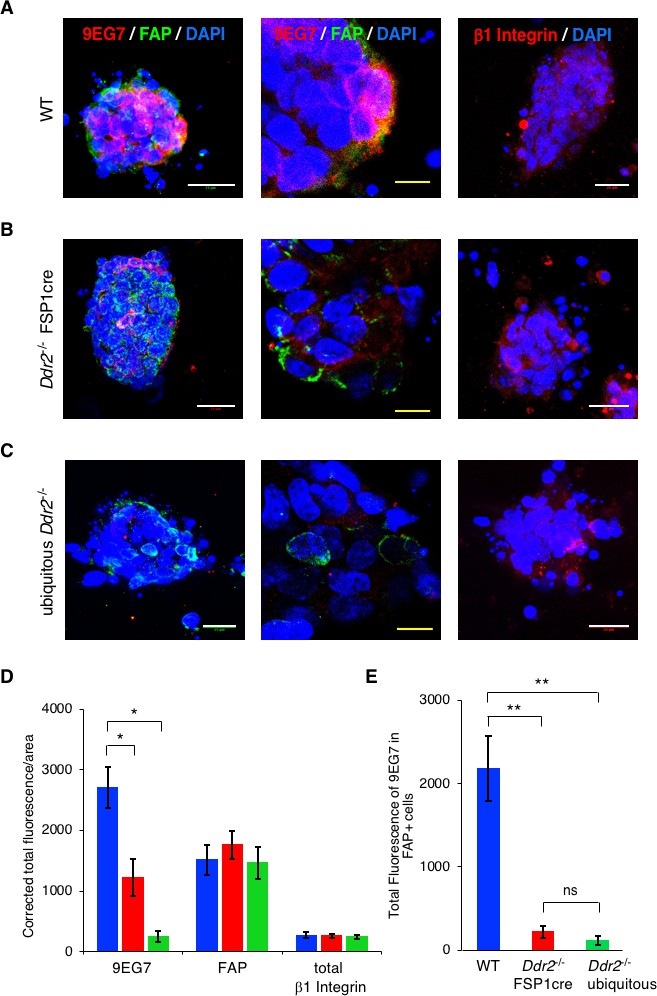
In vivo, the presence of DDR2 in primary breast tumor CAFs controls full β1 Integrin activation.
WT (A), Ddr2-/- FSP1cre (B), and ubiquitous Ddr2-/-(C) breast tumor organoids were isolated from 12 week primary tumors and immediately placed in a 3D collagen I microfluidic device under hypoxic conditions. After 48 hr immunofluorescence staining for active β1Integrin (red) and FAP (CAFs -green) (left and middle panels) or total β1Integrin (red) (right panel) were performed on organoids in the device. Organoids were also stained with DAPI to identify nuclei. The middle panels are higher resolution images of parts of the left panels. (D) Quantification of total fluorescence per tumor organoid for indicated antibodies in each set. Blue columns – WT tumor organoids; red columns - Ddr2-/- FSP1cre tumor organoids, green columns - ubiquitous Ddr2-/- tumor organoids. (E) Quantification of total fluorescence of active β1 integrin (9EG7) in only FAP+ cells (i.e., CAFs) in WT (blue), Ddr2-/- FSP1cre (red), and Ubiquitous Ddr2-/- tumor organoids. From 2 different mice 10–20 tumor organoids per genotype were analyzed. In all panels, statistics were one-way ANOVA with Tukey’s post hoc test. Unless otherwise noted, *p<0.05, **p<0.01, ***p<0.001, ns - no significant difference.
Videos
Video 1
FIB-SEM of WT PyMT tumor breast tumor cell-stromal boundary.
This is a 360° depiction of a Focused Ion Beam Scanning Electron Micrograph (FIB-SEM) of the tumor-stromal boundary of a WT PyMT breast tumor. Collagen fibers are in green. Views are within 2 μm from the tumor cell surface.
Video 2
FIB-SEM of ubiquitous Ddr2-/- PyMT breast tumor cell-stromal boundary.
This is a 360° depiction of a Focused Ion Beam Scanning Electron Micrograph (FIB-SEM) of the tumor-stromal boundary of a ubiquitous Ddr2-/- PyMT breast tumor. Both tumor cells and stromal cells are deleted of Ddr2. Collagen fibers are in green. Views are within 2 μm from the tumor cell surface.
Video 3
FIB-SEM of WT PyMT tumor.
This is a 360° depiction of a Focused Ion Beam Scanning Electron Micrograph (FIB-SEM) of the tumor-stromal boundary of a Ddr2fl/fl; FSP1cre; PyMT breast tumor. Tumor stromal CAFs are deleted of Ddr2. Tumor cells are Ddr2+/+. Collagen fibers are in green. Views are within 2 μm from the tumor cell surface.
Tables
Table 1
Antibodies used for Western blot, IF, and IP.
https://doi.org/10.7554/eLife.45508.019| Antibody | Source | Application | Concentration |
|---|---|---|---|
| Α-SMA (1A4) | Sigma A2547 | WB | 1:10,000 |
| β-actin | Sigma A5441 | WB | 1:10,000 |
| β-tubulin | Sigma T4026 | WB | 1:2000 |
| CD31 | Abcam ab28364 | IF | 1:100 |
| CD45 | BD Biosciences 550539 | IF | 1:100 |
| Collagen 1a1 | EMD Millipore AB765P | IF | 1:200 |
| DDR2 | CST 12133 | WB | 1:1000 |
| FAP | EMD Millipore ABT11 | IF | 1:100 |
| Integrin β1 | BD Biosciences 552828 | IF | 1:50 |
| Integrin β1 | CST 4706 | WB | 1:500 |
| Integrin β1 (9EG7) | BD Biosciences 553715 | IF | 1:50 |
| K14 | Covance PRB-155P | IF | 1:100 |
| K8 | DSHB TROMA-1 | IF | 1:100 |
| p-MLC (Ser19) | CST 3671 | IF | 1:50 |
| PDGFRα-FITC | eBioscience 11-1401-80 | FACS | 1:50 |
| Rap1 | EMD Millipore 07–916 | WB | 1:500 |
| Talin1 (8D4) | Sigma T3287 | IF, WB | 1:250, 1:2000 |
| Vinculin | Sigma V9131 | IF | 1:250 |
Table 2
Primer sequences for DDR2 mouse genotyping.
https://doi.org/10.7554/eLife.45508.018| Name | Sequence (5’ – 3’) |
|---|---|
| FRT 5’ Fwd | CTGTGTCTCTGGCTCAAAGTGTC |
| Targeted exon Rv | CCTTCCCAAGGCAGACCATTC |
| PyMT Fwd | GGAAGCAAGTACTTCACAAGGG |
| PyMT Rv | GGAAAGTCACTAGGAGCAGGG |
| Cre Fwd | GCATTACCGGTCGATGCAACGAGTGATGAG |
| Cre Rv | GAGTGAACGAACCTGGTCGAAATCAGTGCG |
| ROSA-LSL-TdTomato Fwd | GAGGGCCGCCACCACCTGTTCCTGTACGG |
| ROSA-LSL-TdTomato Rv | ATGATACAAAGGCATTAAAGCAGCGTATCC |
| ROSA-WT Fwd | GGGGAGTGTTGCAATACCTTTCTGGGAGTTC |
| ROSA-WT Rv | AAAACCGAAAATCTGTGGGAAGTCTTGTC |
Additional files
-
Transparent reporting form
- https://doi.org/10.7554/eLife.45508.020
Download links
A two-part list of links to download the article, or parts of the article, in various formats.
Downloads (link to download the article as PDF)
Open citations (links to open the citations from this article in various online reference manager services)
Cite this article (links to download the citations from this article in formats compatible with various reference manager tools)
DDR2 controls breast tumor stiffness and metastasis by regulating integrin mediated mechanotransduction in CAFs
eLife 8:e45508.
https://doi.org/10.7554/eLife.45508


