Cysteine dioxygenase 1 is a metabolic liability for non-small cell lung cancer
- H Lee Moffitt Cancer Center and Research Institute, United States
- Beth Israel Deaconess Medical Center, United States
- Harvard Medical School, United States
Figures
Figure 1 with 1 supplement
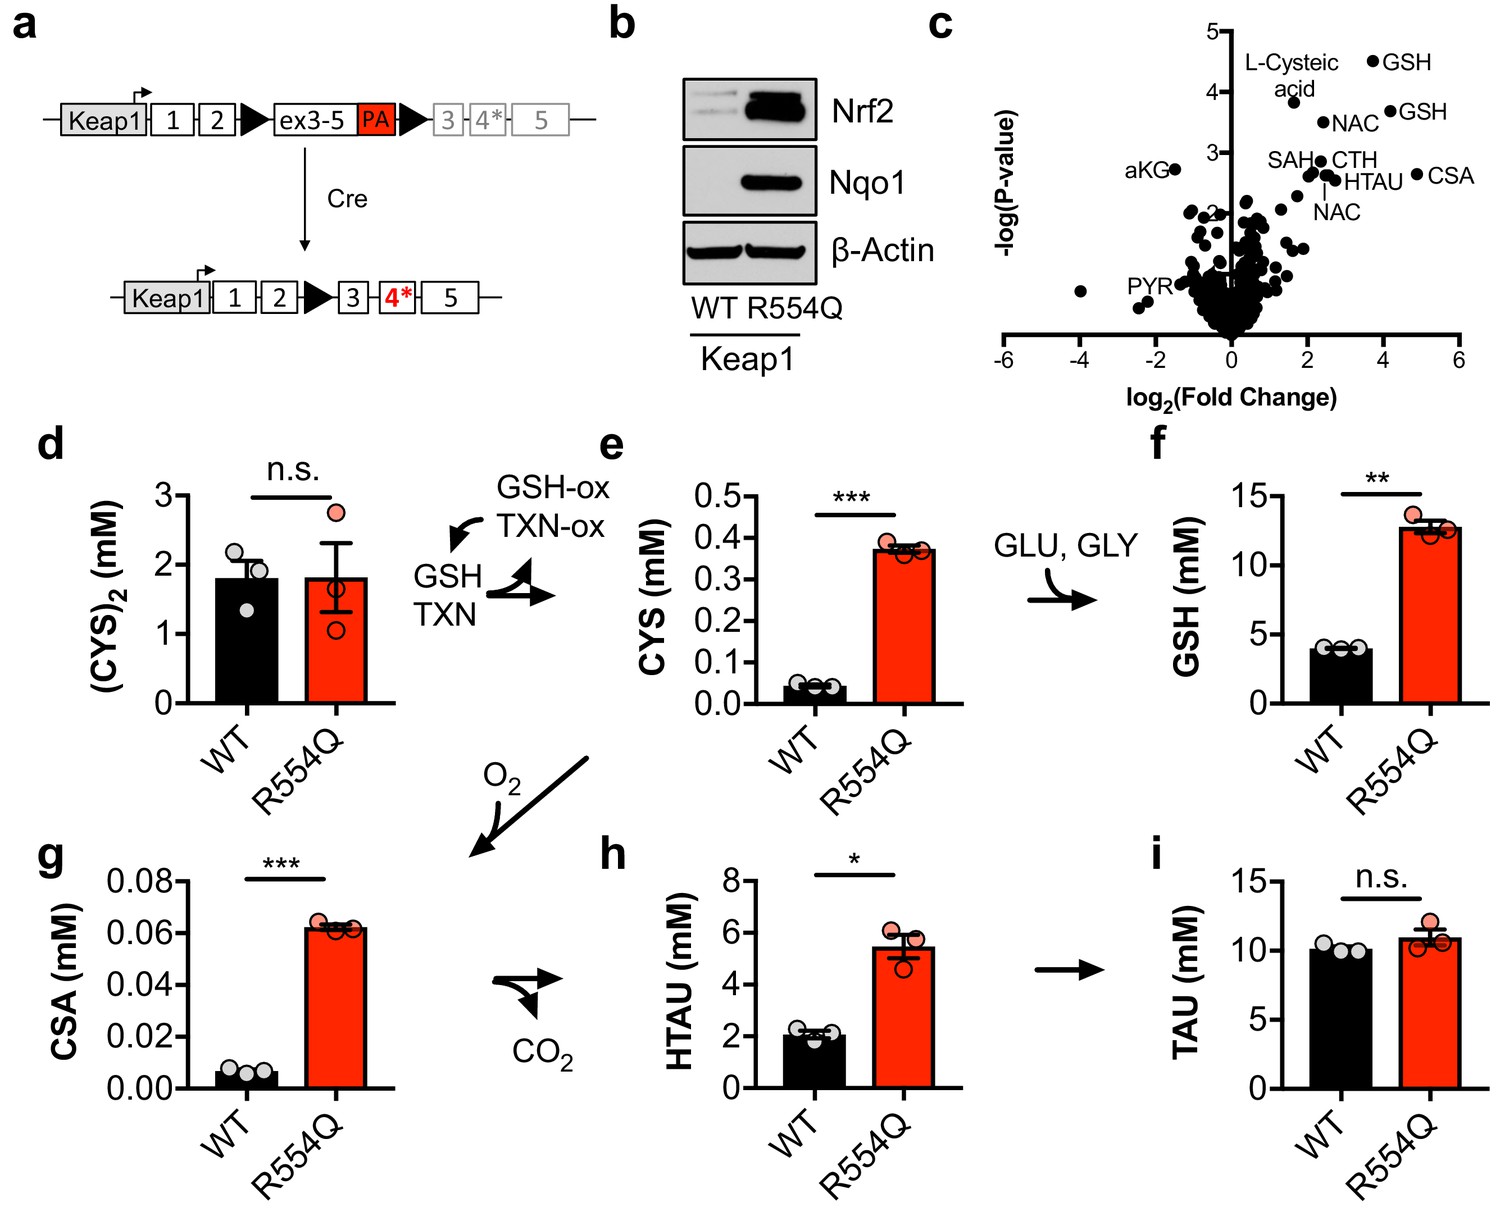
Nrf2 promotes the accumulation of intracellular cysteine and sulfur-containing metabolites.
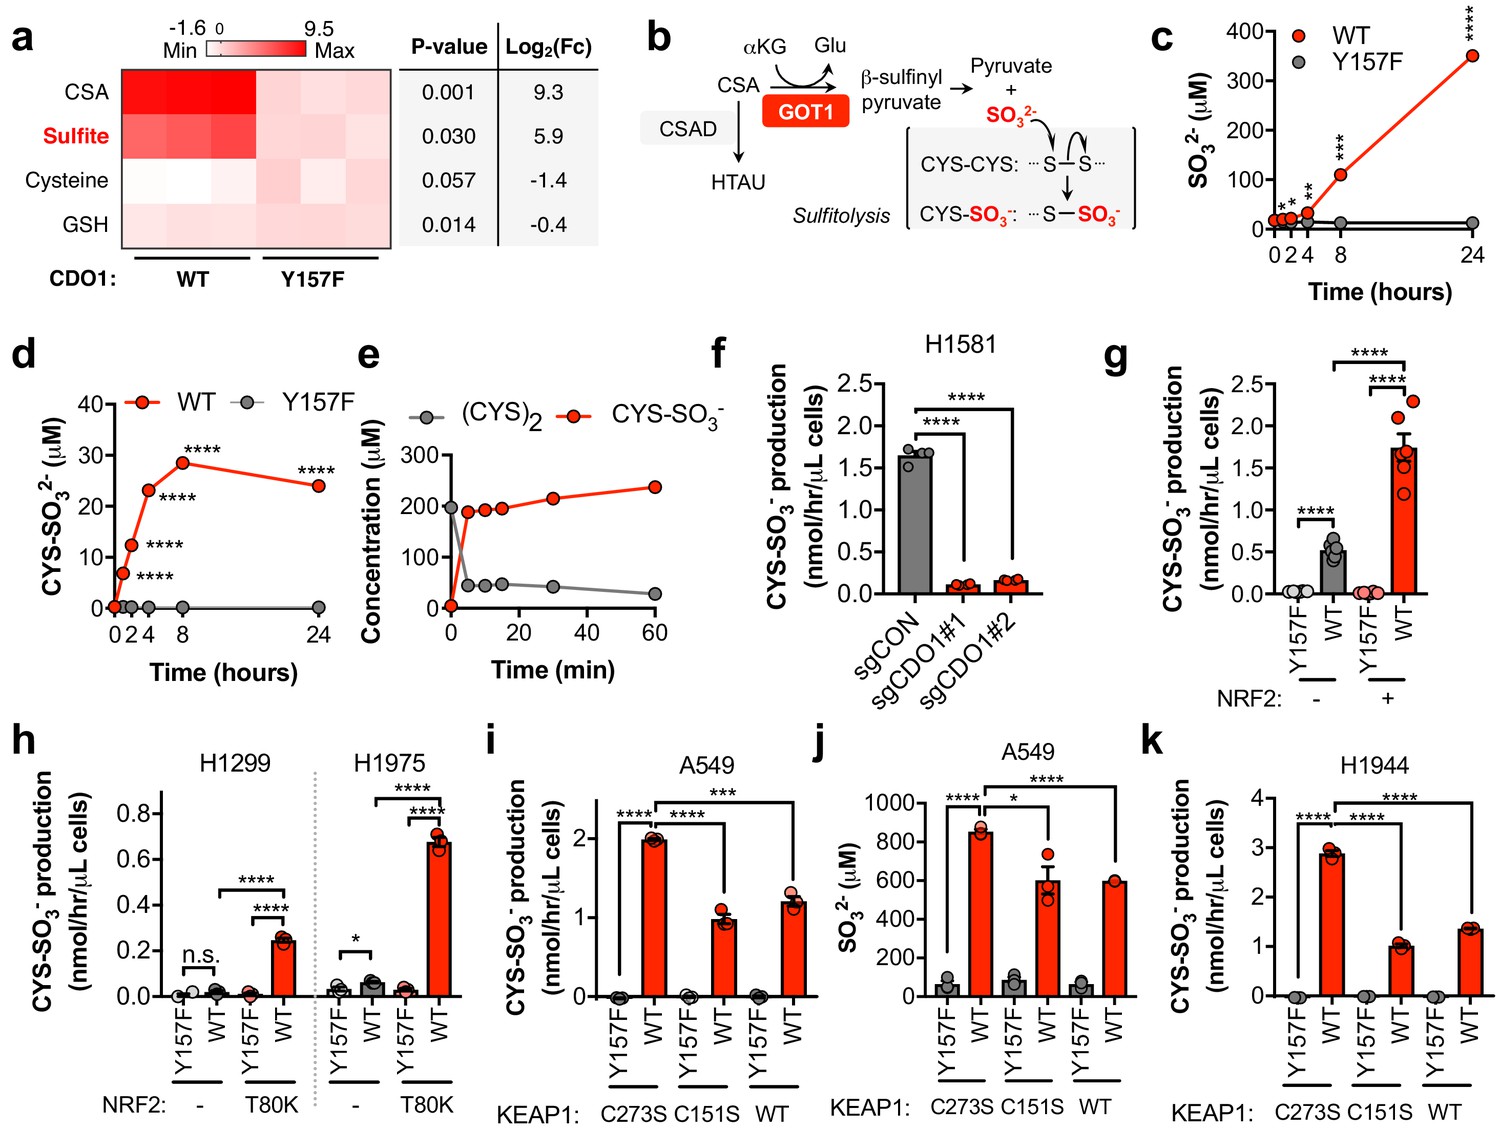
(a) Schematic of the murine Keap1R554Q allele. The Keap1R554Q allele was created by inserting a loxP-flanked wild-type Keap1 cDNA containing exons 3–5 upstream of a R554Q mutation in the endogenous exon 4 of the Keap1 gene. Prior to recombination, wild-type Keap1 protein is expressed due to splicing into the cDNA containing exons 3–5, and is referred to as Keap1WT. Following Cre-mediated excision of the loxP-flanked cargo, Keap1R554Q is expressed at physiological levels and is referred to as Keap1 R554Q. PA, poly A signal. (b) Western blot analysis of Nrf2, Nqo1, and β-Actin levels following Nrf2 stabilization in wild-type (WT) vs. homozygous Keap1R554Q/R554Q (R554Q) MEFs. (c) LC-HRMS metabolomics profiling of Keap1R554Q/R554Q MEFs compared to Keap1WT/WT MEFs. GSH, glutathione. CSA, cysteine sulfinic acid. HTAU, hypotaurine. CTH, cystathionine. NAC, N-acetyl cysteine. SAH, S-adenosyl homocysteine. aKG, α-ketoglutarate. PYR, pyruvate. N = 3, representative of 2 individual MEF lines. (d–i) Quantitation of cystine ([CYS]2, d), cysteine (CYS, e), glutathione (GSH, f), cysteine sulfinic acid (CSA, g), hypotaurine (HTAU, h) and taurine (TAU, i) levels in Keap1R554Q/R554Q MEFs compared to Keap1WT/WT MEFs. Cysteine and glutathione were derivatized with N-ethylmaleamide (NEM) to prevent oxidation during extraction here and for all quantification experiments. TXN, thioredoxin. TXN-ox, oxidized thioredoxin. GSH-ox, oxidized glutathione. GLU, glutamate. GLY, glycine. N = 3.
-
Figure 1—source data 1
Nrf2 promotes the accumulation of intracellular cysteine and sulfur-containing metabolites.
- https://doi.org/10.7554/eLife.45572.005
Figure 1—figure supplement 1
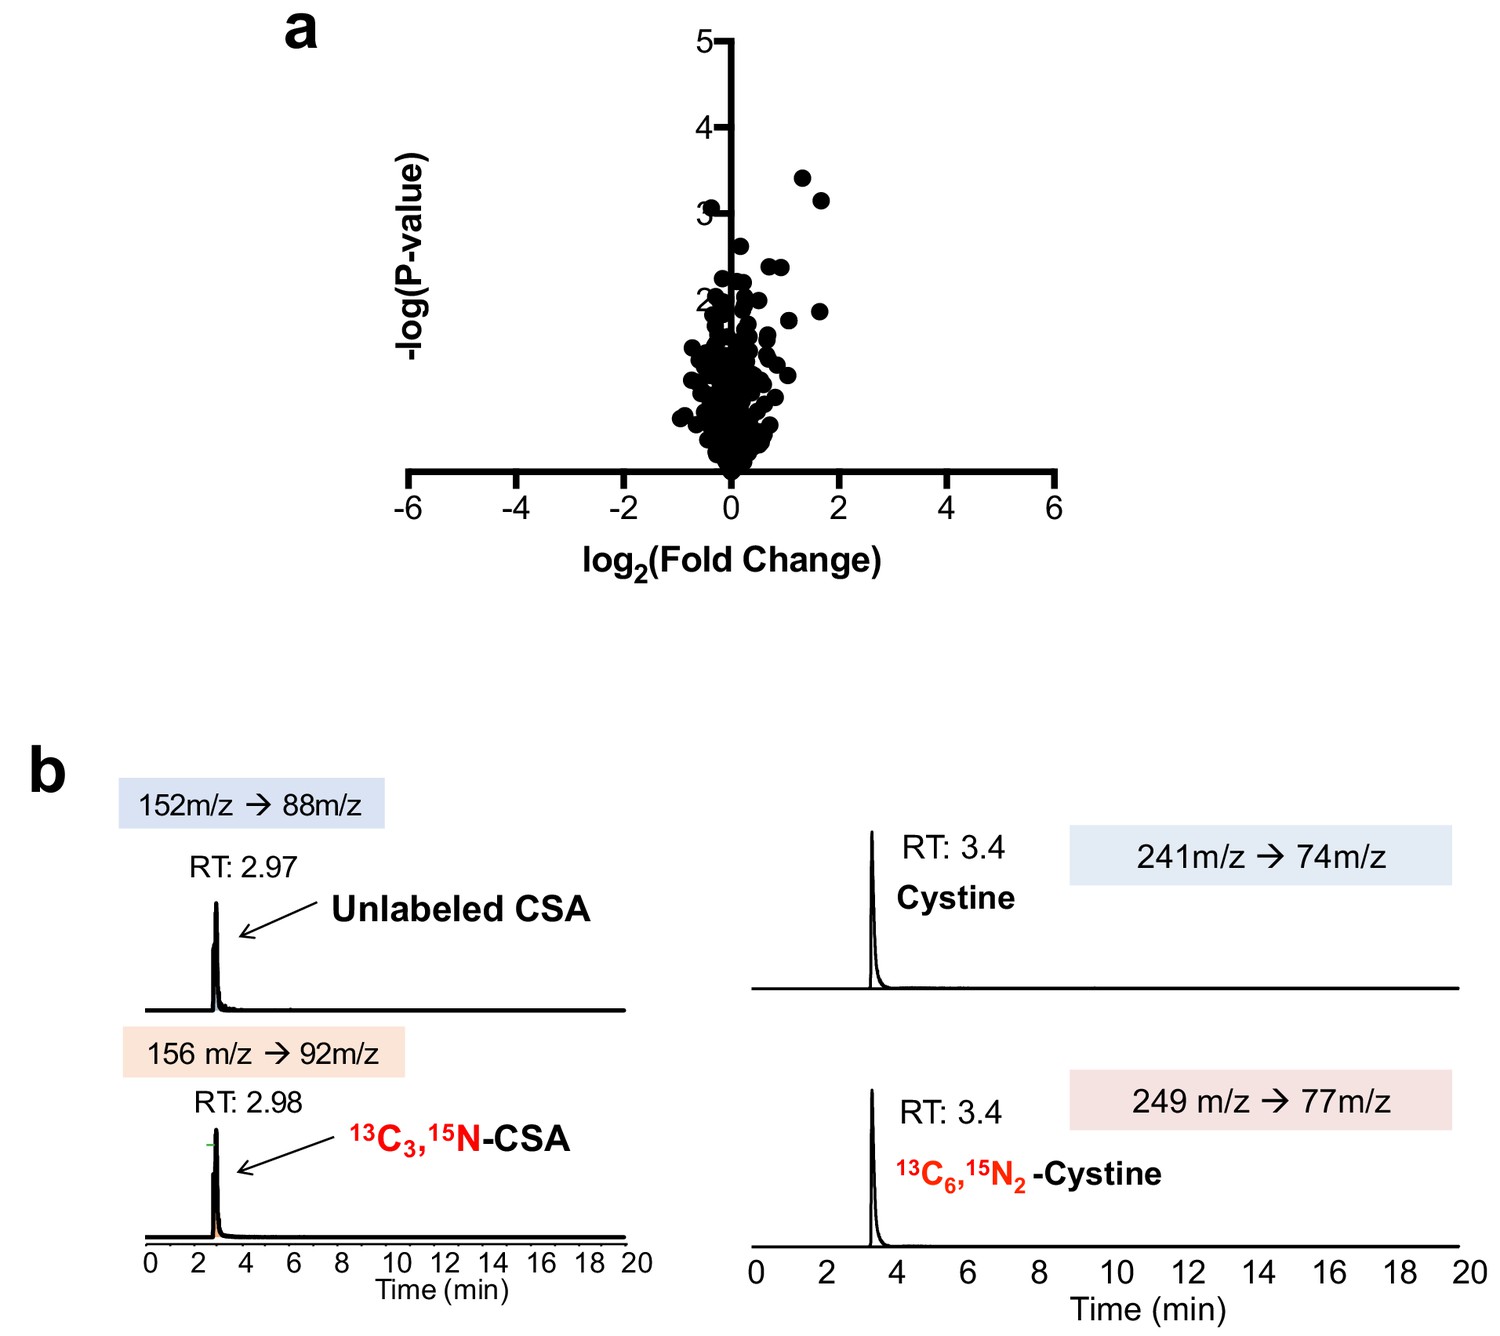
Cre infection does not induce taurine pathway activity in MEFs.
(a) LC-HRMS metabolomics profiling of wild-type MEFs infected with adenoviral-cre compared to MEFs infected with empty adenovirus. N = 3 replicates/group. (b) Verification of stable-isotope labeled CSA and cystine internal standards for absolute quantification. Stable isotope labeled CSA and cystine standards were synthesized from [13C3, 15N]-cysteine and analyzed by LC-MS/MS based MRM against authentic standards. RT, retention time.
-
Figure 1—figure supplement 1—source data 1
Cre infection does not induce taurine pathway activity in MEFs.
- https://doi.org/10.7554/eLife.45572.006
Figure 2
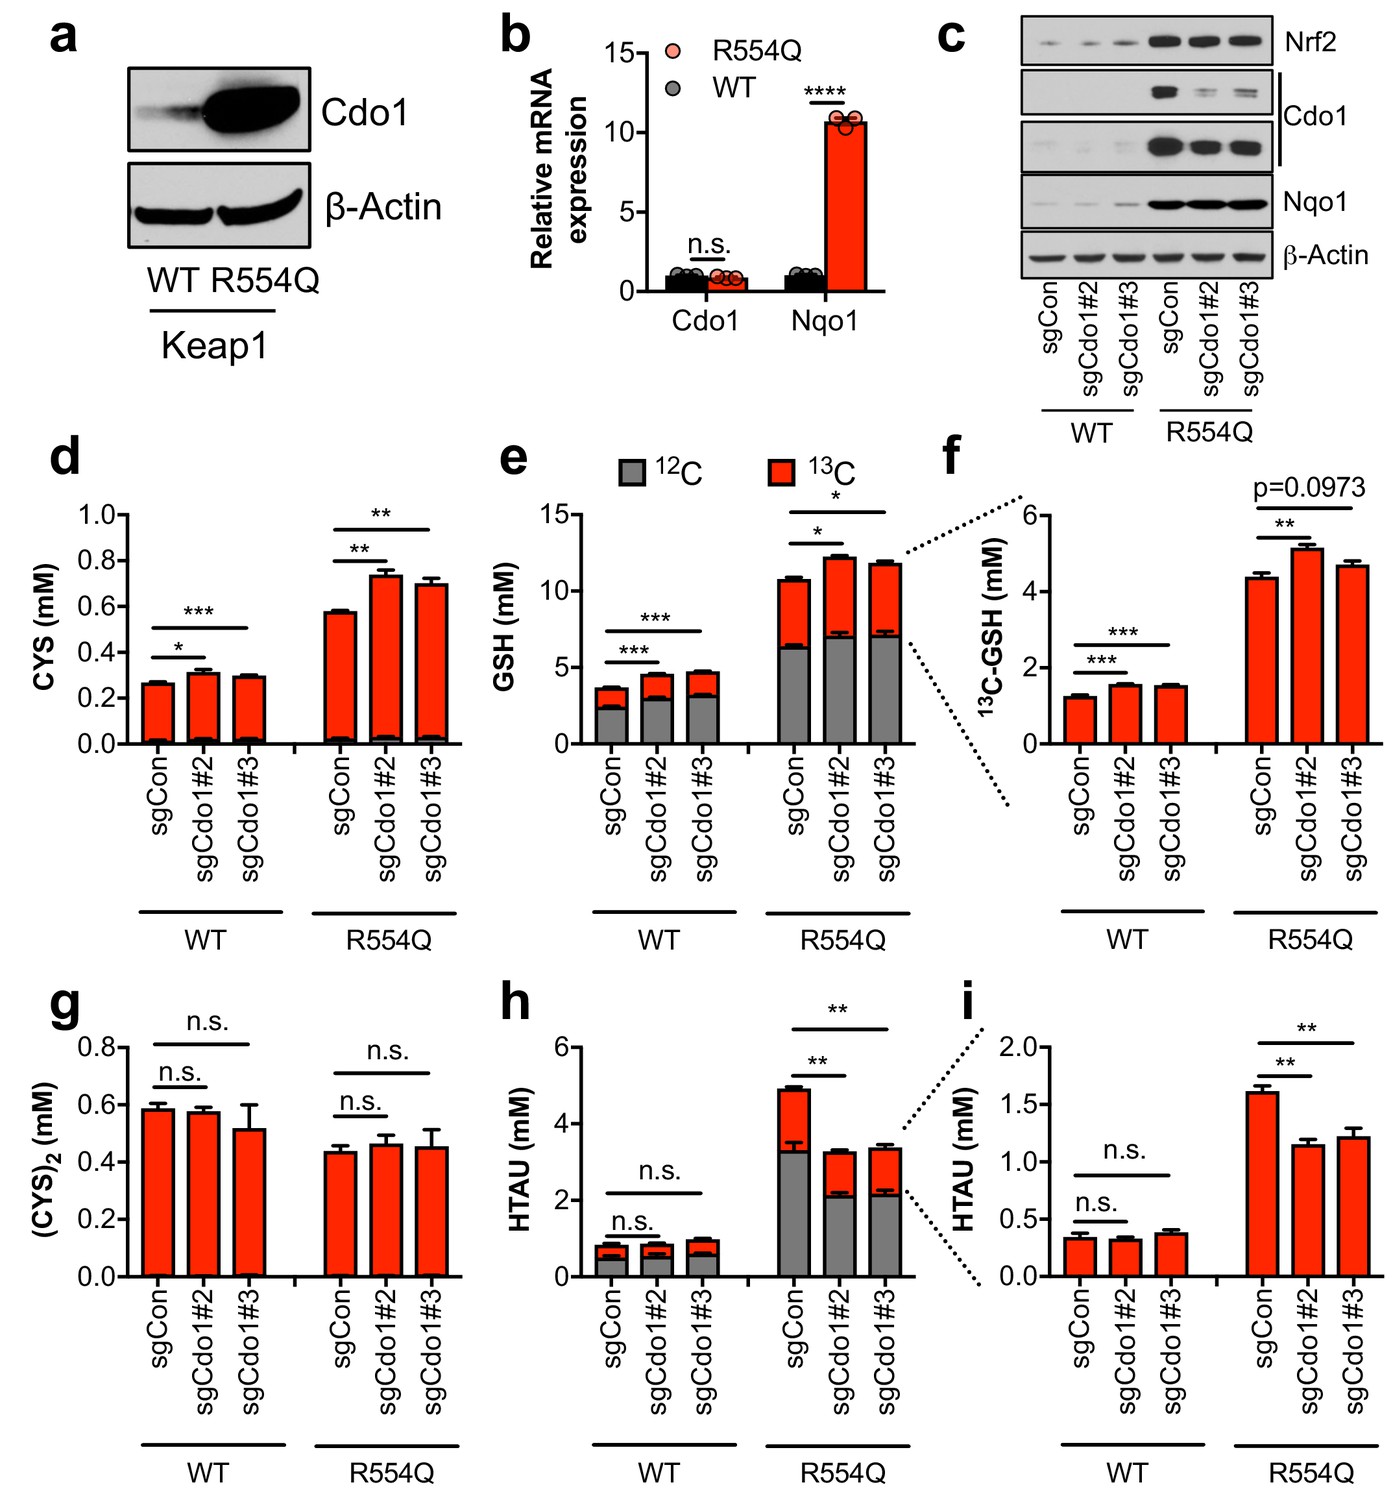
Nrf2 promotes the accumulation of cysteine dioxygenase (Cdo1) to promote entry of cysteine into the taurine synthesis pathway.
(a) Western blot analysis of Cdo1 and β-Actin levels following Nrf2 stabilization in wild-type (WT) vs. homozygous Keap1R554Q/R554Q (R554Q) MEFs. (b) Real-time PCR analysis of Cdo1 and Nqo1 mRNA levels following Nrf2 stabilization in wild-type (WT) vs. homozygous Keap1R554Q/R554Q (R554Q) MEFs. mRNA expression was normalized to β-Actin expression, followed by normalization to WT. N = 3. (c) Western blot analysis of Nrf2, Cdo1, Nqo1 and β-Actin levels following expression of sgControl (sgCON) or Cdo1 deletion (sgCdo1 #2 and #3) with CRISPR/Cas9 in primary wild-type (WT) and homozygous Keap1R554Q/R554Q (R554Q) MEFs. (d–i) Quantitation of cysteine (CYS, (d), glutathione (GSH, (e,f), cystine ([CYS]2,(g), and hypotaurine (HTAU, (h,i) total levels and 13C-labeling from 13C-cystine in cells from (c). 13C-label is shown in red, while 12C-label is gray. Cells were labeled for 4 hr. N = 3.
-
Figure 2—source data 1
Nrf2 promotes the accumulation of cysteine dioxygenase (Cdo1) to promote entry of cysteine into the taurine synthesis pathway.
- https://doi.org/10.7554/eLife.45572.008
Figure 3 with 3 supplements
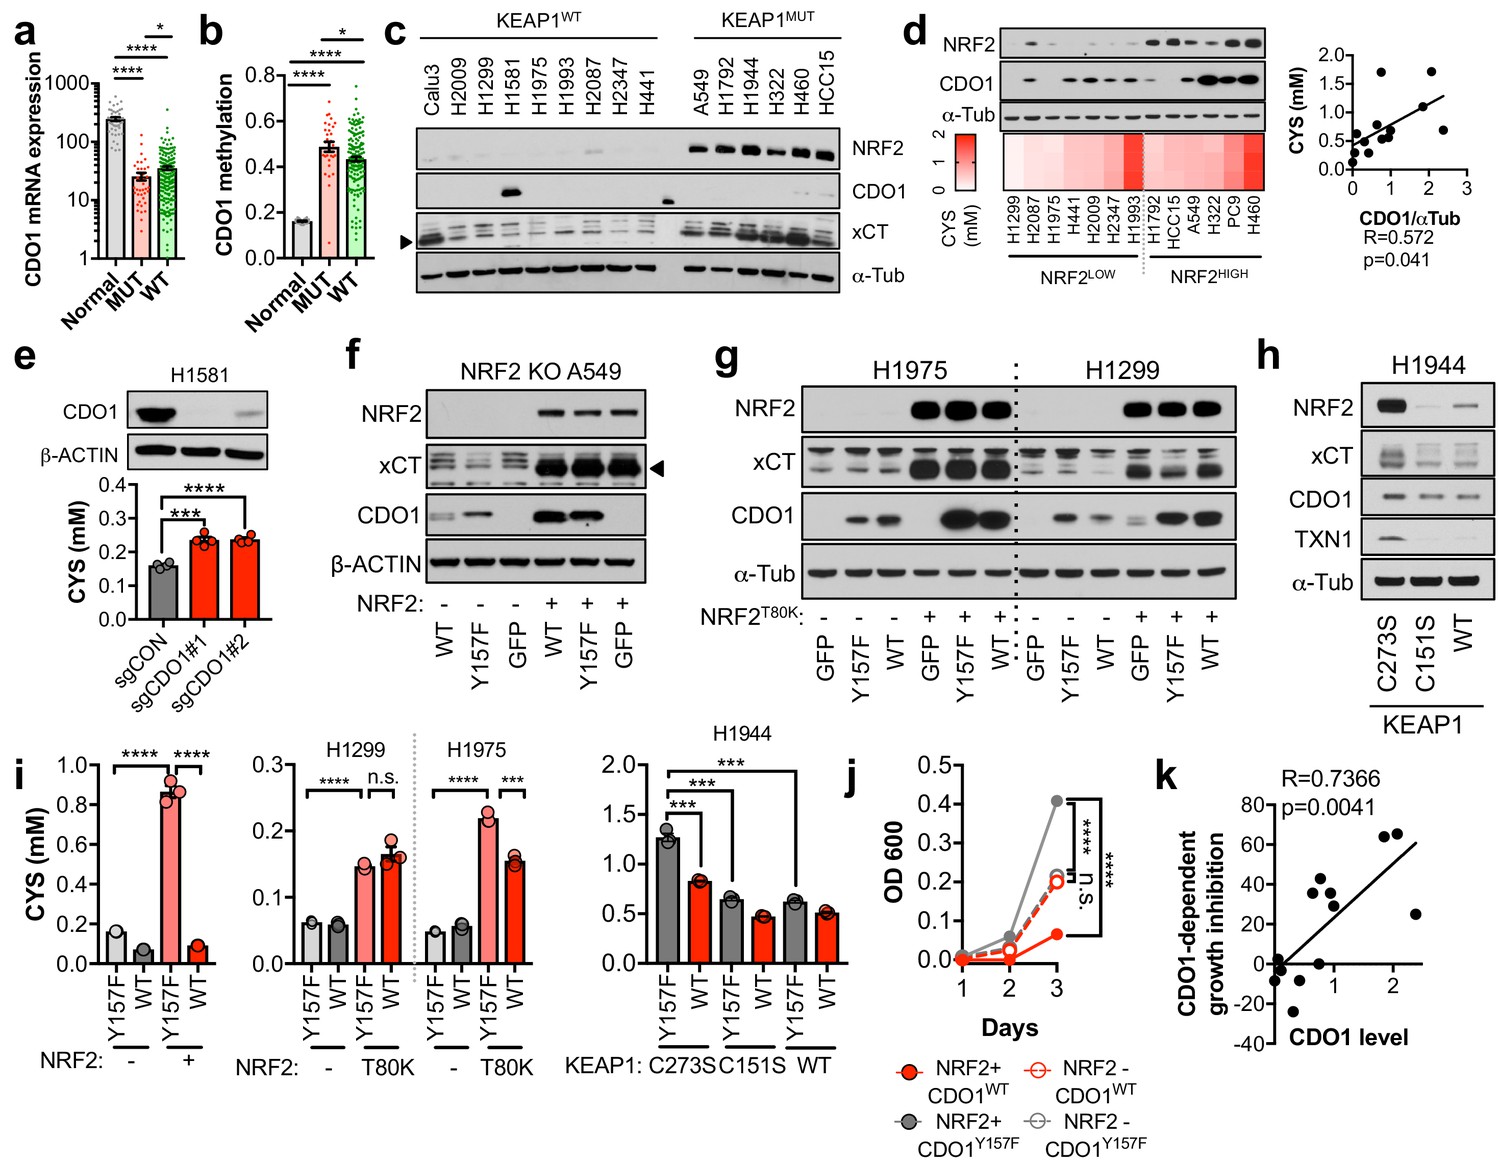
CDO1 is preferentially silenced in KEAP1 mutant NSCLC and antagonizes proliferation.
(a) CDO1 mRNA expression of normal lung (Normal) or or KEAP1 wild-type (WT) and mutant (MUT) lung adenocarcinoma patient tumor samples. Normal, N = 45. MUT, N = 39, WT, N = 189. (b) Methylation of the CDO1 promoter in samples from normal lung (Normal) or KEAP1 wild-type (WT) and mutant (MUT) lung adenocarcinoma patient tumor samples. Normal, N = 28. MUT, N = 29, WT, N = 154. (c) Western blot analysis of NRF2, CDO1, xCT and α-Tubulin levels in KEAP1 wild-type and KEAP1 mutant NSCLC cell lines. Arrowhead denotes specific band. (d) (Top) Western blot analysis of NRF2, CDO1 and α-Tubulin expression in NRF2LOW and NRF2HIGH (KEAP1 mutant: H1792, HCC15, A549, H322, and H460) NSCLC cell lines expressing CDO1Y157F. (Bottom) Intracellular cysteine concentration of the parental cell lines (minus doxycycline). (Right) Correlation between CDO1 protein levels and intracellular cysteine concentrations. CDO1 protein was normalized to α-Tubulin. N = 13. (e) (Top) Western blot analysis of CDO1 and β-ACTIN expression in H1581 cells following expression of control (sgCON) or CDO1-targeting sgRNAs (sgCDO1 #1 and #2) and Cas9. (Bottom) Intracellular cysteine concentration of the same cells. N = 4 replicates/group. (f–h) Western blot analysis of NRF2, CDO1, xCT, TXN1, α-Tubulin and β-ACTIN levels following re-expression of CDO1WT (WT), CDO1Y157F (Y157F), or GFP in (f) NRF2 knockout A549 cells reconstituted with either pLX317 empty (-) or pLX317-NRF2 (+), (g) H1975 and H1299 cells expressing either pLX317 empty (-) or pLX317-NRF2T80K (+), or (h) H1944 cells reconstituted with inactive pLenti-KEAP1 (C273S), super repressor KEAP1 (C151S) or wild-type KEAP1 (WT). (i) Analysis of cysteine levels in the cells from (e–g). N = 3 replicates/group. (j) Analysis of the proliferation of cells from (f). Cells were collected on the indicated days, stained with crystal violet and their absorbance at 600 nm determined. N = 3 replicates/group. (k) Analysis of proliferation of NSCLC cells expressing CDO1WT and correlation with CDO1 protein expression. Cells were collected after 3 days, and CDO1 dependent growth inhibition was determined by taking the ratio of CDO1WT / CDO1Y157F cell quantity. For individual lines (N = 13), see Figure 3—figure supplement 3D. For (d-j), cells were treated with 0.25 μg/ml doxycycline for 2 days prior to and during the assay and fresh medium was added 4 hr prior to sample collection.
-
Figure 3—source data 1
CDO1 is preferentially silenced in KEAP1 mutant NSCLC and antagonizes proliferation.
- https://doi.org/10.7554/eLife.45572.016
Figure 3—figure supplement 1
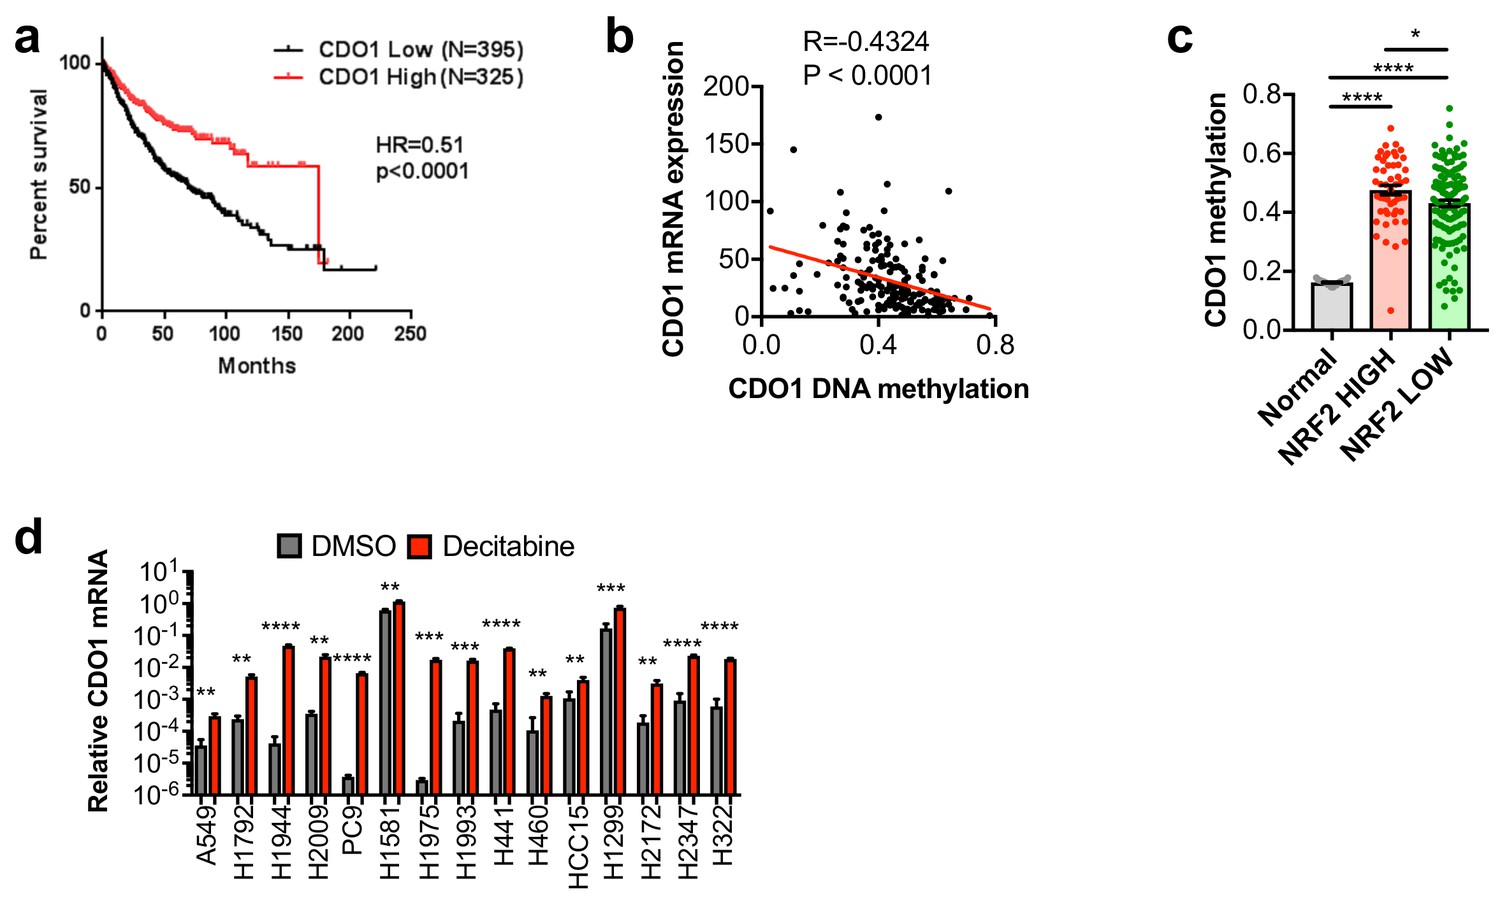
CDO1 is epigenetically silenced in NSCLC.
(a) Association of CDO1 mRNA expression with NSCLC patient outcome. (b) Correlation between CDO1 promoter methylation and mRNA expression in lung adenocarcinoma patient samples from the TCGA. N = 185. (c) Methylation of the CDO1 promoter in samples from normal lung (Normal) or lung adenocarcinoma patient tumor samples based on NRF2 activity. Normal, N = 28. NRF2 high group = KEAP1 mutant patients + KEAP1 wild-type patients with NRF2 activity score >lowest KEAP1 mutant tumor (N = 51). NRF2 low group = KEAP1 wild-type patients with NRF2 activity score <lowest KEAP1 mutant tumor (N = 134). (d) Real-time PCR analysis of CDO1 mRNA expression following 5 uM decitabine treatment for 3 days with daily medium change. CDO1 expression was normalized to β-ACTIN expression, and relative expression compared to H1581 DMSO is shown. H1581 demonstrates high basal expression, in agreement with the western blot from Figure 3C. N = 3 replicates/group. Cells were treated with 0.25 µg/ml doxycycline for 2 days prior to and during the assay and fresh medium was added 4 hr prior to sample collection.
-
Figure 3—figure supplement 1—source data 1
CDO1 is epigenetically silenced in NSCLC.
- https://doi.org/10.7554/eLife.45572.011
Figure 3—figure supplement 2
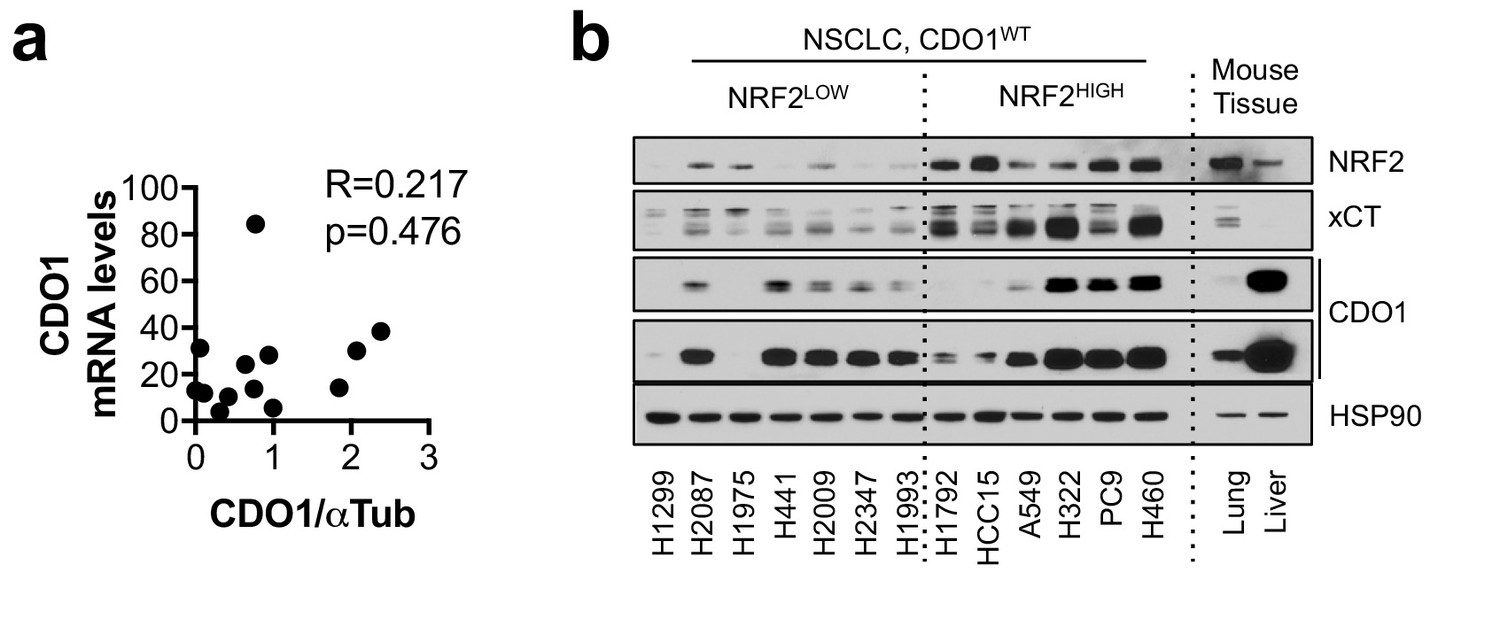
CDO1 protein does not correlate with mRNA expression.
(a) Correlation between CDO1 protein levels (from Figure 3d) and CDO1 mRNA expression in the same cell lines. N = 13. (b) Western blot analysis of NRF2, xCT, CDO1 and HSP90 expression in NSCLC cell lines expressing CDO1WT with mouse liver and lung lysates. Liver expresses high physiological levels of CDO1, while lung expresses low. Cells were treated with 0.25 µg/ml doxycycline for 2 days prior to and during the assay and fresh medium was added 4 hr prior to sample collection.
-
Figure 3—figure supplement 2—source data 1
CDO1 protein does not correlate with mRNA expression.
- https://doi.org/10.7554/eLife.45572.013
Figure 3—figure supplement 3
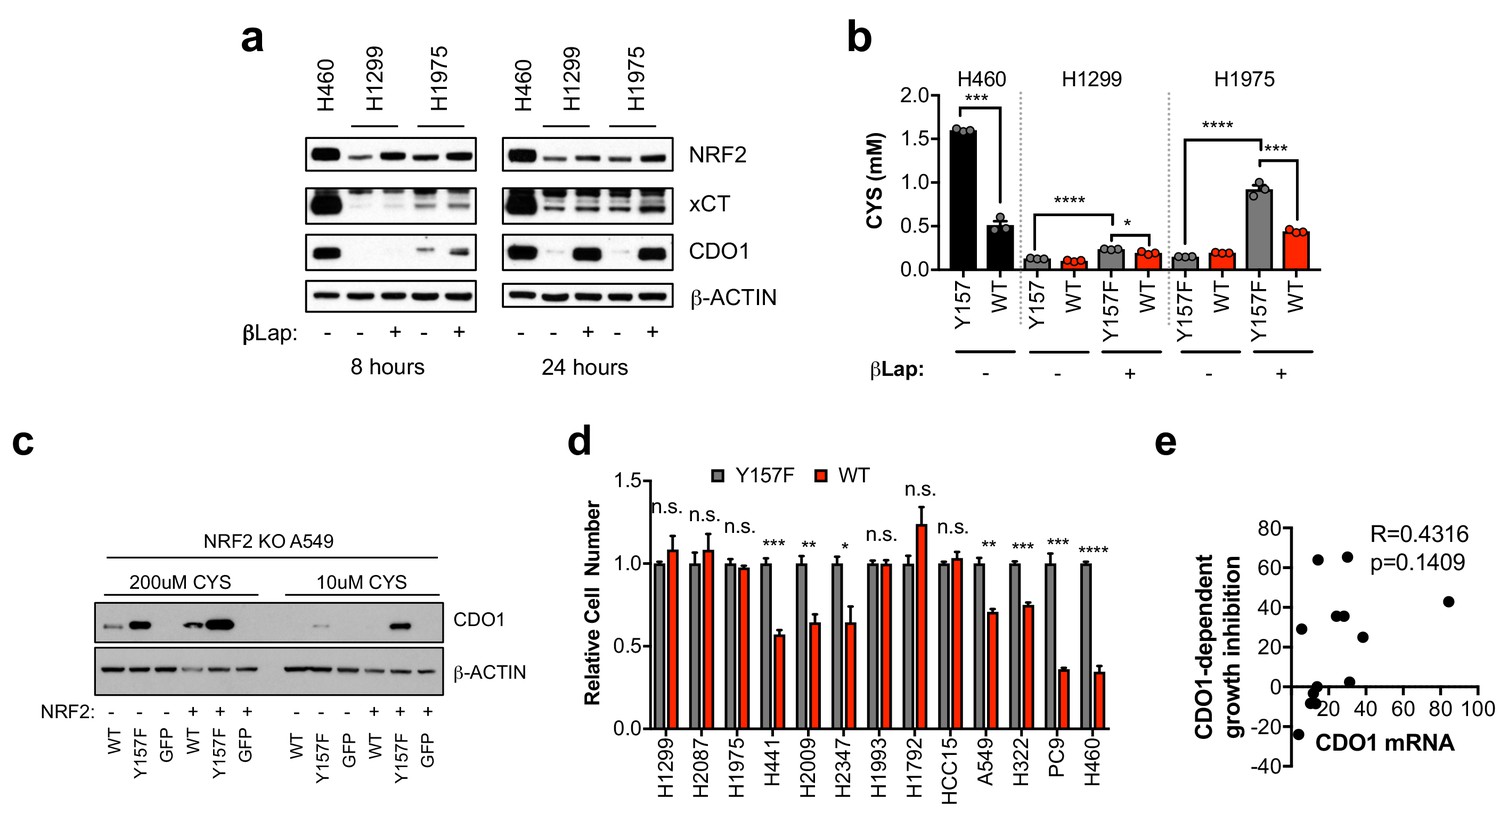
NRF2 promotes CDO1 expression in NSCLC.
(a) Western blot analysis of NRF2, xCT, CDO1 and β-Actin protein expression in H460 control cells, or CDO1WT-expressing H1299 and H1975 cells following treatment with 2 µM β-lapachone (βLap). Cells were treated with βLap for 8 hr (8 hr) or 4 hr followed by a 24 hr recovery period (24 hr). (b) Analysis of intracellular cysteine levels in the 24 hr group from (d). N = 3 replicates/group. (c) Western blot analysis of CDO1 and β-ACTIN levels in NRF2 knockout A549 cells reconstituted with either pLX317 empty (NRF2 -) or pLX317-NRF2 (NRF2 +), followed by re-expression of CDO1WT (WT), CDO1Y157F (Y157F), or GFP. Cells were grown in medium containing 200 μM or 10 μM CYS for 24 hr prior to lysate collection. (d) Individual proliferation data for Figure 3k. Cells were collected on the indicated days, stained with crystal violet and their absorbance at 600 nm determined. Proliferation of each line expressing CDO1WT was normalized to the proliferation of cells expressing CDO1Y157F. N = 3 replicates/group. (e) Correlation of CDO1 mRNA expression with cell growth inhibition (%). N = 13. For (a,b,e), cells were treated with 0.25 µg/ml doxycycline for 2 days prior to and during the assay and fresh medium was added 4 hr prior to sample collection.
-
Figure 3—figure supplement 3—source data 1
NRF2 promotes CDO1 expression in NSCLC.
- https://doi.org/10.7554/eLife.45572.015
Figure 4 with 1 supplement
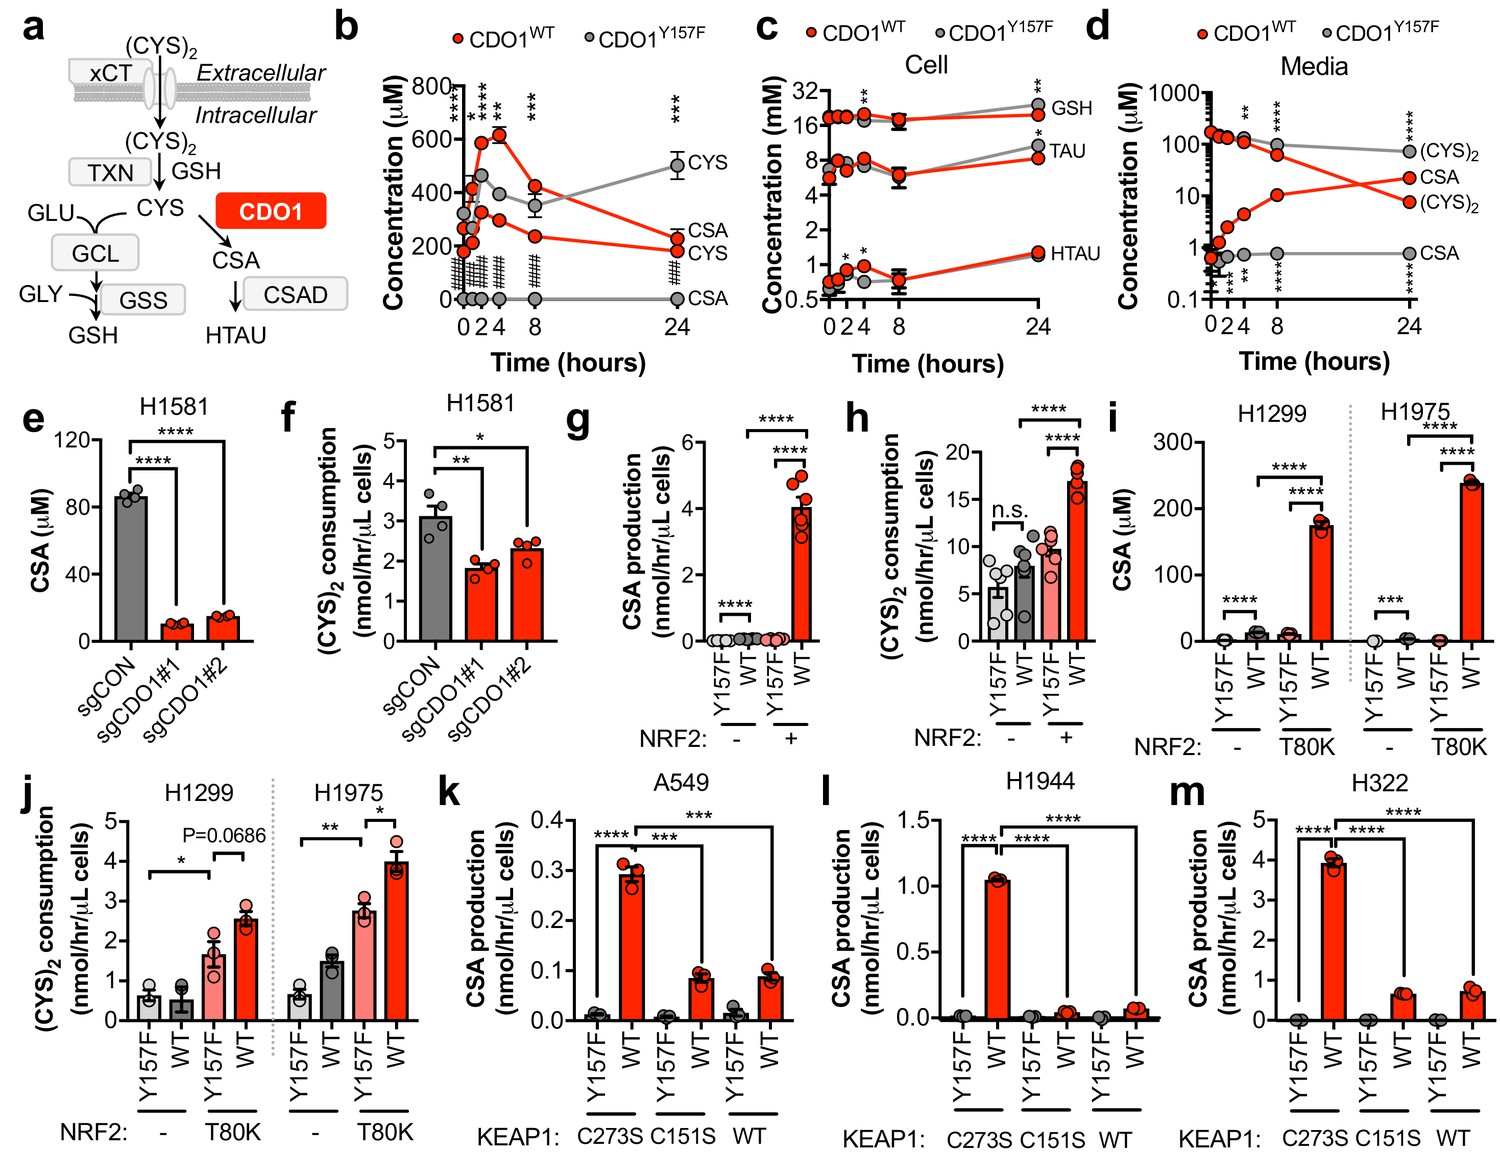
CDO1 depletes cyst(e)ine, leading to its export as CSA.
(a) Schematic depicting intracellular cysteine metabolism. Following uptake of cystine via xCT, it is reduced to cysteine via the cellular antioxidant systems. Cysteine then enters glutathione synthesis mediated by GCL and GSS, or undergoes irreversible metabolism by CDO1 to CSA, and subsequently to HTAU by CSAD. (b) Time-dependent quantification (0, 1, 2, 4, 8, 24 hr) of intracellular cysteine (CYS) and cysteine sulfinic acid (CSA) concentrations following medium replenishment of CDO1WT-expressing (red) and CDO1Y157F-expressing (gray) A549 cells. *= CDO1WT vs. CDO1Y157F CYS, #= CDO1WT vs. CDO1Y157F CSA. N = 3 replicates/group, except 8 hr CYS for which N = 6 replicates/group. (c) Time-dependent quantification of GSH, HTAU, and TAU in the extracts from (b). N = 3 replicates/group. (d) Time-dependent quantification of the levels of (CYS)2 and CSA in the medium from the cells from (b). N = 3 replicates/group. (e) Intracellular CSA concentration of H1581 cells following expression of control (sgCON) or CDO1-targeting sgRNAs (sgCDO1 #1 and #2) and Cas9. N = 4 replicates/group. (f) Quantification of (CYS)2 consumption from the medium of the cells from (e). N = 4 replicates/group. (g) CSA production rate of NRF2 KO A549 cells reconstituted with either pLX317 empty (NRF2 -) or pLX317-NRF2 (NRF2 +), followed by expression of CDO1Y157F (Y157F) or CDO1WT (WT). N = 6 replicates/group. (h) Quantification of (CYS)2 consumption from the medium of the cells from (g). (i) Intracellular CSA concentration in H1975 and H1299 cells expressing either pLX317 empty (-) or pLX317-NRF2T80K (NRF2T80K), followed by expression of CDO1Y157F (Y157F) or CDO1WT (WT). N = 3 replicates/group. (j) Quantification of (CYS)2 consumption from the medium of the cells from (i). (k–m) CSA production rate of A549 (k), H1944 (l) and H322 (m) cells following expression of CDO1Y157F (Y157F) or CDO1WT (WT), and reconstituted with inactive KEAP1 (C273S), super repressor KEAP1 (C151S) or wild-type KEAP1 (WT). N = 3 replicates/group. For (g–m) cells were treated with 0.25 μg/ml doxycycline for 2 days prior to and during the assay and fresh medium was added 4 hr prior to sample collection.
-
Figure 4—source data 1
CDO1 depletes cyst(e)ine, leading to its export as CSA.
- https://doi.org/10.7554/eLife.45572.019
Figure 4—figure supplement 1
CSA only accounts for a fraction of CDO1-dependent (CYS)2 consumption.
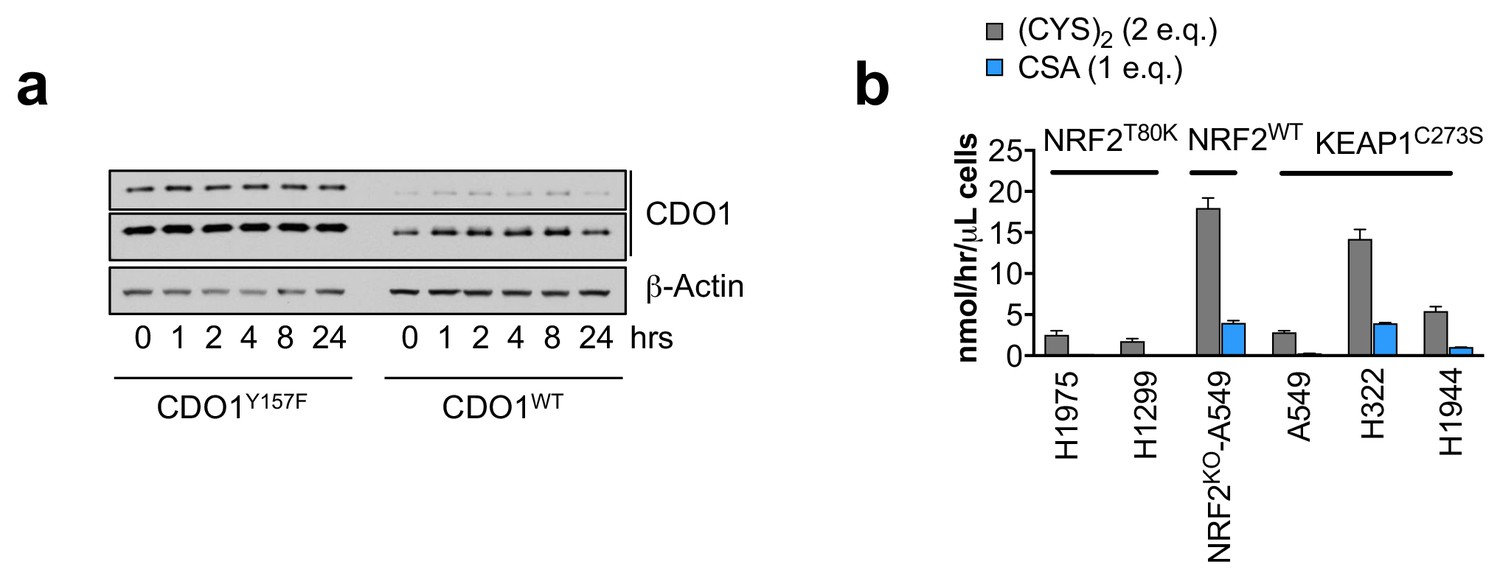
(a) Time-dependent western blot analysis of CDO1 and β-Actin protein expression at 0, 1, 2, 4, 8, or 24 hr following media replenishment of CDO1WT-expressing and CDO1Y157F-expressing A549 cells. (b) Quantification of CDO1-dependent (CYS)2 consumption and CSA production as cysteine molar equivalents. Because (CYS)2 contains 2 molecules of cysteine, it counts as two molar equivalents. CDO1-dependent changes were determined by subtracting the rates of change in CDO1Y157F cells from CDO1WT cells. CSA accounts for 2–25% of CDO1-dependent (CYS)2 consumption. N = 3 replicates/group, except NRF2 KO A549 (N = 6 replicates). Cells were treated with 0.25 µg/ml doxycycline for 2 days prior to and during the assay and fresh medium was added 4 hr prior to sample collection (b) or prior the indicated time points (a).
-
Figure 4—figure supplement 1—source data 1
CSA only accounts for a fraction of CDO1-dependent (CYS)2 consumption.
- https://doi.org/10.7554/eLife.45572.020
Figure 5 with 4 supplements
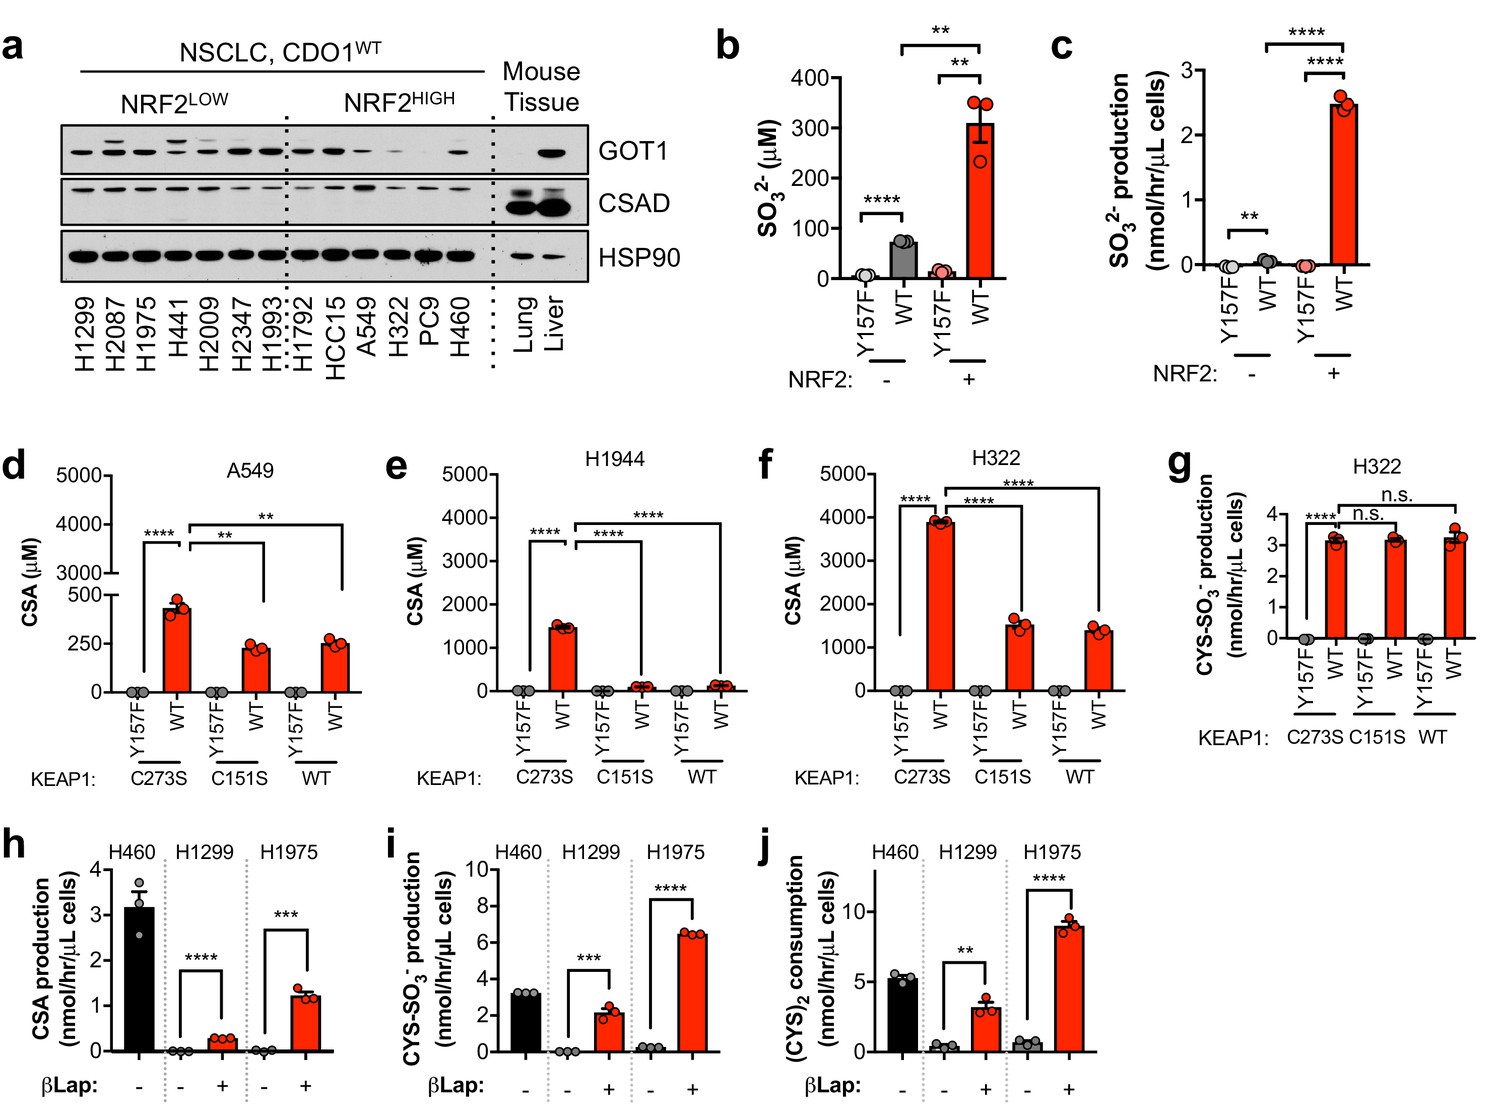
CDO1 expressing cells produce SO32-, which further depletes (CYS)2 via sulfitolysis.
(a) Relative abundance of cysteine-related metabolites in cell extracts following CDO1WT or CDO1Y157F expression in A549 cells. Fresh medium was added 4 hr prior to extraction. Metabolites were analyzed by untargeted LC-MS. N.B. - cysteine and GSH were not derivatized with NEM for this analysis. N = 3 replicates/group. (b) GOT1 mediates the transamination of CSA to produce β-sulfinyl pyruvate, which decomposes to pyruvate and sulfite (SO32-). Sulfite hydrolyzes (CYS)2 to produce cysteine-S-sulfate (CYS-SO3-) in a process known as sulfitolysis. (c,d) Time-dependent quantification of the medium concentrations of and SO32- (c) and CYS-SO3- (d) concentrations from Figure 4d. (e) Time-dependent quantification of (CYS)2 and CYS-SO3- following the addition of 1 mM Na2SO3 to RPMI +10% FBS in the absence of cells. N = 3 replicates/group. (f) CYS-SO3- production rate of H1581 cells following expression of control (sgCON) or CDO1-targeting sgRNAs (sgCDO1 #1 and #2) and Cas9. N = 4 replicates/group. (g) CYS-SO3- production rate of NRF2 KO A549 cells reconstituted with either pLX317 empty (NRF2 -) or pLX317-NRF2 (NRF2 +), followed by expression of CDO1Y157F (Y157F) or CDO1WT (WT). N = 6 replicates/group. (h) CYS-SO3- production rate of H1975 and H1299 cells expressing either pLX317 empty (-) or pLX317-NRF2T80K (NRF2T80K), followed by expression of CDO1Y157F (Y157F) or CDO1WT (WT). N = 3 replicates/group. (i) CYS-SO3- production rate of A549 cells following expression of CDO1Y157F (Y157F) or CDO1WT (WT), and reconstituted with inactive KEAP1 (C273S), super repressor KEAP1 (C151S) or wild-type KEAP1 (WT). N = 3 replicates/group. (j) Intracellular SO32- concentration in the cells from (i). (k) CYS-SO3- production rate of H1944 cells following expression of CDO1Y157F (Y157F) or CDO1WT (WT), and reconstituted with inactive KEAP1 (C273S), super repressor KEAP1 (C151S) or wild-type KEAP1 (WT). N = 3 replicates/group. For a, c, d, g-k, cells were treated with 0.25 μg/ml doxycycline for 2 days prior to and during the assay.
-
Figure 5—source data 1
CDO1 expressing cells produce SO32-, which further depletes (CYS)2 via sulfitolysis.
- https://doi.org/10.7554/eLife.45572.030
Figure 5—figure supplement 1
Sulfite reacts with cystine and oxidized glutathione in the absence of cells.
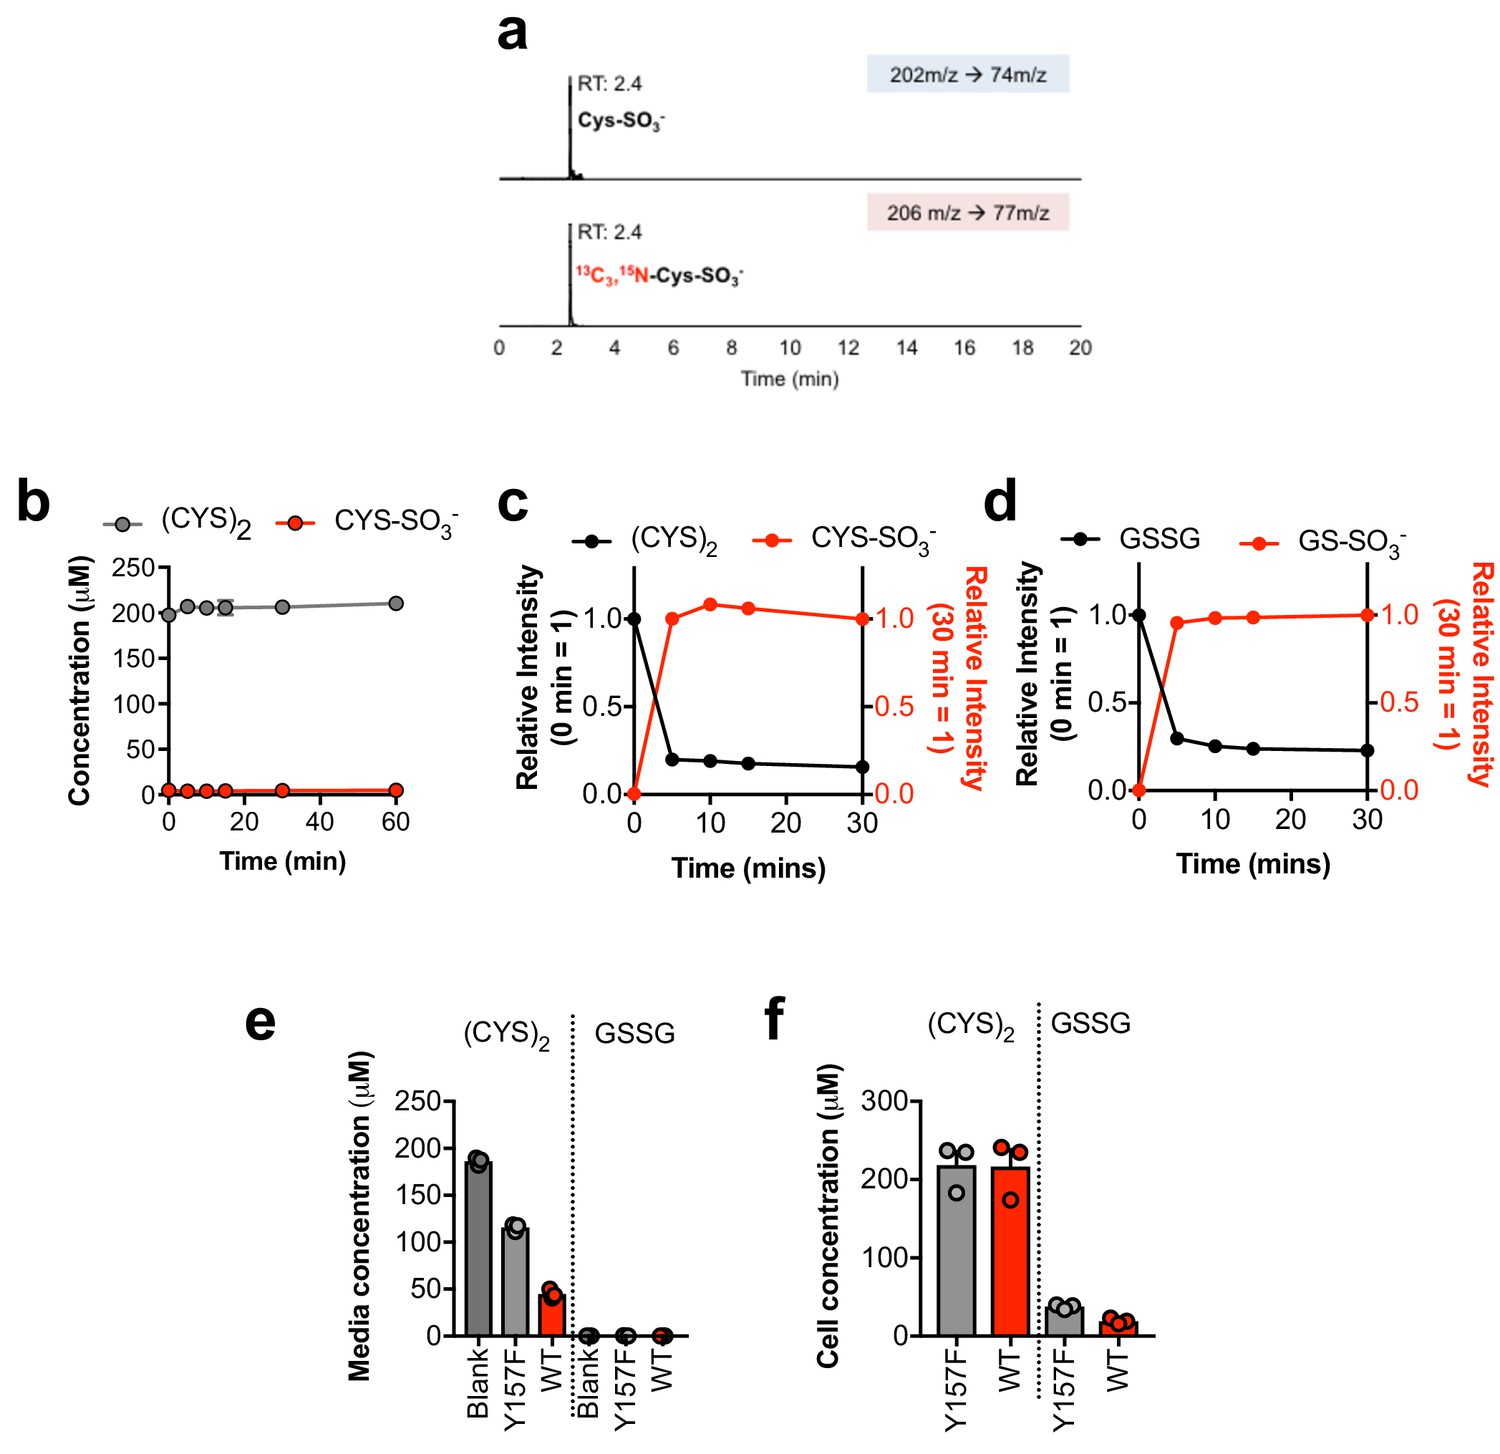
(a) Verification of the stable-isotope labeled CYS-SO3- internal standard for absolute quantification. Stable isotope labeled CYS-SO3- was synthesized from [13C3, 15N]-cysteine and analyzed by LC-MS/MS based SRM against an authentic standard. RT, retention time. (b) Time-dependent quantification of (CYS)2 and CYS-SO3- following the addition of 1 mM CSA to RPMI +10% FBS in the absence of cells. (c) Relative quantification of (CYS)2 and CYS-SO3- following the addition of 1 mM SO32- to cystine-free RPMI +200 µM (Cys)2 + 10% dFBS in the absence of cells. (d) Relative quantification of GSSG and GS-SO3- following the addition of 1 mM SO32- to cystine-free RPMI +200 µM GSSG +10% dFBS in the absence of cells. (e–f) Quantitation of the levels of (Cys)2 and GSSG in blank (blank) or the conditioned medium (e) or cellular extracts (f) from H460 cells expressing CDO1WT (WT) or CDO1Y157F (Y157F). Cells were treated with 0.25 µg/ml doxycycline for 2 days prior to and during the assay, and fresh medium was added 6 hr (e) or 4 hr (f) prior to sample collection.
-
Figure 5—figure supplement 1—source data 1
Sulfite reacts with cystine and oxidized glutathione in the absence of cells.
- https://doi.org/10.7554/eLife.45572.023
Figure 5—figure supplement 2
MEFs preferentially use the CSA decarboxylation pathway.
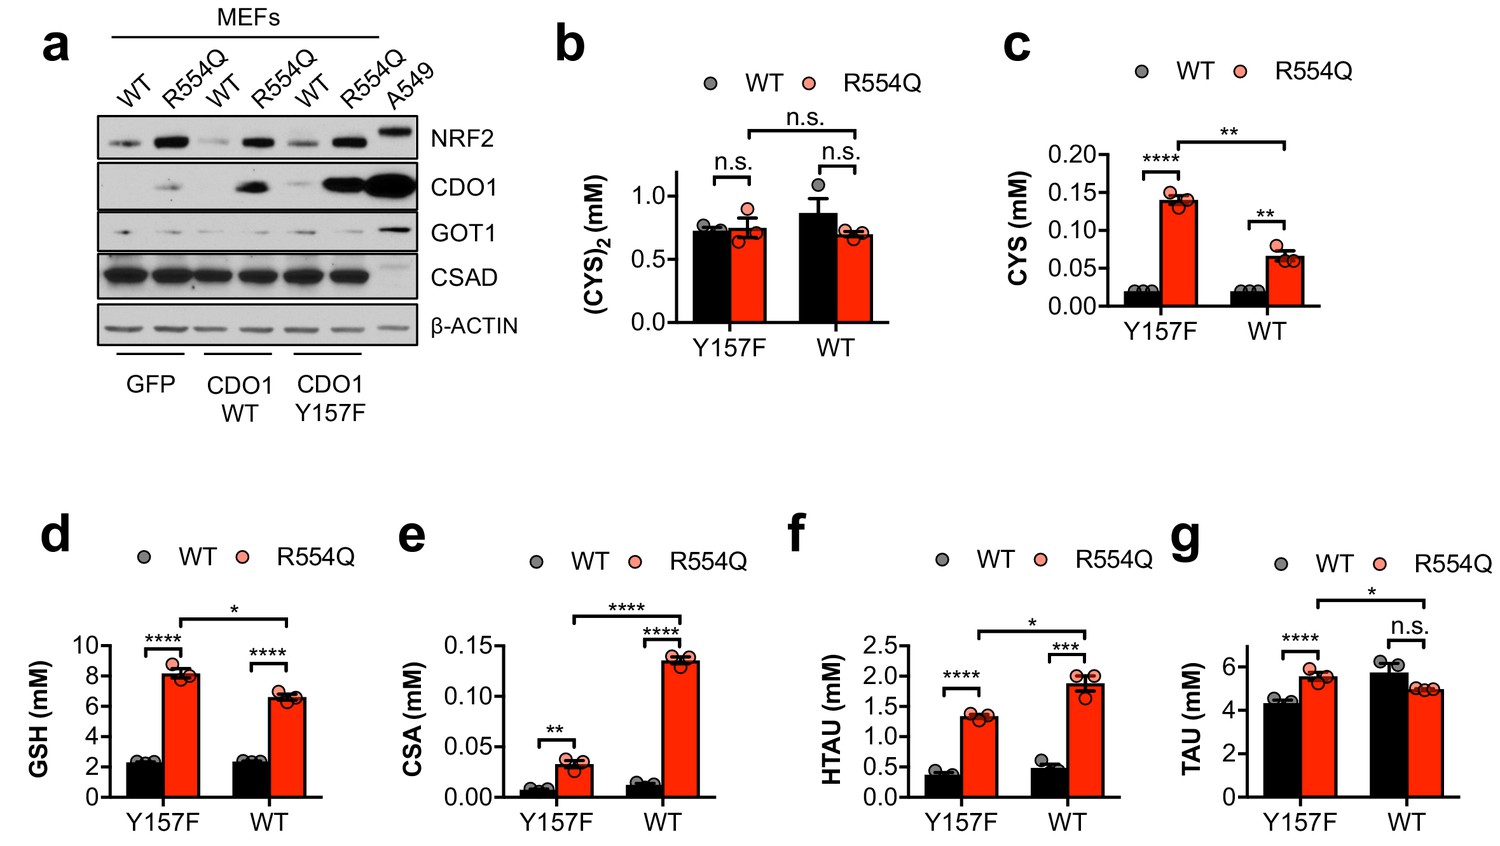
(a) Western blot analysis of NRF2, CDO1, GOT1, CSAD and β-ACTIN levels following expression of GFP, CDO1WT, or CDO1Y157F in Keap1WT/WT (WT) and Keap1R554Q/R554Q (R554Q) MEFs. A549s expressing CDO1WT are included for comparison. (b–g) Quantitation of cystine (CYS2, (b), cysteine (CYS, (c), glutathione (GSH, (d), cysteine sulfinic acid (CSA, (e), hypotaurine (HTAU, (f) and taurine (TAU, (g) levels in Keap1R554Q/R554Q MEFs (red) compared to Keap1WT/WT MEFs (black) following expression of CDO1Y157F (Y157F) or CDO1WT (WT). N = 3 replicates/group. Cells were treated with 0.25 µg/ml doxycycline for 2 days prior to and during the assay, and fresh medium was added 4 hr prior to sample collection.
-
Figure 5—figure supplement 2—source data 1
MEFs preferentially use the CSA decarboxylation pathway.
- https://doi.org/10.7554/eLife.45572.025
Figure 5—figure supplement 3
NRF2 promotes the CDO1-dependent production of sulfite in NSCLC cell lines.
(a) Western blot analysis of GOT1, CSAD and HSP90 levels in NRF2LOW and NRF2HIGH NSCLC cell lines. Mouse liver is included as a positive control for GOT1 and CSAD expression. Cells were fed with fresh RPMI +10% FBS 4 hr prior to lysate collection. (b) Intracellular SO32- concentration of NRF2 KO A549 cells reconstituted with either pLX317 empty (NRF2 -) or pLX317-NRF2 (NRF2 +), followed by re-expression of CDO1Y157F (Y157F) or CDO1WT (WT). N = 3 replicates/group. (c) SO32- production rate of cells from (b). (d–f) Intracellular CSA concentration of A549 (d), H1944 (e) and H322 (f) cells following re-expression of CDO1Y157F (Y157F) or CDO1WT (WT), and reconstituted with inactive KEAP1 (C273S), super repressor KEAP1 (C151S) or wild-type KEAP1 (WT). N = 3 replicates/group. (g) CYS-SO3- production rate of H322 cells following expression of CDO1Y157F (Y157F) or CDO1WT (WT), and reconstituted with inactive KEAP1 (C273S), super repressor KEAP1 (C151S) or wild-type KEAP1 (WT). N = 3 replicates/group. (h–j) Analysis of CDO1-dependent CSA production (h), Cys-SO3- production (i) and cystine consumption (j) in the 24 hr group from Figure 3—figure supplement 3B. N = 3 replicates/group. For a–j), cells were treated with 0.25 µg/ml doxycycline for 2 days prior to and during the assay, and fresh medium was added 4 hr prior to sample collection.
-
Figure 5—figure supplement 3—source data 1
NRF2 promotes the CDO1-dependent production of sulfite in NSCLC cell lines.
- https://doi.org/10.7554/eLife.45572.027
Figure 5—figure supplement 4
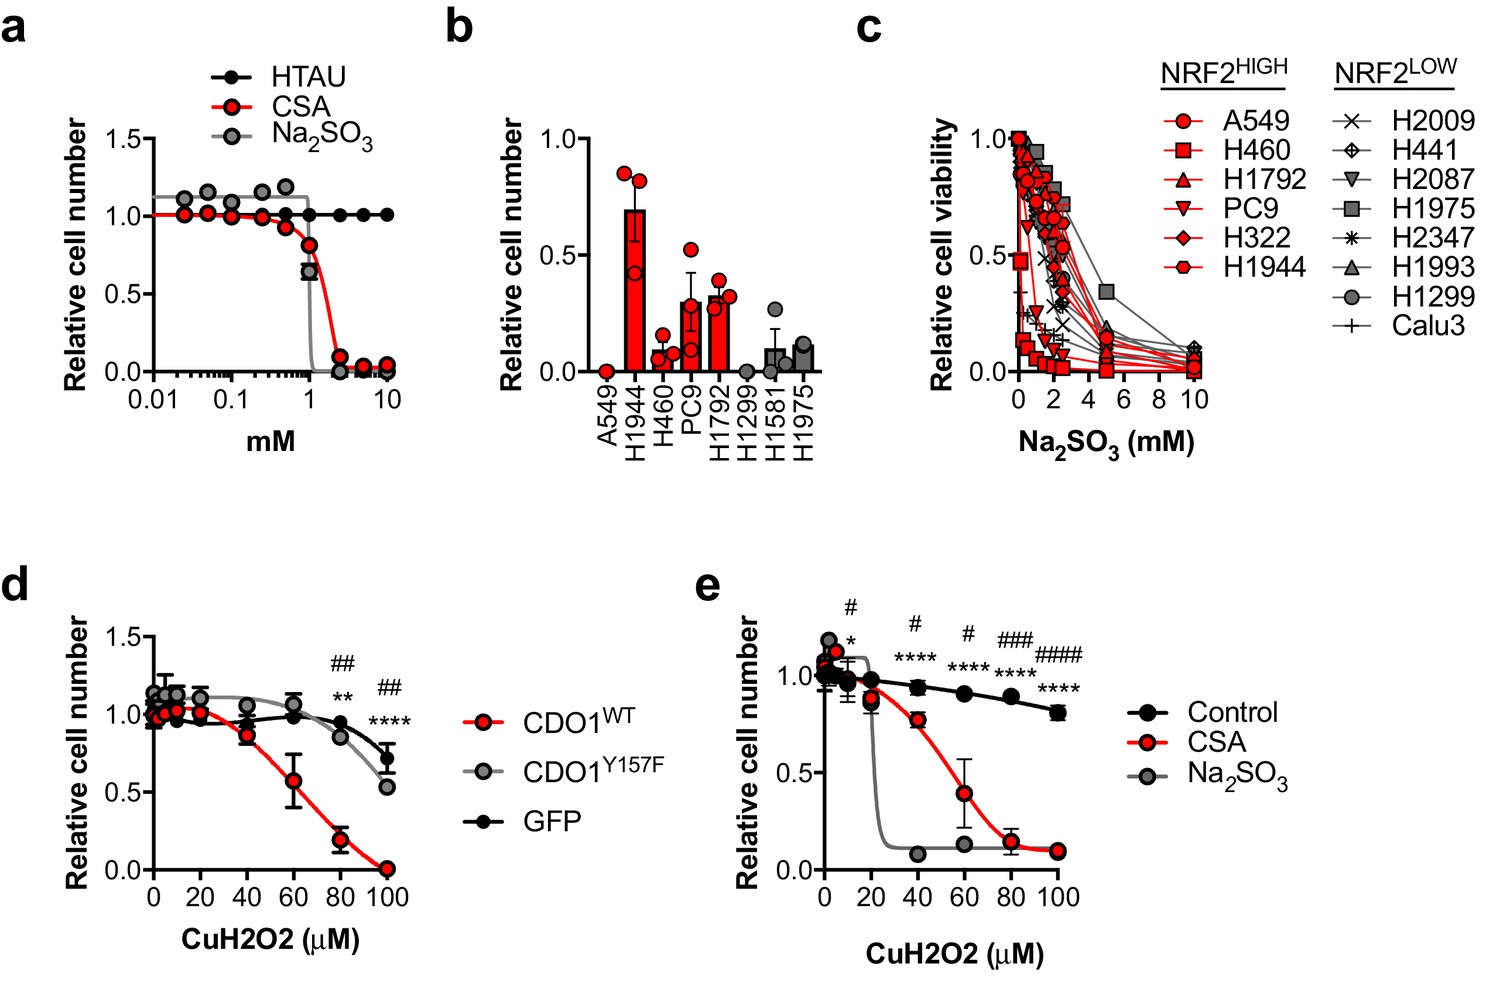
CSA and sulfite are toxic to NSCLC cells.
(a) Analysis of cell viability following treatment of A549 cells with 0–10 mM HTAU, CSA or Na2SO3 for 5 days. Viable cells were analyzed with CellTiter-Glo and normalized to untreated cells. N = 3 replicates/group. (b) Analysis of cell viability following starvation of NRF2LOW (gray) and NRF2HIGH (red) NSCLC cell lines of cystine for 3 days. Cell numbers were analyzed with crystal violet and normalized to cells grown in cystine-containing media. N = 3 replicates/group. (c) Analysis of cell viability following treatment of NRF2LOW (gray) and NRF2HIGH (red) NSCLC cell lines with 0–10 mM Na2SO3 for 3 days. Viable cells were analyzed with CellTiter-Glo and normalized to untreated cells. N = 3 replicates/group. (d) Analysis of cell viability following treatment of A549 cells expressing GFP, CDO1Y157F or CDO1WT with 0–100 µM cumene hydroperoxide (CuH2O2) for 24 hr. A549s were treated with 0.25 µg/mL doxycycline for 3 days prior to CuH2O2 treatment to induce cDNA expression. Cell numbers were analyzed with crystal violet and normalized to untreated cells. *CDO1WT vs. CDO1Y157F. #CDO1WT vs. GFP. N = 3 replicates/group. (e) Analysis of cell viability following treatment of A549 cells with 2.5 mM CSA, 2.5 mM Na2SO3 or control for 3 days, followed by treatment with 0–100 µM CuH2O2 for 24 hr. Cell numbers were analyzed with crystal violet and normalized to untreated cells. *Control vs. CSA. #Control vs. Na2SO3. N = 3 replicates/group.
-
Figure 5—figure supplement 4—source data 1
CSA and sulfite are toxic to NSCLC cells.
- https://doi.org/10.7554/eLife.45572.029
Figure 6
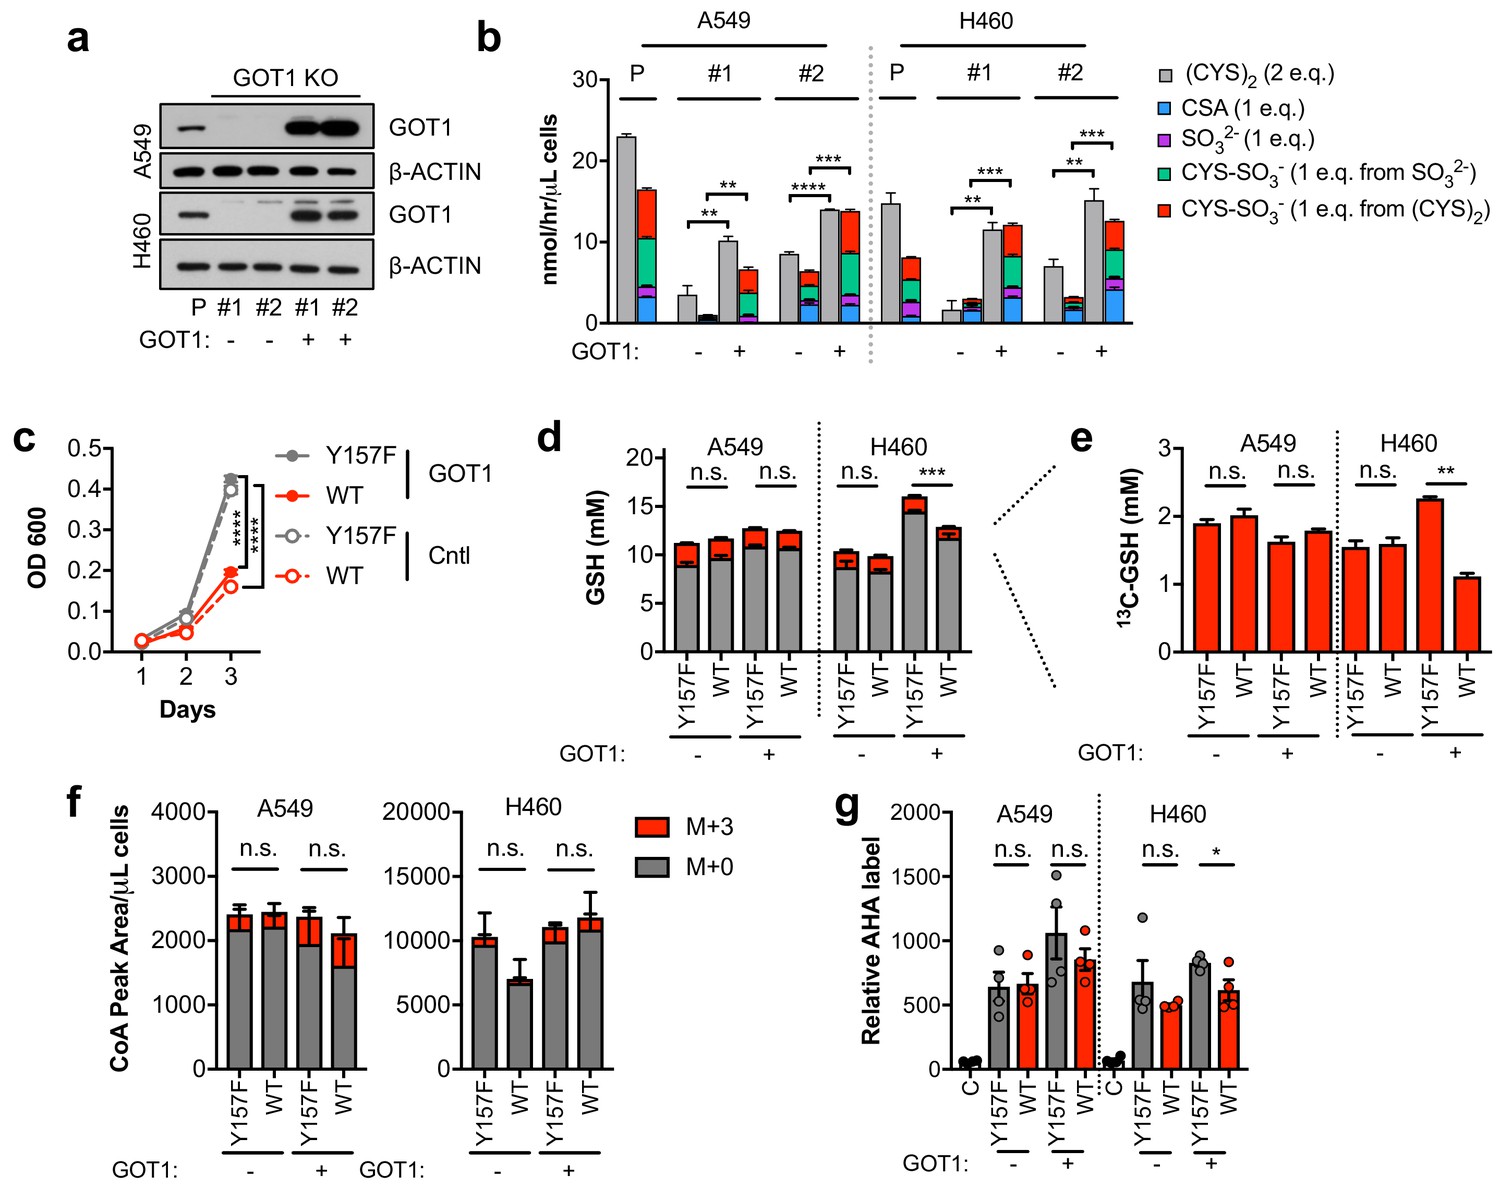
Sulfitolysis is not required for the inhibition of proliferation by CDO1.
(a) Western blot analysis of GOT1 and β-ACTIN expression in parental (P) A549 and H460 cells, and GOT1 KO clones #1 and #2 for each cell line expressing empty pMXS (GOT1 -) and reconstituted with pMXS-GOT1 (GOT1 +). (b) Contribution of sulfitolysis to (CYS)2 consumption by CDO1. CDO1-dependent (CYS)2 consumption, and CSA, SO32-, and CYS-SO3- production were determined as cysteine molar equivalents. N = 3 replicates/group. (c) Analysis of the proliferation of GOT1 KO A549 cells from (a) expressing CDO1Y157F (Y157F) or CDO1WT (WT). Cells were collected on the indicated days, stained with crystal violet and their absorbance at 600 nm determined. N = 3 replicates/group. (d,e) Quantitation of glutathione (GSH) total (12C + 13C) levels (d) and 13C-labeling only (e) from 13C-cystine in cells from (A) following expression of CDO1Y157F (Y157F) or CDO1WT (WT). 13C-label is shown in red, while 12C-label is gray. Cells were labeled for 1 hr. N = 3 replicates/group. (f) Analysis of Coenzyme A (CoA) labeling from 13C, 15N-cystine in cells from (a) expressing CDO1Y157F (Y157F) or CDO1WT (WT). 13C,15N-label (M + 3) is shown in red, while 12C, 14N-label is gray. Cells were labeled for 4 hr. N = 3 replicates/group. (g) Analysis of protein synthesis rates with azidohomoalanine labeling in cells from (a) expressing CDO1Y157F (Y157F) or CDO1WT (WT). Cells treated with 50 μg/mL cyclohexamide (C) were used as a positive control for translation inhibition. N = 4 replicates/group. For b–g,) cells were treated with 0.25 μg/ml doxycycline for 2 days prior to and during the assay.
-
Figure 6—source data 1
Sulfitolysis is not required for the inhibition of proliferation by CDO1.
- https://doi.org/10.7554/eLife.45572.032
Figure 7 with 1 supplement

CDO1-dependent cystine reduction limits NADPH availability for cellular processes.
(a) The NADPH/NADP + ratio was assayed following expression of CDO1Y157F (Y157F) or CDO1WT (WT) in A549 and H460 GOT1 KO cells expressing empty pMXS (GOT1 -) or reconstituted with pMXS-GOT1 (GOT1 +). N = 3 replicates/group. (b) Quantitation of reduced glutathione (GSH) and oxidized glutathione (GSSG) in KEAP1C273S-expressing cells from Figure 4k,l following expression of CDO1Y157F (Y157F) or CDO1WT (WT). N = 3 replicates/group. (c) A549 and H460 GOT1 KO cells expressing empty pMXS (dashed line, open circle) or reconstituted with pMXS-GOT1 (solid line, solid circle), followed by expression of CDO1Y157F (gray) or CDO1WT (red), were treated with 0–25 μM cumene hydroperoxide (CuH2O2) for 24 hr. Cell numbers were analyzed using crystal violet and normalized to untreated cells. *=GOT1+ CDO1WT vs. CDO1Y157F, #=GOT1- CDO1WT vs. CDO1Y157F. N = 3 replicates/group. (d) Analysis of proline (M + 5) labeling from L-[U]-13C-glutamine in GOT1 KO A549 and H460 cells expressing empty pMXS (Control) or reconstituted with pMXS-GOT1 (GOT1), followed by expression of CDO1Y157F or CDO1WT. Proline M + 5 abundance was normalized to the abundance of its precursor glutamate M + 5, and then CDO1WT levels were normalized to CDO1Y157F. Cells were labeled for 1 hr in proline-free media. N = 3 replicates/group. (e,f) Mass isotopomer analysis of citrate labeling in GOT1 KO A549 (d) and H460 (e) cells expressing empty pMXS (Control) or reconstituted with pMXS-GOT1 (GOT1) following expression of CDO1Y157F or CDO1WT cultured with L-[U]-13C-glutamine for 4 hr. N = 3 replicates/group. For (a–f), cells were treated with 0.25 µg/ml doxycycline for 2 days prior to and during the assay.
-
Figure 7—source data 1
CDO1-dependent cystine reduction limits NADPH availability for cellular processes.
- https://doi.org/10.7554/eLife.45572.035
Figure 7—figure supplement 1

Cystine uptake and reduction depletes NADPH.
(a) The NADPH/NADP+ ratio was assayed following growth of A549 cells in medium containing 200 µM or 0 µM cystine for 24 hr. The ratio was normalized to cells grown in 200 µM cystine. N = 3 replicates/group. (b) H1581 cells were infected with lentivirus encoding Cas9 and non-targeting (sgCON) or CDO1-targeting (#1, #2) sgRNAs to delete CDO1 in the bulk population. Cells were treated with the indicated doses of CuH2O2 for 24 hr and cell number normalized to EtOH (Vehicle) treated cells. N = 3 replicates/group. (c) Soft agar growth of NSCLC cell lines expressing CDO1Y157F (Y157F) or CDO1WT (WT). Cells were treated with 0.25 µg/ml doxycycline for 2 days prior to and during the assay. N = 3 replicates/group. (d) Western blot analysis of CDO1 and HSP90 levels in GOT1 KO A549 and H460 cells expressing empty pMXS (Cntl) or reconstituted with pMXS-GOT1 (GOT1), followed by expression of CDO1Y157F or CDO1WT. Cells were cultured in either 200 µM or 10 µM (Cys)2, or 200 µM (Cys)2 + 0.5µM Erastin. (e) Quantification of medium (Cys)2 levels following Erastin treatment or growth in 10 µM (Cys)2. Control medium contains 200 µM (Cys)2. (f) Analysis of the proliferation of the cells from (d). Cells were fed with fresh media daily, collected on the indicated days, stained with crystal violet and their absorbance at 600 nm determined. N = 3 replicates/group. For (d,f), cells were treated with 0.25 µg/ml doxycycline for 2 days prior to and during the assay, and fresh medium was added 5 hr prior to sample collection (d) or during the assay (f).
-
Figure 7—figure supplement 1—source data 1
Cystine uptake and reduction depletes NADPH.
- https://doi.org/10.7554/eLife.45572.036
Figure 8

Nrf2 activation promotes Cdo1 expression in murine lung tumors in vivo.
(a) Overall survival of Trp53flox/flox and KrasG12D; Trp53flox/flox mice expressing homozygous Keap1WT (WT/WT), heterozygous for Keap1R554Q (R554Q/WT) or homozygous for Keap1R554Q (R554Q/R554Q). (b) Representative hematoxylin and eosin (H&E) stained section depicting lung hemorrhage in KrasG12D; Trp53flox/flox; Keap1R554Q/R554Q mice compared to KrasG12D; Trp53flox/flox; Keap1WT/WT mice. (c) (Left) Representative H&E image of lung tumor burden in KrasG12D; Trp53flox/flox mice expressing Keap1WT/WT, Keap1R554Q/WT or homozygous for Keap1R554Q/R554Q. (Right) Quantification of average lung tumor size per mouse. WT/WT (N = 10 mice), R554Q/WT (N = 8 mice), R554Q/R554Q (N = 10 mice). (d) (Left) Representative Nqo1 and Cdo1 immunohistochemistry of KrasG12D; Trp53flox/flox mouse tumors expressing Keap1WT/WT, Keap1R554Q/WT or homozygous for Keap1R554Q/R554Q. B, Bronchiole; T, Tumor. (Right) Average score (scale = 0–4) for Nqo1 staining across mice. WT/WT (N = 10 mice), R554Q/WT (N = 6 mice), R554Q/R554Q (N = 10 mice).
-
Figure 8—source data 1
Nrf2 activation promotes Cdo1 expression in murine lung tumors.
- https://doi.org/10.7554/eLife.45572.038
Figure 9
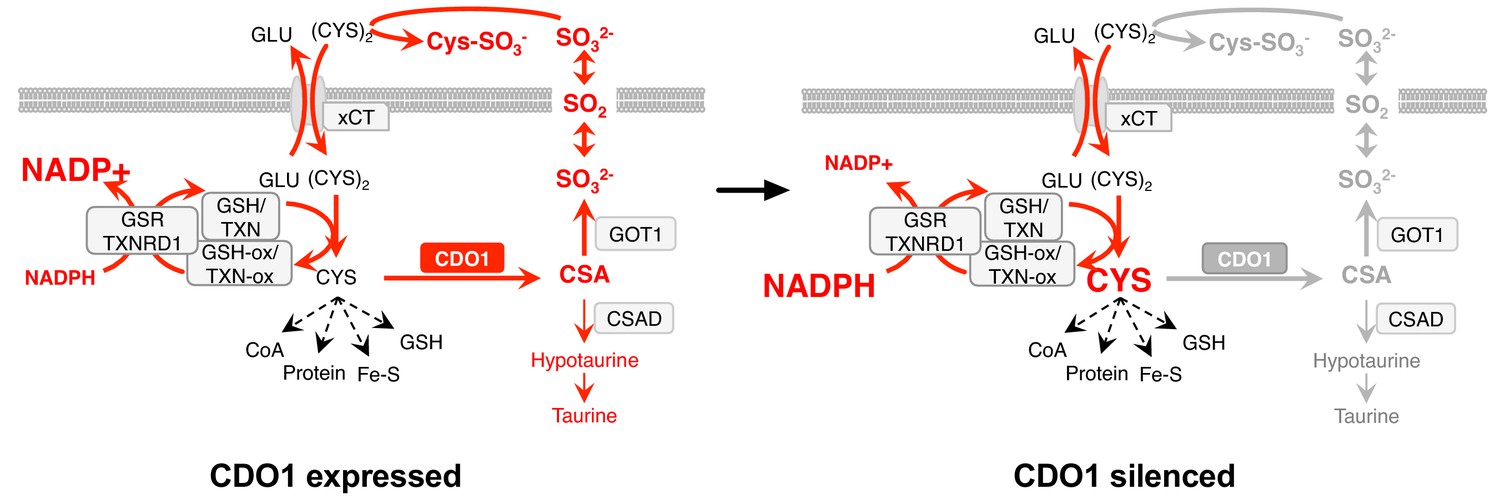
Model: CDO1 antagonizes the growth and survival of KEAP1MUT cells by producing toxic products and depleting NADPH.
(Left) Elevated intracellular cysteine (CYS) stabilizes CDO1, leading to the production of CSA and SO32-. In turn, SO32- depletes cystine via sulfitolysis to produce CYS-SO3-, further limiting cysteine availability and utilization. SO2 (sulfur dioxide) exists in equilibrium with SO32- and is a gas that may diffuse in and out of cells. The continual reduction of (CYS)2 to CYS depletes cellular NADPH, limiting its availability for cellular processes. (Right) CDO1 silencing promotes the accumulation of intracellular CYS and NADPH, and prevents wasting of CYS as CSA and toxic SO32-. GSR, glutathione reductase. TXNRD1, thioredoxin reductase 1. Fe-S, iron sulfur cluster.
Tables
Key resources table
| Reagent type (species) or resource | Designation | Source or reference | Identifiers | Additional information |
|---|---|---|---|---|
| Chemical compound, drug | Cycloheximide | Sigma Aldrich | 01810–1G | |
| Chemical compound, drug | Pyridine | Sigma Aldrich | 270970–1L | |
| Chemical compound, drug | CuCl2 | Sigma Aldrich | 203149–10 | |
| Chemical compound, drug | Methoxylamine hydrochloride | Sigma Aldrich | 226904–5G | |
| Chemical compound, drug | Ethyl acetate (LC-MS grade) | Sigma Aldrich | 34972–1 L-R | |
| Chemical compound, drug | Methanol (HPLC grade) | Sigma Aldrich | 34860–1 L-R | |
| Chemical compound, drug | Cysteine | Sigma Aldrich | C6852-25G | |
| Chemical compound, drug | Cystine | Sigma Aldrich | C6727-25G | |
| Chemical compound, drug | L-Cysteine S-sulfate | Sigma Aldrich | C2196-25MG | |
| Chemical compound, drug | L-Cysteine sulfinic acid | Sigma Aldrich | 270881–1G | |
| Chemical compound, drug | Hypotaurine | Sigma Aldrich | H1384-100MG | |
| Chemical compound, drug | Na2SO3 | Sigma Aldrich | 71988–250G | |
| Chemical compound, drug | [34S]-Na2SO3, | Sigma Aldrich | 753572 | |
| Chemical compound, drug | Doxycycline | Sigma Aldrich | D9891-1G | |
| Chemical compound, drug | [13C2,15N]-Glutathione trifluoroacetate salt, | Sigma Aldrich | 683620 | |
| Chemical compound, drug | GSSG | Sigma Aldrich | G4376-250MG | |
| Chemical compound, drug | Decitabine (5-Aza-2’-deoxycytidine) | Sigma Aldrich | A3656-5MG | |
| Chemical compound, drug | Cumene hydroperoxide | Invitrogen | component of C10445 | |
| Chemical compound, drug | N-Ethylmaleimide | Chem-Impex International | 00142 | |
| Chemical compound, drug | [13C5]-glutamine, | Cambridge Isotope Labs | CLM-1822-H-0.25 | |
| Chemical compound, drug | [13C3, 15N]-Cysteine | Cambridge Isotope Labs | CNLM-3871-H-0.25 | |
| Chemical compound, drug | [13C3]-Cysteine, | Cambridge Isotope Labs | CLM-4320-H-0.1 | |
| Chemical compound, drug | [D4]-Cystine, | Cambridge Isotope Labs | DLM-1000–1 | |
| Chemical compound, drug | [13C2]-Taurine | Cambridge Isotope Labs | CLM-6622 | |
| Chemical compound, drug | [D5]-Glutathione | Santa Cruz Biotechnology | sc-489493 | |
| Chemical compound, drug | [D4]-Hypotaurine | CDN Isotopes | H1384-100MG | |
| Chemical compound, drug | Formic acid | Fisher Chemical | MFX04405 | |
| Chemical compound, drug | NaOH | Fisher Chemical | SS256500 | |
| Chemical compound, drug | MSTFA + 1% TMCS solution | Fisher Chemical | TS-48915 | |
| Chemical compound, drug | HPLC-grade water | Fisher Chemical | W5-1 | |
| Chemical compound, drug | Acetonitrile (HPLC grade) | Honeywell | 34967 | |
| Chemical compound, drug | Erastin | Cayman Chemical | 17754 | |
| Chemical compound, drug | β-lapachone | Dr. David Boothman | ||
| Chemical compound, drug | puromycin | Invivogen | ant-pr-1 | |
| Chemical compound, drug | blasticidin | Invivogen | ant-bl-1 | |
| Strain, strain background (mouse) | LSL-KrasG12D | (Jackson et al., 2001) | ||
| Strain, strain background (mouse) | Trp53flox | (Marino et al., 2000) | ||
| Strain, strain background (mouse) | Keap1R554Q | this paper | A minigene containing a cDNA encoding wild -type exons 3–5, followed by a SV40 polyA signal, was inserted upstream of endogenous exon 3 of the Keap1 gene. Codon 554 in endogenous exon four was mutated from arginine to glutamine | |
| Recombinant DNA reagent | Keap1R554Q genotyping primers | this paper | Common (R) 5’-GCCACC CTATTCACAGACCA-3’ Mutant (F) 5’-ATGGCCA CACTTTTCTGGAC 3’ WT (F) 5’-GGGGGTAGA GGGAGGAGAAT-3’ | WT PCR product = 326 bp Mutant PCR product = 584 bp |
| Recombinant DNA reagent | adenoviral-Cre | University of Iowa | VVC-U of Iowa-5 | |
| Recombinant DNA reagent | pRRL-CDO1 | this paper | The LT3GEPIR vector backbone (Fellmann et al., 2013) was obtained from Johannes Zuber and the MiR-E cassette was excised to generate pRRL-GFP. GFP was excised and replaced with CDO1 using pQTEV-CDO1 (addgene# 31292) as a PCR template. | |
| Recombinant DNA reagent | pRRL-CDO1 Y157F | this paper | The enzyme inactive mutant (CDO1Y157F) was generated from pRRL-CDO1 by site-directed mutagenesis of the wild-type protein. | |
| Recombinant DNA reagent | pQTEV-CDO1 | Addgene | 31292 | |
| Recombinant DNA reagent | lentiCRISPR-V2 | (Shalem et al., 2014) | ||
| Recombinant DNA reagent | lentiCRISPR-V2 mCdo1 #2 | this paper | progenitor: lentiCRISPR-V2; oligonucleotides for sgRNAs targeting mCDO1 (#2F 5’- caccgCGAGAGCAATCCCGCCGAGT- 3’, #2R 5’-aaacACTCGGCG GGATTGCTCTCGc-3’) | |
| Recombinant DNA reagent | lentiCRISPR-V2 mCdo1 #3 | this paper | progenitor: lentiCRISPR-V2; oligonucleotides for sgRNAs targeting mCDO1 (#3F 5’-caccgCGAAGAGCTCATGTAA GATG-3’, #3R 5’-aaacCATCTT ACATGAGCTCTTCGc-3’) | |
| Recombinant DNA reagent | lentiCRISPR-V2 hCDO1 #1 | this paper | progenitor: lentiCRISPR-V2; oligonucleotides for sgRNAs targeting hCDO1 (F - 5’-caccgGAT GCGGATCAGATCAGCCA-3’, R - 5’-aaacTGGCTGATCT GATCCGCATCc-3’) | |
| Recombinant DNA reagent | lentiCRISPR-V2 hCDO1 #2 | this paper | progenitor: lentiCRISPR-V2; oligonucleotides for sgRNAs targeting hCDO1 (R - 5’-caccgCGAGAGCGACCCC ACCGAGT-3’,R - 5’-aaacACTCG GTGGGGTCGCTCTCGc-3’) | |
| Recombinant DNA reagent | pLX317-NRF2 | Dr. Alice Berger, (Berger et al., 2016) | ||
| Recombinant DNA reagent | pLX317-NRF2T80K | Dr. Alice Berger, (Berger et al., 2016) | ||
| Recombinant DNA reagent | pLX317-empty | this paper | pLX317-empty was generated from pLX317 -NRF2 by site directed mutagenesis. | |
| Recombinant DNA reagent | pLenti KEAP1WT | this paper | The KEAP1WT cDNA was provided by Dr. Christian Metallo (Zhao et al., 2018); pLenti-GFP-blast was generated from pLenti- GFP-puro (addgene #17448) | |
| Recombinant DNA reagent | pLenti KEAP1C151S | this paper | The KEAP1C151S cDNA was provided by Dr. Christian Metallo (Zhao et al., 2018); pLenti-GFP-blast was generated from pLenti-GFP -puro (addgene #17448) | |
| Recombinant DNA reagent | pLenti KEAP1C273S | this paper | The KEAP1C273S cDNA was provided by Dr. Christian Metallo (Zhao et al., 2018); pLenti-GFP-blast was generated from pLenti-GFP-puro (addgene #17448) | |
| Recombinant DNA reagent | plentiCRISPR-sgGOT1 | addgene | 72874 | |
| Recombinant DNA reagent | pMXS-GOT1 | addgene | 72872 | |
| Recombinant DNA reagent | pMXS-empty | this paper | pMXS-empty was generated from pMXS-GOT1 by site-directed mutagenesis. | |
| Recombinant DNA reagent | pCMV-dR8.2 dvpr | addgene | 8455 | |
| Recombinant DNA reagent | pCMV-VSV-G | addgene | 8454 | |
| Cell line (Homo-sapiens) | Lenti-X 293T | Takara | 632180 | |
| Cell line (Homo-sapiens) | Phoenix-AMPHO | ATCC | CRL-3213 | RRID:CVCL_H716 |
| Cell line (Homo-sapiens) | Calu3 | Dr John Minna, Hamon Cancer Center Collection (University of Texas-Southwestern Medical Center) | (DeNicola et al., 2015) | RRID:CVCL_0609 |
| Cell line (Homo-sapiens) | H1581 | Dr John Minna, Hamon Cancer Center Collection (University of Texas-Southwestern Medical Center) | (DeNicola et al., 2015) | RRID:CVCL_1479 |
| Cell line (Homo-sapiens) | H1975 | Dr John Minna, Hamon Cancer Center Collection (University of Texas-Southwestern Medical Center) | (DeNicola et al., 2015) | RRID:CVCL_1511 |
| Cell line (Homo-sapiens) | H2087 | Dr John Minna, Hamon Cancer Center Collection (University of Texas-Southwestern Medical Center) | (DeNicola et al., 2015) | RRID:CVCL_1524 |
| Cell line (Homo-sapiens) | H2347 | Dr John Minna, Hamon Cancer Center Collection (University of Texas-Southwestern Medical Center) | (DeNicola et al., 2015) | RRID:CVCL_1550 |
| Cell line (Homo-sapiens) | H1792 | Dr John Minna, Hamon Cancer Center Collection (University of Texas-Southwestern Medical Center) | (DeNicola et al., 2015) | RRID:CVCL_1495 |
| Cell line (Homo-sapiens) | H1944 | Dr John Minna, Hamon Cancer Center Collection (University of Texas-Southwestern Medical Center) | (DeNicola et al., 2015) | RRID:CVCL_1508 |
| Cell line (Homo-sapiens) | H322 | Dr John Minna, Hamon Cancer Center Collection (University of Texas-Southwestern Medical Center) | (DeNicola et al., 2015) | RRID:CVCL_1556 |
| Cell line (Homo-sapiens) | H460 | Dr John Minna, Hamon Cancer Center Collection (University of Texas-Southwestern Medical Center) | (DeNicola et al., 2015) | RRID:CVCL_0459 |
| Cell line (Homo-sapiens) | HCC15 | Dr John Minna, Hamon Cancer Center Collection (University of Texas-Southwestern Medical Center) | (DeNicola et al., 2015) | RRID:CVCL_2057 |
| Cell line (Homo-sapiens) | H2009 | ATCC | CRL-5911 | RRID:CVCL_1514 |
| Cell line (Homo-sapiens) | H1299 | ATCC | CRL-5803 | RRID:CVCL_0060 |
| Cell line (Homo-sapiens) | H1993 | ATCC | CRL-5909 | RRID:CVCL_1512 |
| Cell line (Homo-sapiens) | H441 | ATCC | HTB-174 | RRID:CVCL_1561 |
| Cell line (Homo-sapiens) | A549 | ATCC | CCL-185 | RRID:CVCL_0023 |
| Cell line (Homo-sapiens) | NRF2 KO A549 | Dr. Laureano de la Vega | (Torrente et al., 2017) | |
| Cell line (Mus musculus) | mouse embryonic fibroblasts | this paper | MEFs were isolated from E13.5–14.5 day old embryos | |
| Commercial assay or kit | JetPRIME | VWR | 89129–922 | |
| Commercial assay or kit | ImmPRESS HRP anti-rabbit kit | Vector Labs | MP-7451 | |
| Commercial assay or kit | E.Z.N.A. Total RNA Kit I | Omega Biotek | R6834-02 | |
| Commercial assay or kit | PrimeScript RT Master Mix | Takara | RR036A | |
| Commercial assay or kit | Taqman gene expression assays - mCdo1 | Thermo Fisher | 4448892, Mm00473573_m1 | |
| Commercial assay or kit | Taqman gene expression assays - hCDO1 | Thermo Fisher | 4448892, Hs01039954_m1 | |
| Commercial assay or kit | Taqman gene expression assays - mActb | Thermo Fisher | 4448892, Mm02619580_g1 | |
| Commercial assay or kit | Taqman gene expression assays - hACTB | Thermo Fisher | #4333762F | |
| Commercial assay or kit | CellTiter-Glo | Promega | G7571 | |
| Commercial assay or kit | DC protein assay | Biorad | 500112 | |
| Antibody | NRF2 (Rabbit mAb) | Cell Signaling Technologies | 12721 | RRID:AB_2715528; 1:1000 WB |
| Antibody | HSP90 (Rabbit pAb) | Cell Signaling Technologies | 4874 s | RRID:AB_2121214; 1:5000 WB |
| Antibody | TXN1 (Rabbit mAb) | Cell Signaling Technologies | 2429S | RRID:AB_2272594; 1:1000 WB |
| Antibody | α-tubulin (Mouse mAb) | Santa Cruz | sc-8035, clone TU-02 | RRID:AB_628408; 1:500 WB |
| Antibody | β-actin (Mouse mAb) | Thermo Fisher | AM4302, clone AC-15 | RRID:AB_2536382; 1:100,000 WB |
| Antibody | CDO1 (Rabbit pAb) | Abcam | ab53436 | RRID:AB_940958; 1:1000 WB, discontinued, verified with Sigma CDO1 antibody |
| Antibody | xCT (Rabbit pAb) | Abcam | ab37185 | RRID:AB_778944; 1:1000 WB |
| Antibody | GOT1 (Rabbit pAb) | Biovision | A1272 | RRID:AB_2801348; 1:1000 WB |
| Antibody | CSAD (Rabbit pAb) | LSBio | C375526 | RRID:AB_2801349; 1:1000 WB |
| Antibody | Anti-NQO1 antibody (Rabbit pAb) | Sigma Aldrich | HPA007308 | RRID:AB_1079501; 1:100, IHC; 1:1000 WB |
| Antibody | Anti-CDO1 antibody (Rabbit pAb) | Sigma Aldrich | HPA057503 | RRID:AB_2683451; 1:100, IHC |
| Other | dialyzed FBS | Sigma Aldrich | F0392 | |
| Other | Cysteine/cystine, methionine and glutamine free RPMI | MP Biomedicals | 91646454 | |
| Other | Cysteine/cystine, methionine, pyruvate and glutamine free DMEM | Gibco | 21013024 | |
| Software, algorithm | MZmine 2 | (Pluskal et al., 2010) | Version 2.30 | |
| Software, algorithm | Thermo Xcaliber Qual Browser | Thermo Fisher | Version 4.0.27.19 | |
| Software, algorithm | EI Maven | https://elucidatainc.github.io/ElMaven | Version 0.3.1 | |
| Software, algorithm | Agilent Mass Hunter Workstation Software - Qualitative Analysis | Agilent | Version B.07.00 | |
| Software, algorithm | Image Scope software | Aperio |
Additional files
-
Transparent reporting form
- https://doi.org/10.7554/eLife.45572.040
Download links
A two-part list of links to download the article, or parts of the article, in various formats.
Downloads (link to download the article as PDF)
Open citations (links to open the citations from this article in various online reference manager services)
Cite this article (links to download the citations from this article in formats compatible with various reference manager tools)
Cysteine dioxygenase 1 is a metabolic liability for non-small cell lung cancer
eLife 8:e45572.
https://doi.org/10.7554/eLife.45572


