Asymmetric recruitment and actin-dependent cortical flows drive the neuroblast polarity cycle
- University of Oregon, United States
Figures
Figure 1 with 2 supplements
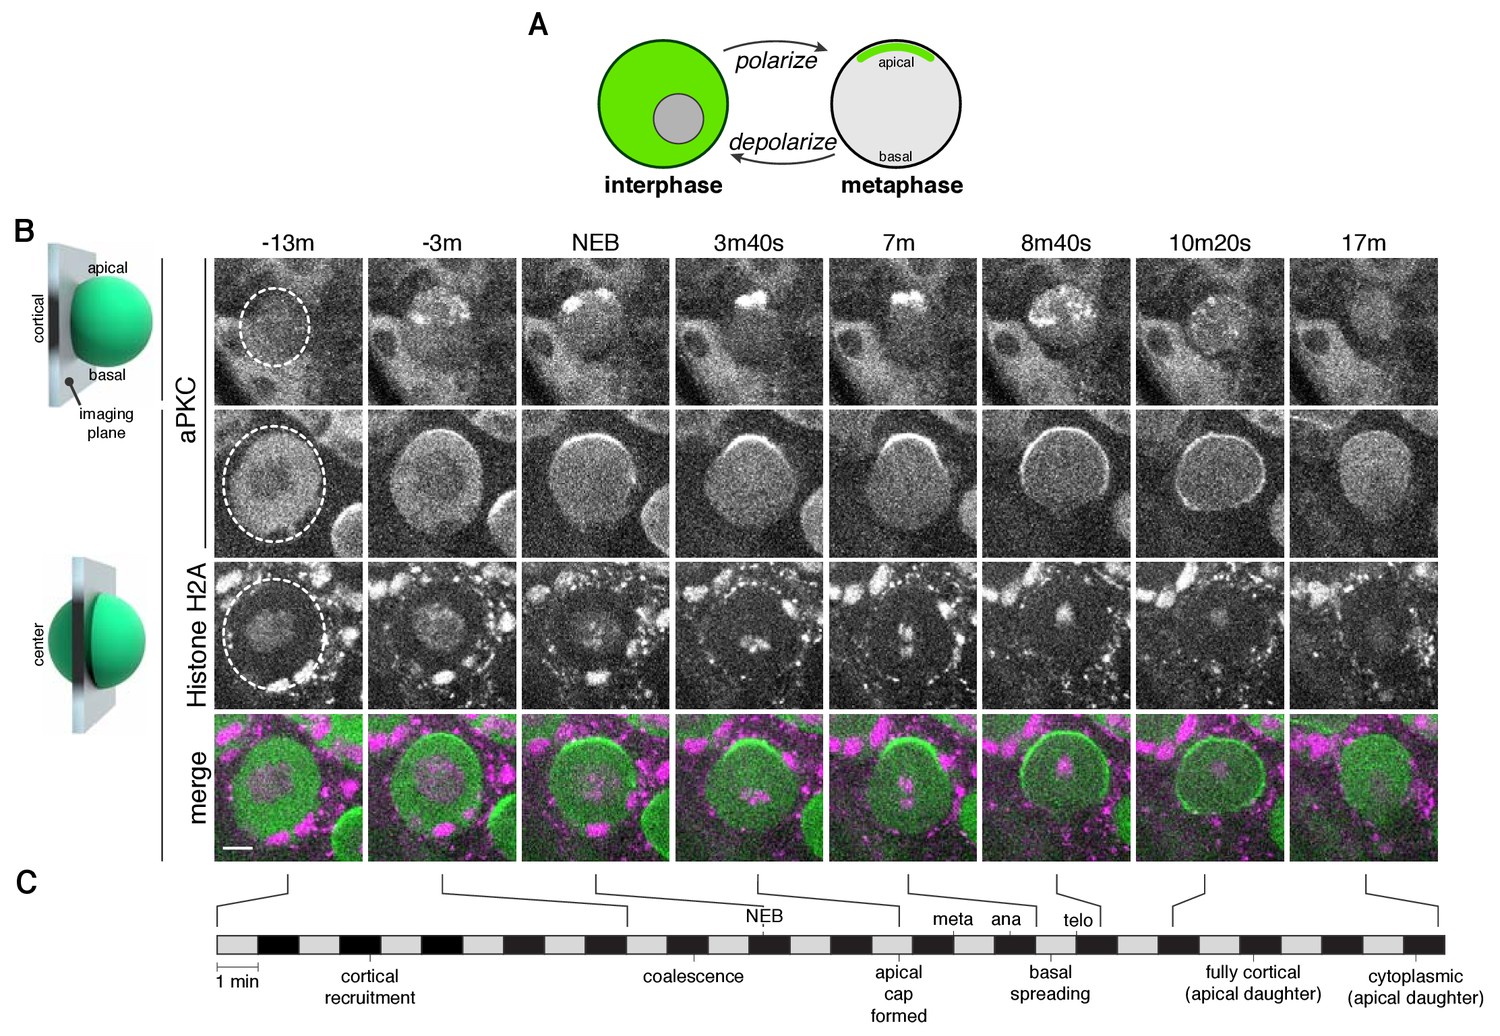
The neuroblast polarity cycle is a dynamic, multistep process.
(A) Schematic of the neuroblast polarity cycle. Neuroblasts transition between unpolarized, cytoplasmic aPKC in interphase, to an apical cortical domain tightly focused around the apical pole in metaphase, the canonical neuroblast polarity state, during repeated asymmetric divisions. (B) Frames from Figure 1—video 1 showing 1.5 µm maximum intensity projections of aPKC-GFP signal along the cortical edge (‘cortical’; top row) and center (‘center’; rows 2–4) of a neuroblast. A maximum intensity project of RFP-Histone H2A signal through the center of the cell, along with a merge of GFP and RFP central projections, are also shown. The outline of the neuroblast is highlighted with a dashed circle in the first column. Time is shown relative to nuclear envelope breakdown. (C) Timeline of the neuroblast polarity cycle with cell cycle hallmarks (NEB, nuclear envelope breakdown; meta, metaphase; ana, anaphase; telo, telophase) marked above the timeline and polarization events below.
Figure 1—figure supplement 1
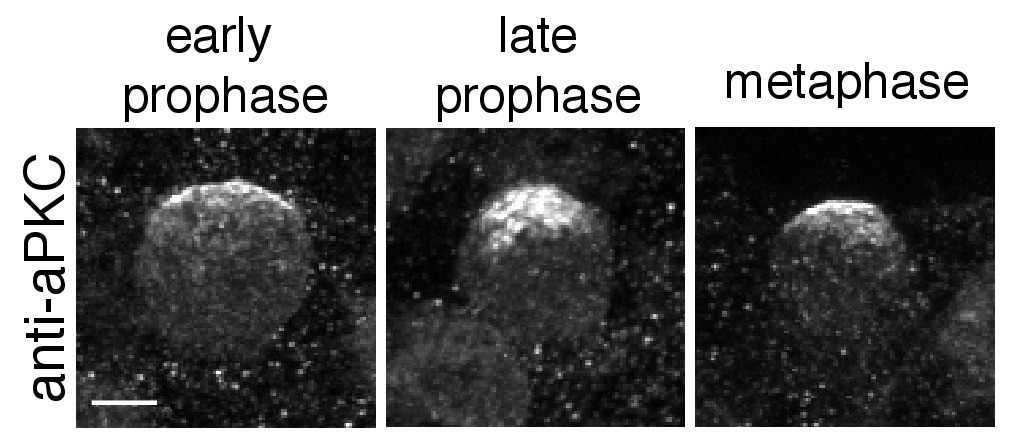
Cortical localization in fixed neuroblasts.
Localization of aPKC in fixed neuroblasts. Cortical patches of aPKC are present in 12 µm maximum intensity projections of three different wild type neuroblasts stained with an anti-aPKC antibody. Cell cycle phases are from DAPI staining (early prophase, late prophase, metaphase; not shown). Scale bar is 5 µm.
Figure 1—video 1
Localization dynamics of the Par complex component aPKC during neuroblast asymmetric division.
Montage of maximum intensity projections of aPKC-GFP signal from a Drosophila larval brain neuroblast through the entire cell (upper left), cortical edge (upper right), and center (lower right). Histone H2A-RFP signal is shown in the bottom left. Time is relative to nuclear envelope breakdown.
Figure 2

Apically directed cortical recruitment and patch coalescence.
(A) Example of aPKC-GFP cortical patches during growth and coalescence phases. Scale bar 2 µm. (B) The number of aPKC-GFP cortical patches in the apical and basal hemispheres immediately before cortical flow begins. Each point represents a distinct neuroblast (taken from four larvae). Bars represent one standard deviation from the mean. Data are included in Figure 2—source data 1. (C) Example patch trajectories during coalescence from particle tracking. Cell outline is shown in light blue. (D) Mean square displacement of several different patches identified by particle tracking as a function of time. (E) Frames (3 µm maximum intensity projection) from a time series showing the example fate of an aPKC-GFP cortical focus (dashed circle) that appeared in the basal cortical hemisphere and dissipated before NEB. Scale bar 2 µm.
-
Figure 2—source data 1
Apical and basal cortical patches.
- https://doi.org/10.7554/eLife.45815.006
Figure 3

Apical cap disassembly.
(A) Spreading of aPKC-GFP during cap disassembly and patch dissipation. A 6 µm maximum intensity projection (one hemisphere along the apical-basal axis) is shown in each panel. The time is relative to nuclear envelope breakdown. The position of the budding GMC is shown by a dotted circle as identified from the Histone H2A channel (not shown). Scale bar 5 µm. (B) Cortical and cytoplasmic intensity of aPKC-GFP in the apical and basal hemispheres during cap disassembly measured from four neuroblasts (error bars represent one standard deviation). Time is shown relative to NEB. (C) Example patch trajectories during cap disassembly from particle tracking. Cell outline is shown in light blue. (D) Particle tracking of independent patches reveals their mean square displacement as a function of time (relative to nuclear envelope breakdown).
Figure 4 with 4 supplements

aPKC cortical dynamics following disruption of the actin cytoskeleton.
(A) Effect of treating a neuroblast with LatA beginning in interphase (24m20s prior to NEB) on aPKC localization dynamics. Frames from Figure 4—video 1 are shown as 4 µm maximum intensity projections along the cortical edge and center of aPKC-GFP taken from Figure 4—video 1. The cortical projections from an untreated neuroblast at equivalent time points are shown for reference in the top row. The neuroblast is highlighted by a dashed circle in the first column. Time is shown relative to nuclear envelope breakdown (NEB). Scale bar 5 µm. (B) Effect of treating a neuroblast with LatA following the initial cortical recruitment events (7m20s prior to NEB) on aPKC localization dynamics. Frames from Figure 4—video 2 are shown as in panel A. (C) Effect of treating a neuroblast with LatA following cap coalescence (4 m prior to NEB) on aPKC localization dynamics. Frames from Figure 4—video 3 are shown as in panel A.
Figure 4—figure supplement 1
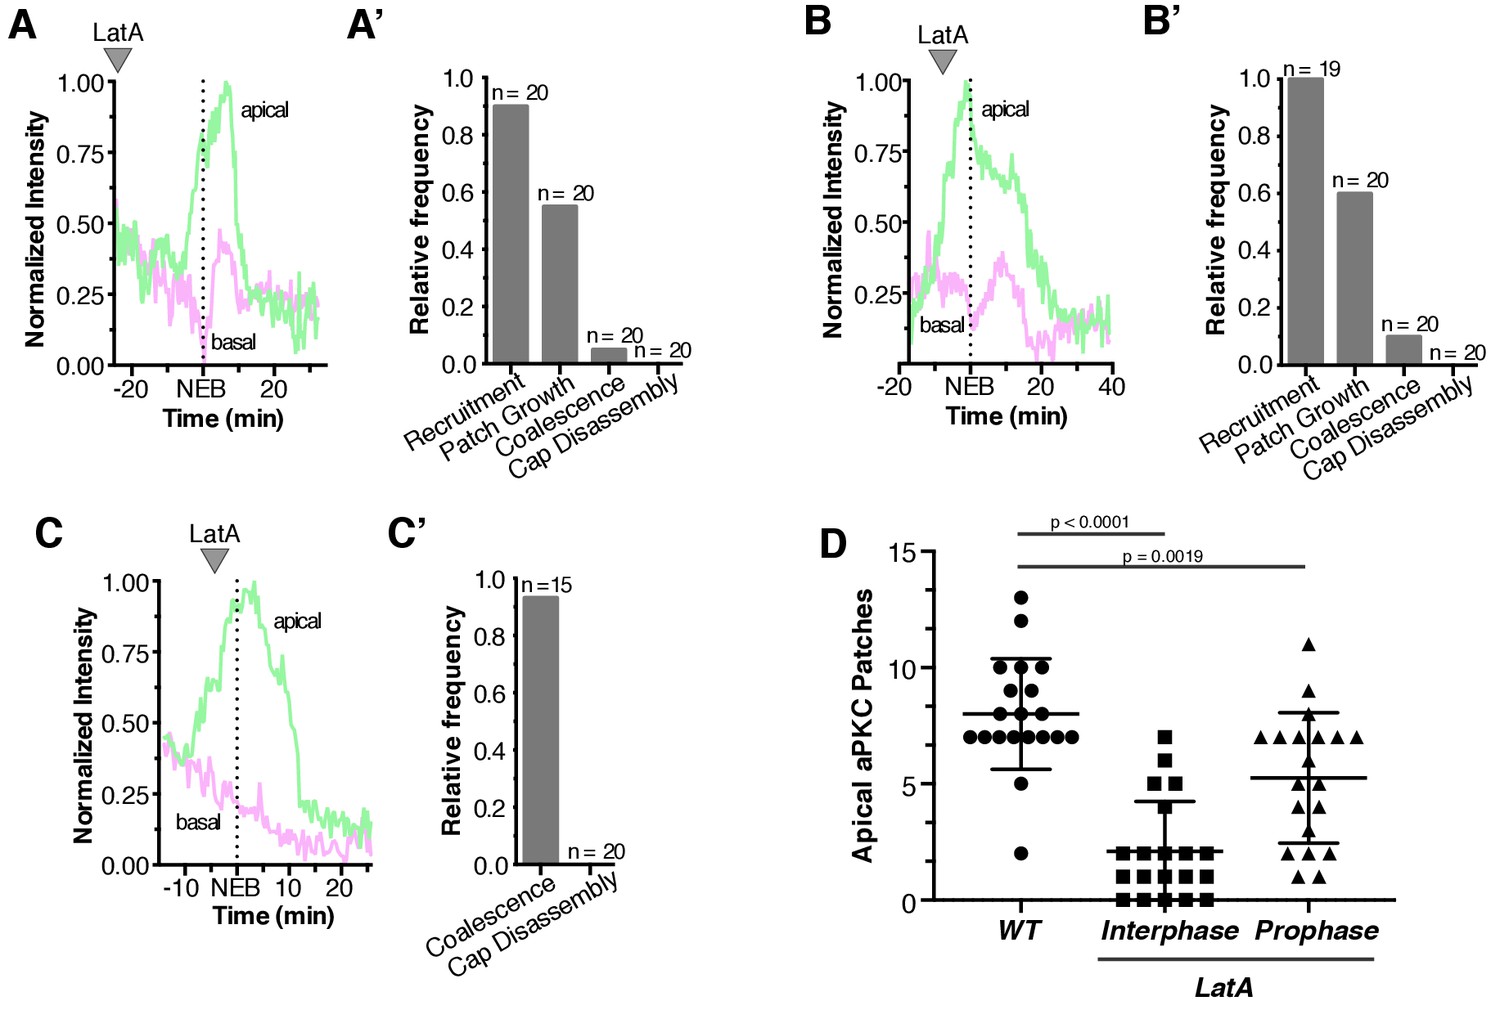
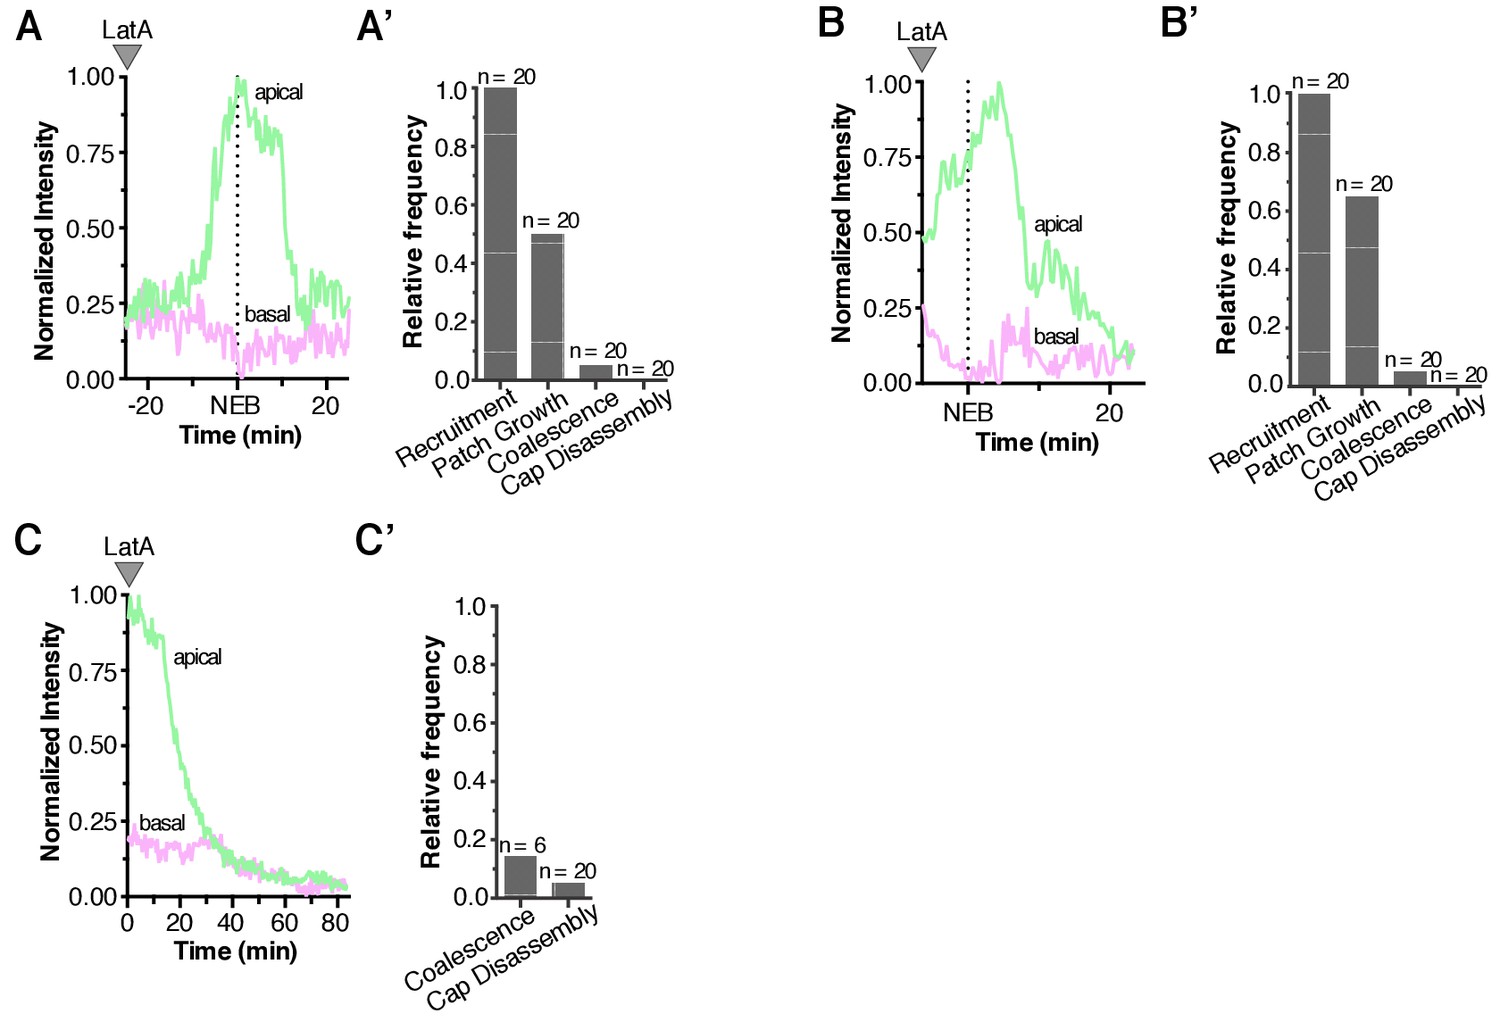
Quantification of Latrunculin A effects on aPKC localization dynamics.
(A) Effect of treating an interphase neuroblast with LatA on aPKC localization. Normalized apical and basal cortical intensity is shown from Figure 4—video 1. (A’) The frequency of neuroblasts treated with LatA in interphase that exhibit any aPKC recruitment to the cortex (‘Recruitment’), growth of foci into patches (‘Patch Growth’), coalescence of patches into an apical cap (‘Coalescence’), and cap disassembly, are shown. Frequency is relative to wild type neuroblasts (wild type neuroblasts exhibit each effect with a frequency of 1.0; n = 20). (B) Effect of treating a neuroblast with LatA following the initial cortical recruitment events on normalized apical and basal cortical aPKC intensity (from Figure 4—video 2). (B’) The frequency of neuroblasts treated with LatA following the initial cortical recruitment events that exhibit characteristics of the neuroblast polarity cycle, as in panel A’. (C) Effect of treating a neuroblast with LatA near cap coalescence on normalized apical and basal cortical aPKC intensity (from Figure 4—video 3). (C’) The frequency of neuroblasts treated with LatA near cap coalescence that exhibit characteristics of the neuroblast polarity cycle, as in panel A’ (‘Recruitment’ and ‘Patch Growth’ phases are not shown because they are completed by metaphase). (D) Number of apical aPKC patches in wild type neuroblasts and those treated with LatA either in interphase or prophase. Error bars represent one standard deviation from the mean. Statistical significance was calculated using a two-tailed t-test. Data are included in Figure 4—figure supplement 1—source data 1.
-
Figure 4—figure supplement 1—source data 1
Apical patches in untreated and LatA treated neuroblasts.
- https://doi.org/10.7554/eLife.45815.013
Figure 4—video 1
Effect of interphase LatA treatment on aPKC localization dynamics.
A neuroblast is shown from a Drosophila larval brain explant treated with LatA 24 minutes and 20 seconds before the neuroblast underwent nuclear envelope breakdown. The montage includes maximum intensity projections of aPKC-GFP signal through the entire cell (upper left), cortical edge (upper right), and center (lower right). Histone H2A-RFP signal is shown in the bottom left. Time is relative to nuclear envelope breakdown.
Figure 4—video 2
Effect of LatA treatment following cortical recruitment on aPKC localization dynamics.
A neuroblast is shown from a Drosophila larval brain explant treated with LatA 7 min and 20 s before the neuroblast underwent nuclear envelope breakdown. The montage includes maximum intensity projections of aPKC-GFP signal through the entire cell (upper left), cortical edge (upper right), and center (lower right). Histone H2A-RFP signal is shown in the bottom left. Time is relative to nuclear envelope breakdown.
Figure 4—video 3
Effect of LatA treatment following apical cap coalescence on aPKC localization dynamics.
A neuroblast is shown from a Drosophila larval brain explant treated with LatA 4 min before the neuroblast underwent nuclear envelope breakdown. The montage includes maximum intensity projections of aPKC-GFP signal through the entire cell (upper left), cortical edge (upper right), and center (lower right). Histone H2A-RFP signal is shown in the bottom left. Time is relative to nuclear envelope breakdown.
Figure 5 with 1 supplement

Bazooka dynamics during the neuroblast polarity cycle.
(A) Frames from Figure 5—video 1 showing 4 µm maximum intensity projections through the cortical edge and center of a larval brain neuroblast expressing Baz-GFP. A central projection of Histone H2A fusion to RFP is shown in the bottom row. The time relative to nuclear envelope breakdown (‘NEB’) is shown. Scale bar 5 µm. (B) Normalized apical and basal cortical intensity (see Materials and methods) of Baz-GFP as a function of time relative to NEB from the divisions of three different neuroblasts with the mean and standard deviation of the signal shown. (C) Localization of Baz and aPKC in fixed neuroblasts at early stages of mitosis (pH3 = phospho histone H3).
Figure 5—video 1
Localization dynamics of the Par complex regulator Baz during neuroblast asymmetric division.
Montage of maximum intensity projections of Baz-GFP signal from a Drosophila larval brain neuroblast through the entire cell (upper left), cortical edge (upper right), and center (lower right). Histone H2A-RFP signal is shown in the bottom left. Time is relative to nuclear envelope breakdown.
Figure 6 with 4 supplements
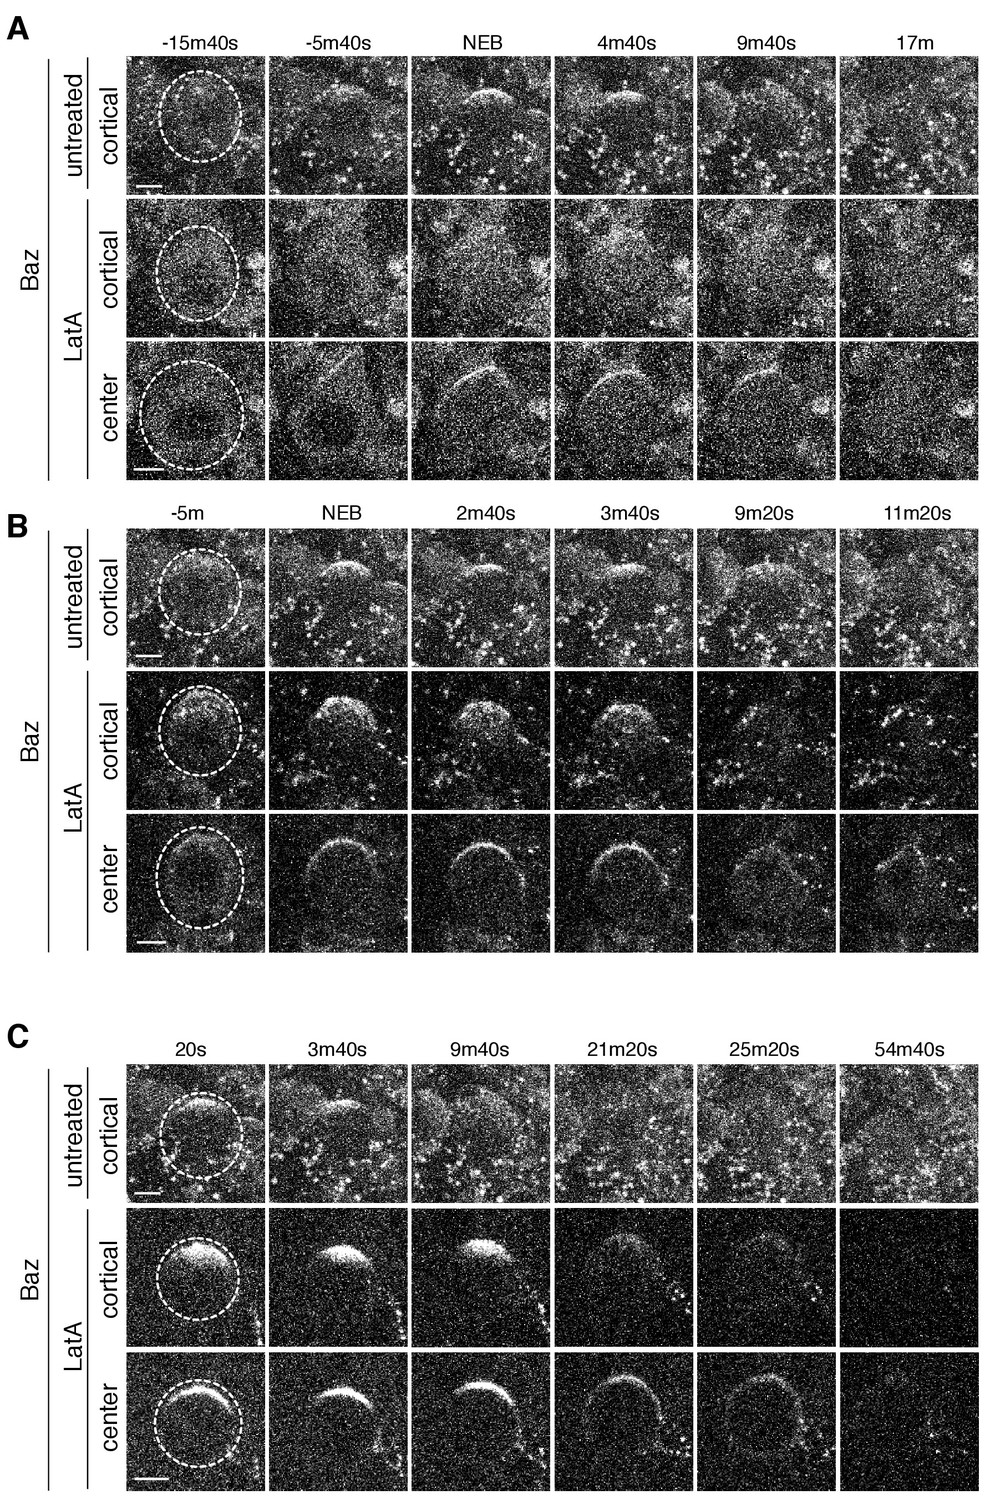
Baz cortical dynamics following disruption of the actin cytoskeleton.
(A) Effect of treating a neuroblast with LatA beginning in interphase (83m20s before NEB) on Baz localization dynamics. Frames from Figure 6—video 1 are shown as 4 µm maximum intensity projections along the cortical edge and center of Baz-GFP taken from Figure 4—video 1. The cortical projections from an untreated neuroblast at equivalent time points are shown for reference in the top row. The neuroblast is highlighted by a dashed circle in the first column. Time is shown relative to nuclear envelope breakdown (NEB). Scale bar 5 µm. (B) Effect of treating a neuroblast with LatA following the initial cortical recruitment events (7m40s prior to NEB) on Baz localization dynamics. Frames from Figure 6—video 2 are shown as in panel A. (C) Effect of treating a neuroblast with LatA following cap coalescence (30 s prior to NEB) on Baz localization dynamics. Frames from Figure 6—video 3 are shown as in panel A.
Figure 6—figure supplement 1
Quantification of Latrunculin A effects on Baz localization dynamics.
(A) Effect of treating an interphase neuroblast with LatA on Baz localization. Normalized apical and basal cortical intensity is shown from Figure 6—video 1. (A’) The frequency of neuroblasts treated with LatA in interphase that exhibit any Baz recruitment to the cortex (‘Recruitment’), growth of foci into patches (‘Patch Growth’), coalescence of patches into an apical cap (‘Coalescence’), and cap disassembly, are shown. Frequency is relative to wild type neuroblasts. (B) Effect of treating a neuroblast with LatA following the initial cortical recruitment events on normalized apical and basal cortical Baz intensity (from Figure 6—video 2). (B’) The frequency of neuroblasts treated with LatA following the initial cortical recruitment events that exhibit Baz cortical dynamics, as in panel A’. (C) Effect of treating a neuroblast with LatA following cap coalescence on normalized apical and basal cortical Baz intensity (from Figure 6—video 3). (C’) The frequency of neuroblasts treated with LatA following cap coalescence that exhibit Baz cortical dynamics, as in panel A’ (‘Recruitment’ and ‘Patch Growth’ phases are not shown because they are completed by metaphase).
Figure 6—video 1
Effect of interphase LatA treatment on Baz localization dynamics.
A neuroblast is shown from a Drosophila larval brain explant treated with LatA 83 min and 20 s before the neuroblast underwent nuclear envelope breakdown. The montage includes maximum intensity projections of Baz-GFP signal through the entire cell (upper left), cortical edge (upper right), and center (lower right). Histone H2A-RFP signal is shown in the bottom left. Time is relative to nuclear envelope breakdown.
Figure 6—video 2
Effect of LatA treatment following cortical recruitment on Baz localization dynamics.
A neuroblast is shown from a Drosophila larval brain explant treated with LatA 7 min and 40 s before the neuroblast underwent nuclear envelope breakdown. The montage includes maximum intensity projections of Baz-GFP signal through the entire cell (upper left), cortical edge (upper right), and center (lower right). Histone H2A-RFP signal is shown in the bottom left. Time is relative to nuclear envelope breakdown.
Figure 6—video 3
Effect of LatA treatment following apical cap coalescence on Baz localization dynamics.
A neuroblast is shown from a Drosophila larval brain explant treated with LatA 30 s before the movie begins. The montage includes maximum intensity projections of Baz-GFP signal through the entire cell (upper left), cortical edge (upper right), and center (lower right). Histone H2A-RFP signal is shown in the bottom left. Time is relative to nuclear envelope breakdown.
Figure 7
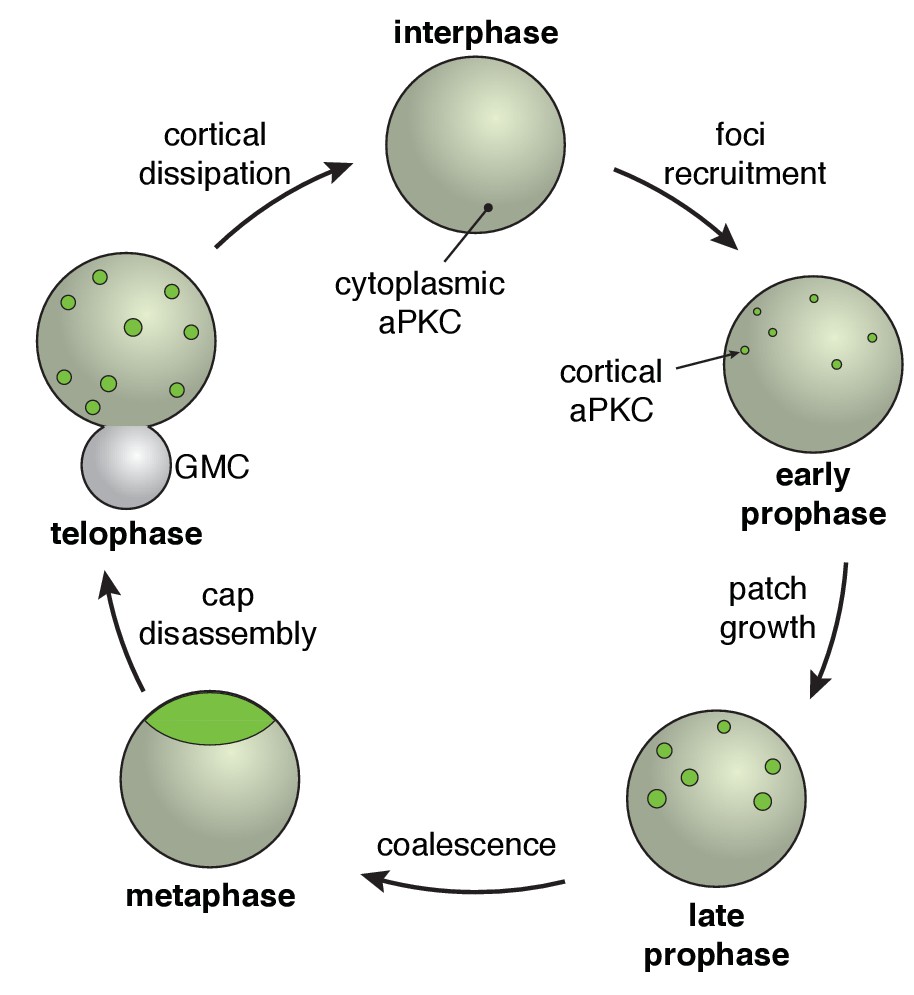
The neuroblast polarity cycle.
The cycle begins with discontinuous patches of aPKC forming in the apical hemisphere via recruitment to the cortex from the cytoplasm. The aPKC cap observed in metaphase neuroblasts is formed from coordinated cortical flows that lead to coalescence of the discontinuous patches into a uniform structure tightly localized around the apical pole. During anaphase, the cap is disassembled leading to discontinuous spreading that extends to the cleavage furrow, followed by cortical dissipation back into the cytoplasm.
Tables
Key resources table
| Reagent type (species) or resource | Designation | Source or reference | Identifiers | Additional information |
|---|---|---|---|---|
| Genetic reagent (Drosophila melanogaster) | aPKC-GFP | François Schweisguth Lab; Besson et al., 2015 | BAC encoded aPKC-GFP | |
| Genetic reagent (D. melanogaster) | Baz-GFP | Carnegie Protein Trap Library; Buszczak et al., 2007 | protein trap line | |
| Genetic reagent (D. melanogaster) | H2A-RFP | Bloomington Drosophila Stock Center | BDSC:23650; FLYB:FBst0023650; RRID:BDSC_23650 | FlyBase symbol: w[*]; P{w[+mC]=His2A-mRFP1}III.1 |
| Antibody | anti-aPKC (rabbit polyclonal) | Santa Cruz Biotechnology | Santa Cruz: C-20 (SC-216); RRID:AB_2300359 | (1:1000) |
| Antibody | anti-Baz (guinea pig polyclonal) | Chris Doe lab; Siller et al., 2006 | (1:1000) | |
| Antibody | anti-phospho Histone H3 (rabbit polyclonal) | Millipore | Millipore:06–570; RRID:AB_310177 | (1:2000) |
| antibody | Alexa 405- or 647- secondaries | Jackson ImmunoResearch Laboratories | (1:500) | |
| antibody | Alexa 488- secondary | Invitrogen, ThermoFisher Scientific | (1:500) |
Additional files
-
Transparent reporting form
- https://doi.org/10.7554/eLife.45815.022
Download links
A two-part list of links to download the article, or parts of the article, in various formats.
Downloads (link to download the article as PDF)
Open citations (links to open the citations from this article in various online reference manager services)
Cite this article (links to download the citations from this article in formats compatible with various reference manager tools)
Asymmetric recruitment and actin-dependent cortical flows drive the neuroblast polarity cycle
eLife 8:e45815.
https://doi.org/10.7554/eLife.45815


