Rapid and iterative genome editing in the malaria parasite Plasmodium knowlesi provides new tools for P. vivax research
- London School of Hygiene & Tropical Medicine, United Kingdom
- University of Oxford, United Kingdom
- National Institute for Biological Standards and Control, Health Protection Agency, United Kingdom
Figures
Figure 1 with 1 supplement

CRISPR-Cas9 genome editing in P.knowlesi.
(A) Schematic of CRISPR-Cas9 strategy. Integration of the eGFP expression cassette into the target p230p locus via homologous recombination. Arrows indicating oligo positions for diagnostic PCRs. (B) Parasites transfected with pCas9/sg_p230p and pDonor_p230p plasmids were analysed with diagnostic PCRs on consecutive days after transfection. PCR reactions detecting the wild type locus (ol49 +ol50), integration locus (ol01 +ol50) and a control PCR targeting an unrelated locus (ol75 +ol76) using approximately 3 ng/μl genomic DNA. For each day, three transfections are shown. (C) Representative live microscopy image of eGFP positive schizont transfected with pCas9/sg_p230p and pDonor_p230p plasmids. Scale bar represents 5 μm. (D) Proportion of eGFP positive parasites (%) counted after transfection with pCas9/sg_p230p and pDonor_p230p plasmids to show transfection efficiency on day one and integration efficiency after culture reached 0.5% parasitemia (day 12) (n = 3). Error bars denote ±1 SD. (E) Graph shows change in parasitemia (%) over time for parasite lines transfected with the dual plasmid Cas9 targeting vectors (pCas9/sg_p230p and pDonor_p230p), controls without an sgRNA (pCas9/sg), without homology repair template DNA (pCas9/sg_p230p) or with no DNA. A fifth control reaction shows outgrowth of an episomal control plasmid (pkconGFPep) (n = 3). Parasites were placed under drug selection on day 1. Error bars denote ±1 SD (F) Parasites transfected with pCas9/sg_p230p and pDonor_p230p plasmids were cloned by limiting dilution and four clones analysed by diagnostic PCR.
-
Figure 1—source data 1
Source data for graphs.
- https://doi.org/10.7554/eLife.45829.004
Figure 1—figure supplement 1
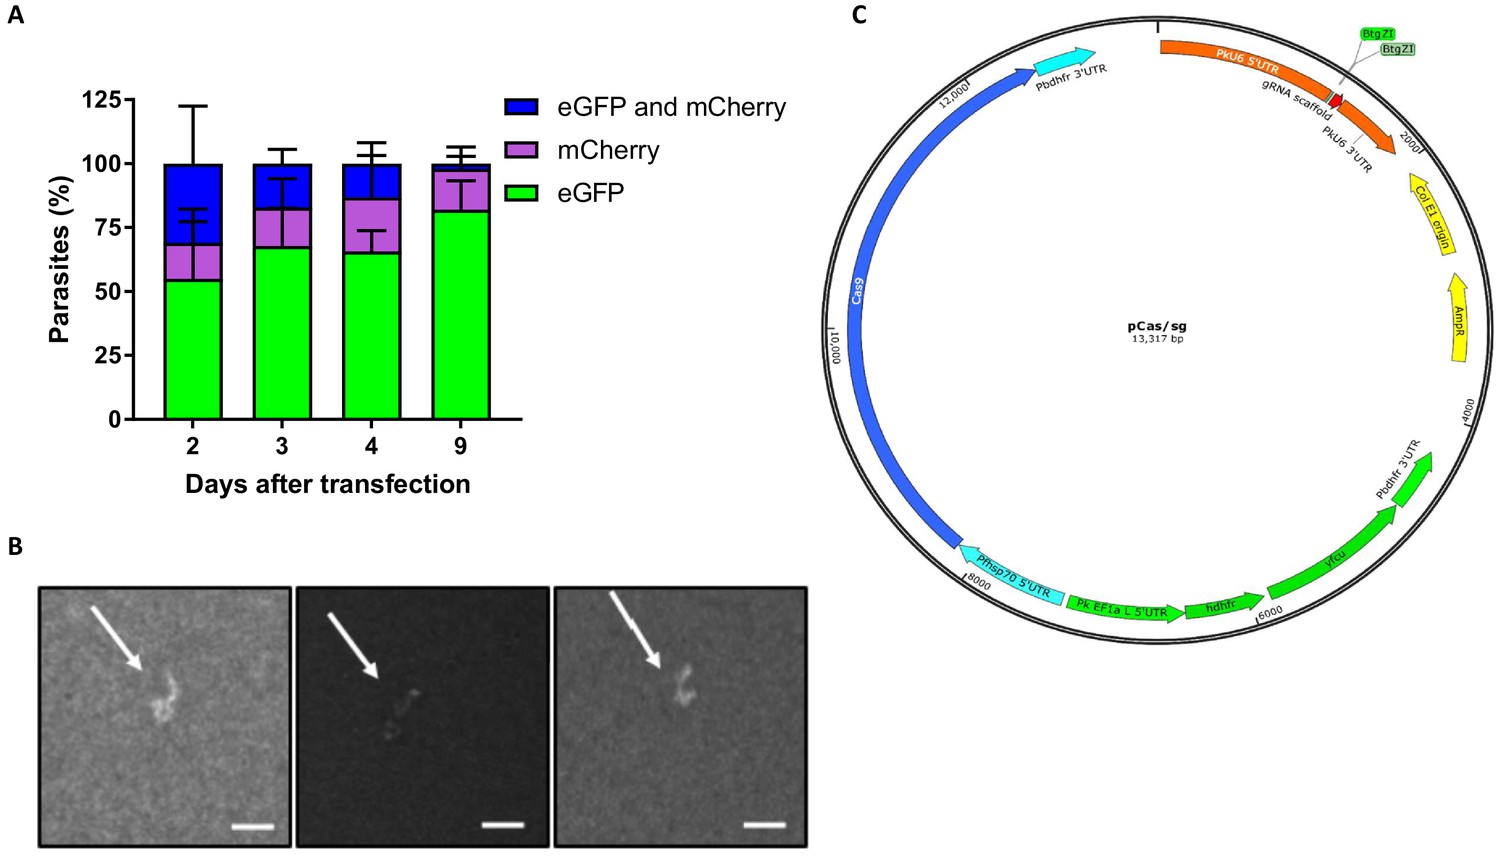
P.knowlesi dual plasmid uptake and plasmid map of pCas9/sg.
(A) P. knowlesi parasites were co-transfected with 20 μg of plasmid containing an eGFP expression cassette (pkconGFP) and 20 μg of plasmid containing an mCherry expression cassette (pkconmCherry) and the proportion of parasites expressing each fluorescent protein monitored on consecutive days after transfection. Graph shows mean proportion of parasites expressing eGFP, mCherry or both across three biological independent experiments. Error bars denote ±1 SD. (B) P. knowlesi parasites modified using CRISPR Cas9 were cloned by limiting dilution in 96 well plates. Infected wells were identified by scanning for parasite ‘plaques’ 10 days after initiating cloning plates. Images show three representative images of parasite plaques visualised using 4X objective of an inverted microscope. Scale bars indicate 200 μm. (C) Plasmid map of pCas9/sg indicates location and size of the expression cassettes of Cas9, sgRNA and hdhfr-yfcu.
Figure 2 with 1 supplement
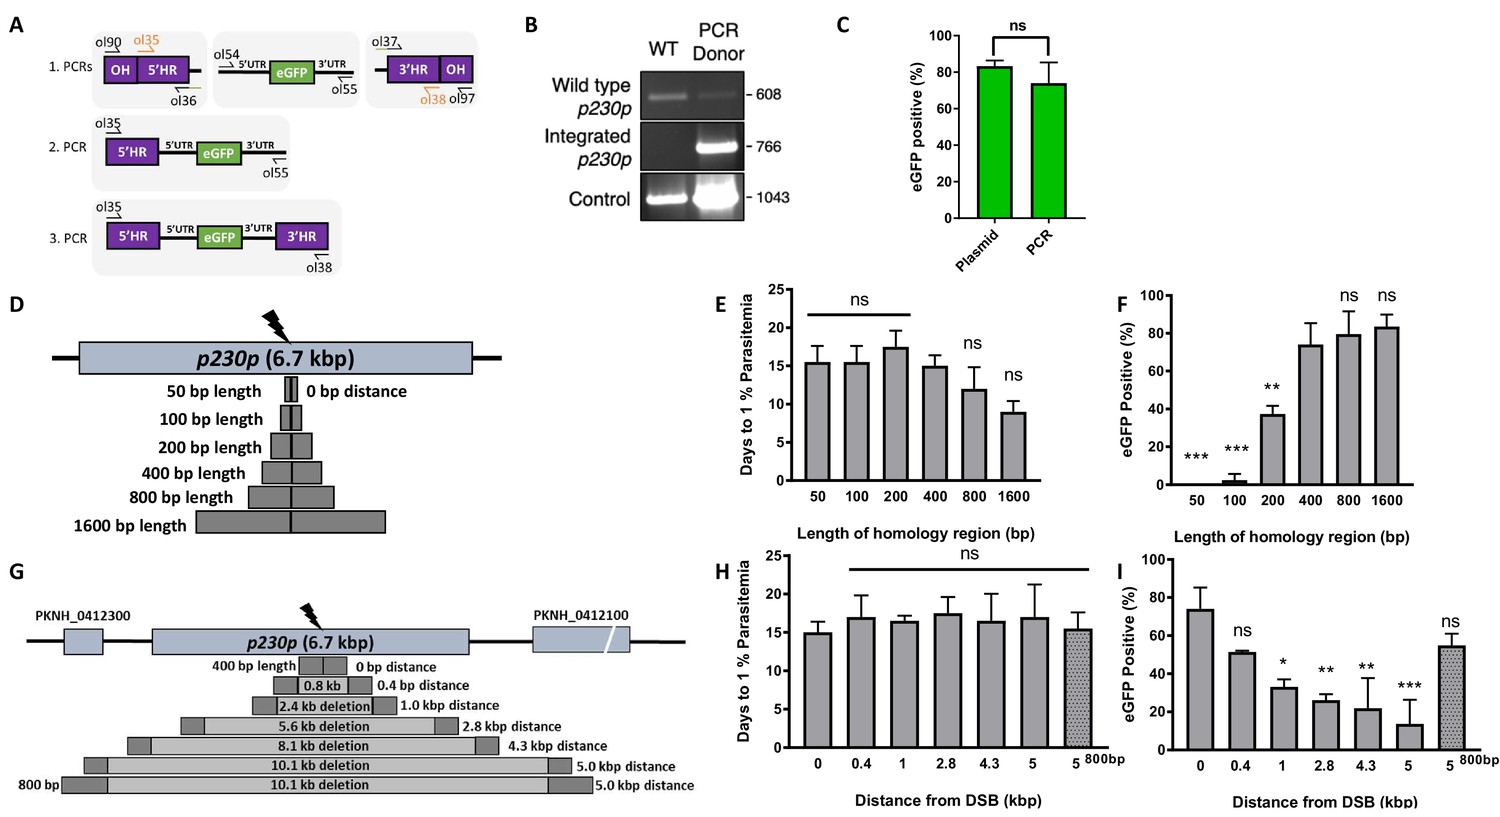
Fusion PCR based approach enables cloning-free production of homology repair templates and evaluation of key parameters for efficient homology-driven repair.
(A) Schematic of the nested PCR method to generate linear donor constructs for transfection. First, homology regions (HRs), with eGFP adaptors in primers ol36 and ol37 and eGFP cassette were amplified by PCR with small overhangs (OH) and gel extracted. In a second nested step 5’HR and eGFP cassette were fused and again in the third step the 5’HR-eGFP product was fused with 3’HR. (B) Parasites transfected with pCas9/sg_p230p and PCR repair template (PCR donor), comprised of an eGFP cassette and 400 bp HRs, were analysed with diagnostic PCRs amplifying the wild type p230p locus (ol49 +ol50), integration locus (ol01 +ol50) and a control targeting an unrelated locus (ol75 +ol76). (C) After selection for integration, the proportion of eGFP positive parasites (%) was determined by fluorescent microscopy and compared between Cas9 transfections made with 400 bp HR plasmid (pDonor_p230p) or 400 bp HR PCR donor DNA. Data points represent the mean and error bars indicate ±1 SD of two biological independent experiments (n = 2). (D) The p230p locus was targeted using PCR donor DNA constructs using HRs with 50–1600 bp length. The bar chart shows, for each of the constructs with HRs of 50 to 1600 bp length, (E) the number of days for transfections to reach 1% parasitemia and (F) proportion of eGFP positive parasites (%) after selection. All transfections were carried out in two biological independent experiments (n = 2). (G) The p230p locus was targeted using PCR donor DNA constructs with HRs placed at varying distance from the Cas9 induced double strand break (DSB). For each construct based on distance to the DSB, the bar chart shows, (H) the number of days for transfections to reach 1% parasitemia and (I) proportion of eGFP positive parasites (%) after selection. Data points represent the mean and error bars denote ±1 SD of two biological independent experiments (n = 2). Results were all compared to the 400 bp HR construct at 0 kb from DSB as the control using a one-way ANOVA with Dunnett’s multiple comparison of means. ns p>0.05, *<0.05, **<0.01, ***<0.001.
-
Figure 2—source data 1
Source data for graphs.
- https://doi.org/10.7554/eLife.45829.007
-
Figure 2—source data 2
Primer pairs for p230p repair template generation and diagnostic PCRs.
- https://doi.org/10.7554/eLife.45829.008
Figure 2—figure supplement 1

Schematic and genotypic analysis of fusion PCR repair template integration into p230p locus.
(A) Schematic of CRISPR-Cas9 strategy. Integration of the eGFP expression cassette into the target p230p locus via homologous recombination using PCR repair template. Arrows indicating oligo positions for diagnostic PCRs. (B–C) Three-step nested PCR products to generate CRISPR-Cas9 repair templates of varying sizes (B) and of distance from the double strand break (DSB) (C). In the first step homology region 1 (HR1) and HR2 are generated individually with eGFP cassette adaptors. Varying band sizes (e.g. for 50 to 400 bp HRs the same 800 bp product was generated) reflect different length of overhangs to allow a subsequent nested PCR step. In the second step HR1 and eGFP cassette are fused followed by the third and final step of fusing HR2 to the previous generated HR1-eGFP product. (D) Parasites transfected with pCas9/sg_p230p and PCR repair templates with HRs ranging from 50 to 1600 bp were analysed with diagnostic PCRs. PCRs of two transfections are shown. PCR reactions detecting the wild type locus, integration locus and a control PCR targeting an unrelated locus (ol75 +ol76) using approximately 3 ng/µl genomic DNA for each reaction. Forward primers for WT and integration PCRs are positioned approximately 100 bp before the start of the 5’HR. Reverse primers for WT are positioned approximately 100 bp after the end of the 3’HR. Reverse primer for eGFP integration is the same for all integration PCRs (ol809). (E) Parasites transfected with pCas9/sg_p230p and PCR repair templates with HRs of 400 bp or 800 bp of varying distances to the DSB were analysed with diagnostic PCRs. PCRs of two transfections are shown. PCR reactions detecting the wild type locus, integration locus and a control PCR targeting an unrelated locus (ol75 +ol76) using approximately 3 ng/µl genomic DNA. Forward primers for WT and integration PCRs are positioned approximately 100 bp before the start of the 5’HR. Reverse primers for WT are positioned approximately 100 bp after the end of the 3’HR. Reverse primer for eGFP integration is the same for all integration PCRs (ol809). All primer sequences are listed in Figure 5—source data 2.
Figure 3 with 2 supplements
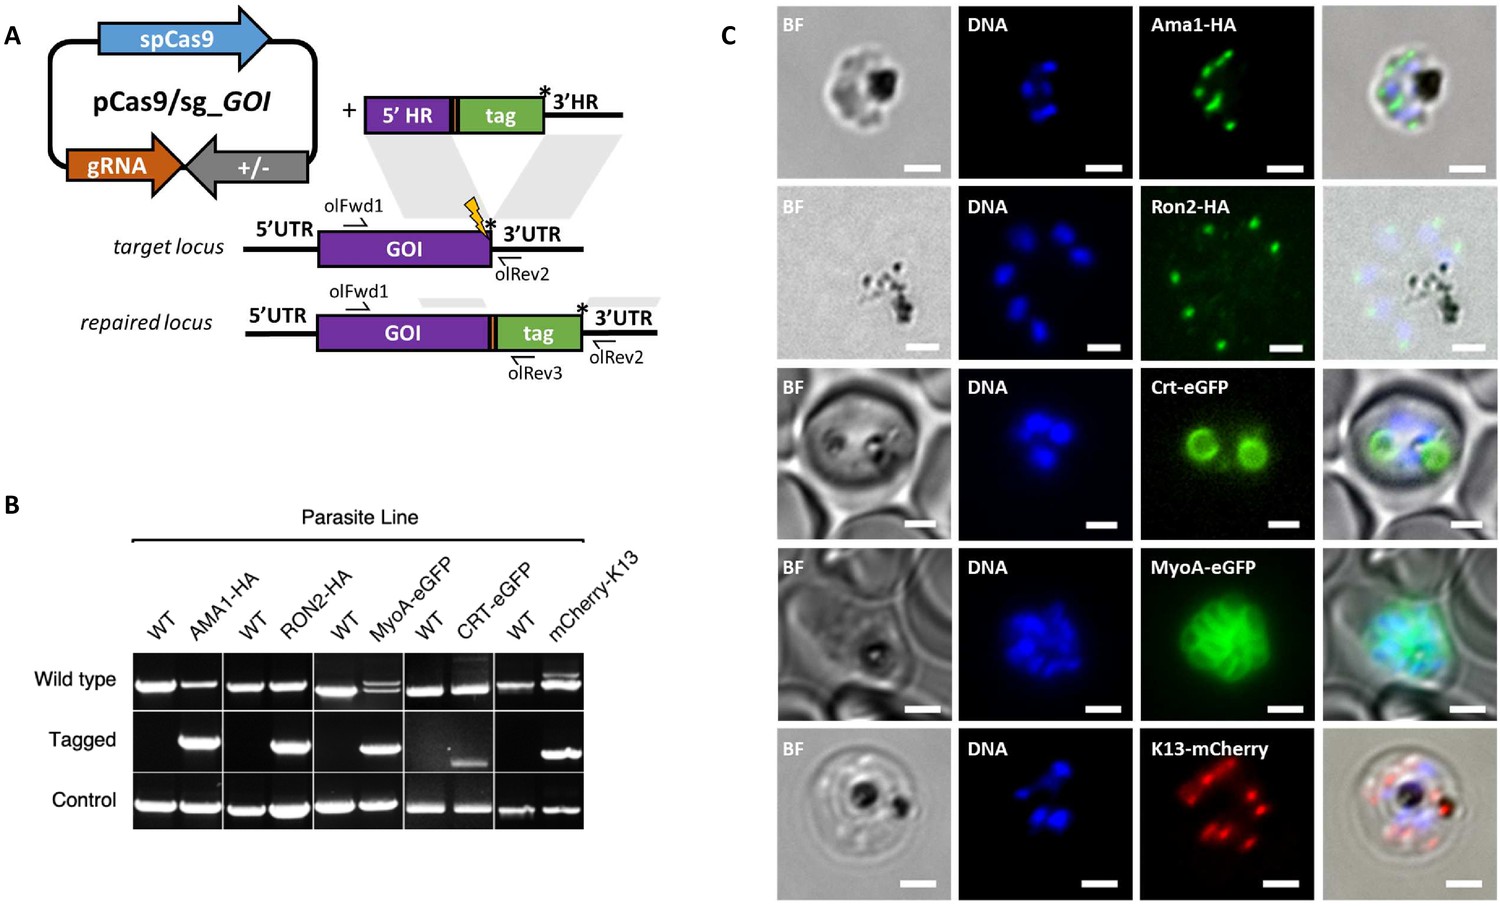
CRISPR Cas9 PCR repair templates enable rapid and flexible tagging of parasite proteins.
(A) Schematic of CRISPR-Cas9 system for C-terminal tagging. pCas9/sg plasmid with gene of interest (GOI) specific sgRNA, is combined with repair template generated by fusion PCR. Lightning bolt indicates Cas9 induced double strand break, which is repaired by insertion of the desired tag. (B) Diagnostic PCRs specific to each GOI locus were carried out to amplify the wild type locus (schematic positions olFwd1 +olRev2), integration locus (schematic positions olFwd1 +olRev3) and a control targeting an unrelated locus (ol75 +ol76). Specific primers used for each GOI is shown in Figure 3—figure supplements 1A–E, 2. As no DNA is removed in this process, the wild type specific locus primers also generate slightly larger amplicons in tagged lines, which can be seen as double bands for both the Myosin A and K13 PCRs. (C) Representative immunofluorescence images of HA-tagged Apical membrane antigen-1 (AMA1-HA) and Rhoptry neck protein 2 (RON2-HA) parasite lines, and live cell imaging of Chloroquine Resistance Transporter-eGFP (CRT-eGFP), Myosin A-eGFP (MyoA-eGFP) and mCherry-Kelch13 (K13). Panel shows brightfield (BF), DNA stain (blue) and anti-tag antibodies/live fluorescence (green or red) of schizont stage parasites from each line. Scale bars represent 2 µm.
-
Figure 3—source data 1
Primer pairs and guide sequences for generation and analysis of tagged parasite lines.
- https://doi.org/10.7554/eLife.45829.012
Figure 3—figure supplement 1

CRISPR-Cas9 tagging of P.knowlesi proteins.
(A) Schematic of CRISPR-Cas9 strategy. C-terminal integration of the hemagglutinin (HA) tag into the target Apical membrane antigen (AMA1) locus via homologous recombination. Arrows indicating oligo positions for diagnostic PCRs. (B) C-terminal integration of HA tag into the target Rhoptry neck protein 2 (RON2 locus). (C) C-terminal integration of eGFP into the target Chloroquine Resistance Transporter (CRT) locus. (D) C-terminal integration of eGFP into the target Myosin A locus. (E) N-terminal integration of mCherry into the target Kelch13 (K13) locus. (F) Western blot showing expression of tagged proteins in P. knowlesi saponin-lysed schizonts separated by SDS-PAGE and immunoblotting with anti-HA, anti-GFP or anti-mCherry primary antibodies. Control samples are saponin-lysed red blood cells (RBC) and wild type parasite line. Expected sizes of bands are indicated. CRT runs faster than its expected band size as shown in P. falciparum previously. All primer pairs to generate PCR repair templates are shown inFigure 3—source data 1 and primer sequences are listed in Figure 5—source data 2.
Figure 3—figure supplement 2
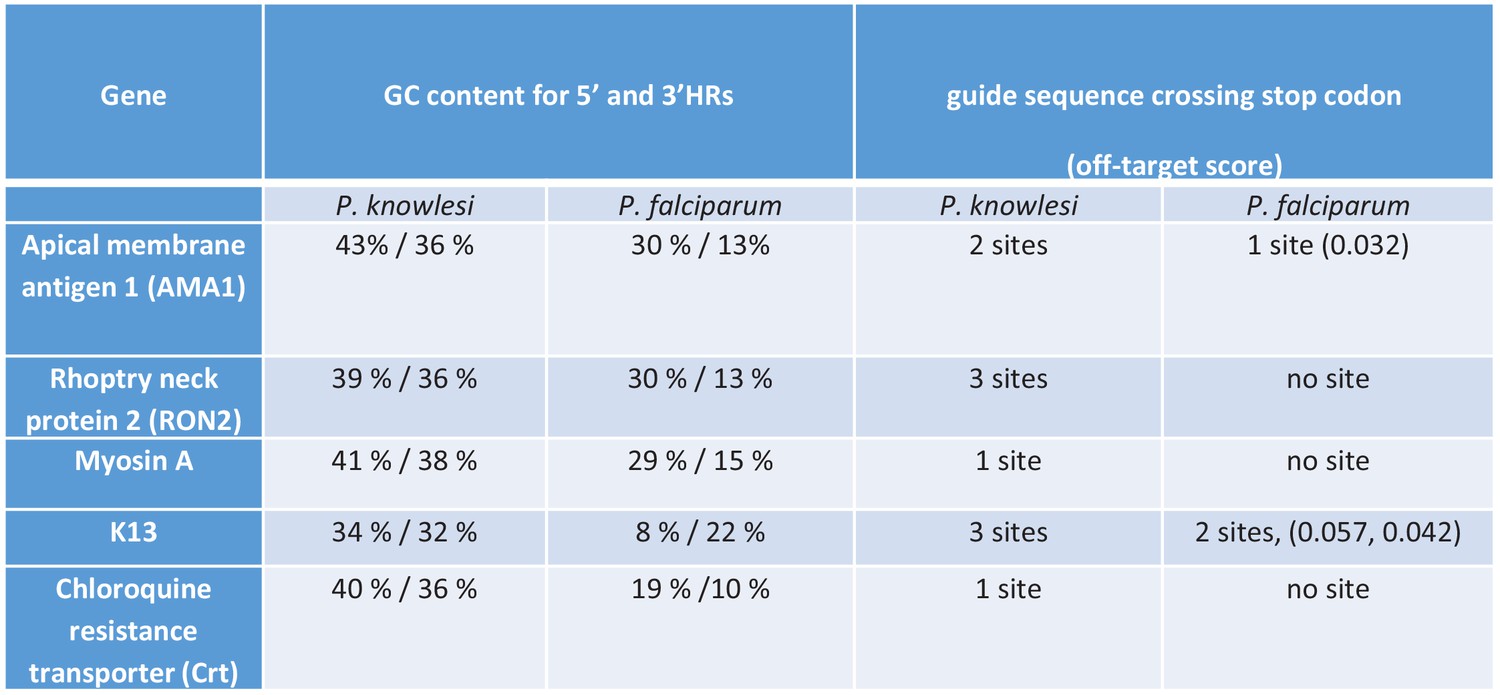
Comparison of P. knowlesi and P. falciparum 3D7 genes.
Table showing comparison of P. knowlesi and P. falciparum guanine-cytosine content and Protospacer adjacent Motif (PAM) sites for five selected genes that were successfully targeted and tagged in P. knowlesi.
Figure 4 with 3 supplements
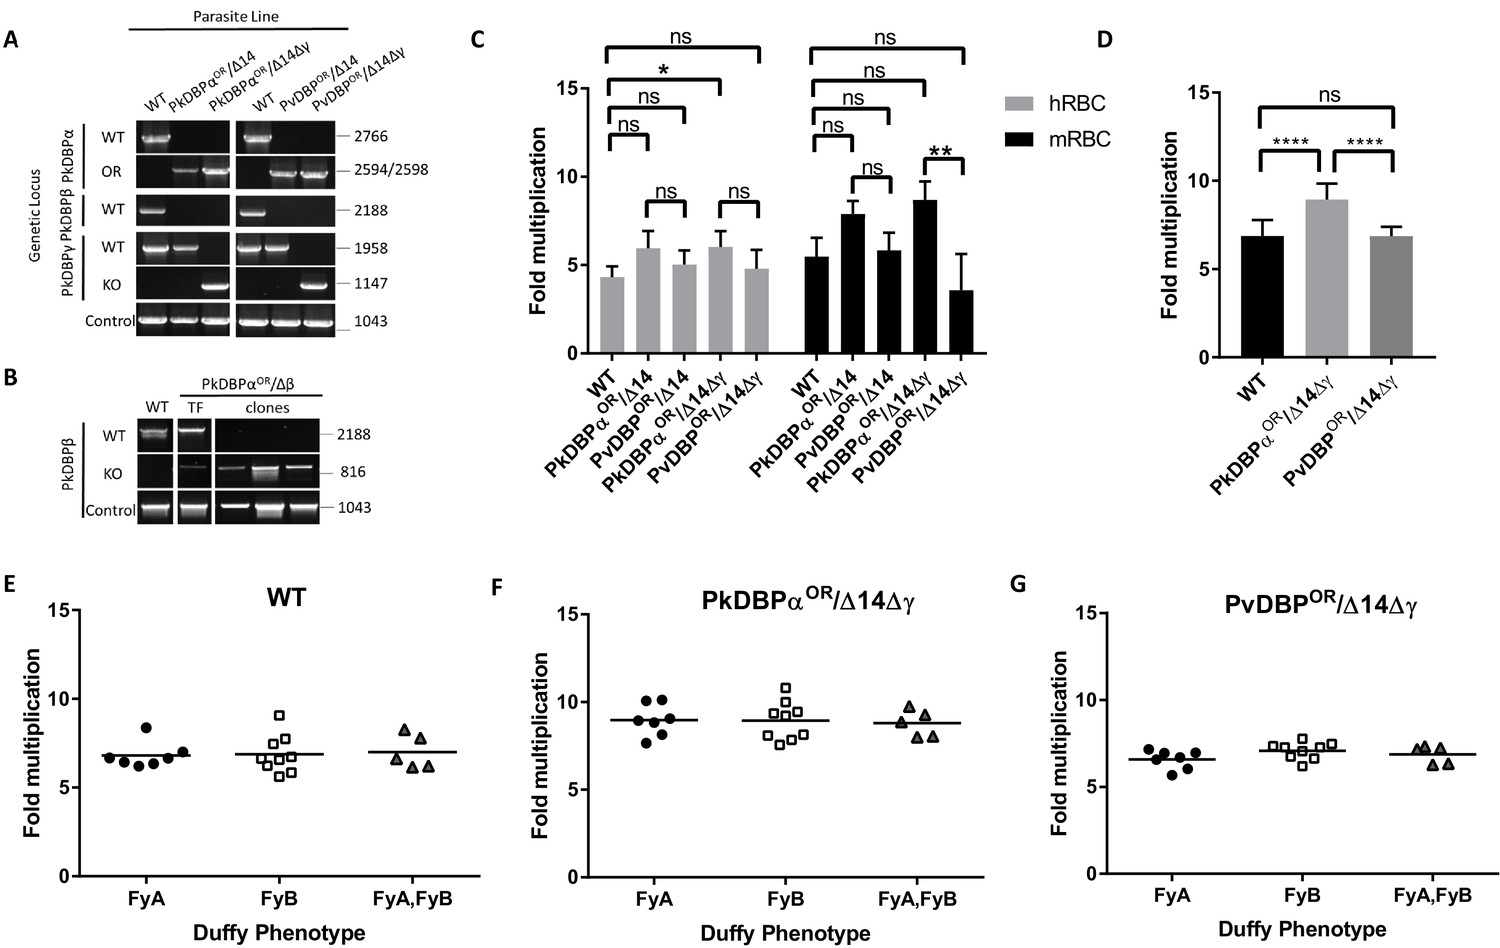
PvDBP expressing P. knowlesi line demonstrates preference for growth in human RBCs but no preference for different Duffy haplotypes.
(A) The P. knowlesi Duffy binding protein α (DBPα) gene was targeted for replacement with either a recodonised PkDBPα or P. vivax DBP repair template. Sequencing revealed a loss of ~44 kb in chromosome 14, including loss of PkDBPβ (PkDBPαOR/Δ14 and PvDBPOR/Δ14). These lines were then subsequently modified to knockout PkDBPγ (PkDBPαOR/Δ14Δγ and PvDBPOR/Δ14Δγ). Parasite lines were analysed using PCR reactions detecting the wild type (WT) locus PkDBPα (ol186 +ol188), orthologue replacement (OR) locus of PkDBPαOR (ol186 +ol189) or PvDBPOR (ol186 +ol187), WT PkDBPβ locus (ol480 +481), WT locus of PkDBPγ (ol483 +ol484), KO locus of PkDBPγ (ol483 +ol258) and a control PCR targeting an unrelated locus (ol75 +ol76). (B) The PkDBPαOR line was modified to knockout PkDBPβ (PkDBPαOR/Δβ). Parasite lines including the transfection line (TF) and three clones were analysed using PCR reactions detecting WT locus of PkDBPβ (ol480 +ol481), KO locus of PkDBPβ (ol284 +ol481) and a control PCR targeting an unrelated locus (ol75 +ol76). (C) Bar chart showing mean fold replication of parasites lines in FACS-based multiplication assays over one growth cycle (24 hr). Assays were carried out in eight biological independent experiments for human blood (hRBC) and three biological independent experiments for Macaca fascicularis blood (mRBC). Data points represent mean growth rates and error bars denote ±1 SD. Replication rates of the parasite lines were compared by using one-way ANOVA with Tukey’s multiple comparisons test of means. There are significant differences in fold multiplication rates of WT against PkDBPαOR/Δ14Δγ in hRBCs (p<0.05) and significant differences in fold multiplication rates of PkDBPαOR/Δ14Δγ against PvDBP OR/Δ14Δγ in mRBCs (p<0.01). (D) Graph showing fold multiplication of WT, PkDBPαOR/Δ14Δγ and PvDBP OR/Δ14Δγ P. knowlesi parasites in RBC over one intraerythrocytic growth cycle (24 hr). Assays were carried out in technical duplicates in Duffy positive RBC from 21 volunteers with three independent schizont purifications. Data points represent the mean multiplication rate and error bars denote ±1 SD, and were compared by using one-way ANOVA with Tukey’s multiple comparisons test of means. There are significant differences in fold multiplication rates of WT against PkDBPαOR/Δ14Δγ (p<0.001) and PkDBPαOR/Δ14Δγ against PvDBPOR/Δ14Δγ (p<0.001). (E) Graph showing fold multiplication of WT (F) PkDBPαOR/Δ14Δγ and (G) PvDBP OR/Δ14Δγ P. knowlesi parasites in RBC from 21 volunteer blood donors over one intraerythrocytic growth cycle (24 hr). Mean average of fold multiplication rates are plotted against Duffy phenotype [Fya, Fyb, and Fy(a+b+)]. Black bars indicate mean multiplication rate in each blood type. Data points represent the mean and error bars denote ±1 SD of three biological independent experiments (n = 3); Figure 4—source data 1. .ns p>0.05, *<0.05, **<0.01, ***<0.001.
-
Figure 4—source data 1
Source data for graphs.
- https://doi.org/10.7554/eLife.45829.018
-
Figure 4—source data 2
Primer pairs and vector design for DBP constructs.
- https://doi.org/10.7554/eLife.45829.019
Figure 4—figure supplement 1
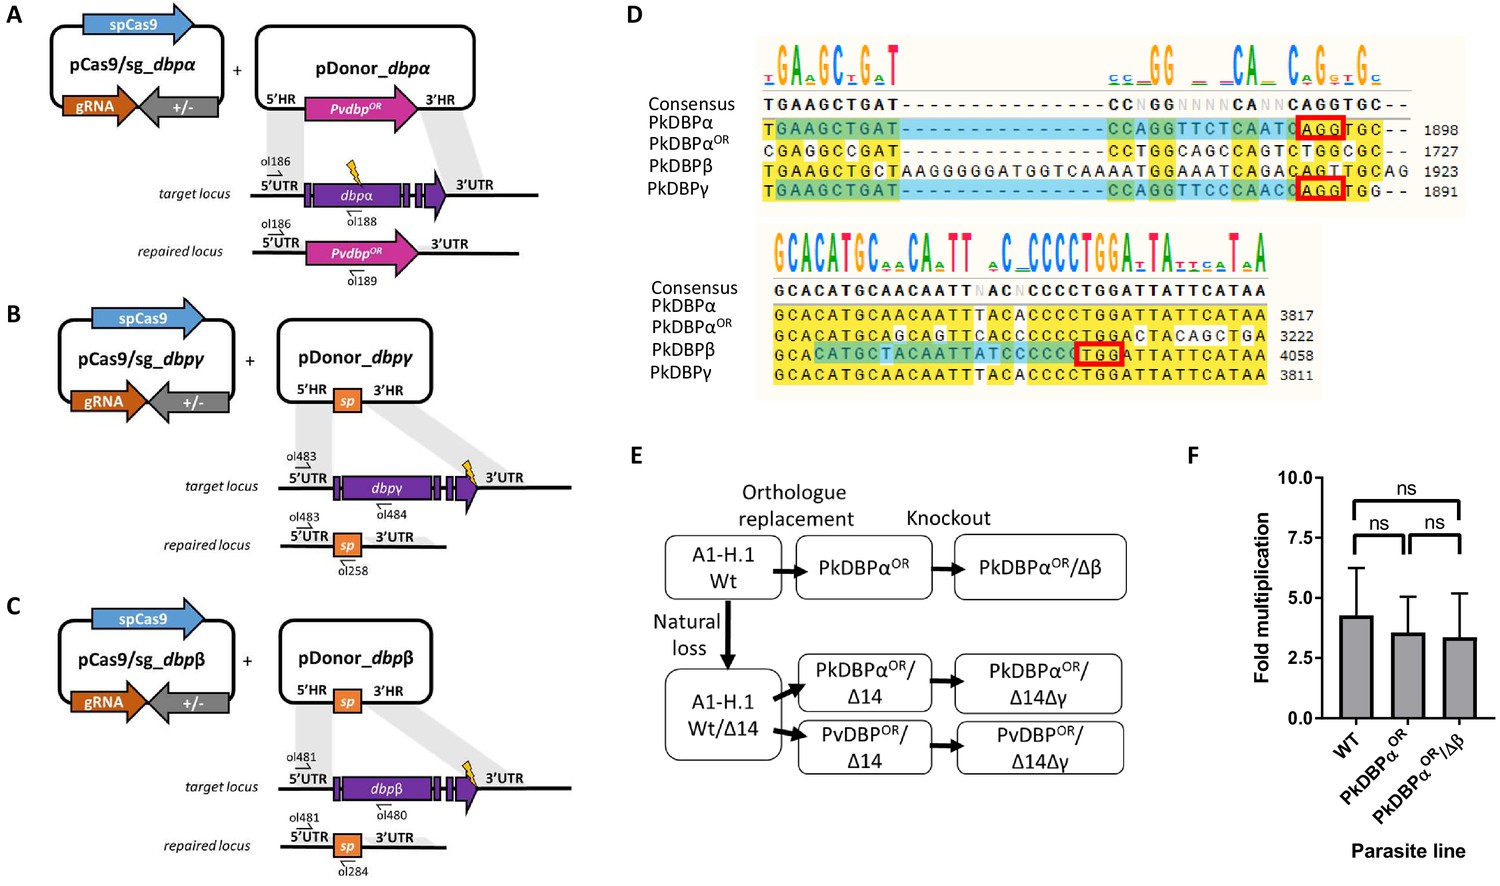
Transgenic P. knowlesi DBP orthologue replacement, knockout design and genotypic analysis.
(A) Schematic of CRISPR-Cas9 strategy. Integration of the PvDBP into the target PkDBPα locus via homologous recombination. Arrows indicating oligo positions for diagnostic PCRs. (B) Schematic showing deletion of the target PkDBPγ locus and replacement with a spacer sequence. (C) Schematic showing deletion of the target PkDBPβ locus and replacement with a spacer sequence. All primer sequences are shown in Figure 5—source data 2. (D) Nucleotide sequence alignment of PkDBPα, PkDBPαOR, PkDBPβ and PkDBPγ guide sequences. The chosen guide sequences for transfections are highlighted in blue. PAM sites are highlighted in a red square. (E) Flow chart indicating generated transgenic DBP parasite lines. Wild type parasites that naturally lost 44 kb at one end of chromosome 14 (WTΔ14) were first edited by orthologous replacement of PkDBPα with the recodonised gene (PkDBPαOR) or P. vivax DBP (PvDBPOR) and clonal lines established by limiting dilution cloning. Both clonal parasite lines were edited by knockout of PkDBPγ (PkDBPαOR/Δ14Δγ and PvDBPOR/Δ14Δγ), which were cloned before use in invasion assays and assays of GIA. WT parasites without loss of 44 kb at the end of chromosome 14 were edited by knockout of PkDBPβ (PkDBPαOR/Δβ) (F) Bar chart showing mean fold replication of parasites lines in a FACS-based invasion assays over one growth cycle (24 hr). Assays were carried out in three biological independent experiments in human blood. Error bars denote ±1 SD. Data points represent the mean single cycle growth rate. Replication rates of the parasites lines were compared by using unpaired one-way ANOVA with Tukey’s multiple comparisons test of means. There are no significant differences in fold multiplication rates ns: p>0.05 (Figure 4—figure supplement 1—source data 1).
-
Figure 4—figure supplement 1—source data 1
Source data for graphs.
- https://doi.org/10.7554/eLife.45829.015
Figure 4—figure supplement 2
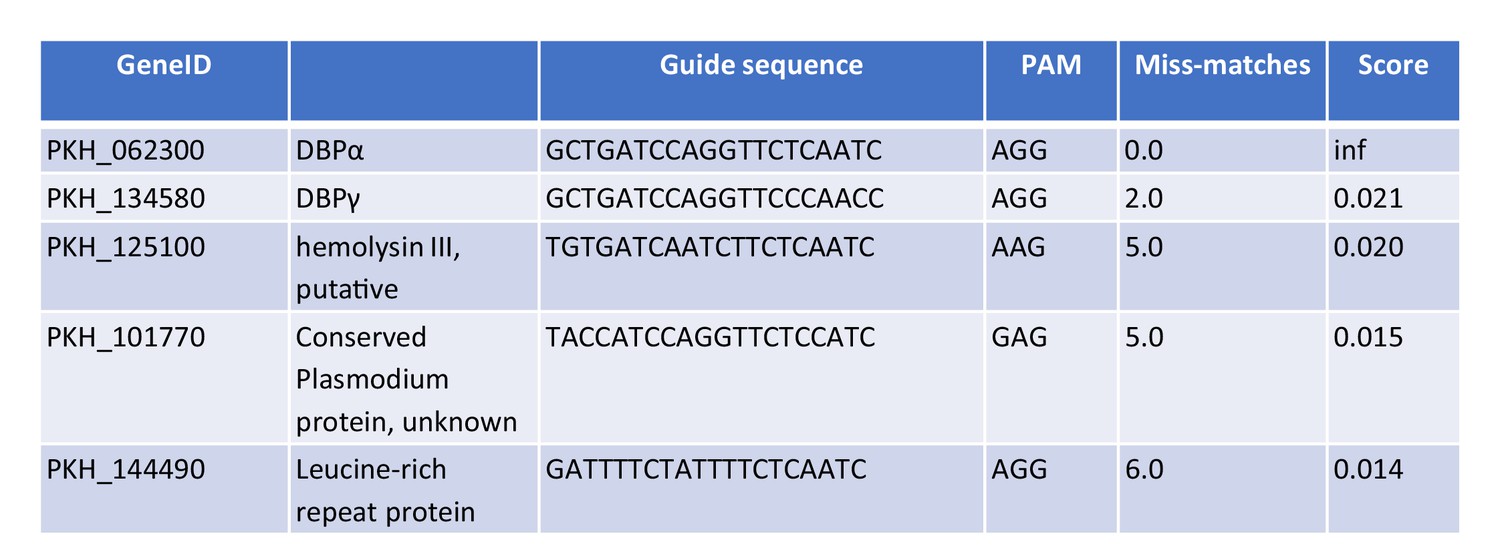
Off-target guide sequences for PkDBPα sgRNA.
Table showing the five genes with highest off-target scores for the guide sequence targeting PkDBPα sgRNA. All five genes were PCR amplified and sequenced.
Figure 4—figure supplement 3
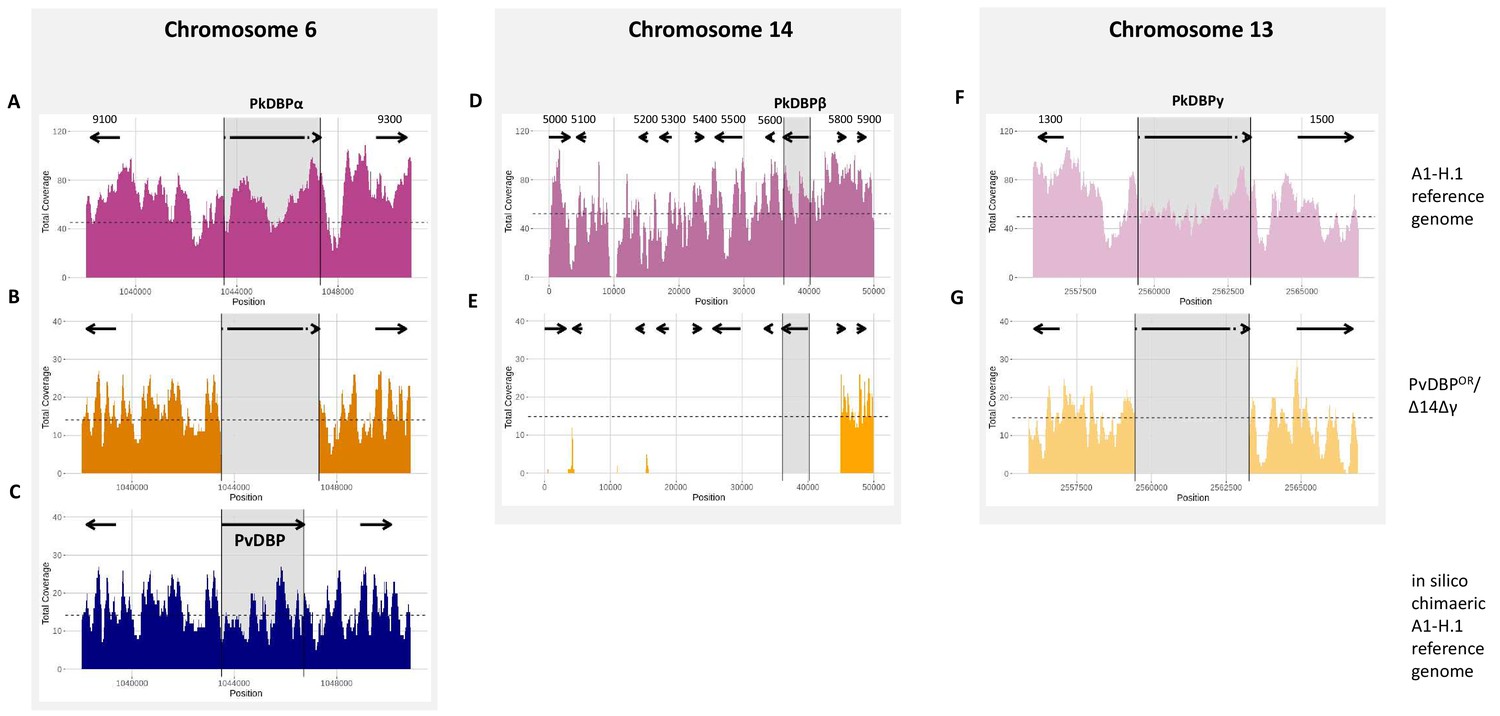
Sequencing of PvDBPOR/Δ14Δγ parasite line.
Mapping of Illumina reads of PvDBPOR/Δ14Δγ (orange) against P. knowlesi strain A1-H.1 wild type chromosomes of the reference genome (magenta) (Benavente et al., 2018). (A) PkDBPα locus on end of chromosome 6 of the A1-H.1 reference genome with flanking genes PKA1H_060029100 and PKA1H_060029300. (B) PvDBPOR/Δ14Δγ sequence mapped to A1-H.1 shows deletion of PkDBPα. (C) PvDBPOR/Δ14Δγ sequence mapped to a chimaeric A1-H.1 reference genome, generated in silico by replacing PkDBPα with PvDBP (blue), confirms successful orthologue replacement (D) PkDBPβ locus of the A1-H.1 reference genome with flanking genes on start of chromosome 14 with flanking genes from PKA1H_140005000 to PKA1H_140005900, (E) PvDBPOR/Δ14Δγ sequence mapped to A1-H.1 reveals a chromosome truncation of 44,921 bp, including loss of PkDBPβ and seven other genes. (F) PkDBPγ locus on end of chromosome 13 of the A1-H.1 reference genome with flanking genes PKA1H_130061300 and PKA1H_130061500. (G) PvDBPOR/Δ14Δγ sequence mapped to A1-H.1 shows deletion of DBPγ. Gene locations are indicated by arrows and last four digits of accession numbers are shown in the top panel above the arrows.
Figure 5
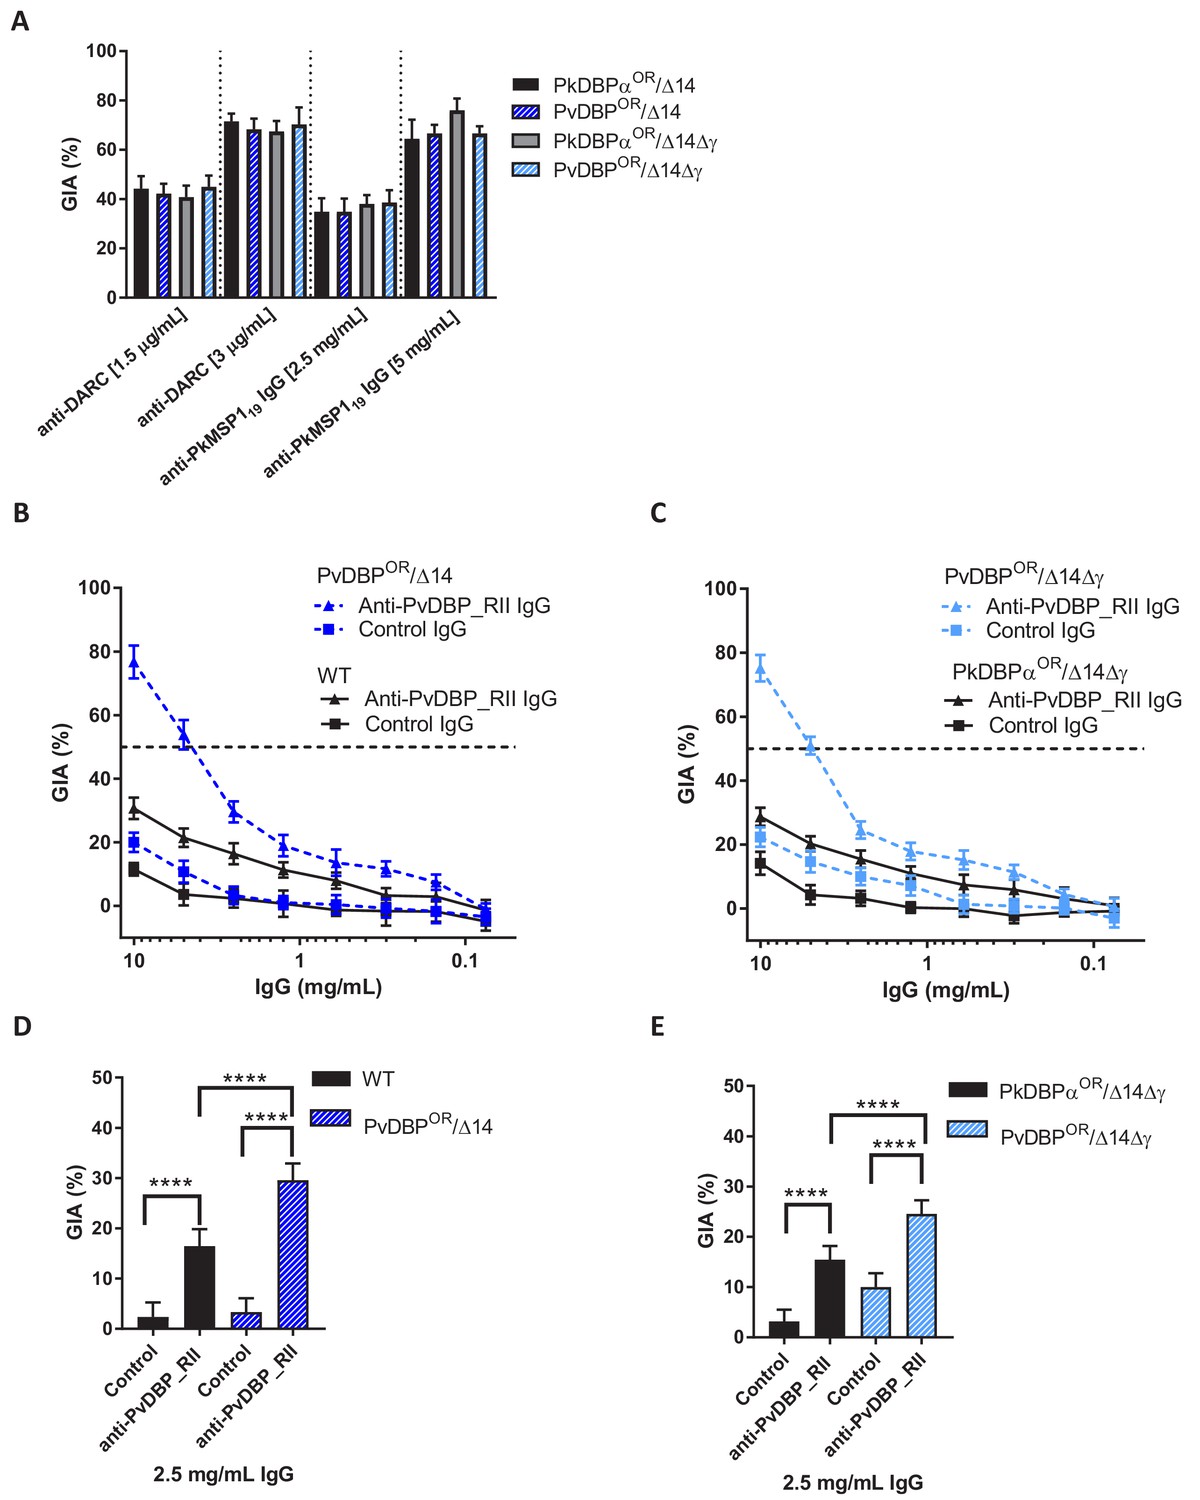
Transgenic P. knowlesi orthologue replacement lines provide surrogates for P. vivax vaccine development.
(A) Graph showing growth inhibition activity (GIA, %) of anti-DARC nanobody at 1.5 and 3 μg/ml and anti-MSP119 purified total rabbit IgG at 2.5 and 5 mg/ml on the parasite lines. Data points represent the mean and error bars denote ±1 SD of triplicate test wells (n = 3). GIAs of each antibody were compared across the parasite lines by using unpaired one-way ANOVA with Tukey’s multiple comparisons test of means. No significant changes were observed. (B) Graph shows the % GIA of a dilution series of IgG purified from sera of PvDBP_RII (SalI)-immunized rabbits as well as control IgG from the pre-immunisation sera of the same rabbits against wild type (WT) and PvDBPOR/Δ14 transgenic P. knowlesi lines and (C) against PkDBPαOR/Δ14Δγ and PvDBPOR/Δ14Δγ lines. Data points represent the mean and error bars denote ±1 SD of five or six replicates. (D) Bar chart showing % GIA of 2.5 mg/ml IgG purified from sera of PvDBPRII (SalI)-immunized rabbits as well as control IgG from the pre-immunisation sera of the same rabbits against wild type (WT) and PvDBPOR/Δ14 transgenic P. knowlesi lines and (E) against PkDBPαOR/Δ14Δγ and PvDBPOR/Δ14Δγ lines. Bars represent the mean and error bars denote ±1 SD of five or six replicates and were compared by using one-way ANOVA with Tukey’s multiple comparisons test of means. ns p>0.05, *<0.05, **<0.01, ***<0.001.
-
Figure 5—source data 1
Source data for graphs.
- https://doi.org/10.7554/eLife.45829.021
-
Figure 5—source data 2
Full primer list for entire study.
- https://doi.org/10.7554/eLife.45829.022
Tables
Key resources table
| Reagent type (species) or resource | Designation | Source or reference | Identifiers | Additional information |
|---|---|---|---|---|
| Cell line (Plasmodium knowlesi) | A1-H.1 wild type (WT) | (Moon et al., 2013), Mike Blackman, Francis Crick Institute London | ||
| Cell line (Plasmodium knowlesi) | p230p eGFP cassette | this paper | Can be obtained from Rob Moon, LSHTM | |
| Cell line (Plasmodium knowlesi) | AMA1-HA | this paper | Can be obtained from Rob Moon, LSHTM | |
| Cell line (Plasmodium knowlesi) | RON2-HA | this paper | Can be obtained from Rob Moon, LSHTM | |
| Cell line (Plasmodium knowlesi) | Myosin A-eGFP | this paper | Can be obtained from Rob Moon, LSHTM | |
| Cell line (Plasmodium knowlesi) | CRT-eGFP | this paper | Can be obtained from Rob Moon, LSHTM | |
| Cell line (Plasmodium knowlesi) | mCherry-K13 | this paper | Can be obtained from Rob Moon, LSHTM | |
| Cell line (Plasmodium knowlesi) | PkDBPαOR/Δ14 | this paper | Can be obtained from Rob Moon, LSHTM | |
| Cell line (Plasmodium knowlesi) | PvDBPOR/Δ14 | this paper | Can be obtained from Rob Moon, LSHTM | |
| Cell line (Plasmodium knowlesi) | PkDBPαOR/Δ14Δγ | this paper | Can be obtained from Rob Moon, LSHTM | |
| Cell line (Plasmodium knowlesi) | PvDBPOR/Δ14Δγ | this paper | Can be obtained from Rob Moon, LSHTM | |
| Cell line (Plasmodium knowlesi) | PkDBPαOR | this paper | Can be obtained from Rob Moon, LSHTM | |
| Cell line (Plasmodium knowlesi) | PkDBPαOR/Δβ | this paper | Can be obtained from Rob Moon, LSHTM | |
| Transfected construct (plasmid) | pCas9/sg_p230p | this paper | Can be obtained from Rob Moon, LSHTM | |
| Transfected construct (plasmid) | pCas9/sg_PkDBPα | this paper | Can be obtained from Rob Moon, LSHTM | |
| Transfected construct (plasmid) | pCas9/sg_DBPβ | this paper | Can be obtained from Rob Moon, LSHTM | |
| Transfected construct (plasmid) | pCas9/sg_DBPγ | this paper | Can be obtained from Rob Moon, LSHTM | |
| Transfected construct (plasmid) | pCas9/sg_AMA1 | this paper | Can be obtained from Rob Moon, LSHTM | |
| Transfected construct (plasmid) | pCas9/sg_RON2 | this paper | Can be obtained from Rob Moon, LSHTM | |
| Transfected construct (plasmid) | pCas9/sg_Myosin A | this paper | Can be obtained from Rob Moon, LSHTM | |
| Transfected construct (plasmid) | pCas9/sg_K13 | this paper | Can be obtained from Rob Moon, LSHTM | |
| Transfected construct (plasmid) | pCas9/sg_CRT | this paper | Can be obtained from Rob Moon, LSHTM | |
| Transfected construct (plasmid) | pDonor_p230p | this paper | Can be obtained from Rob Moon, LSHTM | |
| Transfected construct (plasmid) | pDonor_PkDBPαOR | this paper | Can be obtained from Rob Moon, LSHTM | |
| Transfected construct (plasmid) | pDonor_PvDBPOR | this paper | Can be obtained from Rob Moon, LSHTM | |
| Transfected construct (plasmid) | pDonor_PkDBPβ | this paper | Can be obtained from Rob Moon, LSHTM | |
| Transfected construct (plasmid) | pDonor_PkDBPγ | this paper | Can be obtained from Rob Moon, LSHTM | |
| Antibody | αPkMSP119 (rabbit polyclonal) | Ellen Knuepfer, Francis Crick Institute London | 2.5 and 5 mg/ml | |
| Antibody | anti-DARC nanobody CA111 (camel) | Olivier Bertrand, INSERM, France (Smolarek et al., 2010) | 1.5 and 3 μg/ml | |
| Antibody | PvDBP_RII (rabbit polyclonal) | Simon Draper, Jenner Institute Oxford, (de Cassan et al., 2015) | ||
| Antibody | Alexa Fluor(TM) 594 Goat Anti-Rabbit IgG (H + L) highly cross-adsorbed (goat polyclonal) | Invitrogen | Cat. #: A-11037 | dilution 1:5000 |
| Antibody | anti-HA high affinity (3F10), 50 UG (rat monoclonal) | Sigma | Cat. #: 11867423001 | dilution 1:5000 |
| Antibody | anti-mCherry (rabbit polyclonal) | Abcam | Cat. #: ab183628 | dilution 1:5000 |
| Antibody | anti-GFP (mouse monoclonal) | Sigma | Cat. #: 11814460001 | dilution 1:5000 |
| Antibody | mouse HRP-conjugated secondary antibody (goat) | Bio-Rad | Cat. #: 1706516 | dilution 1:5000 |
| Antibody | Duoclone Monoclonal | Lorne | Cat. #: 740010 | |
| Antibody | Anti-Human IgG (clear) | Lorne | Cat. #: 401010 | |
| Antibody | Anti-FyB Monoclonal | Lorne | Cat. #: 317002 | |
| Antibody | Anti-FyA Monoclonal | Lorne | Cat. #: 774002 | |
| Antibody | Anti-B Monoclonal | Lorne | Cat. #: 610010 | |
| Antibody | Anti-A Monoclonal | Lorne | Cat. #: 600010 | |
| Chemical compound, drug | 4-[7-[(dimethylamino) methyl]−2-(4-fluorphenyl) imidazo[1,2-a]pyridin-3 -yl]pyrimidin-2-amine (compound 2) | Michael Blackman, Francis Crick Institute London | ||
| Software, algorithm | Protospacer software | http://www.protospacer.com/ | ||
| Software, algorithm | GraphPad Prism | GraphPad Prism (http://graphpad.com) | RRID:SCR_015807 | Version 7 |
| Software, algorithm | Nikon Elements Advanced Research software package | https://www.microscope.healthcare.nikon.com/products/software/nis-elements | ||
| Software, algorithm | Benchling Software | https://www.benchling.com/ | RRID:SCR_013955 | |
| Software, algorithm | FACSDiva 6.1.3 software | http://www.bdbiosciences.com/ca/instruments/clinical/software/flow-cytometry-acquisition/bd-facsdiva-software/bd-facsdiva-software-v-613/p/643629 | RRID:SCR_001456 | |
| Software, algorithm | FlowJo_V10 | https://www.flowjo.com/ | RRID:SCR_008520 | version 10 |
| Software, algorithm | sambamba software | https://github.com/biod/sambamba | ||
| Software, algorithm | R | https://www.r-project.org/ | RRID: SCR_001905 | |
| Commercial assay or kit | QIAseq FX DNA Library Kit | Quiagen | Cat. #: 180473 | |
| Commercial assay or kit | Pierce Protein A IgG Purification Kit | ThermoFisher Scientific | Cat. #: 44667 | |
| Commercial assay or kit | Recombinant Protein G Agarose | ThermoFisher Scientific | Cat. #: 15920010 |
Additional files
-
Transparent reporting form
- https://doi.org/10.7554/eLife.45829.023
Download links
A two-part list of links to download the article, or parts of the article, in various formats.
Downloads (link to download the article as PDF)
Open citations (links to open the citations from this article in various online reference manager services)
Cite this article (links to download the citations from this article in formats compatible with various reference manager tools)
Rapid and iterative genome editing in the malaria parasite Plasmodium knowlesi provides new tools for P. vivax research
eLife 8:e45829.
https://doi.org/10.7554/eLife.45829


