Impaired skeletal muscle mitochondrial pyruvate uptake rewires glucose metabolism to drive whole-body leanness
- University of Iowa, United States
- Washington University, United States
- University of Utah, United States
Figures
Figure 1 with 1 supplement
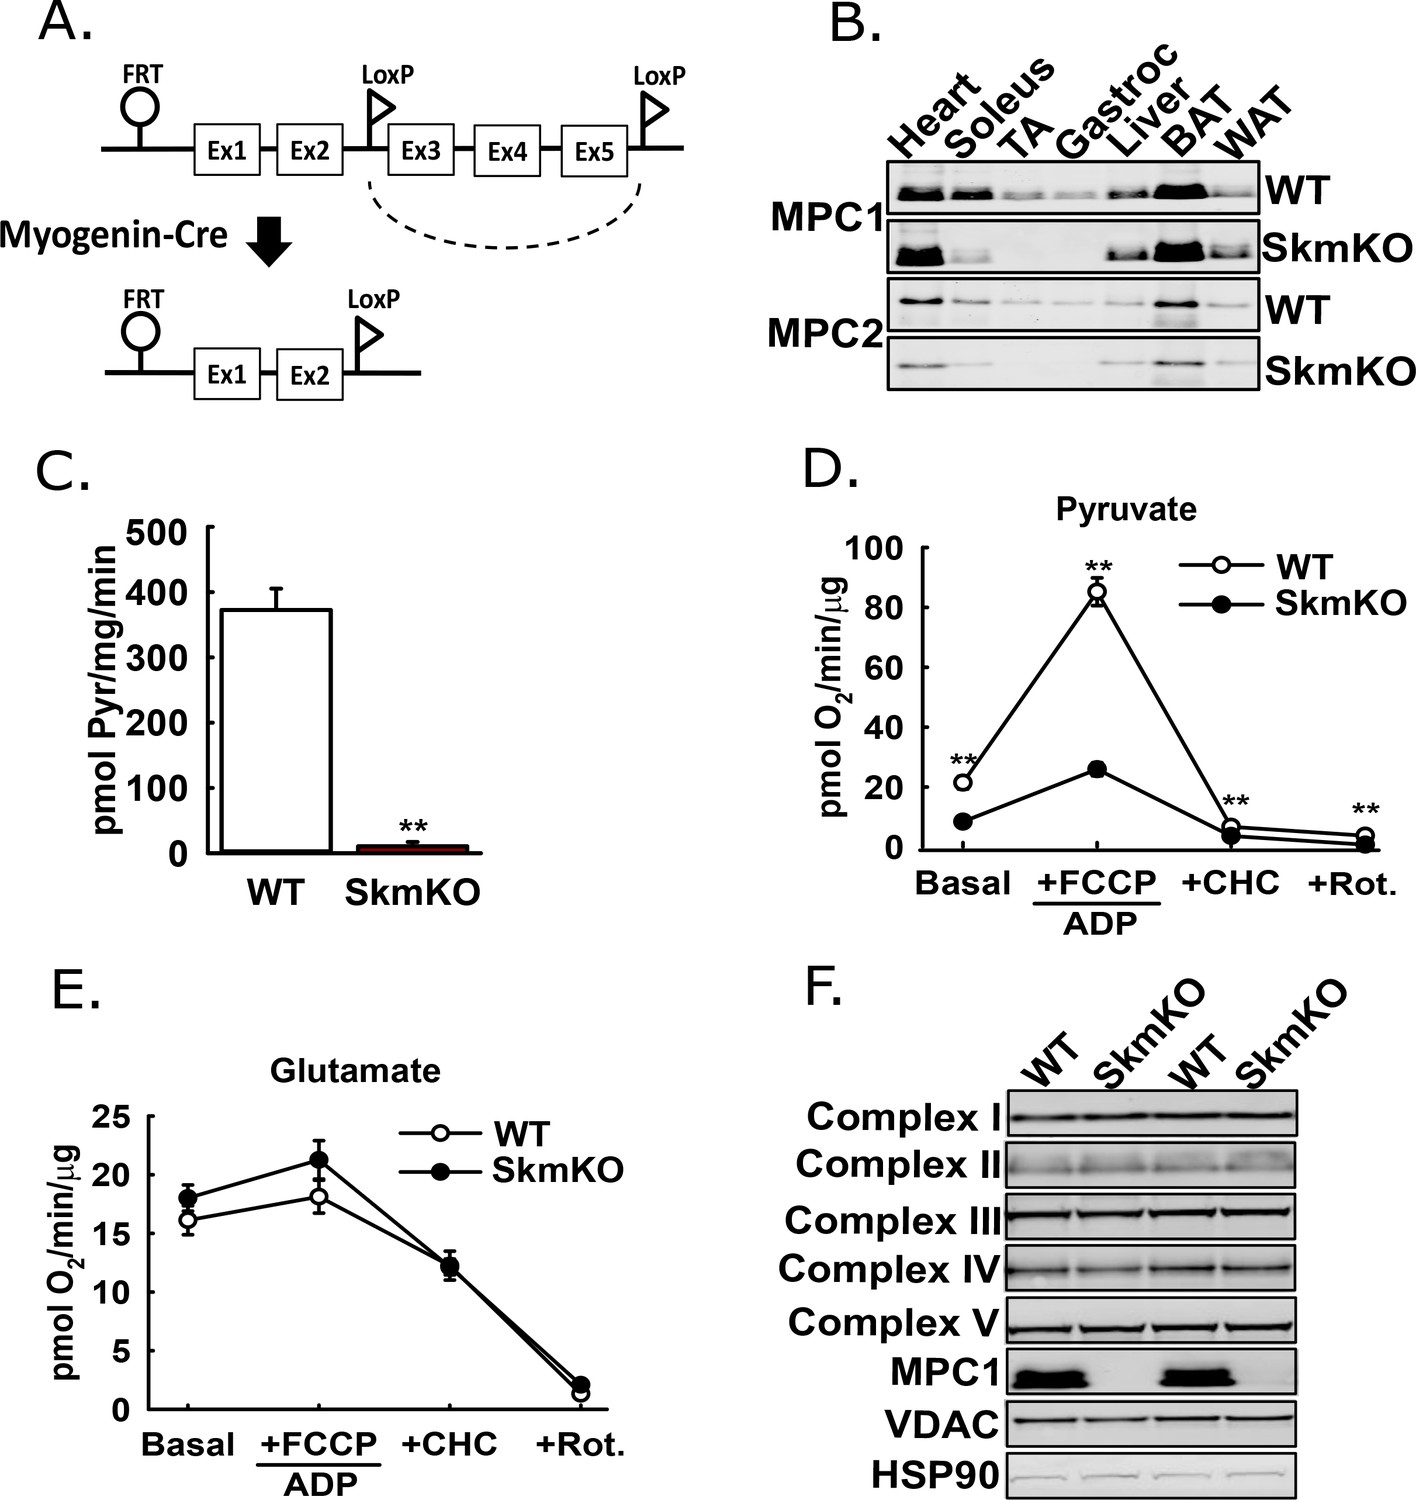
Generation of mice with muscle-specific deletion of Mpc1 (MPC SkmKO).
(A) Scheme illustrating generation of the muscle-specific Mpc1 null allele. (B) Representative western blots of MPC1 and MPC2 protein abundance in mouse tissues. Loading was normalized to total protein. A reference protein is not shown because of lack of an equally expressed protein across different tissues (age 21 weeks; n = 3, littermates; TA, tibialis anterior; BAT, brown adipose tissue; WAT, white adipose tissue). (C) 14C-pyruvate uptake by muscle mitochondria isolated from WT and MPC SkmKO mice (age 13 weeks, n = 6, four littermates + 2 non-littermates, two-tailed t-test). (D, E) Pyruvate- (D) and glutamate-driven (E) respiration by muscle mitochondria isolated from WT and MPC SkmKO mice. Experimental media contained 1 mM malate and 10 mM pyruvate or 10 mM glutamate (age 16 weeks; n = 6, four littermates + 2 non-littermates; two-tailed t-test; FCCP, trifluoromethoxy carbonylcyanide phenylhydrazone; CHC, 4-alpha-hydroxycinnamatic acid; Rot., rotenone). (F) Representative western blots of components of electron transport chain (ETC) complexes I-V, MPC1, VDAC, and HSP90 proteins in TA muscle from WT and MPC SkmKO mice (age 21 weeks, n = 6, littermates). Data presented as mean ± SEM (*p<0.05, **p<0.01).
Figure 1—figure supplement 1
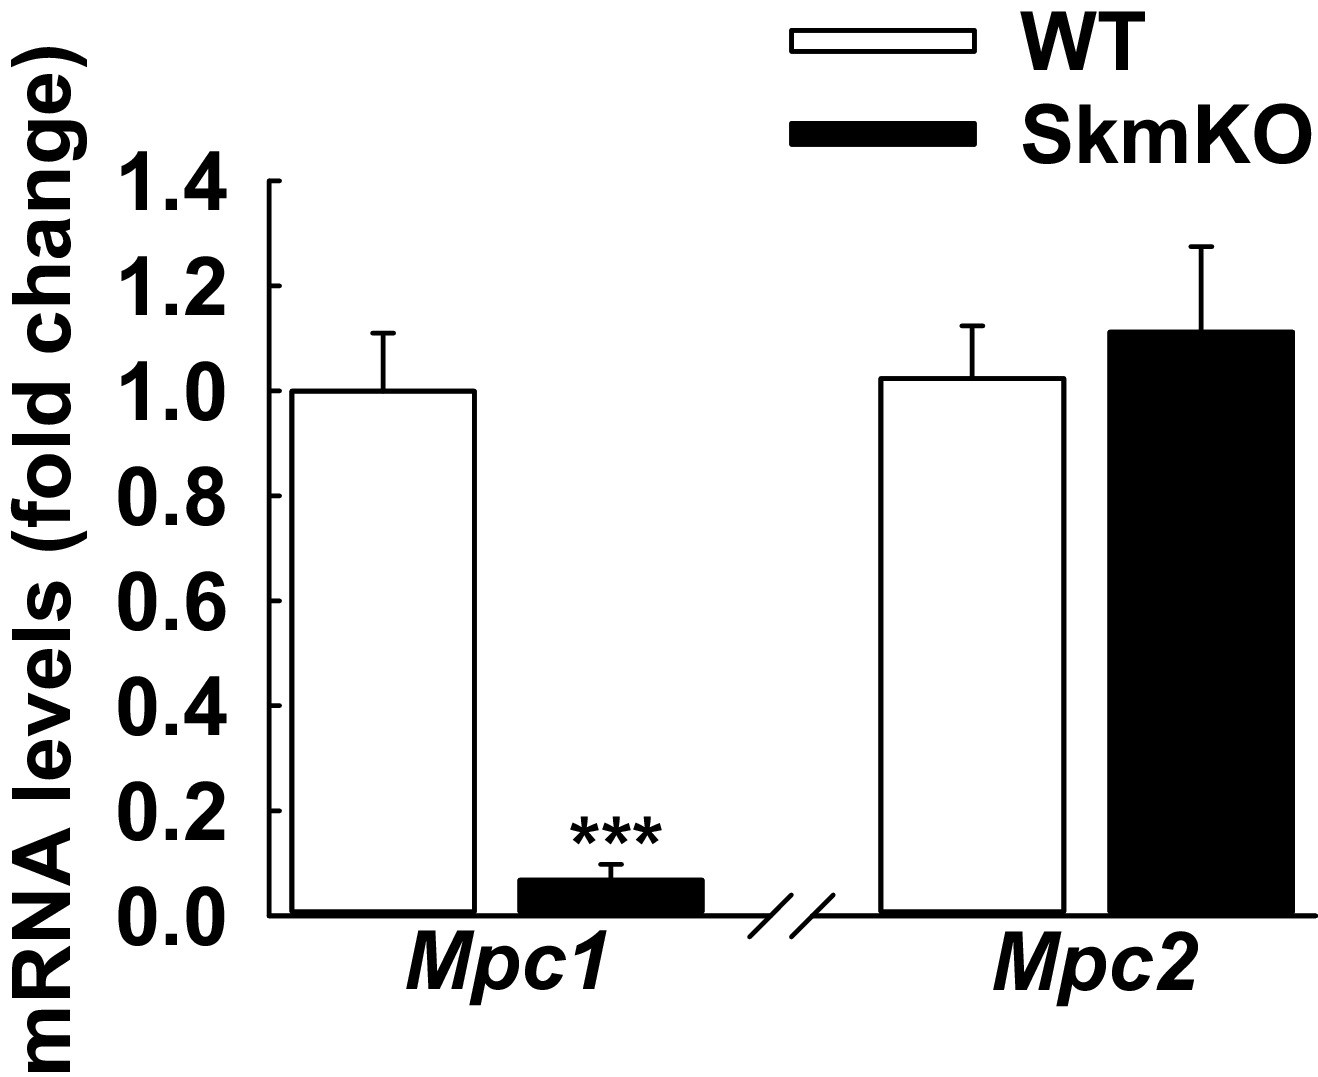
Loss of Mpc1 but not Mpc2 transcript in MPC skmKO skeletal muscle.
Relative Mpc1 and Mpc2 transcript abundance in the TA muscle of WT and MPC SkmKO mice, normalized to U36b4. (n = 5-6 littermates, age = 16 weeks, two tailed t-test). Data are presented as mean +/- SEM (*p<0.05, **p<0.01, ***p<0.001).
Figure 2 with 1 supplement
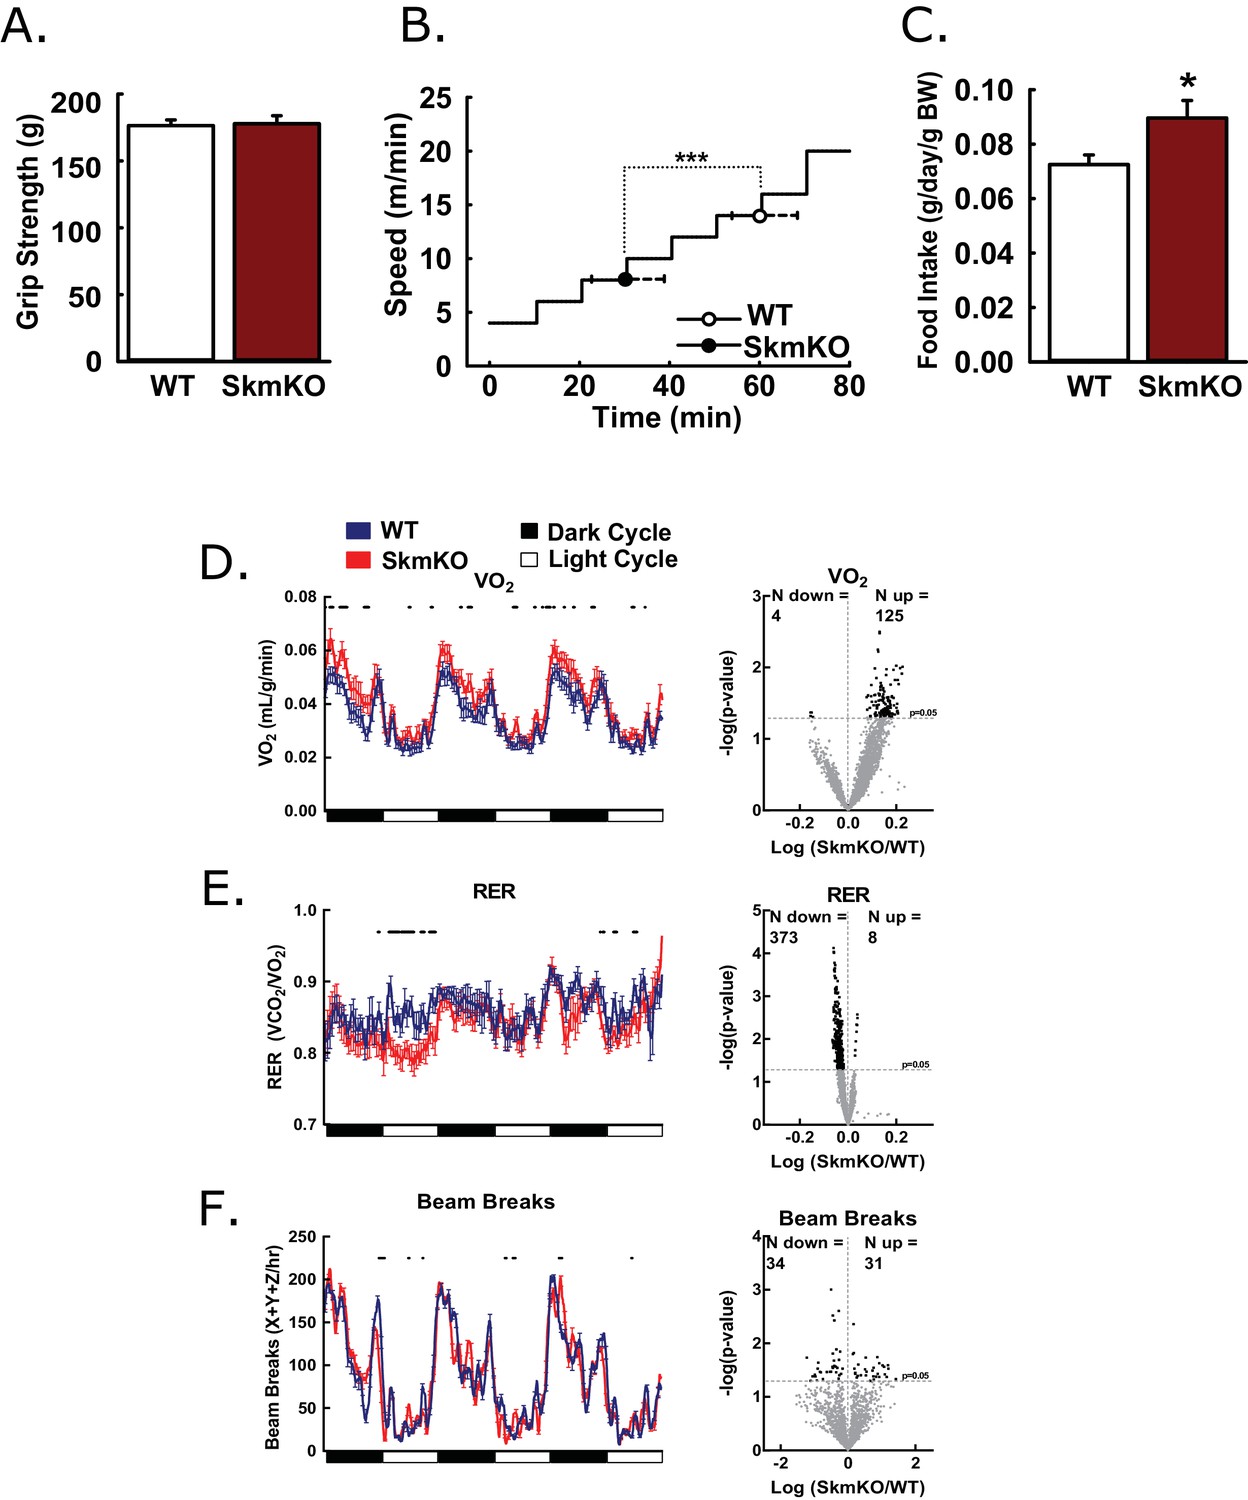
Basic characterization of MPC SkmKO mice.
(A) Grip strength measured by full force on a triangular bar of WT and MPC SkmKO mice (age 15 weeks, n = 8, seven littermates + 1 non-littermate, two-tailed t-test). (B) Exercise tolerance of WT and MPC SkmKO mice measured by running duration and speed at exhaustion on a rodent treadmill where belt velocity was incrementally increased (age 14 weeks, n = 6, littermates, two-tailed t-test). (C) Body weight (BW)-normalized daily food intake of WT and MPC SkmKO mice (age 15 weeks, n = 8, seven littermates + 1 non-littermate, two-tailed t-test). (D - F) Oxygen consumption (VO2) (D), Respiratory exchange ratio (RER) (E), and voluntary locomotion (beam breaks) (F) of WT and MPC SkmKO mice (age 12 weeks, n = 8, littermates, 60 min rolling averages analyzed by two-tailed t-test). Black dots indicate points where significant differences were detected and volcano plots show the distribution of p-values plotted by the direction of change. Data presented as mean ± SEM (*p<0.05 and as indicated on volcano plots).
Figure 2—figure supplement 1

Skeletal muscle specific force production and glycogen content are unchanged in MPC SkmKO mice.
(A) Specific tetanic force generated by the EDL muscle ex vivo of WT and MPC SkmKO mice. (n = 5 littermates, age = 45 weeks, two tailed t-test). (B) Glycogen content in quadriceps muscle of WT and MPC SkmKO mice. (n = 8, 7 littermates one non-littermates, age = 24 weeks, two tailed t-test). Data are presented as mean ± SEM (*p<0.05, **p<0.01, ***p<0.001).
Figure 3 with 2 supplements
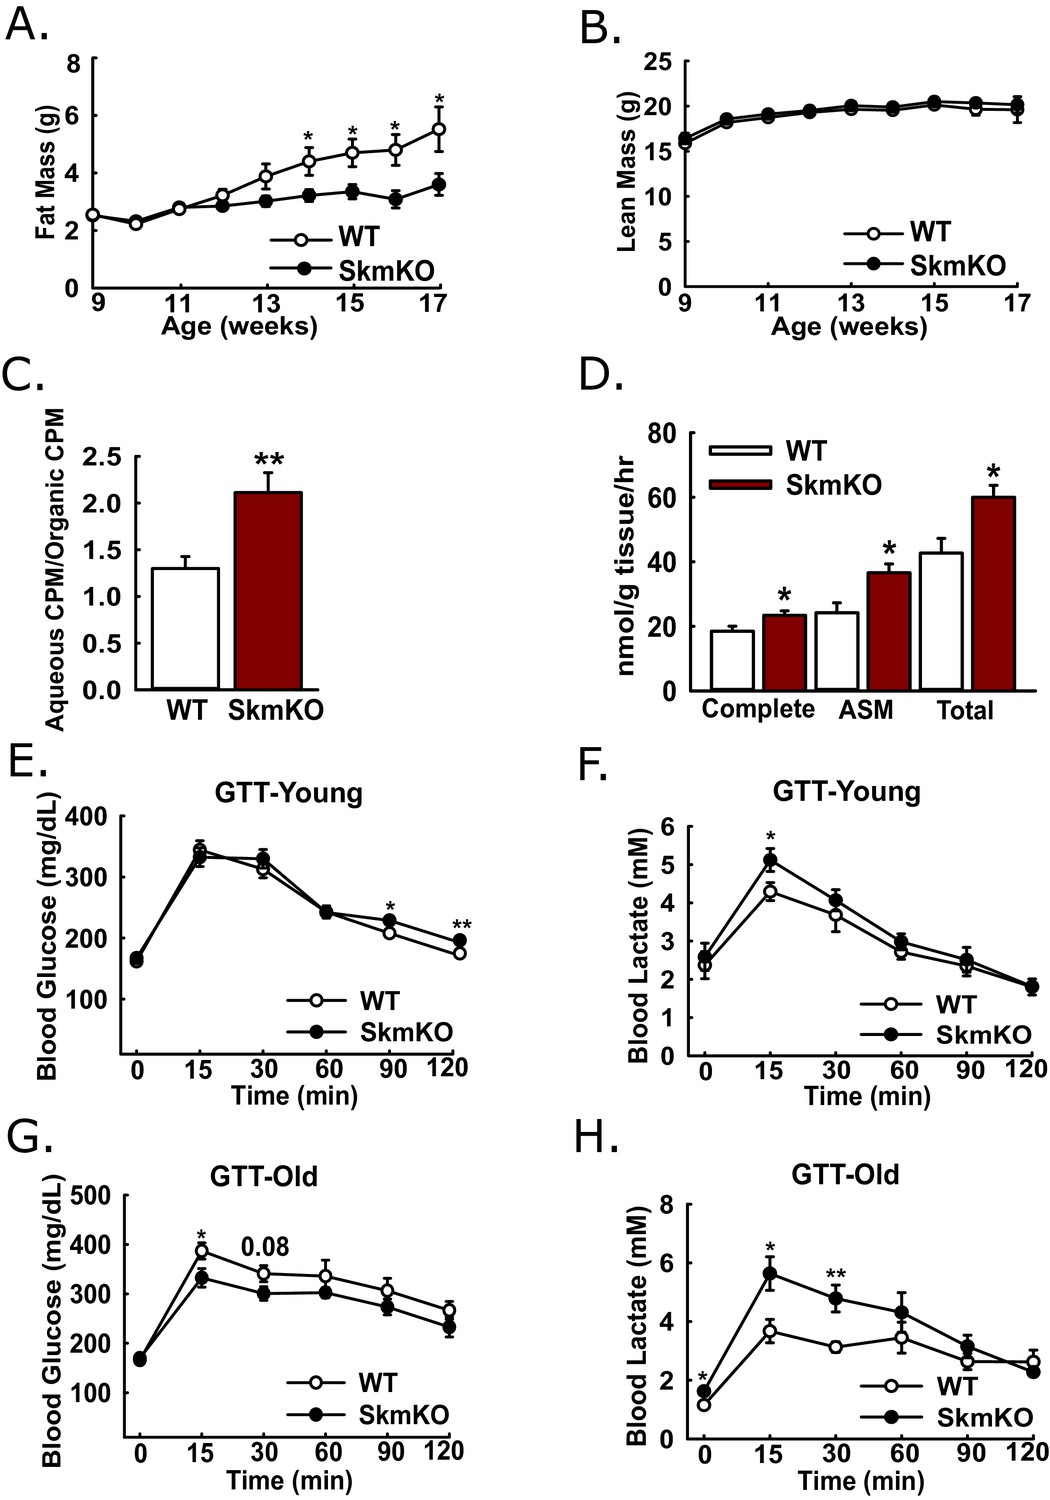
Leanness, increased fatty acid oxidation, and altered systemic glucose metabolism.
(A-B) Total fat (A) and lean (B) mass of live WT and MPC SkmKO mice measured by NMR (ages 9–17 weeks, n = 6 littermates, two-tailed t-test). (C) Ratio of muscle 3H-triolein uptake and partitioning into aqueous and organic fractions (age 16 weeks, n = 7, littermates, two-tailed t-test). (D) Oxidation of 14C-palmitate by incubated EDL muscles to CO2 (complete) and acid soluble metabolites (ASM) (age 13 weeks, before MPC SkmKO leanness, n = 6, littermates, two-tailed t-test; EDL, extensor digitorum longus). (E, F) Blood glucose (E) and lactate (F) levels during glucose tolerance tests with 7 week-old (young) WT and MPC SkmKO mice (n=17, 15 littermates, 2 non-littermates, two-tailed t-test). (G, H) Blood glucose (G) and lactate (H) levels during glucose tolerance tests with 36 week-old (old) WT and MPC SkmKO mice (n=8, littermates, two-tailed t-test). Data presented as mean ± SEM (*p<0.05, **p<0.01).
-
Figure 3—source data 1
Serum parameters of 12 hr fasted and 30 min post refed WT and MPC SkmKO mice.
(n = 8, littermates, age = 15 weeks, two way ANOVA). Data are presented as mean ± SEM (**p<0.01, ***p<0.001).
- https://doi.org/10.7554/eLife.45873.009
Figure 3—figure supplement 1
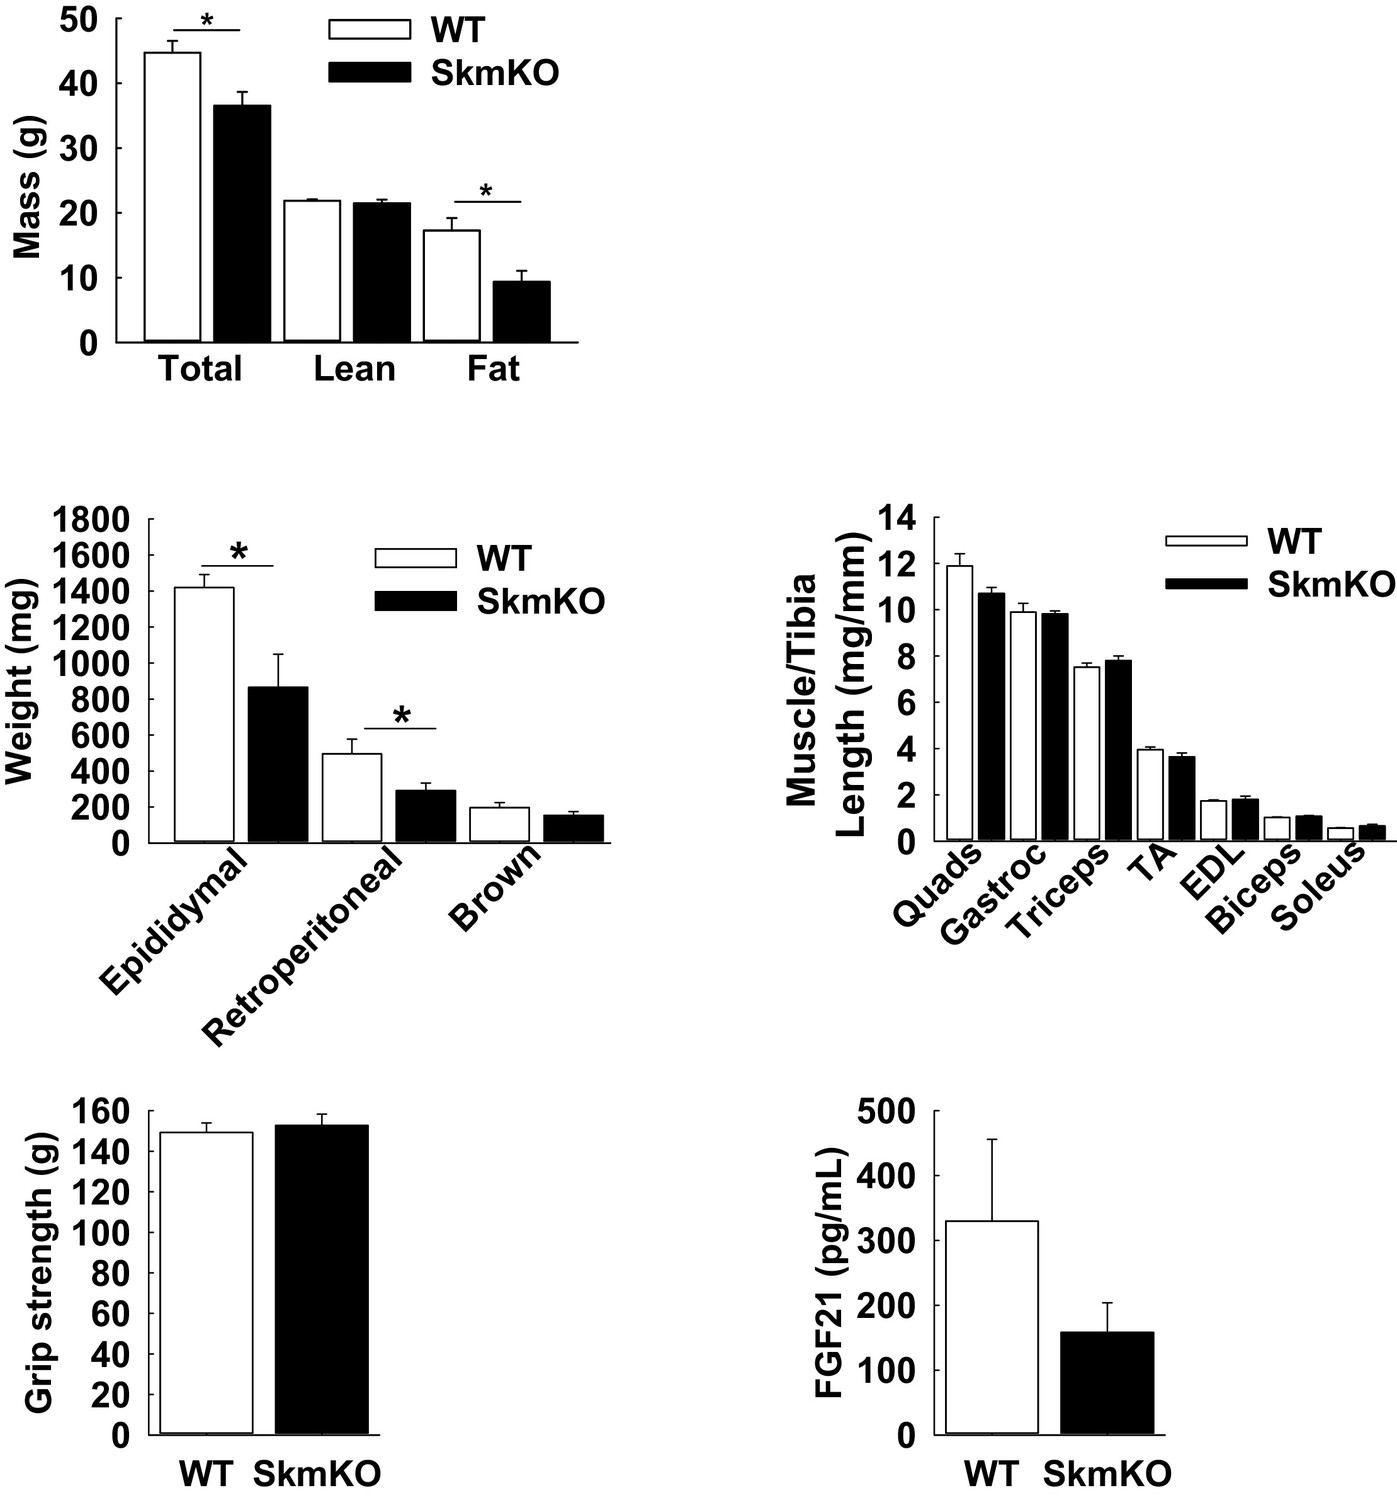
Fat mass loss and lean mass retention in MPC SkmKO mice.
(A) Body composition of WT and MPC SkmKO mice at 40 weeks of age. (n = 5 littermates, two tailed t-test). (B) Adipose depot weights of WT and MPC SkmKO mice at 40 weeks of age. (n = 5 littermates, two tailed t-test). (C) Muscle mass/Tibia length of WT and MPC SkmKO hindlimb and forelimb muscles at 40 weeks of age. (n = 5 littermates; two tailed t-test; Quads, quadriceps; TA, tibialis anterior; EDL, extensor digitorum longus). (D) Grip strength of WT and MPC SkmKO mice at 40 weeks of age. (n = 5 littermates, two tailed t-test). (E) Serum FGF21 levels in WT and MPC SkmKO mice. (n = 6 littermates, age = 21 weeks, two tailed t-test) Data are presented as mean ± SEM (*p<0.05, **p<0.01, ***p<0.001).
Figure 3—figure supplement 2
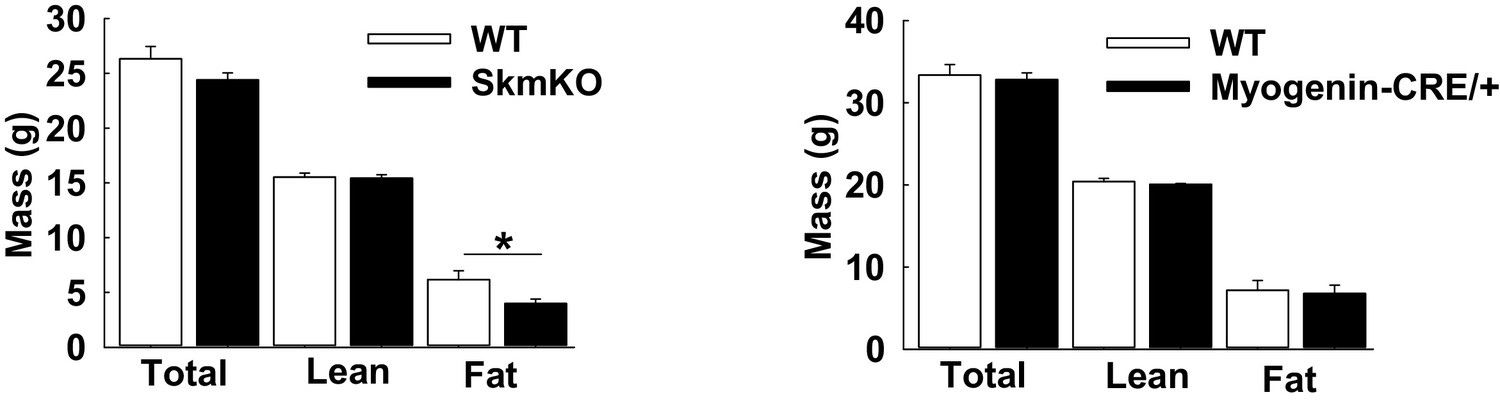
Fat mass loss in female MPC SkmKO mice and not Myogenin-CRE/+ mice.
(A) Body composition of WT and MPC SkmKO female mice at 28 weeks of age (n = 10–13 littermates, two tailed t-test). (B) Body composition of WT and Myogenin-CRE/+mice at 21 weeks of age (n = 8 littermates, two tailed t-test) Data are presented as mean ± SEM (*p<0.05, **p<0.01, ***p<0.001).
Figure 4 with 2 supplements

Hyperinsulinemic-euglycemic clamps.
Clamps were performed on 5 hr fasted, unrestrained, and conscious WT and MPC SkmKO mice. After the basal sampling period, whole body glucose flux was traced by infusion of 2.5 mU/kg/min insulin and of D-[3 H3]-glucose at time t = 0. At 45 min prior to clamp conclusion, [1-14C]−2-deoxy-D-glucose was infused over 5 min in a single bolus. Tissue samples were collected at clamp conclusion (ages 24–29 weeks, n = 6–8, six littermates + 2 non-littermates, two tailed t-test). (A - D) Blood glucose levels (A), glucose infusion rate (GIR) (B), appearance rate (Ra) (C), and disposal rate (Rd) (D) (ages 24–29 weeks, n = 6–8, six littermates + 2 non-littermates, two tailed t-test). (E, F) Tissue [1-14C]−2-deoxy-D-glucose uptake (E) and blood lactate levels (F) during the steady-state portion of the clamp (ages 24–29 weeks; n = 6–8; six littermates + 2 non-littermates; two tailed t-test; WAT, white adipose tissue, BAT, brown adipose tissue, EDL, extensor digitorum longus, Gastroc, gastrocnemius). Data presented as mean ± SEM (*p<0.05, **p<0.01).
Figure 4—figure supplement 1
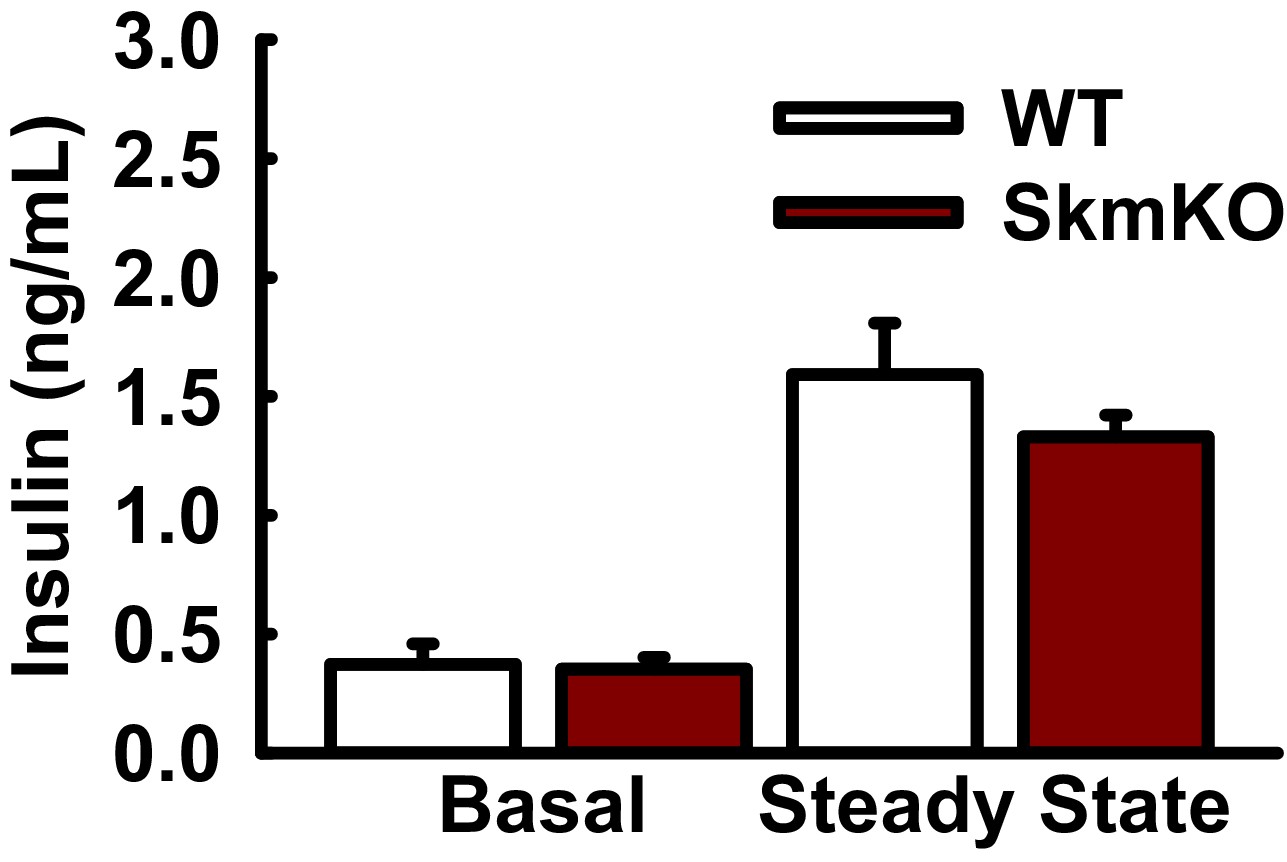
Basal and steady state plasma insulin concentrations during hyperinsulinemic-euglycemic clamps.
Insulin levels measured during basal and steady state phases of hyperinsulinemic-euglycemic clamps in WT and MPC SkmKO mice (ages 24–29 weeks, n = 6–8, six littermates + 2 non-littermates, two tailed t-test). Data are presented as mean ± SEM.
Figure 4—figure supplement 2
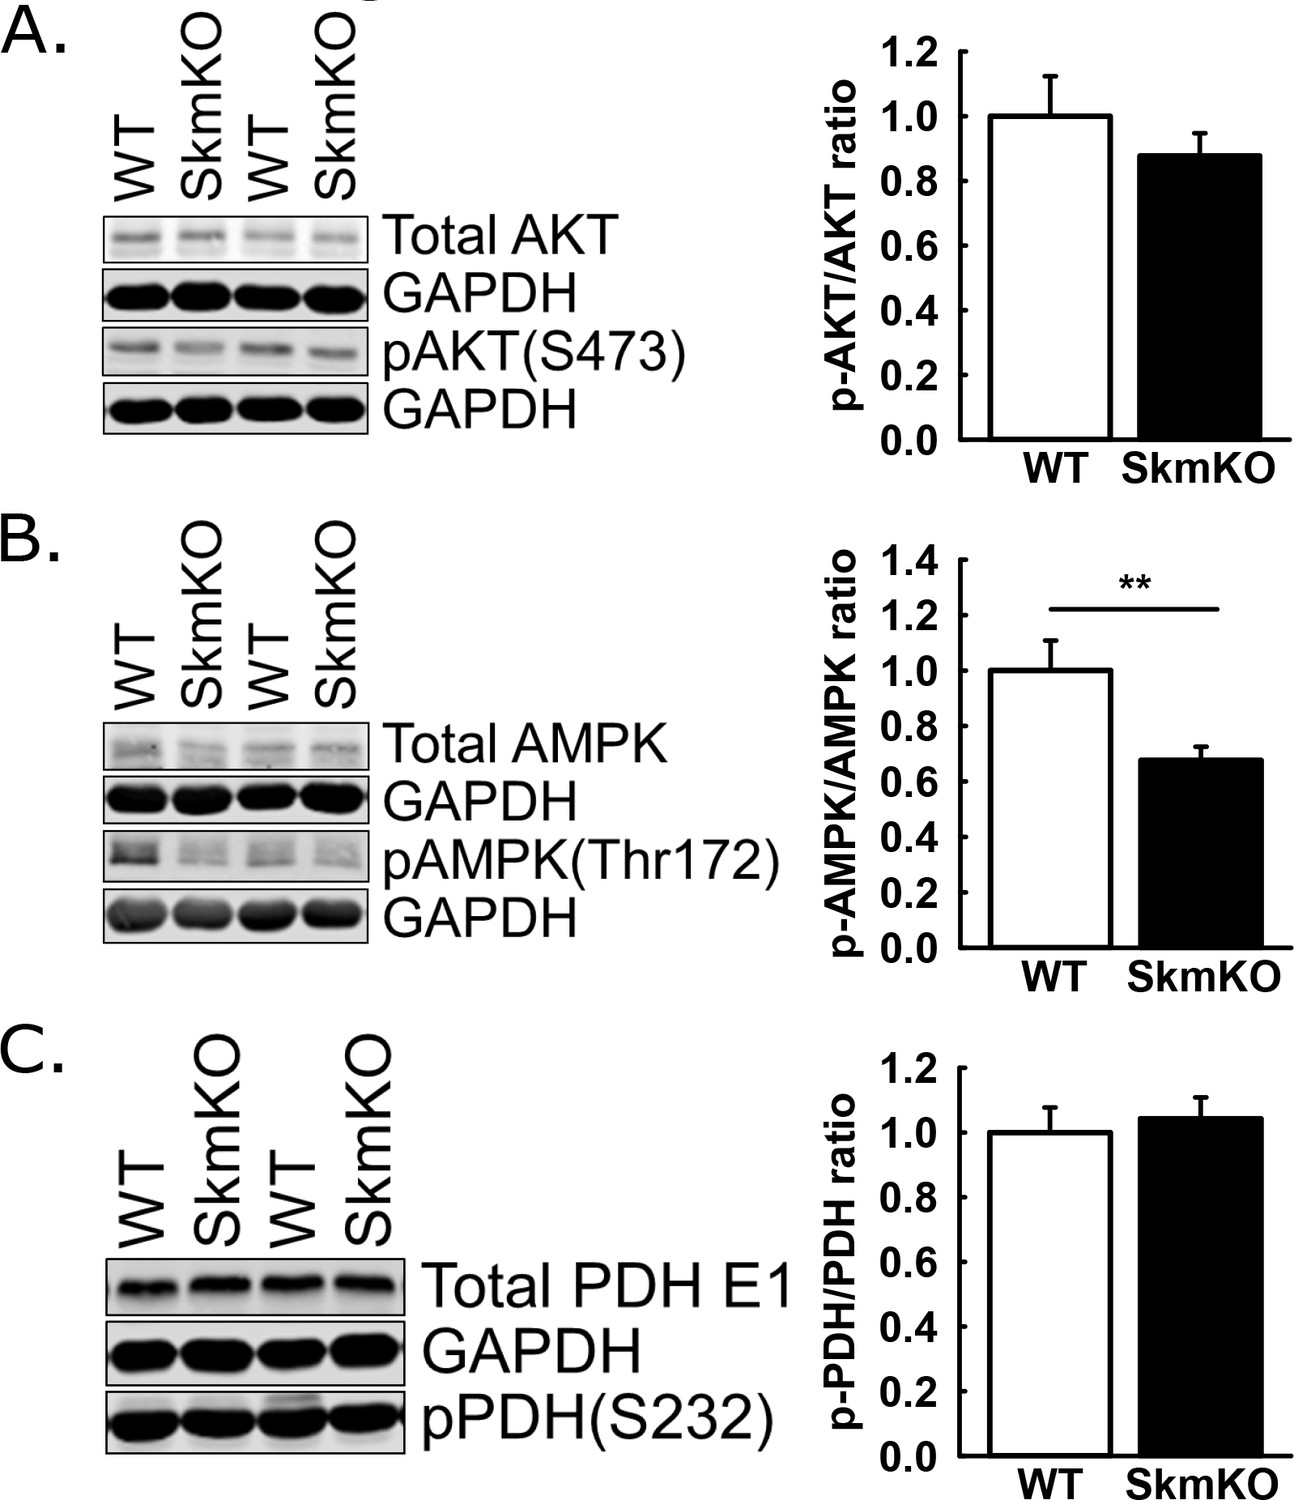
AKT, AMPK, and PDH phosphorylation in gastrocnemius muscle collected after hyper-insulinemic euglycemic clamps.
(A) Representative western blot and quantification of total and phosphorylated (S473) AKT following hyperinsulinemic euglycemia clamps in gastroc tissue of WT and MPC SkmKO mice. GAPDH is shown as loading control (ages 24-29 weeks, n=6-8, 6 littermates + 2 non-littermates, two tailed t-test). (B) Representative western blot and quantification of total and phosphorylated (Thr172) AMPK following hyperinsulinemic euglycemia clamps in gastroc tissue of WT and MPC SkmKO mice. GAPDH is shown as loading control (ages 24-29 weeks, n=6-8, 6 littermates + 2 non-littermates, two tailed t-test). (C) Representative western blot and quantification of total and phosphorylated (S232) PDH E1 following hyperinsulinemic euglycemia clamps in gastroc tissue of WT and MPC SkmKO mice. GAPDH is shown as loading control (ages 24-29 weeks, n=6-8, 6 littermates + 2 non-littermates, two tailed t-test). Data are presented as mean ± SEM (*p<0.05).
Figure 5 with 3 supplements
Mechanisms of metabolic adaptation.
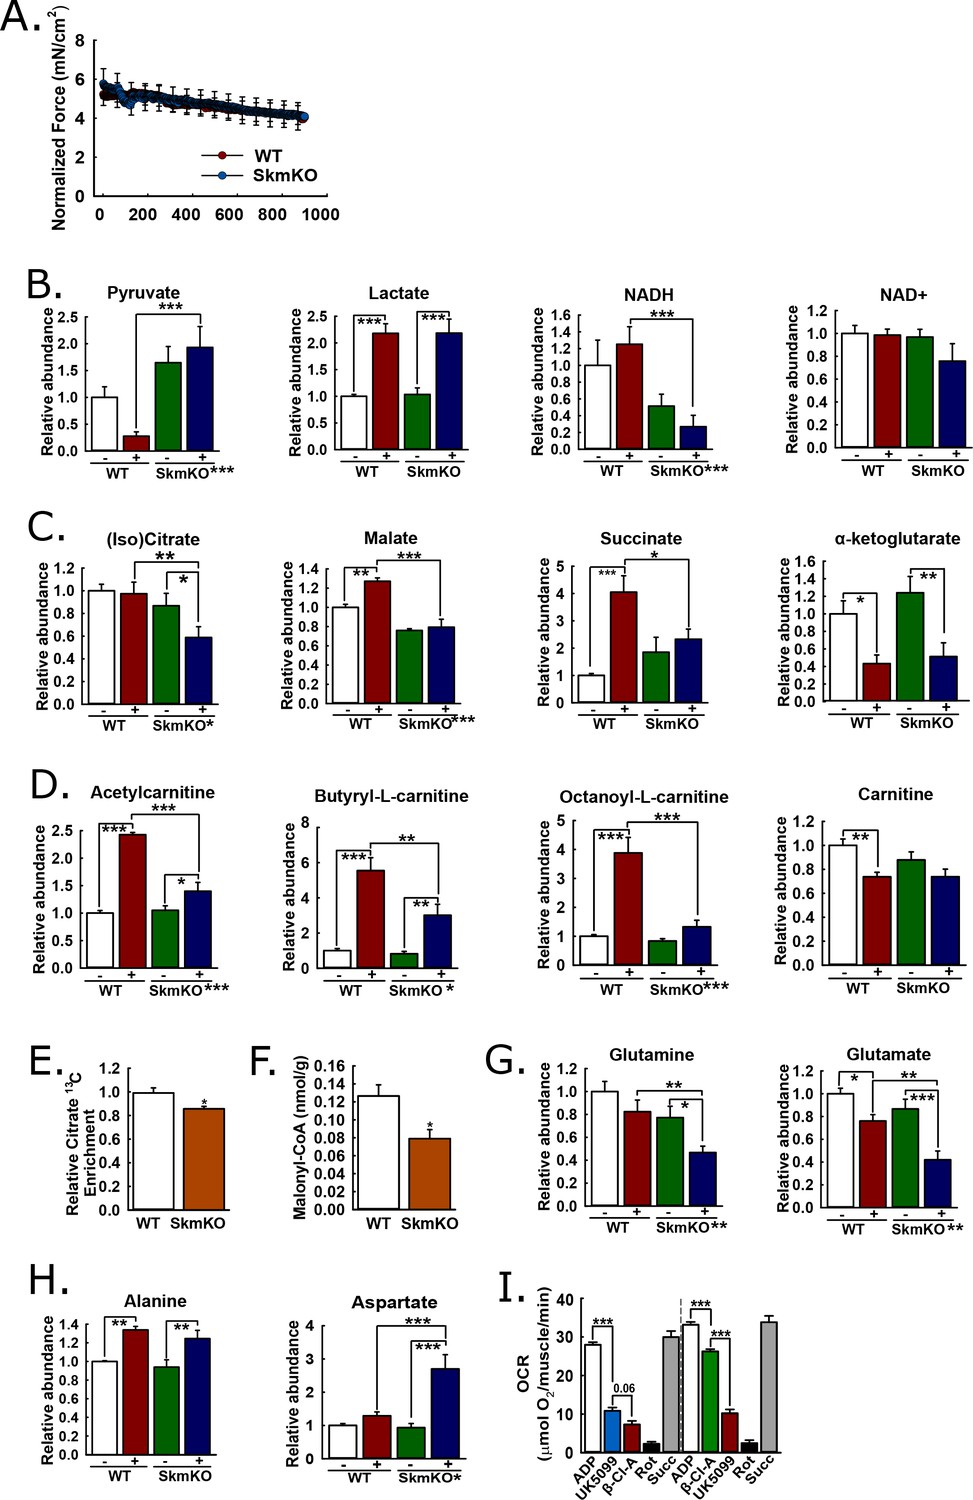
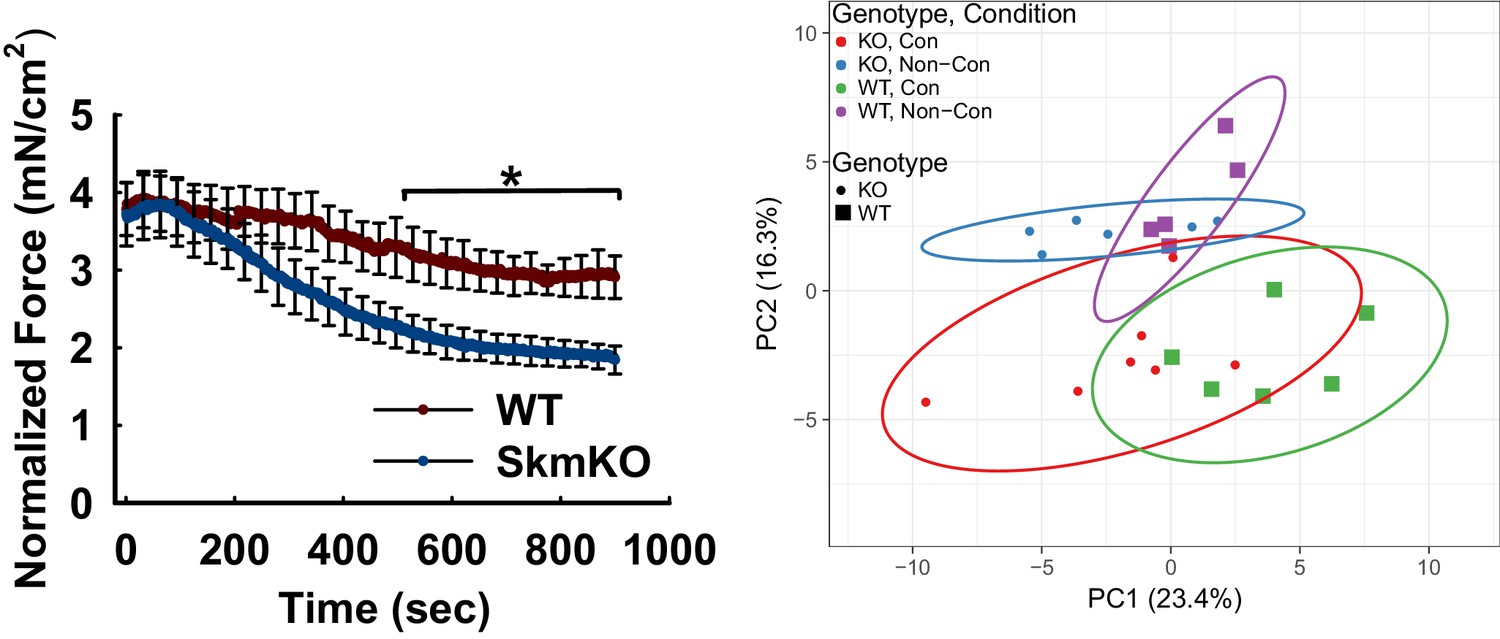
(A) Tibialis anterior (TA) muscle force production during 0.5 Hz isometric contraction by in situ peroneal nerve stimulation of live anesthetized WT and MPC SkmKO mice (age 12 weeks, n = 5–6, littermates, 30 s rolling averages analyzed by two-tailed t-test). (B) Relative metabolite abundance of pyruvate, lactate, NADH, and NAD+ in sham-treated (-) and contracted (+) TA muscles of WT and MPC SkmKO mice (age 12 weeks, n = 5–6, littermates, two-way ANOVA). (C) Relative metabolite abundance of isocitrate +citrate (Iso)Citrate, malate, succinate, and α-ketoglutarate in sham-treated (-) and contracted (+) TA muscles of WT and MPC SkmKO mice (age 12 weeks, n = 5–6, littermates, two-way ANOVA). (D) Relative metabolite abundance of acetylcarnitine, butyryl-L-carnitine, octanoyl-L-carnitine, and carnitine in sham-treated (-) and contracted (+) TA muscles of WT and MPC SkmKO mice (age 12 weeks, n = 5–6, littermates, two-way ANOVA). (E) Citrate 13C enrichment (13C labeled/non-labeled citrate) in TA muscles 65 min after intraperitoneal U13C-glucose injection of WT and MPC SkmKO mice (age 12 weeks, n = 8, seven littermates + 1 non-littermate, two-way ANOVA). (F) Malonyl-CoA levels in quadriceps muscles of WT and MPC SkmKO mice (age 11 weeks, n = 6, littermates, two tailed student's t test). (G-H) Relative metabolite abundance of glutamate and glutamine (G) and alanine and aspartate (H) in sham-treated (-) and contracted (+) TA muscles of WT and MPC SkmKO mice (age 12 weeks, n = 5–6, littermates, two-way ANOVA). (I) Ex vivo pyruvate-driven, ADP-stimulated respiration of permeabilized mouse soleus muscle treated with UK5099, β-chloro-alanine (β-Cl-A), rotenone (Rot), and rescued with succinate (age 11 weeks, n = 6, littermates, two-tailed t-test). Data are presented as mean ± SEM (*p<0.05, **p<0.01, ***p<0.001, placement on x-axis signifies genotype main effect).
Figure 5—figure supplement 1
TA muscle force production during 1 Hz in situ contraction and metabolomics principal component (PCA) analysis of 0.5 Hz contracted TA muscles after in situ contraction.
(A) Normalized real-time force produced during 1 Hz isometric twitches of the TA muscle of WT and MPC SkmKO mice (n = 6–7, littermates, age = 12 weeks, 30 s rolling averages analyzed by two tailed t-test). (B) Principal component analysis (PCA) score plot of the first and second principal components (PCs) from 61 metabolites. (n = 5–6, littermates; age = 12 weeks; KO, MPC SkmKO; Con, contracted; Non-Con, non-contracted). Data are presented as mean ± SEM (*p<0.05, **p<0.01, ***p<0.001).
Figure 5—figure supplement 2
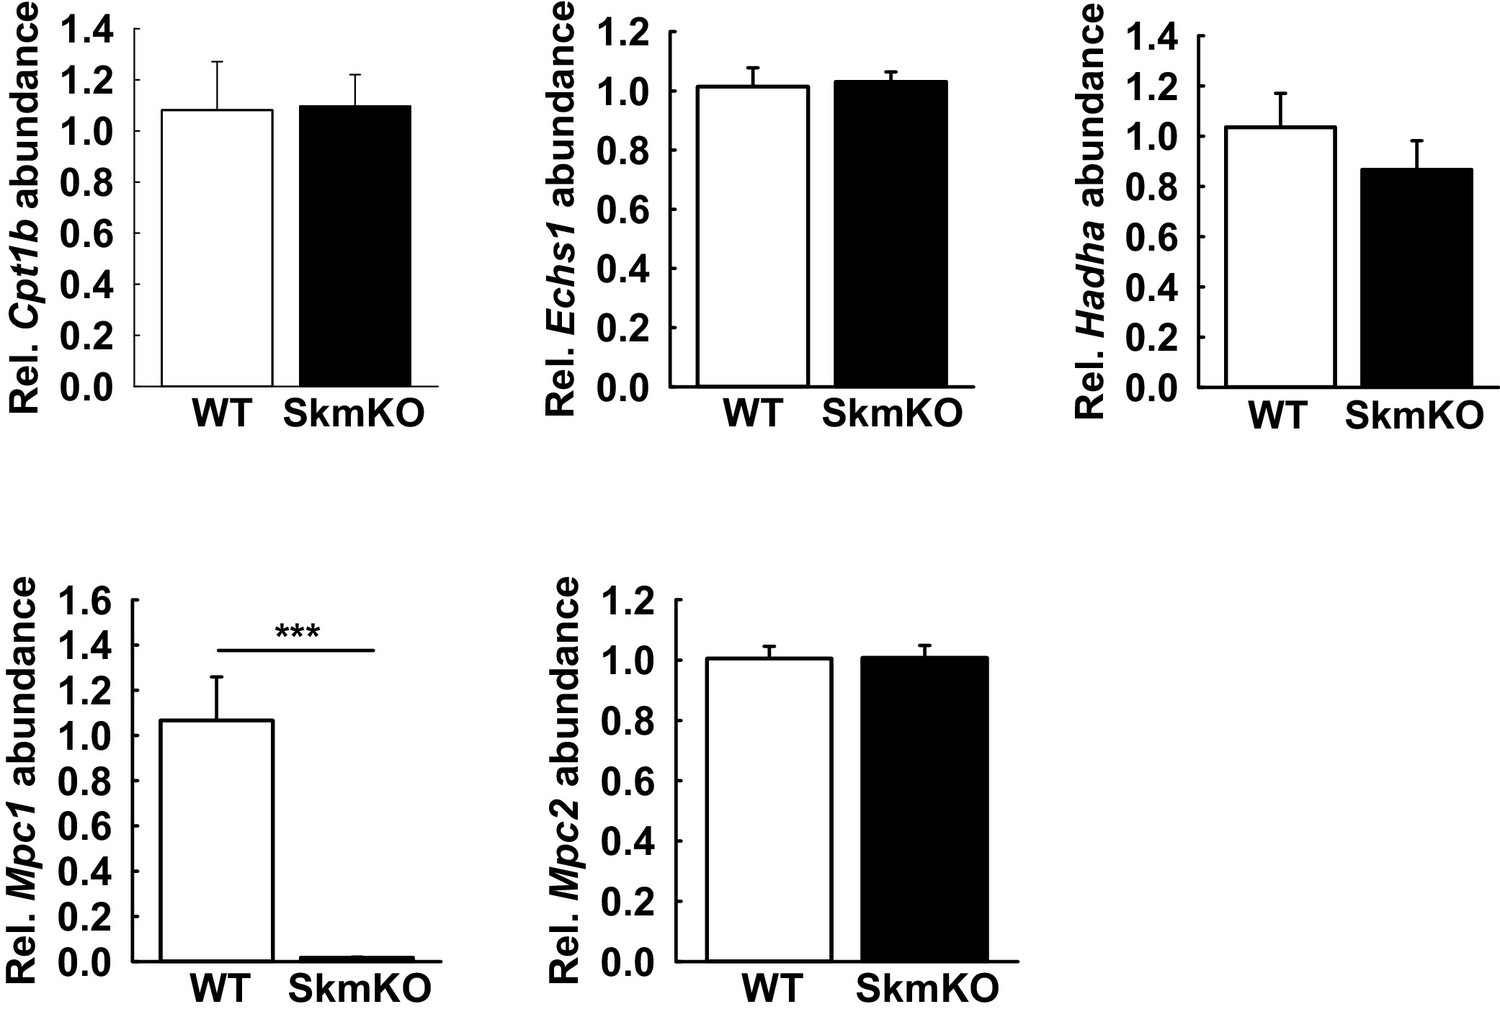
Transcript abundance of key fatty acid oxidation enzymes is not changed in MPC SkmKO skeletal muscle.
(A-E) Relative transcript abundance in the TA muscle of WT and MPC SkmKO mice of Cpt1b (A), Echs1 (B), Hadha (C), Mpc1 (D), Mpc2 (E) normalized to U36b4 (n = 6, littermates, age = 11 weeks, two tailed t-test). Data are presented as mean ± SEM ***p<0.001).
Figure 5—figure supplement 3
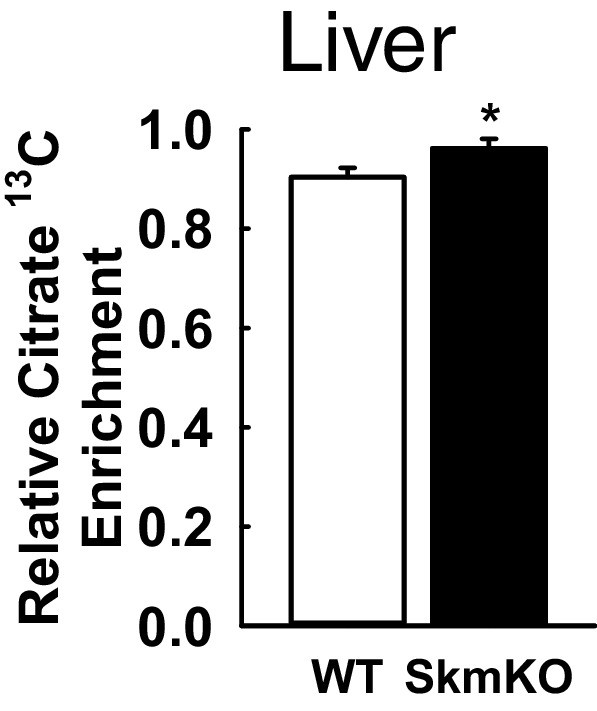
Increased liver citrate 13C enrichment in MPC SkmKO mice following intraperitoneal injection of U13C-glucose.
Liver citrate 13C enrichment (13C labeled/non-labeled citrate) in liver of WT and MPC SkmKO mice 65 min after U13C-glucose injection (n = 8, 7 littermates one non-littermate, age = 12 weeks, two tailed t-test). Data are presented as mean ± SEM (*p<0.05).
Figure 6 with 2 supplements
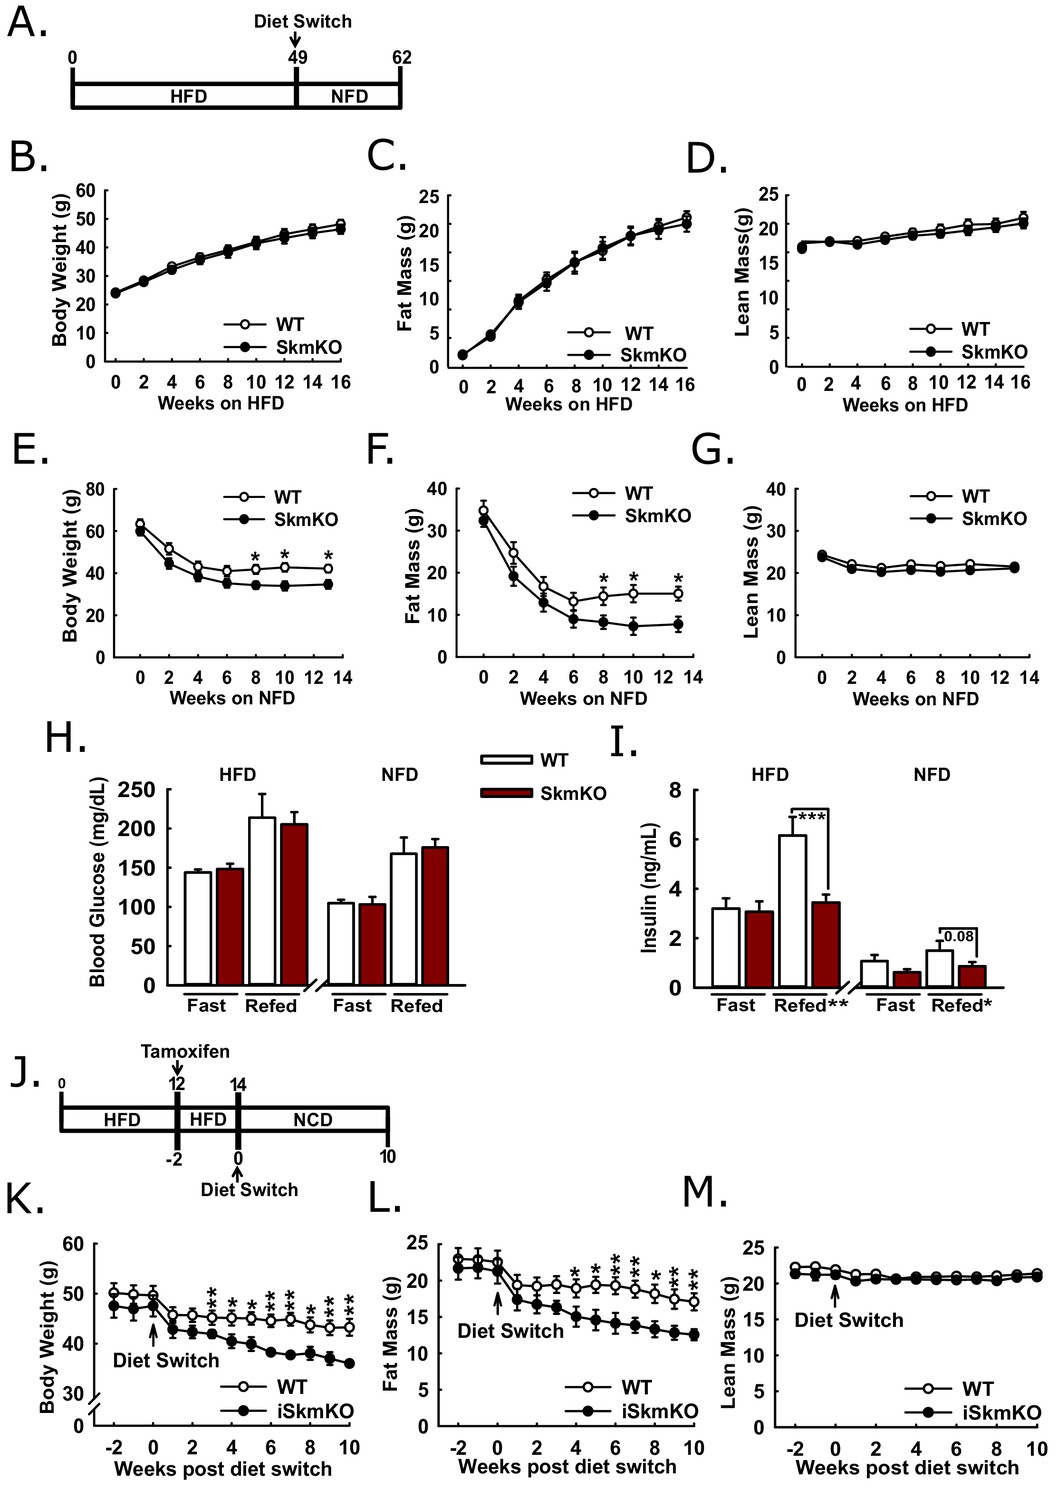
Protection and recovery from high fat diet-induced obesity.
(A) Schema illustrating the time course of high fat diet (HFD) feeding and a switch to synthetic normal fat control diet (NFD). (B, C, and D) Body weight (B), fat mass (C), and lean mass (D) of WT and MPC SkmKO mice measured by NMR during HFD feeding of WT and MPC SkmKO mice (ages 9–25 weeks, n = 7–8, littermates, two-tailed t-test). (E, F, and G) Body weight (E), fat mass (F), and lean mass (G) of WT and MPC SkmKO mice measured by NMR during post-HFD, normal fat synthetic control diet (NFD) feeding of WT and MPC SkmKO mice (ages 58–71 weeks, n = 5–6, littermates, two-tailed t-test). (H, I) Fasted and refed blood glucose (H) and serum insulin (I) levels at ends of HFD and post-HFD, NFD treatments of WT and MPC SkmKO mice (ages 58 and 71 weeks, n = 5–6, littermates, two way ANOVA). (J) Schema illustrating the time course of mouse HFD treatment, tamoxifen injection for acute muscle-specific Mpc1 deletion (MPC iSkmKO), and switch to normal chow diet (NCD) feeding. (K, L, and M) Body weight (K), fat mass (L), and lean mass (M) measured by NMR from end of 5 days tamoxifen administration, during 2 weeks continued HFD, and during 10 weeks post-HFD, NCD feeding of WT and MPC iSkmKO mice (ages 22–34 weeks, n = 6–7, littermates, two-tailed t-test). Data are presented as mean ± SEM (*p<0.05, **p<0.01, ***p<0.001).
-
Figure 6—source data 1
Serum Parameters of 12 hr fasted and 30 min post refed WT and MPC SkmKO mice after 48 weeks of HFD and after 14 weeks of NFD recovery.
(n = 8, littermates, age 58 and 71 weeks, two way ANOVA). Data are presented as mean ± SEM (*p<0.05, **p<0.01, ***p<0.001).
- https://doi.org/10.7554/eLife.45873.020
Figure 6—figure supplement 1
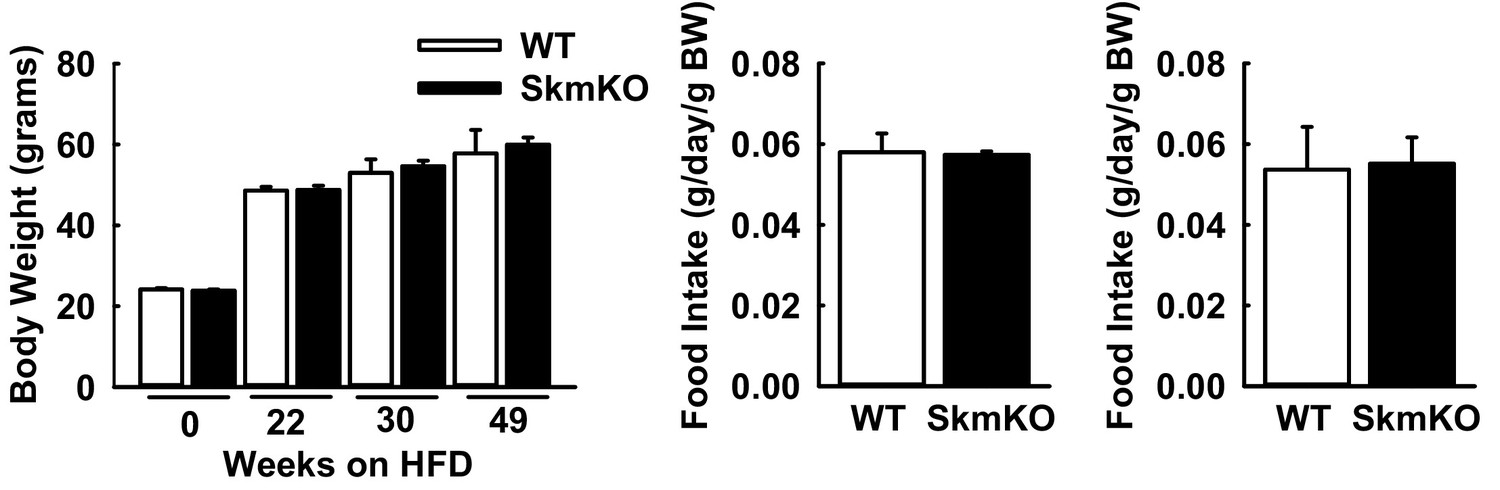
WT and MPC SkmKO mouse physiological parameters during high fat diet (HFD) and after return to normal fat diet (NFD) feeding.
(A) Body weight of WT and MPC SkmKO mice on HFD (n = 7–8, littermates, age 9–58 weeks, two tailed t-test). (B) Daily food intake by WT and MPC SkmKO mice on HFD, normalized to body weight (BW) (n = 5–6, littermates, age = 30 weeks, two tailed t-test). (C) Daily food intake by WT and MPC SkmKO mice on NFD, normalized to body weight (BW) (n = 5–6, littermates, age = 61 weeks, two tailed t-test). Data are presented as mean ± SEM.
Figure 6—figure supplement 2

Physiological parameters in MPC iSkmKO mice.
(A) Relative western blot of Mpc1 and Mpc2 protein abundance in TA muscles of WT and MPC iSkmKO mice. Loading was normalized to total protein. Tubulin was used as a reference loading control. (n = 8, littermates, age = 36 weeks, two tailed t-test). (B) Adipose depot weight in WT and MPC iSkmKO mice (n = 6–7, littermates, age = 36 weeks, two tailed t-test). (C) Muscle mass/Tibia length of WT and MPC iSkmKO hindlimb muscles (n = 6–7, littermates, age = 36 weeks, two tailed t-test). (D) Daily food intake by WT and MPC iSkmKO mice on chow diet, normalized to body weight (BW) (n = 6–7, littermates, age = 25 weeks, two tailed t-test). Data are presented as mean ± SEM (**p<0.01).
Figure 7
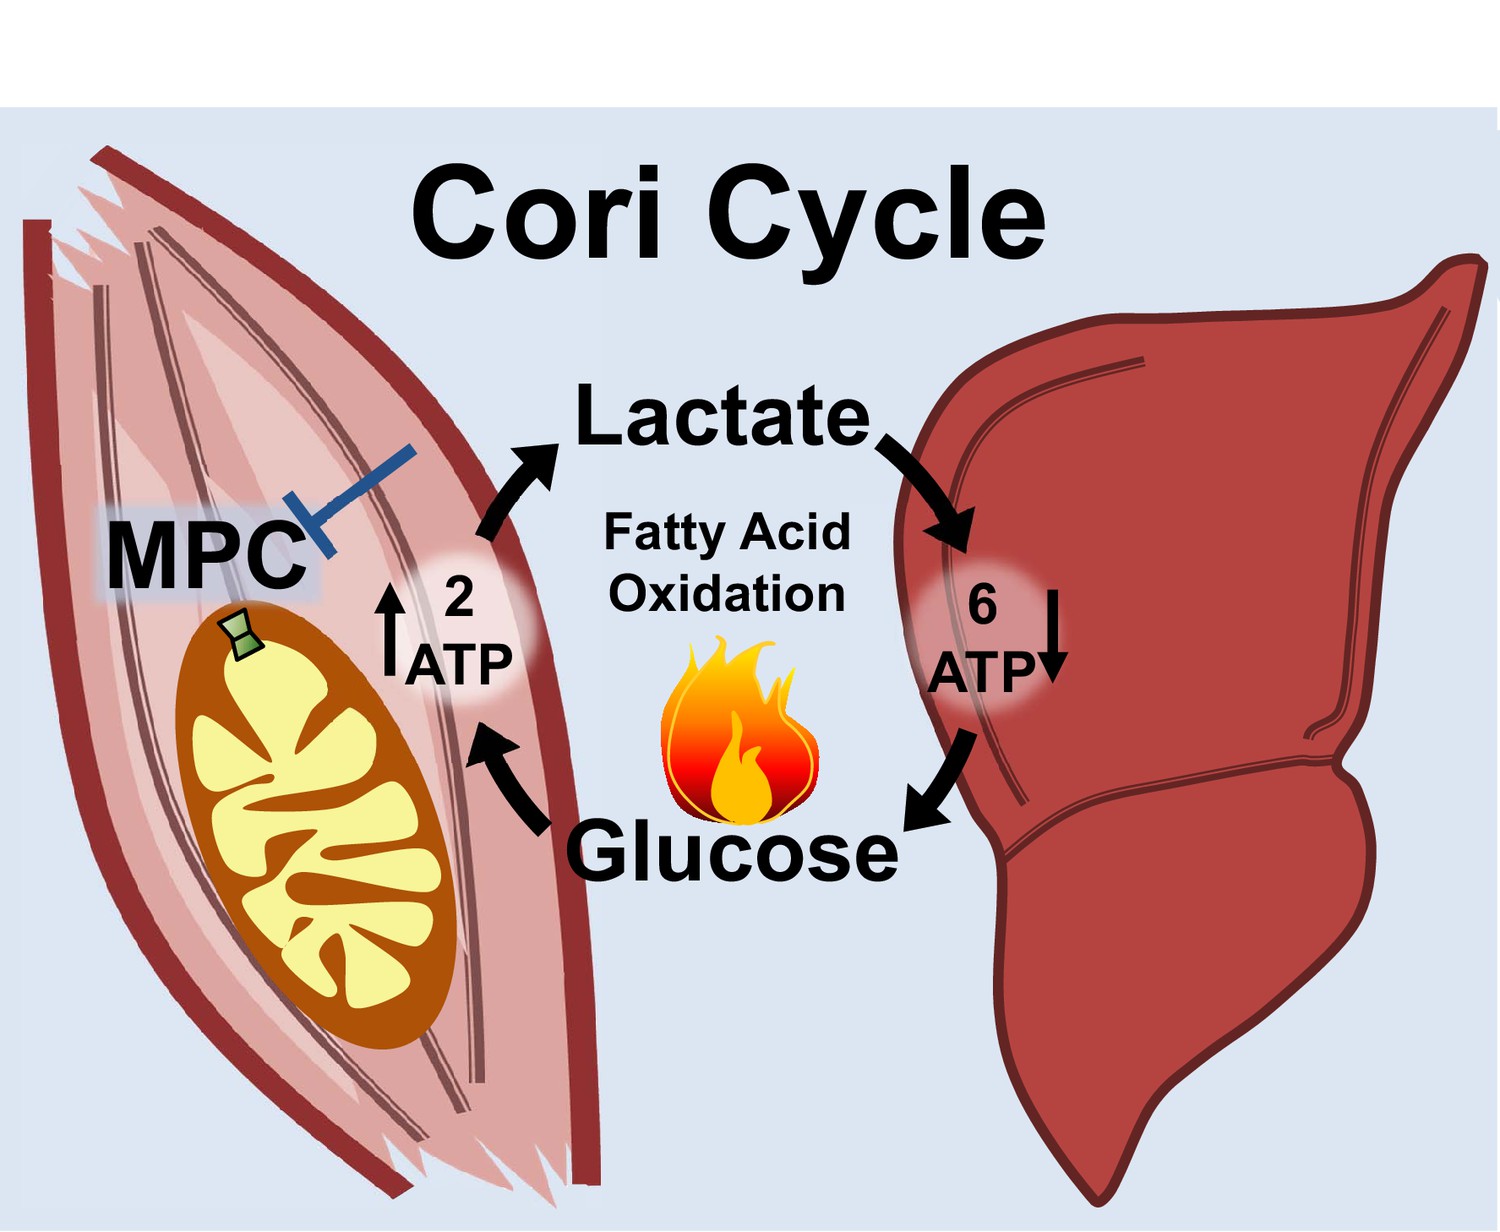
Skeletal muscle MPC disruption drives Cori cycling and fatty acid oxidation.
Skeletal muscle MPC disruption (MPC SkmKO) impairs glycolytically generated pyruvate entry into skeletal muscle mitochondria, thereby increasing conversion of pyruvate to lactate and consequent skeletal muscle lactate excretion. Increased skeletal muscle lactate excretion drives hepatic gluconeogenesis that re-supplies glucose to skeletal muscle. Thus, skeletal muscle MPC disruption increases Cori Cycling. The Cori Cycle is energetically futile because each round produces two skeletal muscle ATP molecules and consumes six liver ATP equivalents, for a net whole-body consumption of 4 ATP equivalents. Because hepatic gluconeogenesis is energetically supported by fatty acid oxidation and muscle MPC disruption increases muscle fatty acid oxidation, futile Cori Cycling is energetically supported by fatty acid oxidation. Together, increased energy expenditure and fatty acid oxidation contribute to leanness arising from skeletal muscle MPC disruption.
Tables
Key resources table
| Reagent type (species) or resource | Designation | Source or reference | Identifiers | Additional information |
|---|---|---|---|---|
| Genetic reagent (Mus musculus) | Mpc1flox/flox, C57BL/6J | Gray et al., 2015 | ||
| Genetic reagent (Mus musculus) | Myogenin-Cre, C57BL/6J | Li et al., 2005 | Gift from Dr. Eric Olsen | |
| Genetic reagent (Mus musculus) | HSA-MerCreMer, C57BL/6J | McCarthy et al., 2012 | Gift from Dr. Karyn Esser | |
| Antibody | Rabbit monoclonal anti-MPC1 | Proteintech | S4154-2 | Gift from Dr. Brian Finck; (1:1000) |
| Antibody | Rabbit monoclonal anti-MPC2 (D4I7G) | Cell Signaling Technology | #46141, RRID:AB_2799295 | (1:1000) |
| Antibody | Rabbit monoclonal anti-VDAC (D73D12) | Cell Signaling Technology | #4661, RRID:AB_10557420 | (1:1000) |
| Antibody | Mouse monoclonal anti-Actin (AC-15) | Sigma | #A5441, RRID:AB_476744 | (1:10000) |
| Antibody | Rabbit monoclonal anti-Tubulin (DM1A) | Cell Signaling Technology | #3873S, RRID:AB_1904178 | (1:1000) |
| Antibody | Rabbit monoclonal anti-HSP90 | Cell Signaling | #4874, RRID:AB_2121214 | (1:1000) |
| Antibody | Total OXPHOS cocktail | Abcam | ab110413, RRID:AB_2629281 | (1:1000) |
| Antibody | Mouse monoclonal anti-AMPKα (F6) | Cell Signaling Technology | #2793, RRID:AB_915794 | (1:1000) |
| Antibody | Rabbit monoclonal anti-pAMPKα (Thr172) (40H9) | Cell Signaling Technology | #2535, RRID:AB_331250 | (1:1000) |
| Antibody | Rabbit monoclonal anti-AKT (pan) (11E7) | Cell Signaling Technology | #4685, RRID:AB_2225340 | (1:1000) |
| Antibody | Rabbit polyclonal anti-pAKT (Ser473) | Cell Signaling Technology | #9271, RRID:AB_329825 | (1:1000) |
| Antibody | Mouse monoclonal anti-PDH-E1α (D6) | Santa Cruz Biotechnology | #SC-377092, RRID:AB_2716767 | (1:1000) |
| Antibody | Rabbit polyclonal anti-pPDH-E1α (Ser232) | Millipore Sigma | #AP1063, RRID:AB_10616070 | (1:1000) |
| Antibody | Rabbit monoclonal anti-GAPDH (D16H11) | Cell Signaling Technology | #5174, RRID:AB_10622025 | (1:20000) |
| Antibody | Goat anti-Mouse Dylight 800 | ThermoFisher | SA5-10176, RRID:AB_2556756 | (1:10000) |
| Antibody | Donkey anti-Rabbit DyLight 680 | ThermoFisher | SA5-10042, RRID:AB_2556622 | (1:5000) |
| Antibody | Goat anti-Rabbit DyLight 800 | ThermoFisher | #35571, RRID:AB_614947 | (1:10000) |
| Sequence-based reagent | 36b4 | Forward: 5'-CGTCCTCGTTGGAGTGACA | Reverse: 5'-CGGTGCGTCAGGGATTG | |
| Sequence-based reagent | Mpc1 | Forward: 5'-AACTACGAGATGAGTAAGCGGC | Reverse: 5'-GTGTTTTCCCTTCAGCACGAC | |
| Sequence-based reagent | Mpc2 | Forward: 5'-CCGCTTTACAACCACCCGGCA | Reverse: 5'-CAGCACACACCAATCCCCATTTCA | |
| Sequence-based reagent | Cpt1b | Forward: 5'-GGTCCCATAAGAAACAAGACCTCC | Reverse: 5'-CAGAAAGTACCTCAGCCAGGAAAG | |
| Sequence-based reagent | Hadha | Forward: 5'-TGGATGTGGATGACATTGCT | Reverse: 5'-GGGGAAGAGTATCGGCTAGG | |
| Sequence-based reagent | Echs1 | Forward: 5'-CTTCACTGTAAGGGCAGGTG | Reverse: 5'-CTTGAGTTGGGAATCAGCAG | |
| Commercial assay or kit | FGF21 ELISA kit | ThermoFisher | NC9903102 | |
| Commercial assay or kit | Glucose Assay Kit | Sigma-Aldrich | HK20 | |
| Commercial assay or kit | High-Capacity cDNA Reverse Transcription kit | Applied Biosystems | 4368814 | |
| Commercial assay or kit | Infinity Cholesterol Reagent | Thermo Scientific | TR13421 | |
| Commercial assay or kit | Infinity Triglyceride Reagent | Thermo Scientific | TR22421 | |
| Commercial assay or kit | Leptin ELISA kit | R and D Systems | MOB00 | |
| Commercial assay or kit | Serum Ketone Kit | Wako Diagnostics | 415–73301, 411–73401, 412–73791 | |
| Commercial assay or kit | Serum NEFA kit | Wako Diagnostics | 999–34691, 995–034791, 991–34891, 993–35191, 276–76491 | |
| Commercial assay or kit | Ultra-sensitive Mouse Insulin ELISA kit | Crystal Chem | 90080 | |
| Commercial assay or kit | Insulin chemiluminescence ELISA | American Laboroatory Products | #80-INSMR-CH01 | |
| Chemical compound, drug | [1–14C]−2-deoxy-D-glucose | Perkin Elmer | NEC495001MCSBF3 | |
| Chemical compound, drug | α-Cyano-4-hydroxycinnamic acid (CHC) | Sigma-Aldrich | 476870 | |
| Chemical compound, drug | 13C3-Sodium Pyruvate (99%) | Cambridge Isotope Laboratories | 142014-11-17 | |
| Chemical compound, drug | 13C3-Sodium-L-Lactate (98%) | Cambridge Isotope Laboratories | CLM-1579 | |
| Chemical compound, drug | 14C-Palmitic acid | Perkin Elmer | NEC075H250UC | |
| Chemical compound, drug | 14C-Sodium Pyruvate | Perkin Elmer | NEC256050UC | |
| Chemical compound, drug | Antimycin A | Sigma-Aldrich | A8674 | |
| Chemical compound, drug | D-[3-3H]-glucose | Perkin Elmer | NET331C001MC SBF3 | |
| Chemical compound, drug | Insulin | Novo Nordisk | Novolin R | |
| Chemical compound, drug | Deoxy-D-glucose 2-[1,2-3H(N)] | Perkin Elmer | NET328A001MC | |
| Chemical compound, drug | Ensure | Abbott | Vanilla-57g | |
| Chemical compound, drug | FCCP | Sigma-Aldrich | C2920 | |
| Chemical compound, drug | High Fat Diet 60%Kcal from fat (HFD) | Research Diets Inc | D12492 | |
| Chemical compound, drug | Low Fat Diet 10% Kcal from fat (control diet, NFD) | Research Diets Inc | D12450J | |
| Chemical compound, drug | Normal Chow/Teklad Global Soy Protein-Free Extruded Rodent Diet Irradiated (NCD) | Envigo | 2920X | |
| Chemical compound, drug | Oligomycin A | Sigma-Aldrich | 75351–5 MG | |
| Chemical compound, drug | Rotenone | Sigma-Aldrich | R8875-1G | |
| Chemical compound, drug | Tamoxifen | Sigma-Aldrich | T5648-1G | |
| Chemical compound, drug | Triolein, [9,10-3H(N)] | Perkin Elmer | NET431001MC | |
| Chemical compound, drug | UK-5099 | ThermoFisher | 418610 | |
| Chemical compound, drug | Acetyl coenzyme A sodium salt | Sigma-Aldrich | A2056-10MG | |
| Chemical compound, drug | 3H-Acetyl-CoA | Perkin Elmer | NET290050UC | |
| Chemical compound, drug | Malonyl coenzyme A lithium salt | Sigma-Aldrich | M4263-5MG | |
| Chemical compound, drug | Purified chicken fatty acid synthase | David Thomson Lab, BYU | ||
| Chemical compound, drug | Protease Arrest | G Biosciences | 786–437 | |
| Other | Accupulser | World Precision Instrument | A310 Accupulser | |
| Other | Body Composition Analyzer | Bruker | LF50-BCA Analyzer | |
| Other | Callipers | MSC Industrial Supply | 35518166 | |
| Other | Glucose Meter | LifeScan | Onetouch ulta mini | |
| Other | Glucose Strips | Diabetic Express | Feb-67 | |
| Other | Headstage | Axon Instruments | CV 203BV | |
| Other | Integrating patch clamp | Axon Instruments | Axopatch 200B | |
| Other | Lactate Meter | Nova Biomedical | Lactate plus meter | |
| Other | Lactate Strips | Nova Biomedical | NC0071872 | |
| Other | Low noise data acquisition system | Axon Instruments | Axon digidata 1550 | |
| Other | Low noise data acquisition system | Axon Instruments | Axon digidata 1440A | |
| Other | Microvette blood collection tubes | Sarstedt Inc | NC9141704 | |
| Other | Ohaus Hand-Held Scales | ThermoFisher | S65222 | |
| Other | Promethion Cages | Sable Systems International | Promethion Line | |
| Other | Rodent Treadmill | Columbus Instruments | Exer 3/6 Treadmill | |
| Other | Stimulus Isolater | World Precision Instrument | Stimulus Isolater | |
| Other | Western Blot Imager | Li-Cor | Odyssey CLx | |
| Other | Platform | Aurora Scientific | 809B | |
| Other | Force tranducer | Aurora Scientific | 305C | |
| Other | Refridgerated/Heated bath circulator | Thermo Fisher | 6200 R20F | |
| Other | XF96 4-port FluxPak with PET Microplates | Seahorse Bioscience | 102416–100 | |
| Software/tool | Sigmaplot | Sigmaplot | RRID:SCR_003210 | |
| Software/tool | Excel | Microsoft | RRID:SCR_016137 |
Additional files
-
Supplementary file 1
TA muscle metabolomic profiles after sham and in situ contraction. n = 5–6, littermates, age = 12 weeks, two way ANOVA.
- https://doi.org/10.7554/eLife.45873.022
-
Supplementary file 2
Percent isotopologue distribution of TCA cycle intermediates in muscle and liver 65 min after U13C-labeled glucose injection of WT and MPC SkmKO mice.
(n = 8, 7 littermates one non-littermate, age = 12 weeks, two tailed t-test) Data are presented as mean ± SEM (*p<0.05, **p<0.01, ***p<0.001).
- https://doi.org/10.7554/eLife.45873.023
-
Transparent reporting form
- https://doi.org/10.7554/eLife.45873.024
Download links
A two-part list of links to download the article, or parts of the article, in various formats.
Downloads (link to download the article as PDF)
Open citations (links to open the citations from this article in various online reference manager services)
Cite this article (links to download the citations from this article in formats compatible with various reference manager tools)
Impaired skeletal muscle mitochondrial pyruvate uptake rewires glucose metabolism to drive whole-body leanness
eLife 8:e45873.
https://doi.org/10.7554/eLife.45873


