The distribution of fitness effects among synonymous mutations in a gene under directional selection
- University of Ottawa, Canada
- Clarkson University, United States
Figures
Figure 1
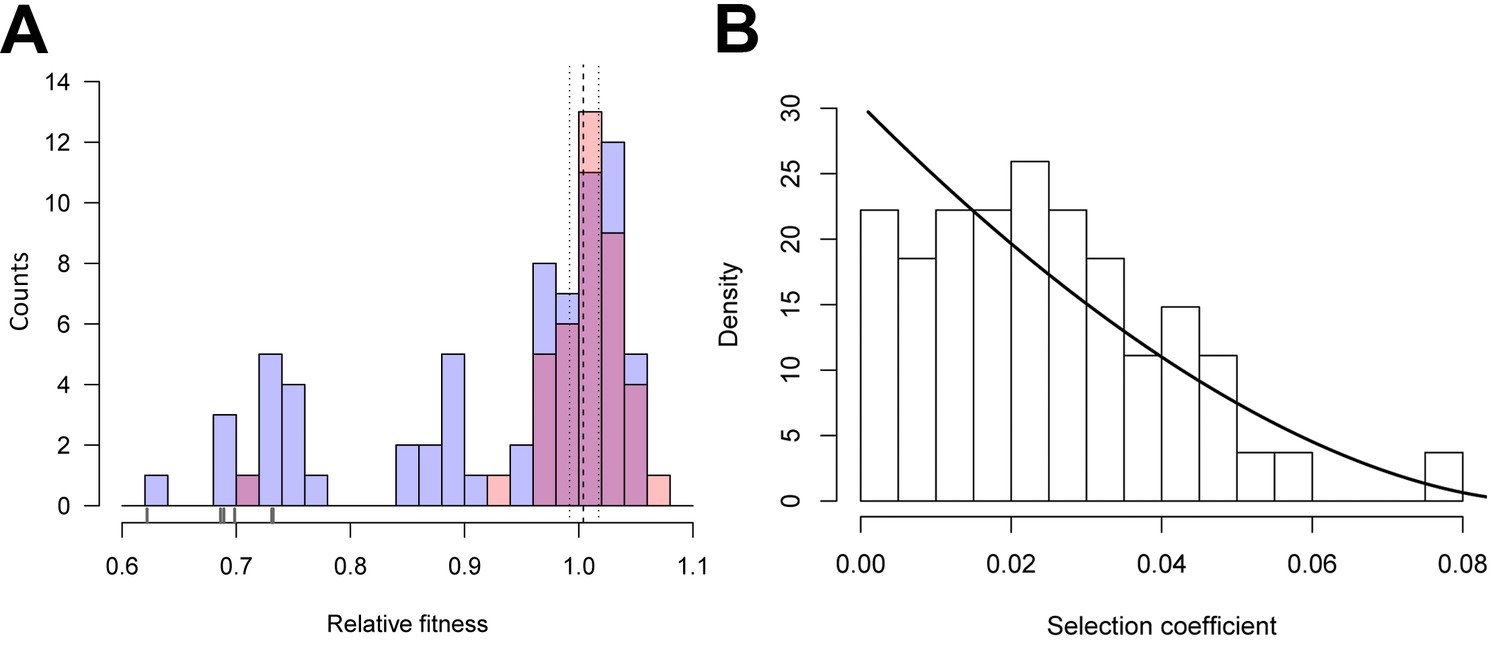
Distributions of relative fitness effects of gtsB point mutations in low glucose media.
(A) Counts of nonsynonymous (blue; n = 71) and synonymous (red; n = 39) mutations display a wide range of fitness effects, with ticks under the bars indicating the relative fitness values of nonsense mutations. Dashed and dotted lines show the mean relative fitness of the wild type (WT) competed against the marked competitor. (B) The DFE of beneficial-effect mutations (proportions; pooled synonymous and nonsynonymous samples, n = 55) is fit by a κ value of −0.35, which corresponds to the Weibull domain of attraction of the Generalised Pareto Distribution. On this normalised histogram (total area = 1), relative fitness values are shifted to the smallest observed value and expressed as selection coefficients. See Figure 1—source data 1.
-
Figure 1—source data 1
Relative fitness estimates from competitions.
The experimental fitness data found in this file were also used to create Figure 4.
- https://doi.org/10.7554/eLife.45952.003
-
Figure 1—source code 1
Analysis of distributions of fitness effects.
- https://doi.org/10.7554/eLife.45952.015
Figure 2 with 1 supplement

Comparison of transcriptional and translational effects of the evolved mutants and correlation with relative fitness.
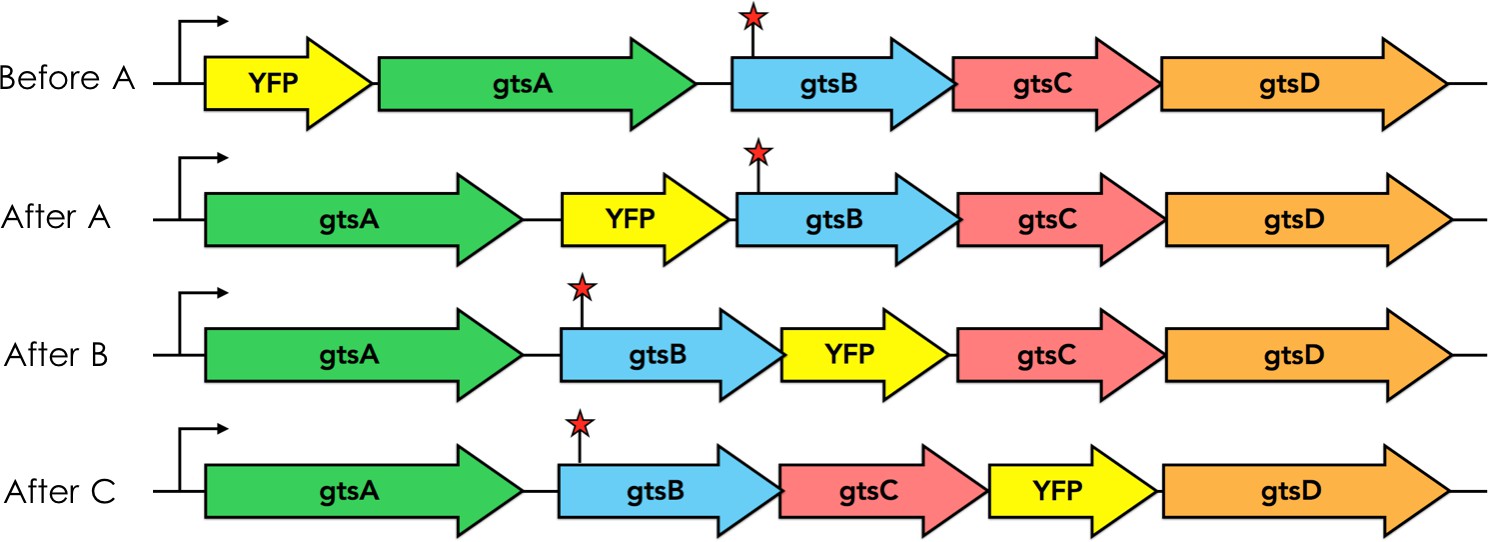
(A) The schematic shows the sites of YFP insertion for transcriptional and translational fusions. The plot compares maximum YFP expression (± SEM) from transcriptional and translational YFP fusions at the Tn7 site for the WT (n = 14 replicates) and evolved mutants (n = 7, 7, and six technical replicates, respectively). Significance with respect to transcriptional fusion: ***p<0.001. See Figure 2—source data 1. (B) Linear regression of fluorescent signal of YFP transcriptional fusions as a proxy for transcript levels and relative fitness measures for a subset of synonymous mutations (n = 27). Grey shading indicates the 95% confidence interval for the regression (adjusted R2 = 0.69, p<0.001). See Figure 2—source data 2. (C) Expression of transcriptional YFP fusions inserted across the gts operon of evolved mutants. Maximum fluorescence (± SEM) of the YFP transcriptional fusions at different loci in the gts operon relative to SBW25. See Figure 2—source data 3; YFP fusion positions are depicted in Figure 2—figure supplement 1. **p<0.01, ***p<0.001.
-
Figure 2—source data 1
YFP expression for transcriptional and translational fusions after gtsB at the Tn7 site.
- https://doi.org/10.7554/eLife.45952.006
-
Figure 2—source data 2
YFP expression for transcriptional fusions after gtsB in the native site for a subset of synonymous mutations.
- https://doi.org/10.7554/eLife.45952.007
-
Figure 2—source data 3
YFP expression for transcriptional fusions across the gts operon.
- https://doi.org/10.7554/eLife.45952.008
-
Figure 2—source code 1
Source code for Figure 2C: analysis of YFP expression and fitness.
- https://doi.org/10.7554/eLife.45952.016
Figure 2—figure supplement 1
Schematic depicting positions of YFP transcriptional fusions within the native gts operon.
https://doi.org/10.7554/eLife.45952.005
Figure 3 with 1 supplement
Potential mechanism for fitness differences at different loci in gtsB.
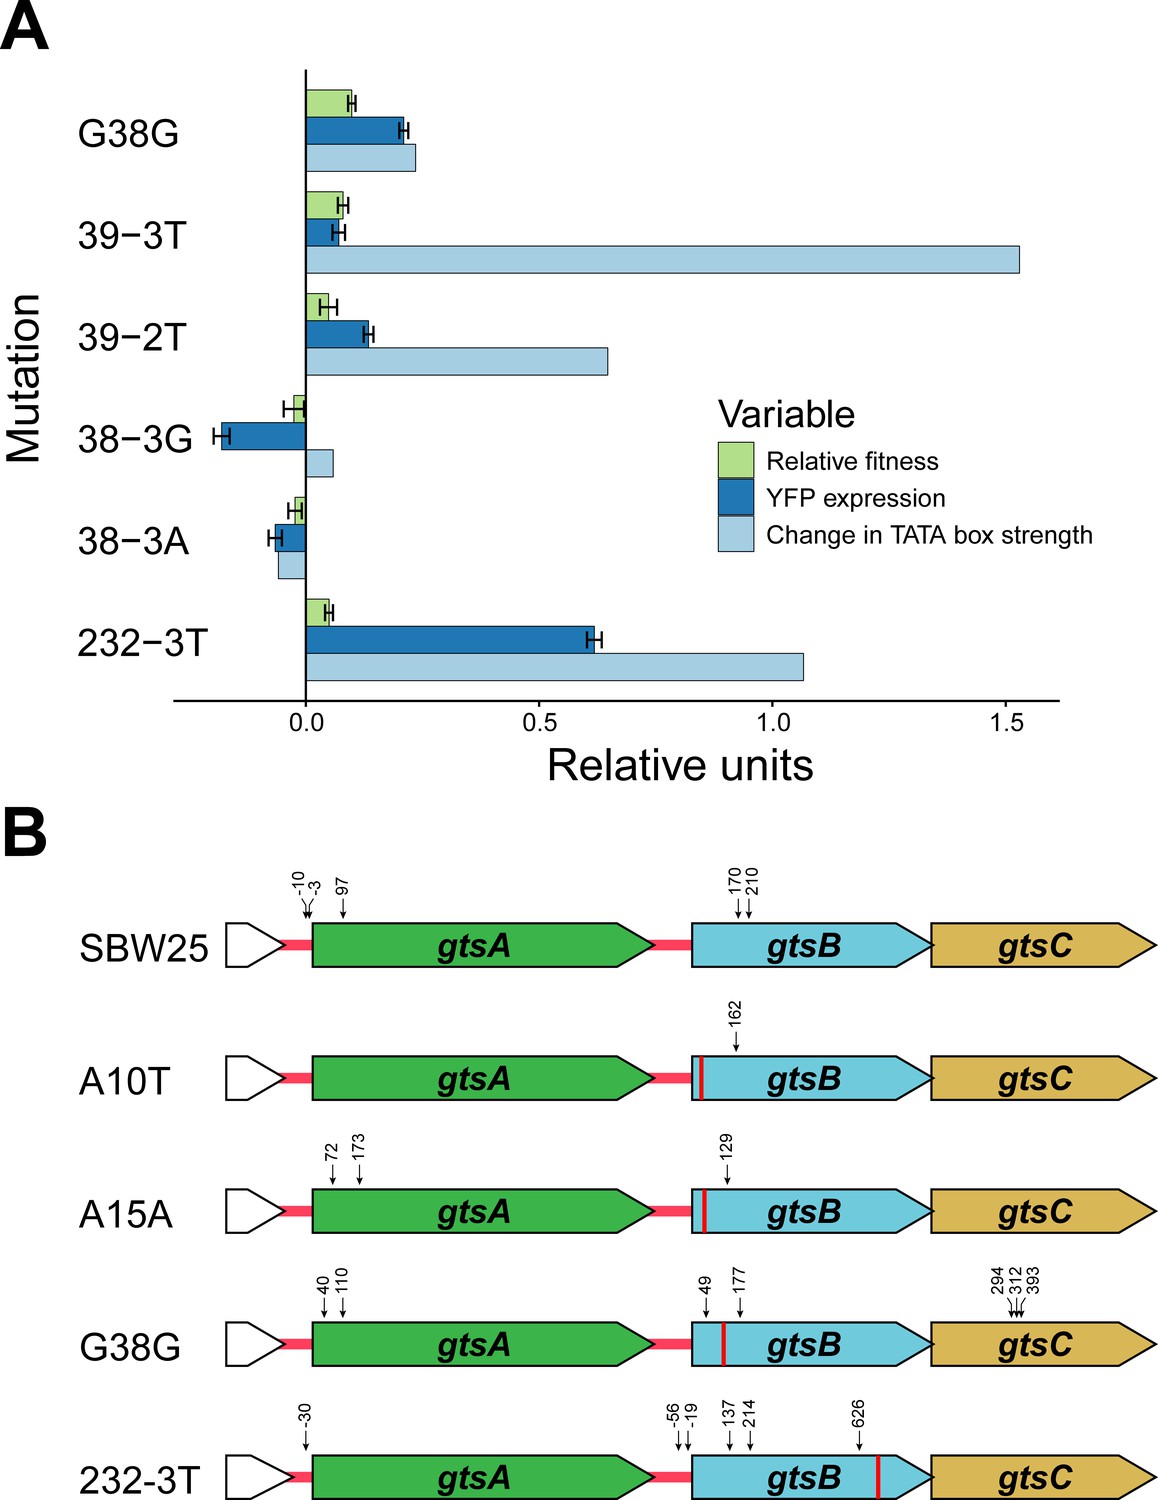
(A) Bars represent the mean of each variable in units relative to the WT. Experimental relative fitness and transcriptional expression of YFP measures include standard error. See Figure 3—source data 1. (B) Locations of potential transcriptional start sites in the gts operon are represented by vertical arrows. 5’ ends were identified by 5’ RACE analysis of RNA isolated from cultures of the wild type (SBW25) and four gtsB mutants. The location of each gtsB mutation is indicated by a red line, and the nucleotide distance from each 5’ end to the nearest start codon is given. See Figure 3—source data 2; sequence information for the 5’ RACE analysis is found in Figure 3—figure supplement 1.
-
Figure 3—source data 1
YFP, fitness and promoter strength data.
- https://doi.org/10.7554/eLife.45952.011
-
Figure 3—source data 2
5RACE experiment results.
- https://doi.org/10.7554/eLife.45952.012
-
Figure 3—source code 1
Analysis of promoter strength.
- https://doi.org/10.7554/eLife.45952.017
Figure 3—figure supplement 1
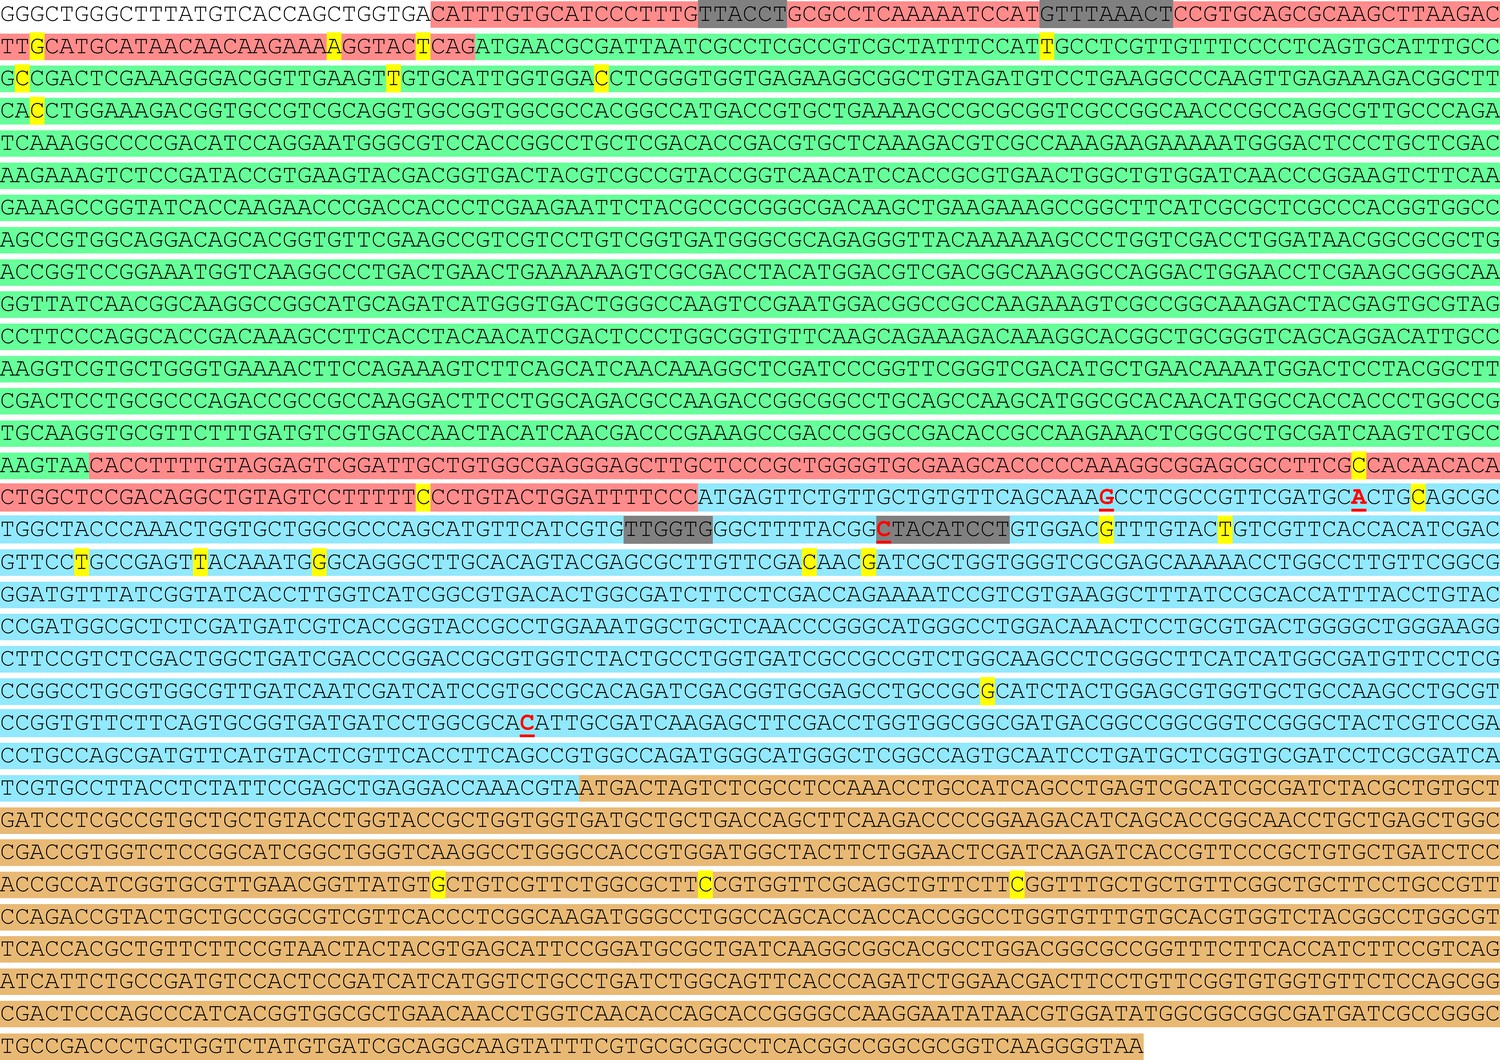
Locations of potential transcriptional start sites in the gts operon.
The precise nucleotide positions of the 5’ ends are highlighted yellow within the intergenic (pink) and coding sequences of gtsA (green), gtsB (blue), and gtsC (brown). Positions of gtsB mutations (A10T, A15A, G38G, and 232–3T) are in red text and underlined. Predicted promoter sites using Softberry’s BPROM prediction software are highlighted grey.
Figure 4
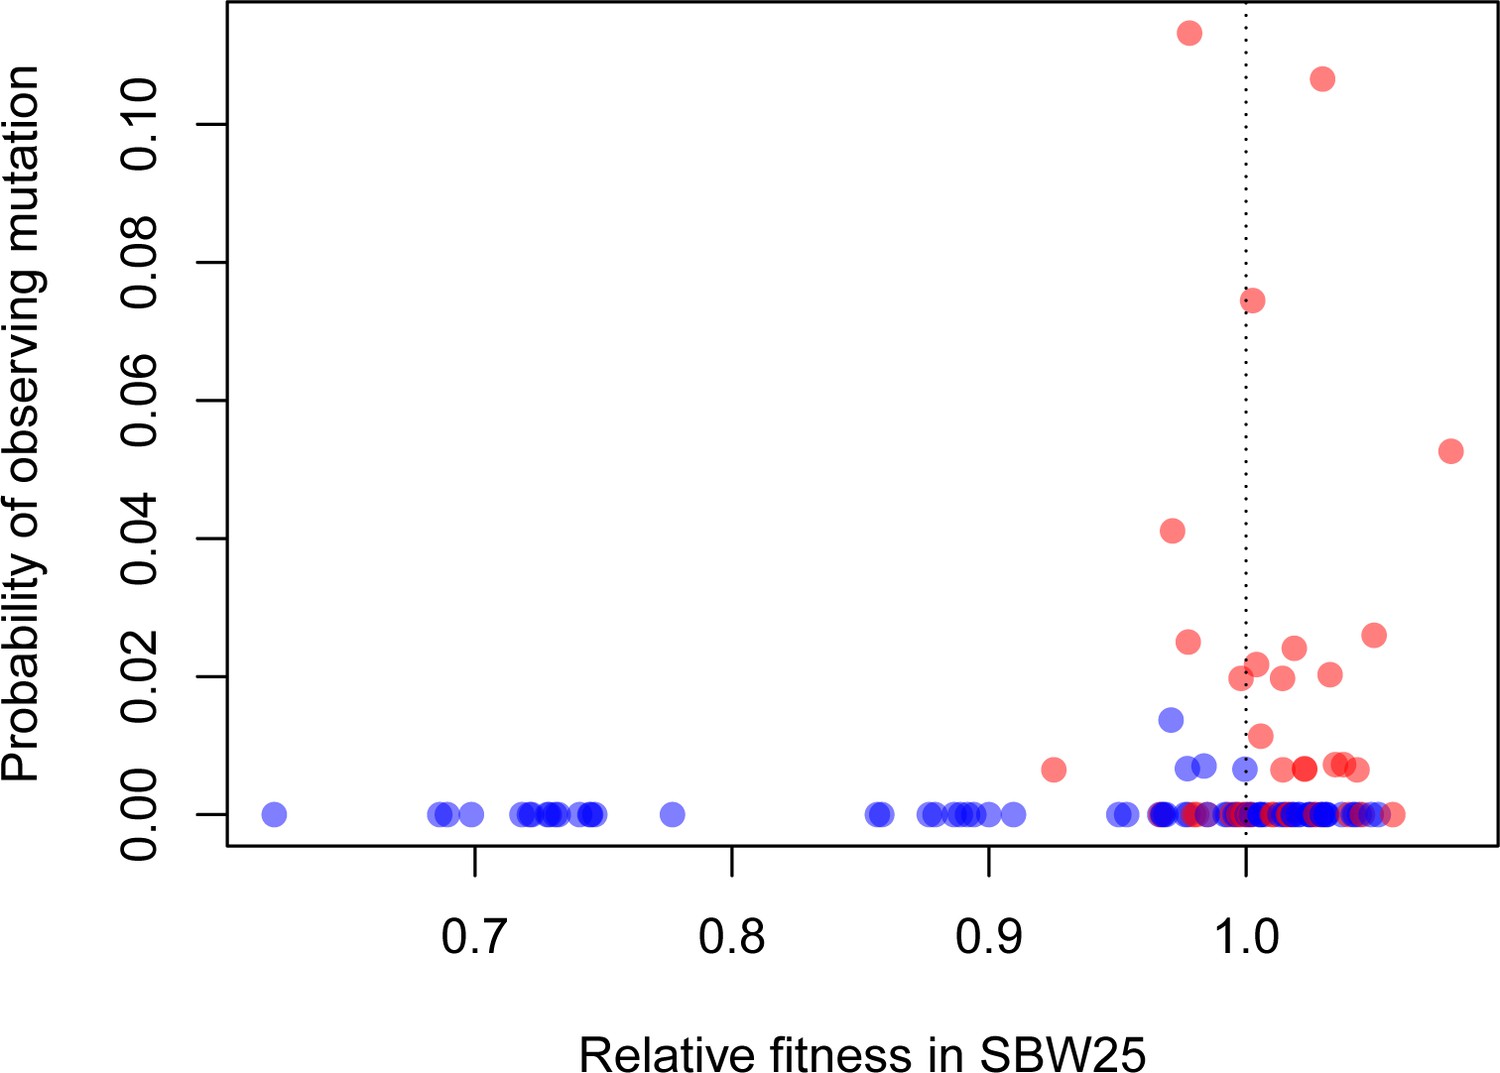
Beneficial synonymous mutations (red) are often observed in the phylogeny of related Pseudomonads, while nonsynonymous mutations are less so (blue).
There was a significant logarithmic relationship between the probability of observing a given mutation as a binary variable (present/absent) and relative fitness (p=0.0121).
-
Figure 4—source code 1
Phylogenetic analysis.
- https://doi.org/10.7554/eLife.45952.018
Tables
Key resources table
| Reagent type (species) or resource | Designation | Source or reference | Identifiers | Additional information |
|---|---|---|---|---|
| Strain, strain background (Pseudomonas fluorescens) | SBW25; wild type | PMID: 8564013 | Ancestral strain | |
| Strain, strain background (Pseudomonas fluorescens) | SBW25-lacZ | PMID: 17669526 | SBW25 with neutral chromosomal lacZ insertion | |
| Strain, strain background (Escherichia coli) | DH5α λpir | PMID: 11207743 | E. coli cloning strain | |
| Recombinant DNA reagent | pAH79 (plasmid) | PMID: 24912567 | P. fluorescens allelic exchange vector | |
| Recombinant DNA reagent | gtsB mutagenesis vector (plasmid) | This paper | pAH79 modified for Golden Gate Assembly of mutant gtsB alleles | |
| Genetic reagent (Pseudomonas fluorescens) | gtsB site-directed mutagenesis library | This paper | Collection of gtsB single nucleotide mutants in SBW25 background | |
| Recombinant DNA reagent | pUC18T-mini-Tn7T-Gm (plasmid) | PMID: 15908923 | GenBank: AY599232.2 | Source of mini-Tn7T-Gm transposon |
| Recombinant DNA reagent | pUC18T-mini-Tn7T-Gm-eYFP (plasmid) | PMID: 17406227 | GenBank: DQ493879.2 | Source of YFP |
| Genetic reagent (Pseudomonas fluorescens) | Mini-Tn7 gtsB-YFP transcriptional fusions | This paper | Transcriptional YFP fusions at SBW25 Tn7 site (see Figure 2A and B) | |
| Genetic reagent (Pseudomonas fluorescens) | Mini-Tn7 gtsB-YFP translational fusions | This paper | Translational YFP fusions at SBW25 Tn7 site (see Figure 2A) | |
| Genetic reagent (Pseudomonas fluorescens) | gts operon YFP transcriptional fusions | This paper | Transcriptional YFP fusions at sites within gts operon (see Figure 2C and Figure 2C—figure supplement 1) |
Table 1
Oligonucleotides used in this study.
Restriction enzyme recognition sequences are capitalised. BsaI overhangs are underlined. Introduced mutations are in bolded capital letters. Additional oligonucleotides used for site-directed mutagenesis are listed in Tables S1 and S2 of Supplementary file 1.
| Name | Sequence (5’ to 3’) | Function |
|---|---|---|
| F2-pUC19-BsaI | gcgAGATCTgtcgtGAGACCggtgatgacggtgaaaacct | gtsB mutagenesis vector construction |
| R3-pUC19-MfeI-SpeI | actgcgACTAGTCAATTGattaatgcagctggcacgac | gtsB mutagenesis vector construction |
| F-800Right | actgcgCAATTGagaccccggaagacatcag | gtsB mutagenesis vector construction |
| R-800Right | actgcgTCTAGAcattgcgaagttcaagcgta | gtsB mutagenesis vector construction |
| F2-gtsB-F | actgcgGGTCTCagtcgaaaagtcgcgacctacatgg | Conserved gtsB forward primer |
| R3-gtsB-R | actgcgGGTCTCctgccggaCaccacggtcggccagctc | Conserved gtsB reverse primer |
| 4845-M13F | GTAAAACGACGGCCAGTTCCGACAGGCTGTAGTCCTT | gtsB sequencing primer |
| R2-M13R-gtsB | GGAAACAGCTATGACCATGTGGTCCTCAGCTCGGAATA | gtsB sequencing primer |
| SP1 | ACCACACCGAACAGGAAGTC | 5’ RACE cDNA synthesis |
| B-SP2 | ACTGCGTCTAGAGACCAAGGTGATACCGATAAACA | 5’ RACE gtsB amplification |
| B-SP3 | ACTGCGTCTAGACGAACAAGGCCAGGTTTTT | 5’ RACE gtsB amplification |
| A-SP2 | ACTGCGTCTAGATTTCTTGTCGAGCAGGGAGT | 5’ RACE gtsA amplification |
| A-SP3 | ACTGCGTCTAGATTCTTCTTTGGCGACGTCTT | 5’ RACE gtsA amplification |
Additional files
-
Supplementary file 1
Sequences of gtsB mutagenesis primers are found in Tables S1 and S2.
- https://doi.org/10.7554/eLife.45952.019
-
Transparent reporting form
- https://doi.org/10.7554/eLife.45952.020
Download links
A two-part list of links to download the article, or parts of the article, in various formats.
Downloads (link to download the article as PDF)
Open citations (links to open the citations from this article in various online reference manager services)
Cite this article (links to download the citations from this article in formats compatible with various reference manager tools)
The distribution of fitness effects among synonymous mutations in a gene under directional selection
eLife 8:e45952.
https://doi.org/10.7554/eLife.45952


