CCN1 interlinks integrin and hippo pathway to autoregulate tip cell activity
- Research Institute of Pharmaceutical Sciences, College of Pharmacy, Kyungpook National University, Republic of Korea
- College of Natural Sciences, Kyungpook National University, Republic of Korea
- Korea University, Ansan Hospital, Republic of Korea
- POSTECH, Republic of Korea
- Chonnam National University Hospital, Korea
- DGIST, Republic of Korea
- Gachon University, School of Medicine, Republic of Korea
Figures
Figure 1 with 1 supplement
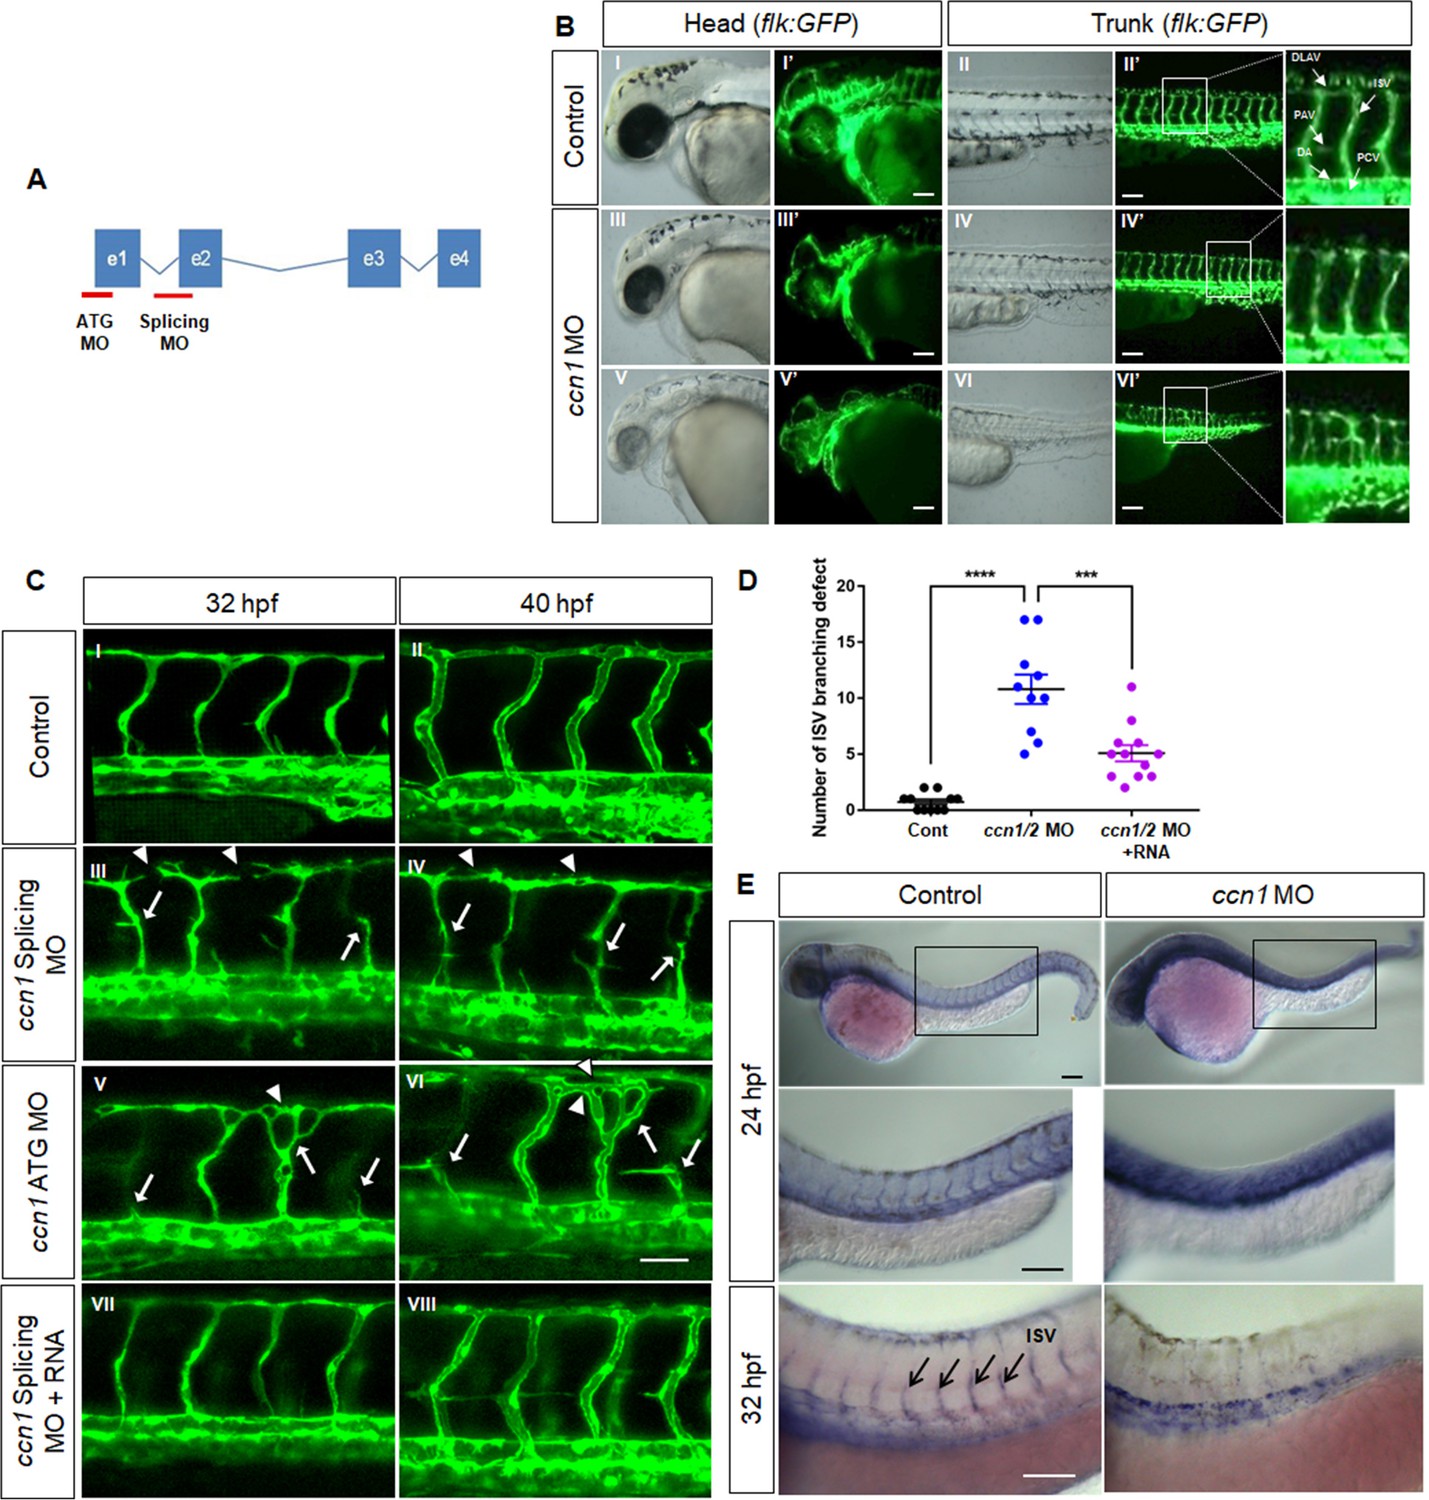
CCN1 knockdown induces defects in vessel migration and sprouting as well as identity of endothelial cells in zebrafish vascular development.
(A) Scheme showing ccn1 gene exon and intron. Morpholinos (MO) binding to ccn1 ATG starting site (ATG MO) and intron 1/exon two boundary region (Splicing MO) denoted as red lines were synthesised and injected into one-cell-stage zebrafish embryos. (B) Lateral view of Tg(Flk;EGFP) embryos in head and trunk regions of control (I–II for bright field, I′–II′ for dark field) and ccn1 morphants (MO) (III–VI for bright field, III′–VI′ for dark field) at 40 hpf. Arrows indicates sprouting vessels. Arrows indicate dorsolateral anastomose vessels (DLAV), intersegmental vessels (ISV), parachordal vessel (PAV), dorsal aorta (DA) and pericardial vein (PCV). The white square was enlarged and placed next to it. Scale bar = 25 µm (C) Anterior regions in trunk vessels were magnified at 32 and 40 hpf, in control, ccn1 MO-treated (III-VI) and ccn1 RNA rescued (VII-VIII) embryos. Arrows indicate misdirected or disconnected vessels and arrowheads do disconnected or abnormal DLAV. Scale bar = 50 µm. (D) Number of intersomitic vessel (ISV) defect were counted in each embryo and graphed. (F) Whole mount in situ hybridization was performed with control and ccn1 MO embryos at 24 hpf and 32 hpf with zFlk1 antisense probe. Purple colour shows expression of zFlk1 mRNA expression. Arrows indicates ISVs. Scale bar = 100 µm.
Figure 1—figure supplement 1

Arterio-venous identity was altered in ccn1 MO embryos.
In situ hybridization of Notch-1b and Flt-4 was performed at 32 hpf in control and ccn1 MO-injected zebrafish embryos. The expression of Notch-1b was normally in neural tube (NT), DA and ISV and Flt-4 was in PCV. However, in the ccn1 morphants, Notch-1b expression was markedly decreased at DA and ISV and Flt-4, venous markers, was expressed both in DA and PCV. Scale bar = 50 µm.
Figure 2
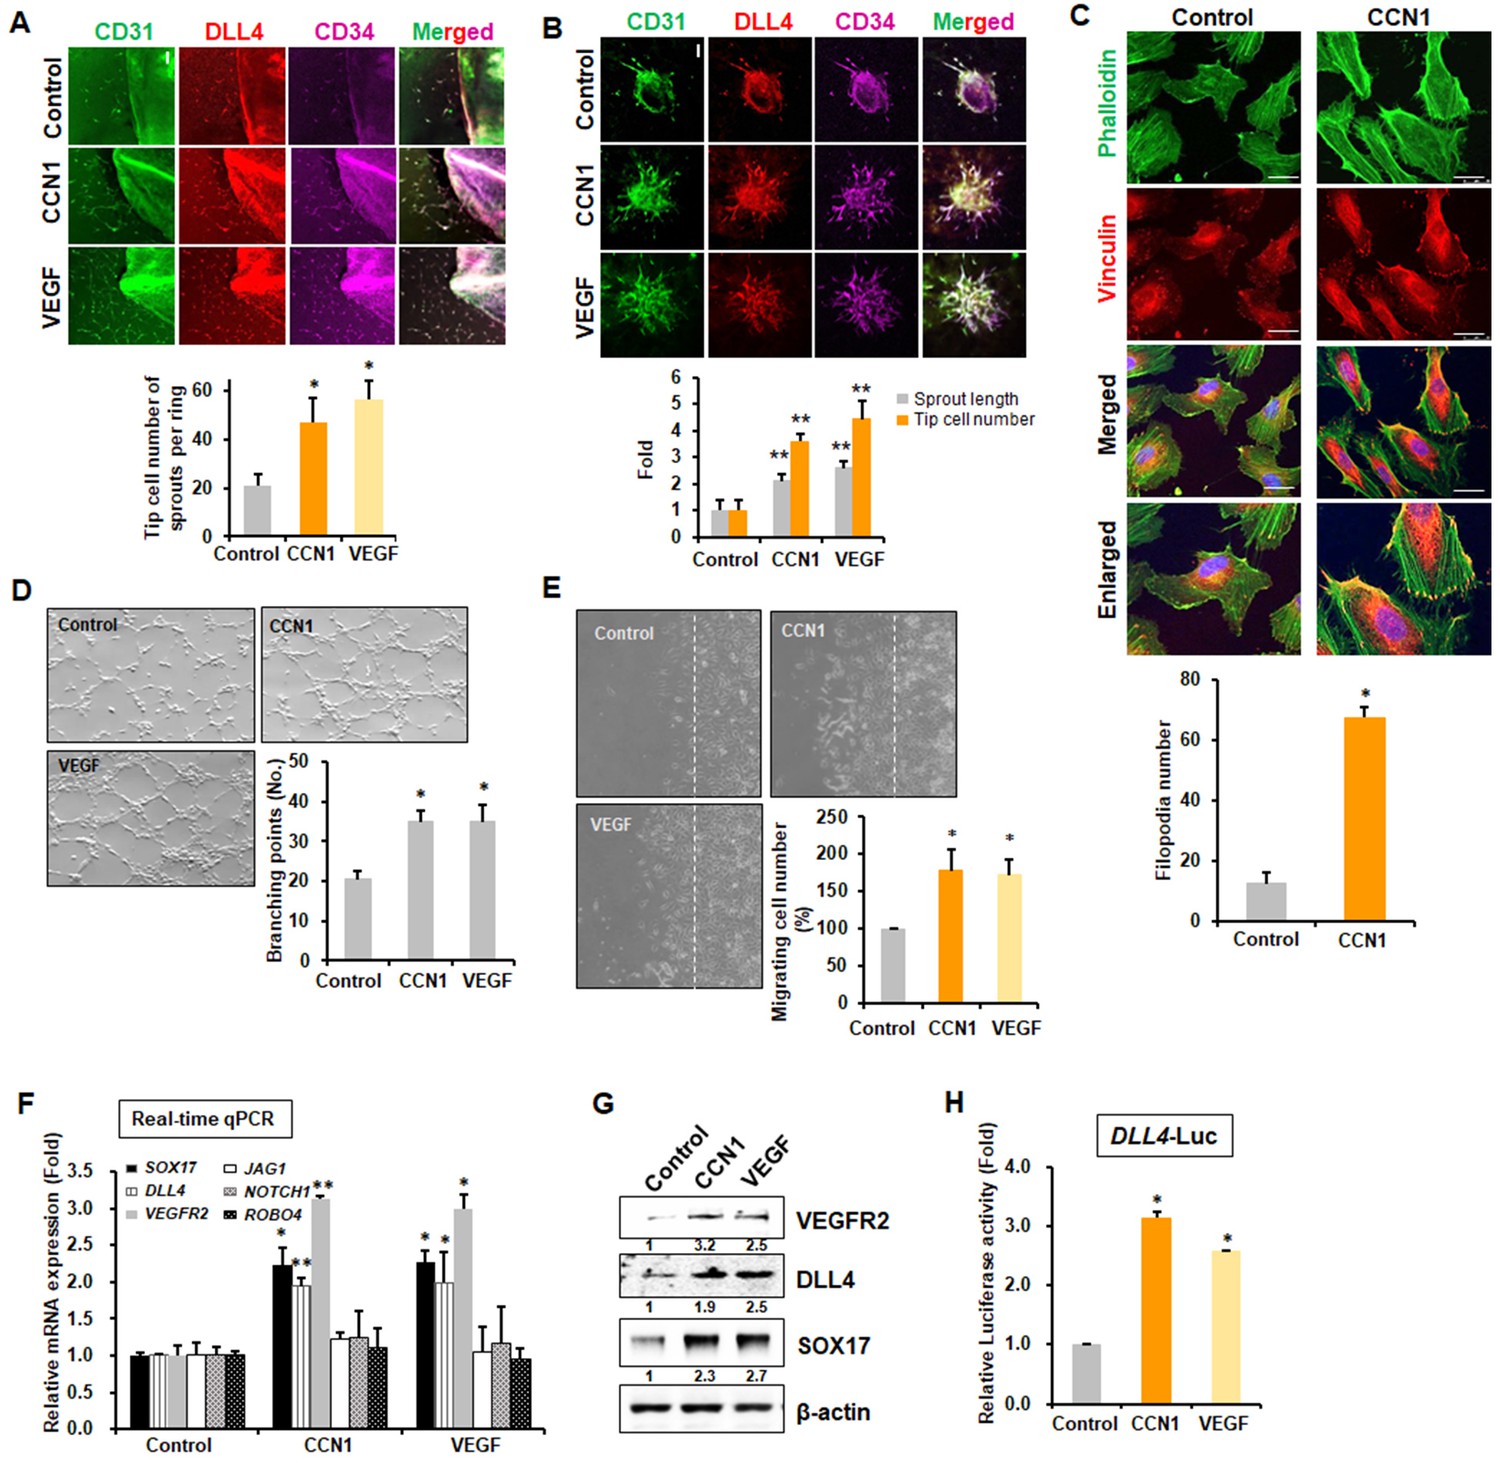
CCN1 stimulates tip cell activity in ECs.
(A) Mouse aorta isolated and cut at 6 weeks old, planted on Matrigel-coated plate and incubated for 7 days in presence or absence of CCN1 (10 ng/mL) or VEGF (10 ng/mL). Expression of CD31, DLL4, and CD34 were visualised with respective antibodies by the immunofluorescent assay under the confocal microscope. Tip cells expressing CD31+/DLL4+/CD34+ cells were counted and graphed. Three independent experiments were performed (n = 3/group). *p<0.05 vs control. Scale bar = 100 µm. (B) HUVEC spheroids were cultured in presence or absence of CCN1 (10 ng/mL) or VEGF (10 ng/mL) for 48 hr. Expression of CD31, DLL4, and CD34 were visualised with respective antibodies by the immunofluorescent assay under the confocal microscope. Length of sprout and tip cells expressing CD31+/DLL4+/CD34+ cells were counted and graphed (n = 3/group). **p<0.01 vs Control. Scale bar = 100 µm. (C) Filopodia number per field was counted in HUVEC cells treated with PBS (Control) or CCN1 (10 ng/mL) for 30 min and imaged using confocal microscope after staining with vinculin (red) and phalloidin (green). *p<0.0001 vs. Control. Scale bar = 25 µm. (D) Branching points of tubular networks were counted in HUVECs cultured in the presence or absence of CCN1 or VEGF for 48 hr (n = 3/group). Magnification = 40 × . *p<0.05 vs. control. (E) Confluent HUVECs were wounded and cultured in the presence or absence of CCN1 or VEGF for 6 hr. Migrating cells from wound line (dotted line) were counted (n = 3/group). Magnification = 40 × . *p<0.05 vs. control. (F) HUVECs were treated with CCN1 (10 ng/mL) or VEGF (10 ng/mL) for 24 hr, and total RNA was collected for real-time qRT-PCR analysis. Expression of tip cell marker genes (SOX17, DLL4, VEGFR2) and stalk cell marker genes (JAG1, NOTCH1, ROBO4) was analyzed. *p<0.05 or **p<0.01 vs. Control. (G) Western blotting analysis of VEGFR2, DLL4, and SOX17 protein levels in the same samples as used in F. β-actin was used as an internal control. Fold increase was indicated as a number below each band. (H) Luciferase assays in HUVECs transfected with DLL4-Luc reporter vector and treated with CCN1 or VEGF (10 ng/mL) for 24 hr. Luciferase activity was normalised to Renilla luminescence. *p<0.001 vs. Control.
-
Figure 2—source data 1
Source data for Figure 2G.
- https://doi.org/10.7554/eLife.46012.005
Figure 3 with 1 supplement

CCN1-VEGFR2-MAPK, PI3K-YAP/TAZ signalling involved in CCN1-mediated tip cell activation.
(A) Nuclear localization of YAP/TAZ in HUVECs treated with CCN1 at 5, 10, or 50 ng/mL for 1 hr. (B) Western blotting of LATS, YAP, and TAZ and their phosphorylated forms in HUVECs treated with CCN1 (10 ng/mL) for indicated times. Quantitation for phosphorylated protein level was normalised by each protein and graphed shown in right panel. *p<0.05 vs. Control. (C) Western blotting of phosphorylated VEGFR2 at tyrosine (Y)−1054/1059 and Y1175 in HUVECs treated with VEGF (10 ng/mL) or CCN1 (10 ng/mL) for 5, 10, 15, 30, or 60 min. β–actin was used as a loading control. (D) Western blotting of VEGFR2 phosphorylated at Y1054/1059 and Y1175 in HUVECs treated with VEGF (10 ng/mL) or CCN1 (0, 1, 5, or 10 ng/mL) for 30 min. β–actin was used as a loading control. (E) Western blotting of VEGFR2 phosphorylated at Y1054/1059 and Y1175 in HUVECs transfected with CCN1 siRNA. β–actin was used as a loading control. (F) Western blotting of phosphorylated or natural forms of p-ERK, p38 MAPK, and p85 PI3K in HUVECs were treated with VEGF or CCN1 (10 ng/mL) for 15 min. (G, H) DLL4 mRNA (G) and protein (H) levels in EA.hy926 cells treated with PBS (Control) or CCN1 (10 ng/mL) alone or together with MAPK kinase inhibitors PD98059, SP600125, or SB203580 (20 mM) or PI3K inhibitor LY294002 (20 mM) for 24 hr. *p<0.005 vs. Control, #p<0.0001 vs. CCN1. (I) Filopodia number per field was quantified after staining with anti-vinculin antibody (red) and phalloidin (green) in EA.hy926 cells treated with PBS (Control) or CCN1 (10 ng/mL) alone or together with PD98059 (20 mM), SP600125 (20 mM), SB203580 (20 mM), or LY294002 (20 mM) for 30 min. Scale bar = 10 µm. *p<0.0001 vs. Control, #p<0.0001 vs. CCN1. (J) Western blotting of indicated proteins in EA.hy926 cells treated with PBS (Control) or CCN1 (10 ng/mL) alone or together with PD98059 (20 mM), SB203580 (20 mM), or LY294002 (20 mM) for 1 hr. (K) CCN1 mRNA expression determined by qRT-PCR of total RNA obtained from the same groups as in G but treated with CCN1 for 24 hr. *p<0.005 vs. Control, #p<0.005 vs. CCN1. (L) Detection of DLL4, VEGFR, and CCN1 proteins in HUVECs treated with CCN1 (10 ng/mL) for 24 hr in the presence or absence of verteporfin (VP, 100 nM) for 24 hr. Fold changes were noted under each protein band in C-F, H, J and L.
-
Figure 3—source data 1
Source data for Figure 3B, C, D, E, F, H, J, L.
- https://doi.org/10.7554/eLife.46012.010
Figure 3—figure supplement 1

Knockdown of CCN1 decreased tip cell markers.
(A) After starved for 16 hr, HUVECs were treated with serum for 10, 30 and 60 min and lysed for Western blot analysis against CCN1. (B) After transfection with siVEGF, starved HUVECs were treated with CCN1 (10 ng/ml) for 1 hr and lysed for Western blot analysis. β–actin was used for loading control. (C) After transfection of two small interfering RNA of CCN1 in HUVECs, starved HUVECs were treated with CCN1 (10 ng/ml) for 1 hr and mRNA expression of CCN1, VEGFR2, DLL4 was measured by semiquantitative RT-PCR. β–actin was used for loading control. (D) Spheroid assays were performed with siCCN1 transfected HUVECs in the presence or absence of serum for 48 hr *p<0.05 vs, Control., #p<0.05 vs. serum only group (n = 3/group). (E) CCN1 activates STAT-1 and 3. HUVECs were treated with CCN1 (10 ng/ml) for indicated times and lysates were used for the detection of phosphorylated STAT-1 (left) and −3 (right) as well as native forms by western blot analysis. β–actin was used for loading control.
Figure 4

mDia1is essential for CCN1-induced Cdc42 activation in tip cell formation.
(A) HUVECs were treated with PBS (Control) or CCN1 (10 ng/mL) for 24 hr, and total RNA was used for the detection of DIAPH1 (mDia1) mRNA expression by qRT-PCR. *p<0.001 vs. Control. (B) After transfection with DIAPH1 WT full length and DIAPH1 double-negative mutant plasmids, HUVECs were treated with CCN1 and immunostained with anti-vinculin antibody (red) and phalloidin (green) to visualise filopodia. Scale bar = 10 µm. (C, D) HUVECs transfected with DIAPH1 WT full length and DIAPH1 double-negative mutant plasmids were treated with CCN1 (10 ng/mL) for 30 min, and active Cdc42 was assessed by western blotting analysis (C) and visualised by p-N-Wasp (D). Fold changes were noted under each protein band. (E) After HUVECs were transfected with DIAPH1 WT full length and DIAPH1 DN3 mutant plasmid, starved cells for 16 hr were treated with CCN1 10 ng/ml for 1 hr and detected YAP/TAZ by IF. Scale bar = 100 µm.
-
Figure 4—source data 1
Source data for Figure 4C.
- https://doi.org/10.7554/eLife.46012.012
Figure 5 with 1 supplement
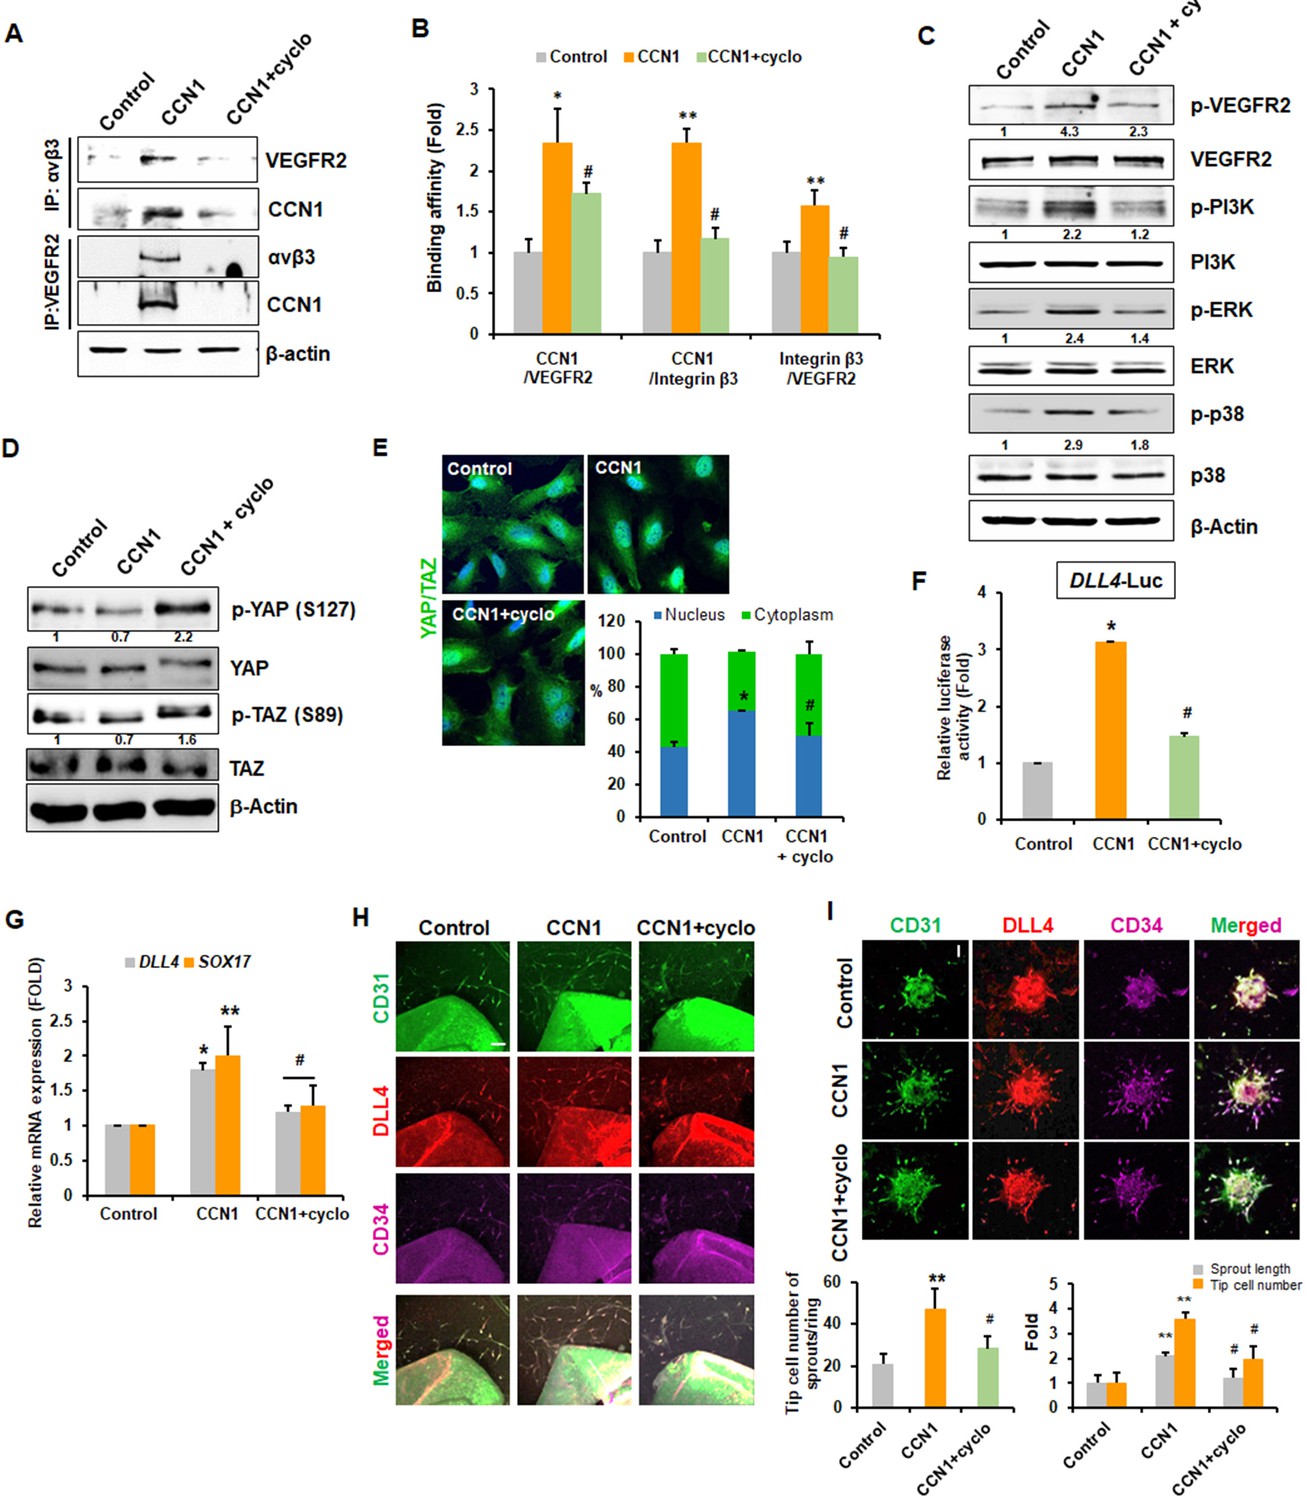
Tip cell properties are induced by CCN1 via interactions between integrin αvβ3 and VEGFR2.
(A) HUVECs treated with CCN1 (10 ng/mL) for 24 hr in the presence or absence of cyclo(RGDfK) (1 μg/mL) were used for IP and immunoblotting analyses to detect interactions between integrin αvβ3 and VEGFR2 or Cy61. β-actin was used as an internal loading control. (B) Proximity ligation assay was performed, and double-fluorescent microscopic images showing protein–protein interactions in cells were quantified. *p<0.01, **p<0.05 vs. Control, #p<0.01 vs. CCN1. (C, D) HUVECs were treated with CCN1 (10 ng/mL) for 30 min (C) or 1 hr (D) in the presence or absence of cyclo(RGDfK) (1 µg/mL), and western blotting was performed for the indicated proteins. Fold changes were noted under each protein band. (E) The same samples as in D were analysed for the nuclear localization of YAP/TAZ via IF. *p<0.05 vs. Control, #p<0.05 vs. CCN1. (F) HUVECs were transfected with DLL4-Luc reporter vector and treated with CCN1 (10 ng/mL) for 24 hr in the presence or absence of cyclo(RGDfK) (1 μg/mL). Luciferase activity was normalised to Renilla luminescence. *p<0.01 vs. Control, #p<0.01 vs. CCN1. (G) Total RNA was obtained from HUVECs treated with CCN1 (10 ng/mL) for 24 hr in the presence or absence of cyclo(RGDfK) (1 μg/mL). Expression levels of DLL4 and SOX17 mRNA were determined by qRT-PCR. *p<0.01, **p<0.05 vs. Control, #p<0.01 vs. CCN1. (H) Aortic sprouting assays were performed and determined after incubation with CCN1 (10 ng/mL) in the presence or absence of cyclo(RGDfK) for 7 days. Expression of CD31, DLL4, and CD34 were visualised with their antibodies by the immunofluorescent assay under the confocal microscope. Tip cells expressing CD31+/DLL4+/CD34+ cells were counted and graphed. Three independent experiments were performed (n = 3/group). *p<0.05 vs control. Scale bar = 100 µm. (I) Spheroid assays were performed with CCN1 (10 ng/mL) in the presence or absence of cyclo(RGDfK) for 48 hr. Expression of CD31, DLL4, and CD34 were visualised with their antibodies by the immunofluorescent assay under the confocal microscope. Length of sprout and tip cells expressing CD31+/DLL4+/CD34+ cells were counted and graphed (n = 3/group). Scale bar = 100 µm **p<0.001 vs. Control, #p<0.05 vs. CCN1 only.
-
Figure 5—source data 1
Source data for Figure 5C and D.
- https://doi.org/10.7554/eLife.46012.015
Figure 5—figure supplement 1
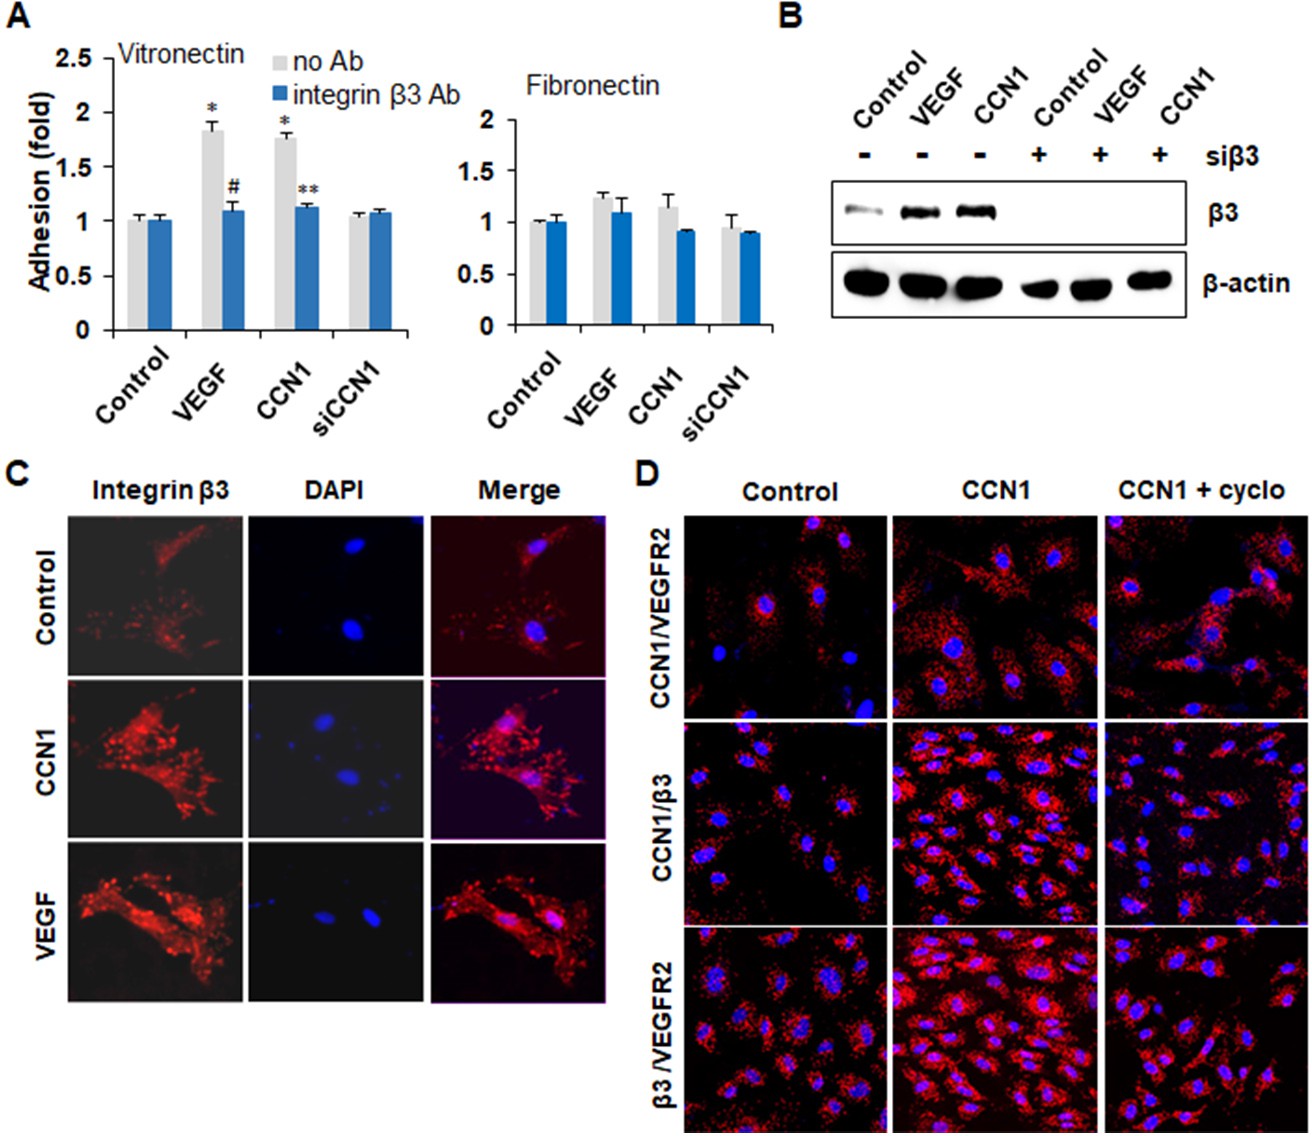
The involvement of integrin αvβ3 in CCN1-induced activation of EC.
(A) Starved HUVECs were allowed to adhere to vitronectin (left) and fibronectin (right) after treated with CCN1 (10 ng/ml) or VEGF (10 ng/ml) in the presence or absence of integrin β3 monoclonal antibody (Ab) for 45 min, washed with PBS and stained with Crystal violet for 10 min, lysed with 0.1% SDS and measured absorbance (O.D.) at 550 nm. *p<0.01 vs. control group, **p<0.01 vs. no Ab group. (B) HUVECs were transfected with small interfering RNAs targeting ITGB3 and then treated with CCN1 (10 ng/ml) or VEGF (10 ng/ml) for 24 hr. Cell lysates were immunoblotted with an anti-integrin β3 antibody. (C) Cells were stained with antibodies against integrin β3 followed by a rhodamine-labelled secondary antibody after treated with CCN1 (10 ng/ml) or VEGF (10 ng/ml) for 24 hr. Nuclei were stained with DAPI. (D) Proximity ligation assay was performed and double fluorescent microscopic images showing protein-protein interactions in cells.
Figure 6 with 2 supplements
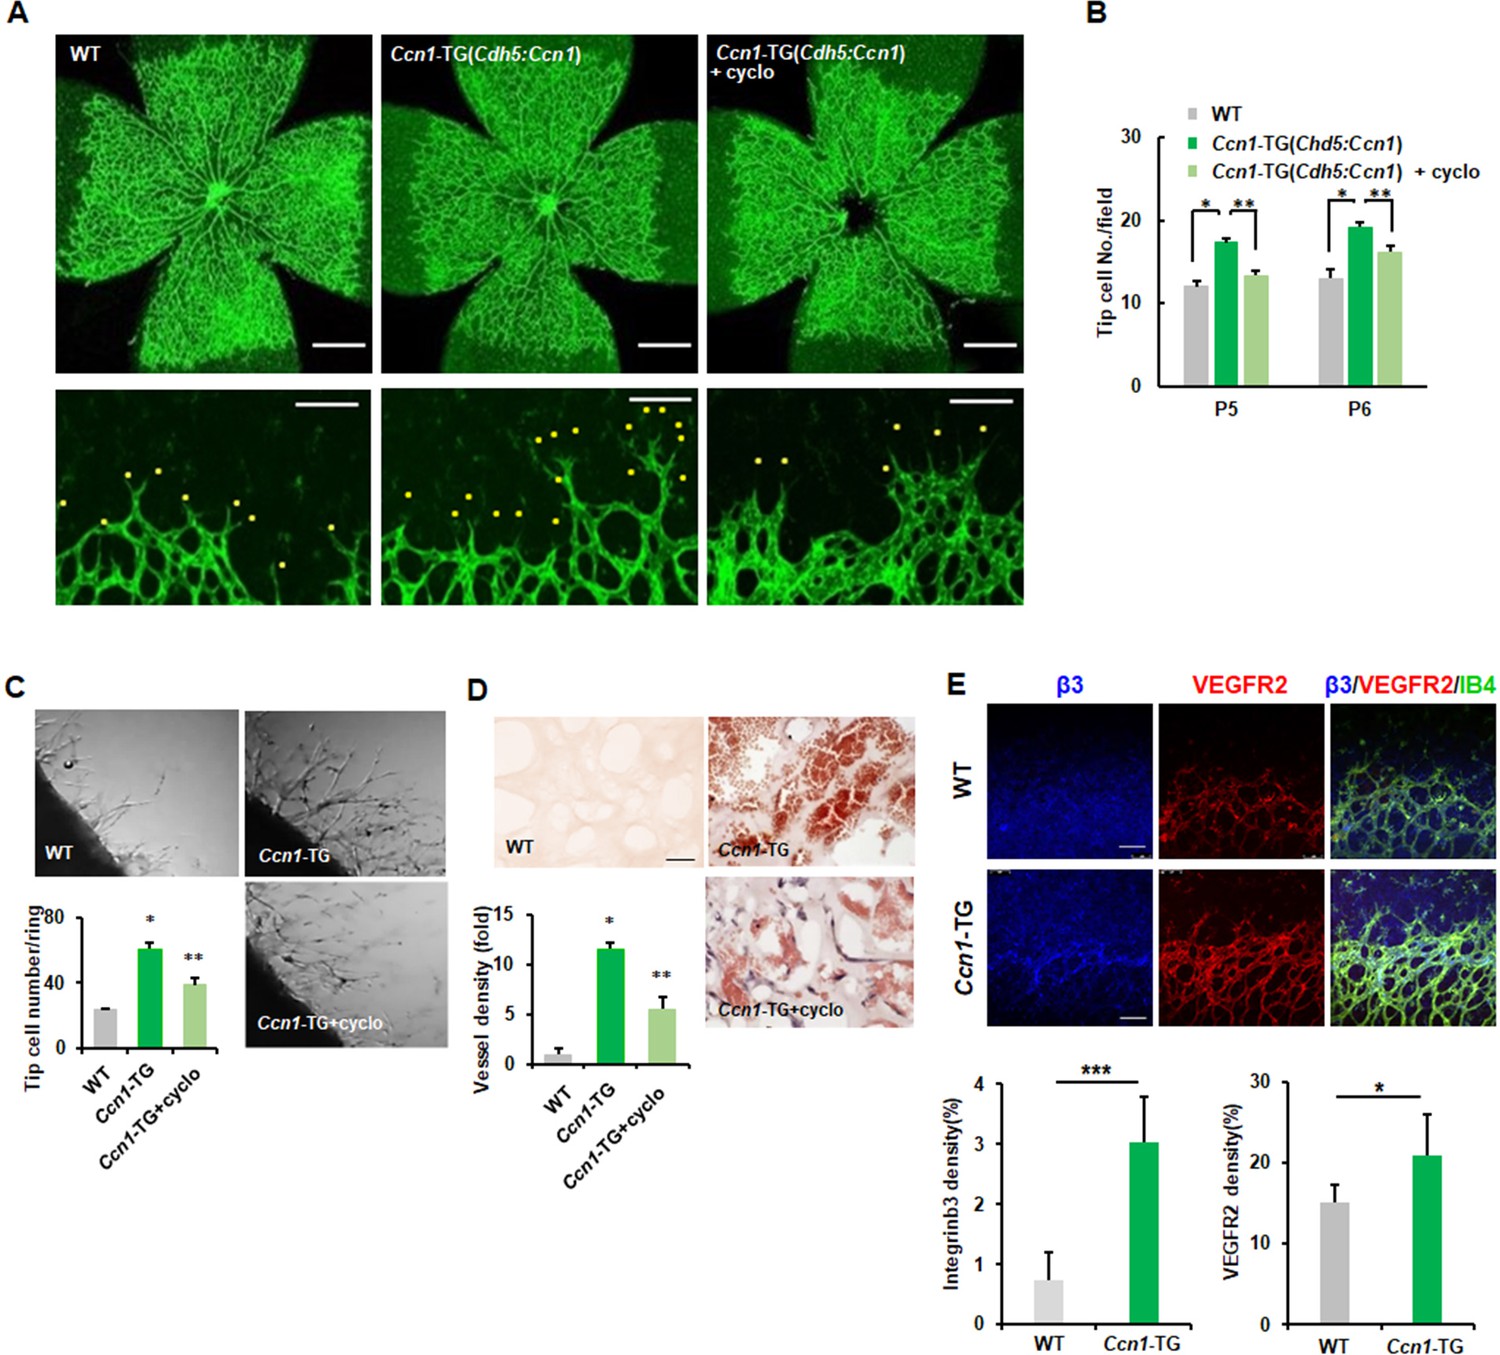
Endothelial CCN1 is crucial for sprouting angiogenesis.
(A, B) Whole mount retinas at postnatal day 5 (P5) stained with anti-IB4 antibody, allowing comparison of whole retina (upper) and peripheral retina ECs (lower) in WT and TG mice. Yellow dots represent sprouting tip cells. Tip cell number was counted and shown in B. Scale bar = 50 μm (upper) and 100 μm (lower). *p<0.001, **p<0.01. (C) Mouse aortas from WT and Ccn1-TG mice were plated on Matrigel-coated plates and treated with cyclo(RGDfK) (1 μg/mL). Tip cells among sprouting ECs were counted and graphed. Three independent experiments were performed (n = 3/group). Magnification = 5 × . (D) Matrigel was inoculated into flanks of WT or Ccn1-TG mice and treated with cyclo(RGDfK) (20 mg/kg). After 7 days, Matrigel plugs were isolated, sectioned, and stained with H and E. Magnification = 400 × . Scale bar = 100 μm. Vessel density was quantified and graphed. *p<0.001 vs. Control, **p<0.01 vs. TG. (E) Expression of integrin β3 and VEGFR2 was determined via immunofluorescence and quantified in P5 retinas of WT and Ccn1-TG mice. Scale bar = 50 μm. ***p<0.001, *p<0.05 vs. Control.
Figure 6—figure supplement 1
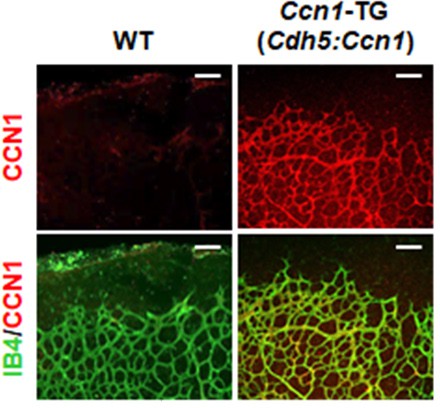
Whole mount retinas at postnatal day 5 (p5) stained with anti-IB4 and CCN1 antibody in WT and TG mice.
https://doi.org/10.7554/eLife.46012.017
Figure 6—figure supplement 2
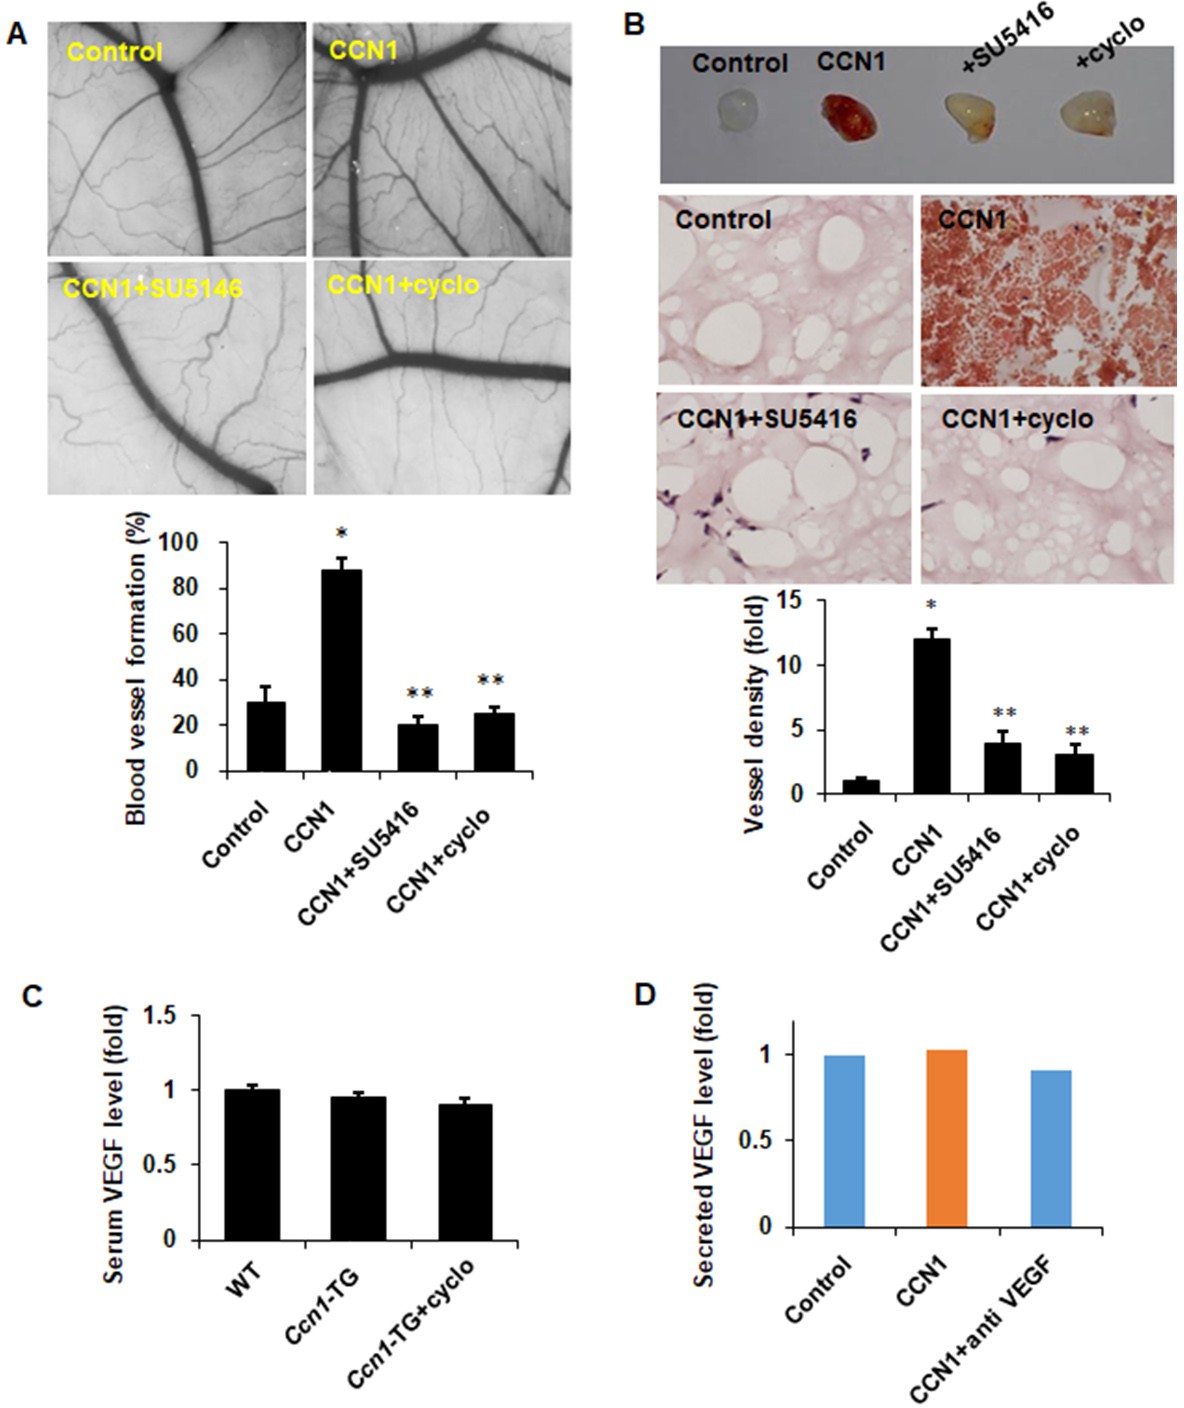
CCN1 induces in vivo angiogenesis.
(A) CCN1 (10 ng/ml) in the presence or absence of cyclo(RGDfK) or SU5416 (1 μg/ml) were applied to the ED 4.5 CAM for two days, neovessel formation from the large vessels was observed, and percentages of positive angiogenic eggs (from total eggs tested) were calculated (n = 6). Magnification = Х 5. *p<0.01 vs. control group, **p<0.01 vs. CCN1 group. (B) Matrigel was treated with CCN1 (10 ng/ml) in the presence or absence of cyclo(RGDfK) or SU5416 (1 μg/ml) and inoculated in the flank of C57BL/6J mice. After 7 days matrigel plug was isolated, sectioned and stained with H and E. Magnification = Х 400. Vessel density was quantified and graphed. (C) Plasma VEGF from WT, Ccn1 TG and cyclo(RGDfK)-treated Ccn1 TG mice at postnatal day 5 (P5) were measured by ELISA. (D) HUVECs were treated with serum-reduced culture media containing CCN1 for 24 hr. Media supernatant was collected, and secreted VEGF was determined by ELISA after removal of cellular debris.
Figure 7 with 1 supplement
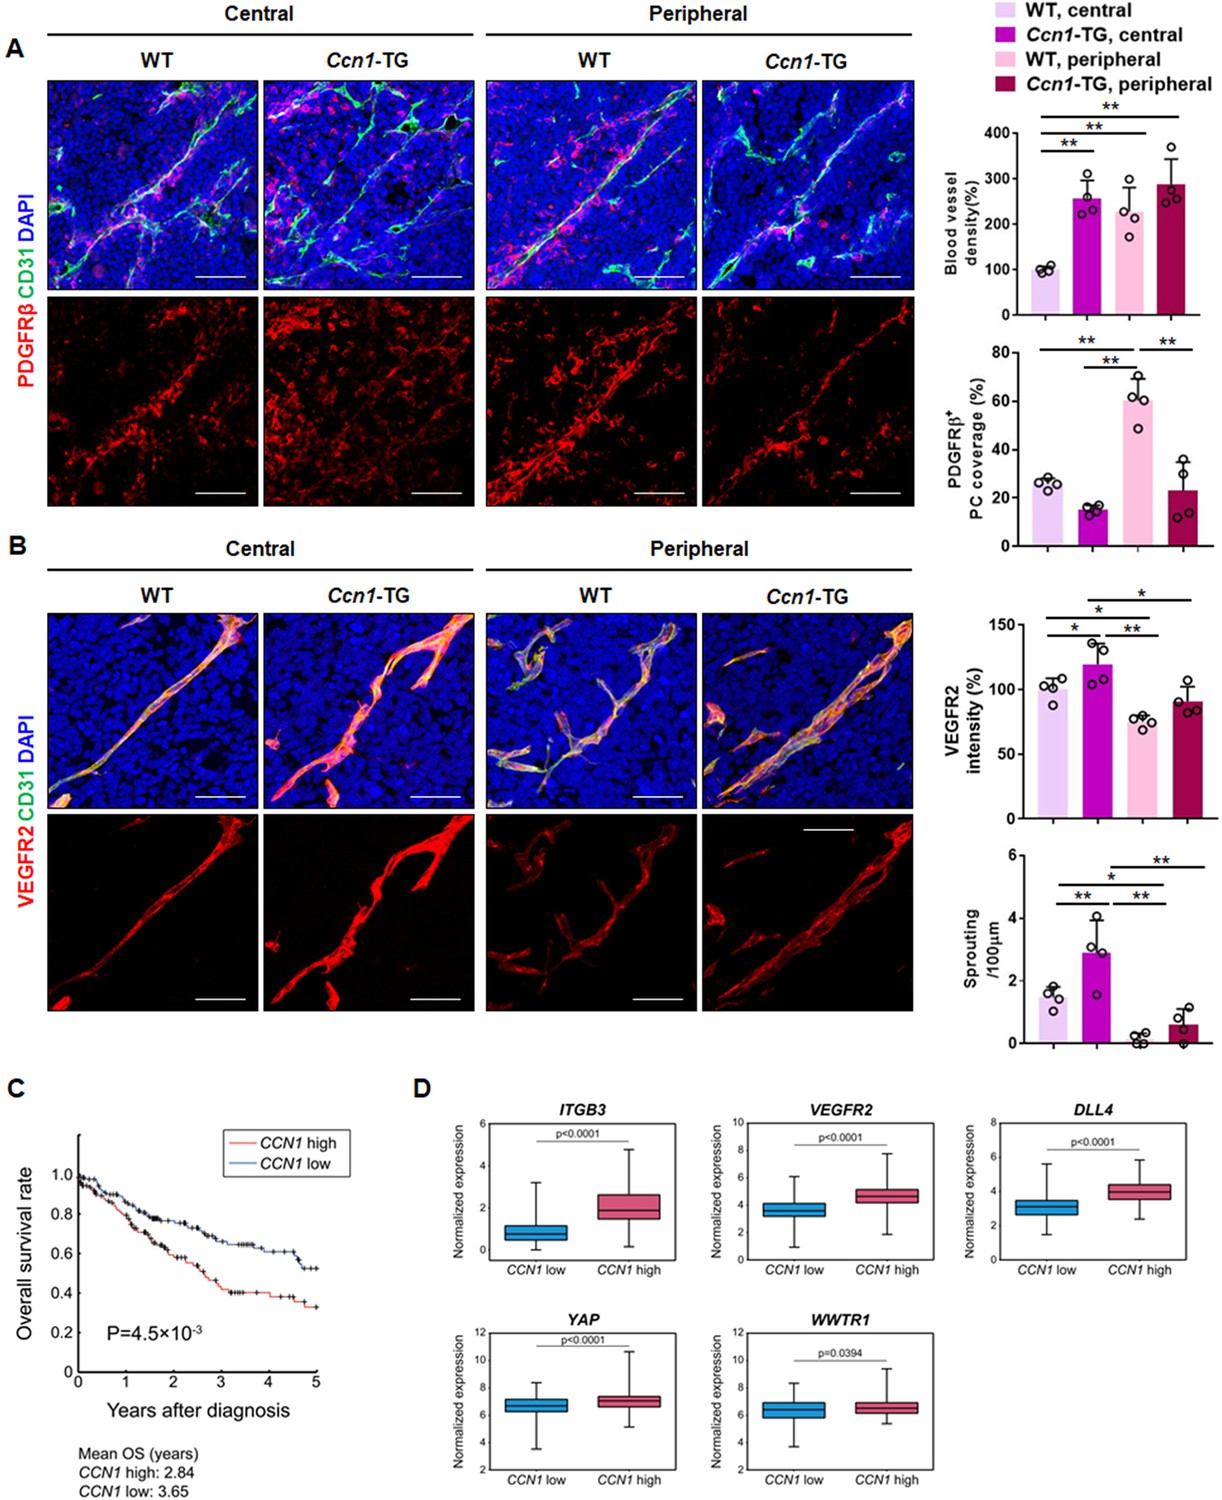
Role of CCN1 in pathological angiogenesis and clinical correlation with integrin/Hippo pathway.
(A) LLC allograft tumour tissues in WT and Ccn1-EC-specific TG mice were extracted at 10 days after inoculation, sectioned, and immunostained with anti-CD31 and anti-PDGFβ antibodies and green and red fluorescently labelled secondary antibodies. Stained cells were quantified in the central and peripheral regions. Scale bar = 100 µm. *p<0.05, **p<0.01. (B) The same sectioned tissues as in (A) immunostained with anti-VEGFR2 and CD31. Quantitation was performed in the central and peripheral regions of the tissues. The number of sprouting sites was normalised to the total vessel length. Scale bar = 50 µm. *p<0.05, **p<0.01. (C) The difference in the survival curves of the two groups, CCN1 high (red line) and CCN1 low (blue line) 25% of patients with highest and lowest mRNA expression levels, respectively, n = 126/group] was evaluated using log-rank test with Kaplan–Meier estimation. p=8.7 × 10⁻³ between two groups. (D) Box plots of normalised mRNA expression levels of ITGB3, VEGFR2, DLL4, YAP, and WWTR1 in CCN1-high and CCN1-low groups.
Figure 7—figure supplement 1

Negative correlation between mRNA expression levels of CCN1 and patient survival in several cancer.
(A, C) Difference in the survival curves of the two groups [CCN1 high (red line) and CCN1 low (blue line), 25% of patients with highest and lowest mRNA expression levels, respectively, n = 126/group] was evaluated using log-rank test with Kaplan–Meier estimation. P values between two groups are shown. (B, D) Box plots of normalised mRNA expression levels of ITGB3, VEGFR2, DLL4, YAP, and WWTR1 in CCN1-high and CCN1-low groups. The statistical significance of difference between the two groups was determined by Student’s t-test. (E) The correlation of mRNA expression levels between nine angiogenesis marker genes and CCN1 in three cancers (LUSC, BLCA, and STAD) estimated by Spearman’s rank correlation (Spearman’s rho). Spearman’s rho of 1 and −1 represent perfect positive and negative rank correlation between two mRNA expression profiles, respectively. To evaluate the statistical significance of positive correlation in mRNA expression levels, we performed empirical testing (described in Materials and Methods). *p<0.05 and **p<0.01. (F–H) Difference in age (F), gender (G) and stage of cancers (H) at diagnosis between CCN1 high and CCN1 low groups. The statistical significance for the difference was determined by Student’s t-test (age at diagnosis) or Fisher’s exact test (gender and stage of cancers). P-values for the significance are shown.
Figure 8
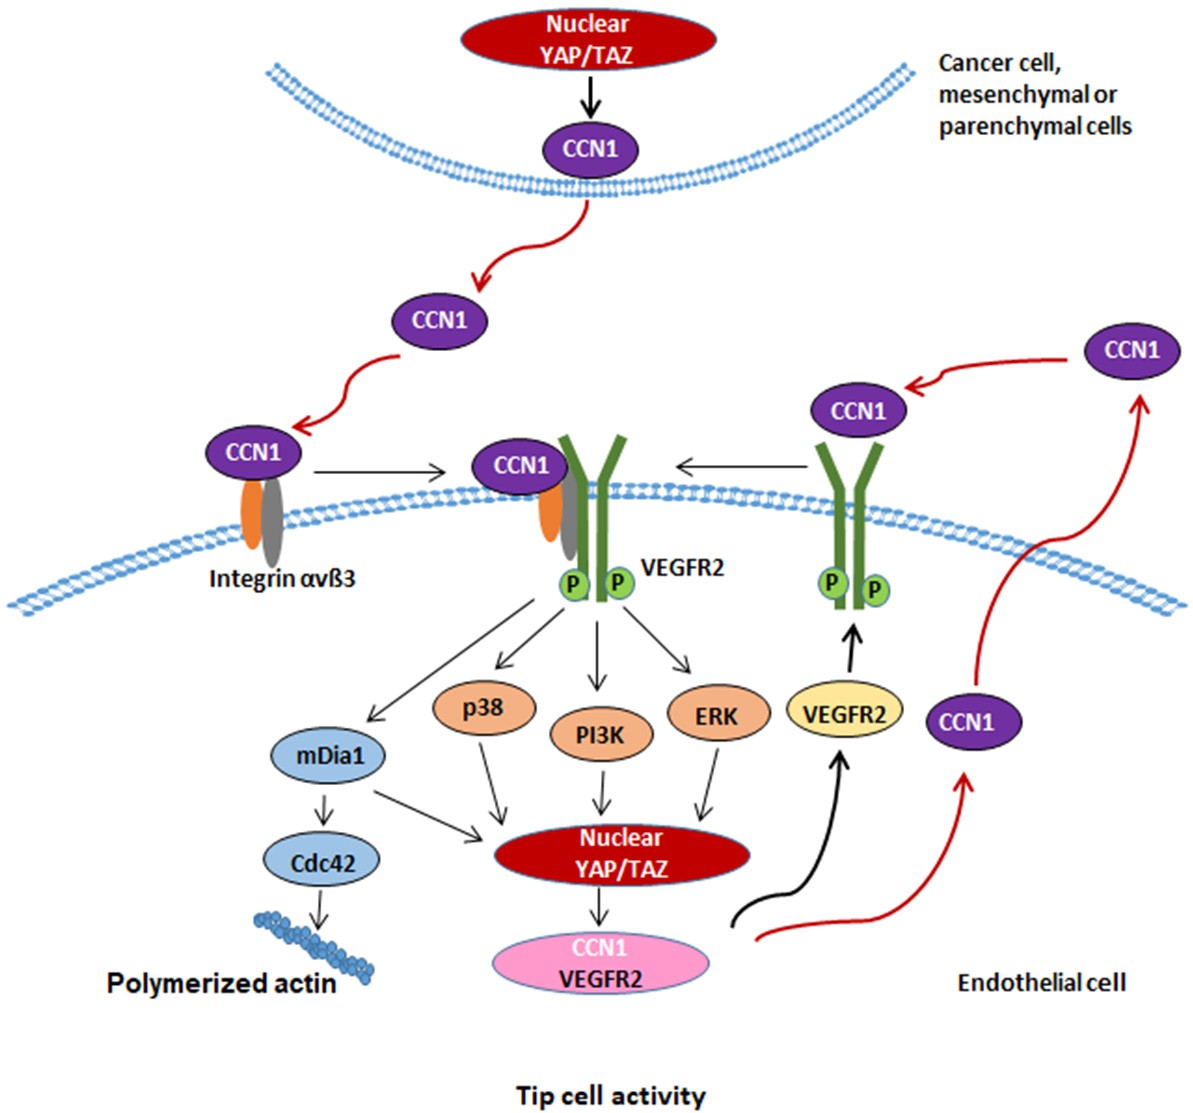
Schematic diagram depicting CCN1 induction of tip cell identity through interplay of integrin αvβ3/VEGFR2 with Hippo pathway.
CCN1 in the milieu is sensed by ECs by binding to membrane integrin αvβ3 and VEGFR2 receptors, thus activating the MAPK and PI3K-YAP/TAZ signalling pathways, leading to activation of YAP/TAZ. YAP/TAZ transfer to the nucleus facilitates transcriptional regulation of CCN1, which may sustain the CCN1-VEGFR2-MAPK, PI3K-YAP/TAZ signalling circuit for maintaining tip cell activity in ECs. In addition, CCN1-induced mDia1 is necessary for YAP/TAZ activation and leads to induce filopodia formation through increased Cdc42 Rho GTPase activity.
Videos
Video 1
CCN1 promoted EC migration.
https://doi.org/10.7554/eLife.46012.006
Video 2
CCN1 promoted EC migration.
https://doi.org/10.7554/eLife.46012.007Tables
Key resources table
| Reagent type(species) or resource | Designation | Source or reference | Identifiers | Additional information |
|---|---|---|---|---|
| Antibody | anti-Flk1(VEGFR2) (A-3) (Mouse monoclonal) | Santa Cruz | sc6251 RRID:AB_628431 | WB(1:1000) |
| Antibody | anti-DLL4(H-70) (Rabbit polyclonal) | Santa Cruz | sc28915 RRID:AB_2092978 | WB(1:1000) |
| Antibody | anti-Sox17 (Goat polyclonal) | R and D Systems | AF1924 RRID:AB_355060 | WB(1:1000) |
| Antibody | anti-p-VEGFR2 (Tyr1059)(D5A6) (Rabbit monoclonal) | Cell Signalling | 3817 RRID:AB_2132351 | WB(1:1000) |
| Antibody | anti-p-VEGFR2 (Tyr1175) (19A10) (Rabbit monoclonal) | Cell Signalling | 2478 RRID:AB_331377 | WB(1:1000) |
| Antibody | anti-p-ERK1/2 (Thr202/Tyr204) (197G2) (Rabbit monoclonal) | Cell Signalling | 4377 RRID:AB_331775 | WB(1:1000) |
| CyeAntibody | anti-ERK1/2 (137F5) (Rabbit monoclonal) | Cell Signalling | 4695 RRID:AB_390779 | WB(1:1000) |
| Antibody | anti-p-p38 (Thr180/Tyr182) (Rabbit polyclonal) | Cell Signalling | 9211 RRID:AB_331641 | WB(1:1000) |
| Antibody | anti-p38 (A-12) (Mouse monoclonal) | Santa Cruz | sc7972 RRID:AB_620879 | WB(1:1000) |
| Antibody | anti- p85α (Z-8) (rabbit polyclonal) | Santa Cruz | sc423 RRID:AB_632211 | WB(1:1000) |
| Antibody | anti- p-PI3-kinase p85 α (Tyr 508) (goat polyclonal) | Santa Cruz | sc12929 RRID:AB_2252313 | WB(1:1000) |
| Antibody | anti-CCN1 (Rabbit polyclonal) | Abcam | Ab24448 RRID:AB_2088724 | WB(1:1000) IHC (1:200) |
| Antibody | anti-CCN1 (Rabbit polyclonal) | Novus Biologicals | NB100-356 RRID:AB_10000986 | (1:1000) neutralization |
| Antibody | anti-integrin αvβ3 (Mouse monoclonal) | Novus Biologicals | NB600-1342 RRID:AB_10003443 | WB(1:1000) |
| Antibody | anti-p-STAT-3 (Tyr705) (D3A7) (Rabbit monoclonal) | Cell signalling | 9145 RRID:AB_2491009 | WB(1:1000) |
| Antibody | anti-p-STAT1(Tyr701) (58D6) (Rabbit monoclonal) | Cell signalling | 9167 RRID:AB_561284 | WB(1:1000) |
| Antibody | anti-STAT3 (79D7) (Rabbit monoclonal) | Cell signalling | 4904 RRID:AB_331269 | WB(1:1000) |
| Antibody | anti-STAT1 (Rabbit polyclonal) | Cell signalling | 9172 RRID:AB_2198300 | WB(1:1000) |
| Antibody | anti-p-YAP (Ser127) (Rabbit polyclonal) | Cell signalling | 4911 RRID:AB_2218913 | WB(1:1000) |
| Antibody | anti-YAP/TAZ (D24E4) (Rabbit monoclonal) | Cell signalling | 8418 RRID:AB_10950494 | WB(1:1000) |
| Antibody | anti-p-LATS1 (Thr1079)(D57D3) (Rabbit monoclonal) | Cell signalling | 8654 RRID:AB_10971635 | WB(1:1000) IF (1:200) |
| Antibody | anti-LATS1(C66B5) (Rabbit monoclonal) | Cell signalling | 3477 RRID:AB_2133513 | WB(1:1000) |
| Antibody | Alexa-488–conjugated anti-isolectin B4 | Invitrogen | I21411 RRID:AB_2314662 | IHC (1:200) |
| Antibody | anti-VEGF (Goat polyclonal) | R and D Systems | AF564 RRID:AB_2212821 | (1:1000) neutralization |
| Antibody | anti-vinculin (EPR8185) (Rabbit monoclonal) | Abcam | ab196579 RRID:AB_2810877 | IF (1:200) |
| Antibody | Cdc42 (Mouse monoclonal) | Cell signalling | 8747 RRID:AB_2810881 | WB(1:1000) |
| Antibody | Integrin β3 blocking IgG (Mouse monoclonal) | Millipore | MAB1976 RRID:AB_2296419 | Neutralization |
| Antibody | Anti-GFP (B-2) (Mouse monoclonal) | Santa Cruz | sc9996 RRID:AB_627695 | WB(1:1000) |
| Antibody | anti-CD31 (Mouse monoclonal) | BD Biosciences | 553370 RRID:AB_2638986 | IF (1:200) |
| Antibody | Anti-CD34 (Rabbit polyclonal) | Boster | PA1334 RRID:AB_2810878 | IF (1:200) |
| Antibody | Anti-DLL4 (Rat-monoclonal) | R and D systems | MAB1389 RRID:AB_2092985 | IF (1:200) |
| Other | Alexa-488-phalloidin | Invitrogen | A12379 | IHC (1:200) |
| Chemical compound, drug | JNK Inhibitor II anthra[1,9 cd]pyrazol-6(2H)-one-1,9-pyrazoloanthrone (SP600125) | Calbiochem | 420119 | |
| Chemical compound, drug | P38 MAP Kinase Inhibitor 4-(4-fluorophenyl)−2-(4-methylsulfinylphenyl)−5-(4-pyridyl)1H-imidazole (SB203580) | Calbiochem | 559389 | |
| Chemical compound, drug | 2′-amino-3′-methoxyflavone (PD98059) | Calbiochem | 513000 | |
| Chemical compound, drug | 2-(4-morpholinyl)−8-phenyl-4H-1-benzopyran-4-one (LY294002) | Calbiochem | 440202 | |
| Chemical compound, drug | Verteporfin | Sigma-Aldrich | SML0534 | |
| Chemical compound, drug | Cyclo(RGDfK) | Selleckchem | S7834 | |
| Peptide recombinant protein | CCN1 | R and D Systems | 4055 | |
| Peptide recombinant protein | Vitronectin | Corning | 354238 | |
| Peptide recombinant protein | fibronectin | Corning | 354008 | |
| Commercial assay, or kit | Active Cdc42 detection kit | Cell Signalling | 11859 | |
| Recombinant DNA reagent | pEG-DIAPH1 | Pro Jung Weon Lee (College of Pharmacy, Seoul National University) | ||
| Recombinant DNA reagent | pEG-DIAPH1 ΔN3 | Prof. Jung Weon Lee (College of Pharmacy, Seoul National University) | ||
| Recombinant DNA reagent | pGL3-CCN1 (cloned on VE-cadherin promoter) | This paper | Progenitors: PCR, pGL3 | |
| Recombinant DNA reagent | pGL3-DLL4 luciferase plasmid | Prof. Young Geun Kwon Yonsei University | ||
| Recombinant DNA reagent | pRL-SV40 plasmid | Promega | E2231 | |
| Sequence-based reagent | siRNA:siCCN1 | Qiagen | SI03053477 SI03028655 SI02626428 SI02626421 | |
| Sequence-based reagent | siRNA: siIntegrin β3 | Qiagen | SI02664095 SI02628094 SI00034188 SI00034174 | |
| Sequence-based reagent | Negative control siRNA | Qiagen | SI03650325 | |
| Cell line (H. sapiens) | HUVEC | ATCC | CRL-1730 RRID:CVCL_2959 | |
| Cell line (H. sapiens) | EA.hy926 | ATCC | CRL-2922 RRID:CVCL_3901 | |
| Cell line (M. musculus) | LCC | ATCC | CRL-1642 RRID:CVCL_4358 | |
| Transgenic mice | Ccn1-TG (Chd5:Ccn1, C57BL/6J) | Macrogen, Seoul, Korea | ||
| Transgenic zebrafish (D. rerio) | hemizygous TG (flk-1:EGFP)s843 | Korea Zebrafish Organogenesis Mutant Bank (ZOMB) at Kyungpook National University Jin et al., 2005 | ||
| Sequence-based reagent | ccn1 MO (D. rerio) 5′-CTCCGCTGACACACACACACAGGAC-3′ | Gene-Tools, Philomath | ccn1-l2, ENSDARG00000099985 | |
| Software, algorithm | Prism | Graphpad Software | RRID:SCR_002798 | |
| Software, algorithm | ImageJ | https://imagej.nih.gov/ij/ | RRID:SCR_003070 | |
| Software, algorithm | edgeR package | http://www.bioconductor.org./help/search/index.html?q=edger+package/ Robinson et al., 2010 | RRID:SCR_012802 | |
| Software, algorithm | quantile normalisation | http://bioconductor.org Bolstad et al., 2003 | RRID:SCR_001786 | |
| Software, algorithm | Kaplan–Meier estimation | https://www.xlstat.com/en/solutions/features/kaplan-meier-analysis Bewick et al., 2004 | ||
| NCI Genomic Data Commons (GDC) | Data Portal | https://gdc-portal.nci.nih.gov Grossman et al., 2016 |
Table 1
Gene primer sequences for qPCR.
https://doi.org/10.7554/eLife.46012.022| Gene name | Forward | Reverse |
|---|---|---|
| DLL4 | ATTCGTCACCTGGATCCTTC | TCATTCTGGGCCAGTTGTAA |
| SOX17 | CAGACTCCTGGGTTTTTGTTGTTGCTG | GAAATGGAGGAAGCTGTTTTGGGACAC |
| ROBO4 | GACGGGAATCAGAACCACTT | CAGAGAAACACAGGCCAAGA |
| VEGFR2 | CTCGGGTCCATTTCAAATCT | GCTGTCCCAGGAAATTCTGT |
| JAG1 | AAGGCTTCACGGGAACATAC | AGCCGTCACTACAGATGCAC |
| NOTCH1 | AAGATGCTCCAGCAACACAG | GGCTCTGGCAAGTCTCCTAC |
| β-actin | GGATGTCCACGTCACACTTC | CACTCTTCCAGCCTTCCTTC |
| DIAPH1 | CAAGACAACCTCTTGTGCCC | GCTCCGAAGCTAGCAGAGAT |
Additional files
-
Transparent reporting form
- https://doi.org/10.7554/eLife.46012.023
Download links
A two-part list of links to download the article, or parts of the article, in various formats.
Downloads (link to download the article as PDF)
Open citations (links to open the citations from this article in various online reference manager services)
Cite this article (links to download the citations from this article in formats compatible with various reference manager tools)
CCN1 interlinks integrin and hippo pathway to autoregulate tip cell activity
eLife 8:e46012.
https://doi.org/10.7554/eLife.46012


