Cryo-EM structure of the rhodopsin-Gαi-βγ complex reveals binding of the rhodopsin C-terminal tail to the gβ subunit
- Paul Scherrer Institute, Switzerland
- University of Basel, Switzerland
- ETH Zurich, Switzerland
- Hoffmann-La Roche Ltd, Switzerland
Figures
Figure 1 with 8 supplements
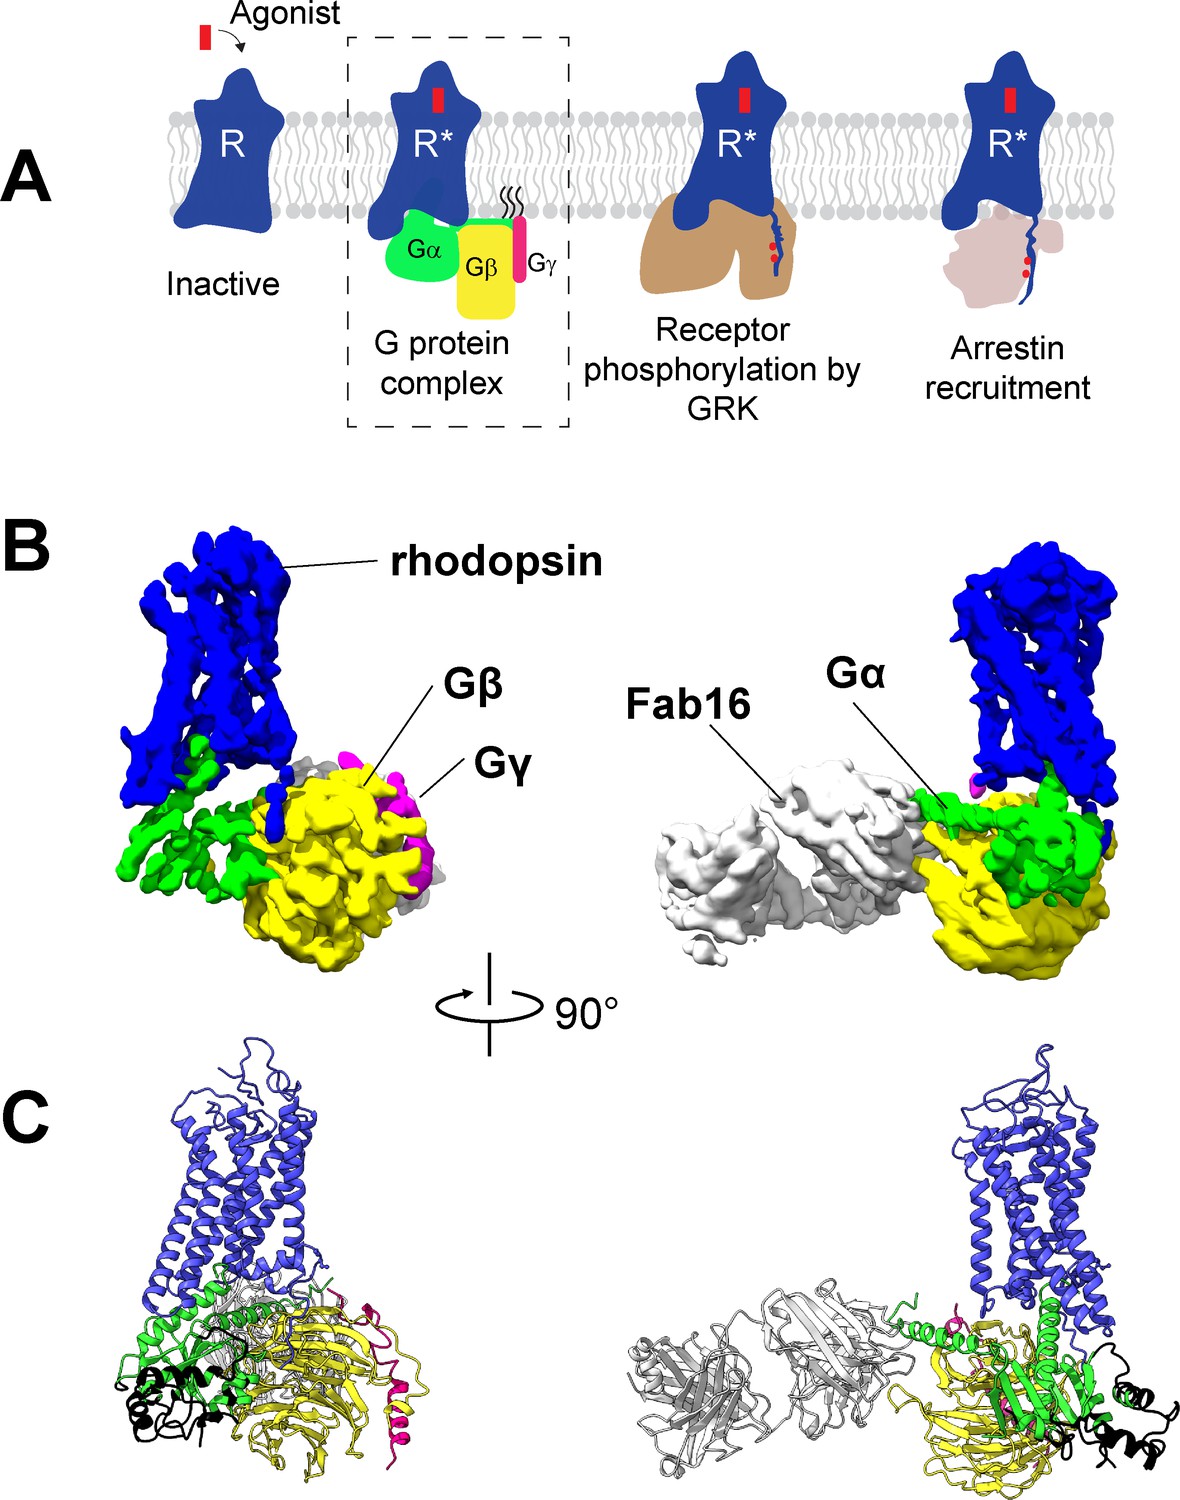
Cryo-EM structure of the rhodopsin-Gi-Fab16 complex.
(A) GPCR signaling complexes. (B) EM density map of the complex (rhodopsin – blue, Gαi – green, Gβ – yellow, Gγ – magenta, Fab16 – white). (C) Atomic model of the complex (same color code as B). The region of the Ras domain of Gα with no corresponding density in the EM map is depicted in back.
Figure 1—figure supplement 1
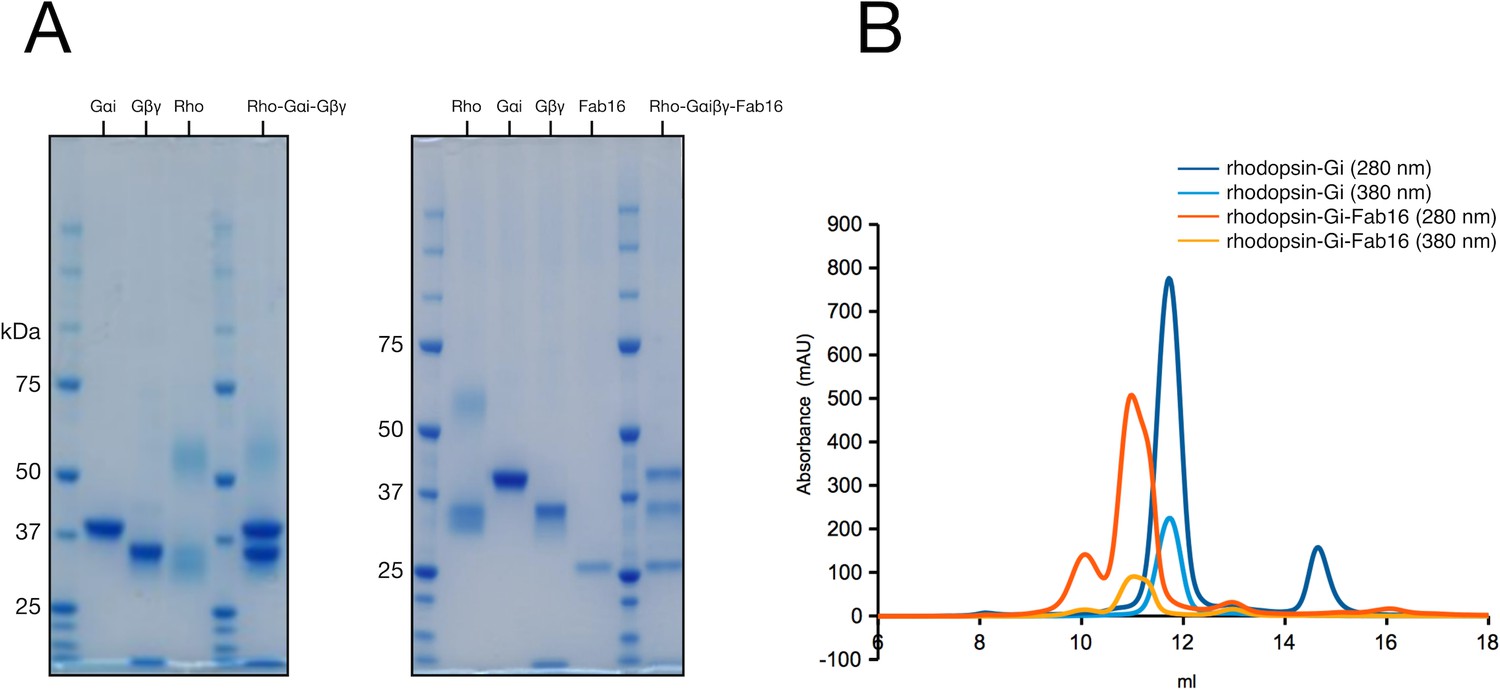
Purification of the rhodopsin-Gi and rhodopsin-Gi-Fab16 complexes.
(A) SDS-PAGE analysis of individual proteins and main peak fraction of corresponding size-exclusion chromatography (SEC). (B) SEC profiles of rhodopsin-Gαi and rhodopsin-Gi-Fab16 complexes used for the preparation of cryo-grids.
Figure 1—figure supplement 2
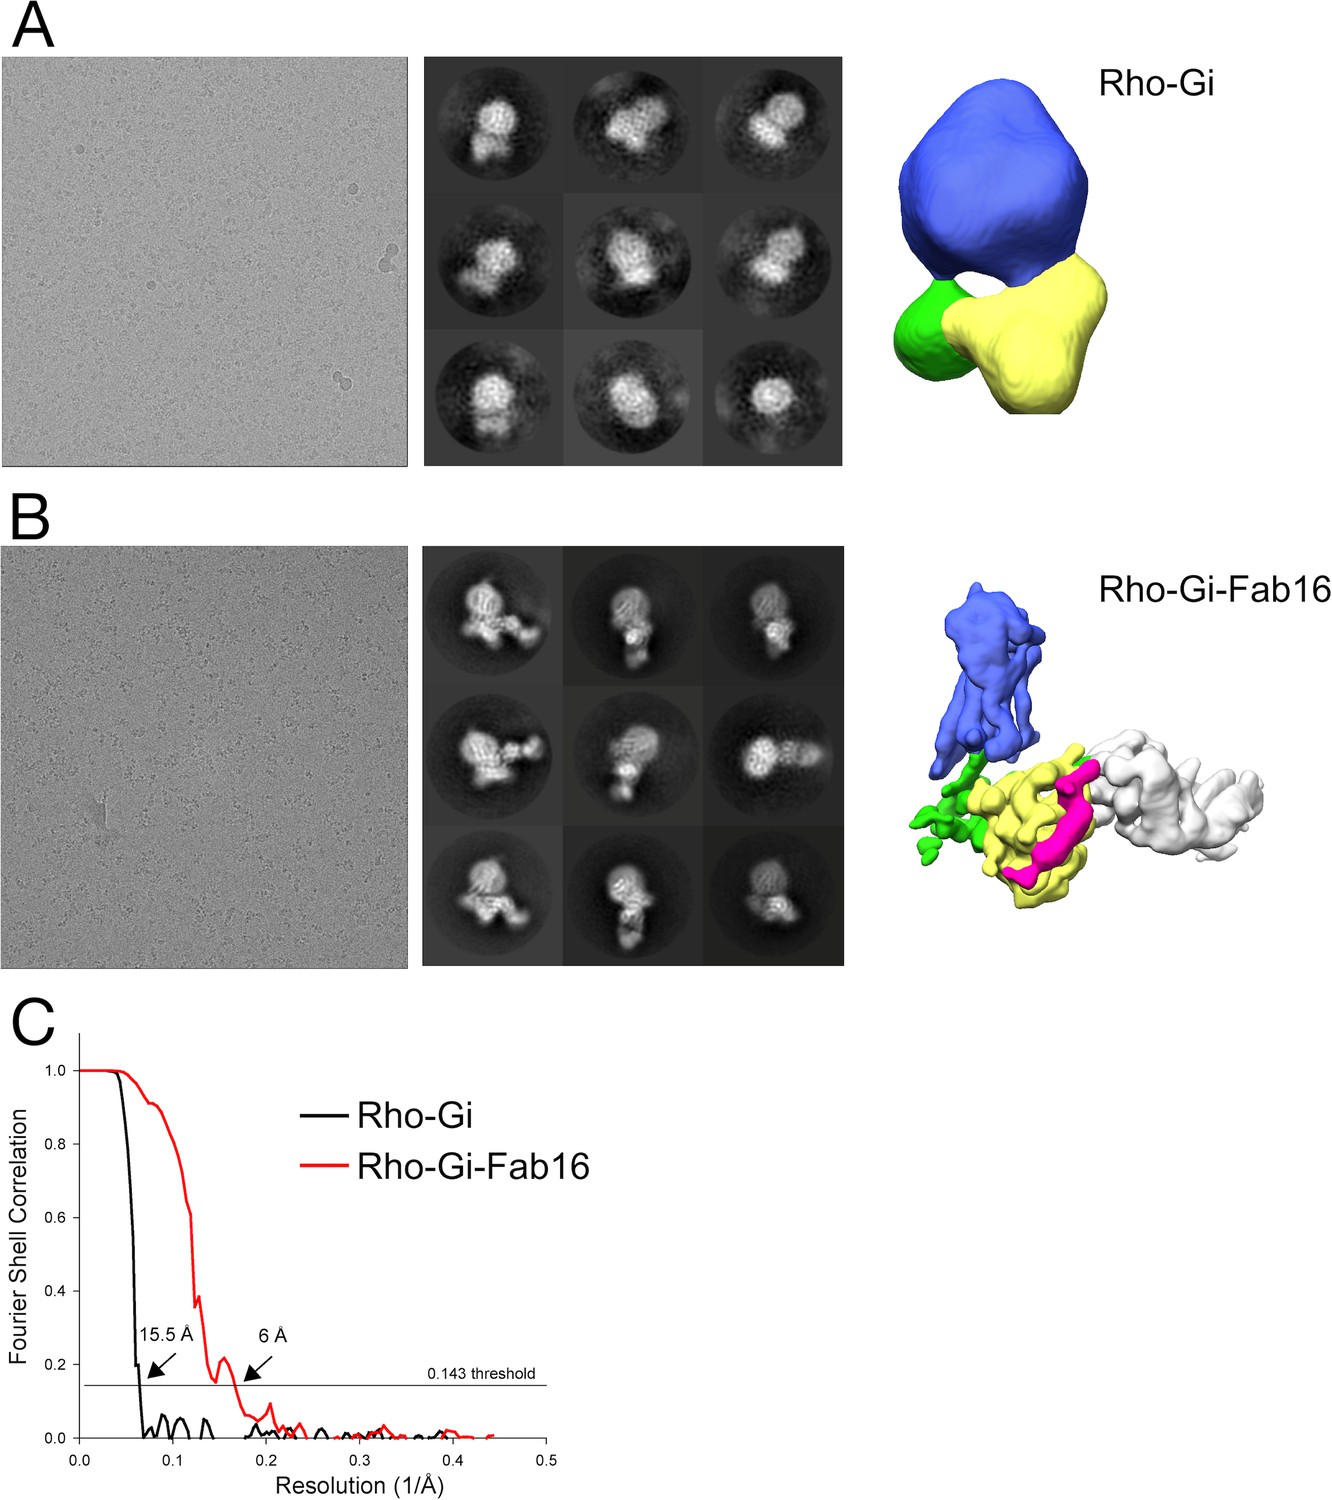
Cryo-EM maps of rhodopsin-Gi complexes with and without Fab16.
(A) Small dataset of rhodopsin-Gi (without Fab16) obtained using a Falcon III detector. (B) Small dataset of rhodopsin-Gi-Fab16 obtained using a Falcon III detector. (C) Gold-standard FSC curves with resolutions estimated at the 0.143 cut-off for the density maps of the two datasets.
Figure 1—figure supplement 3

Image processing of the rhodopsin-Gi-Fab16 complex acquired with K2.
(A) A representative micrograph. (B) Selected 2D class averages. (C) Image-processing workflow of the data processing. (D) Local resolution of the 3D reconstruction from (C). (E) Fourier Shell Correlation plot of the two half datasets generated in RELION.
Figure 1—figure supplement 4
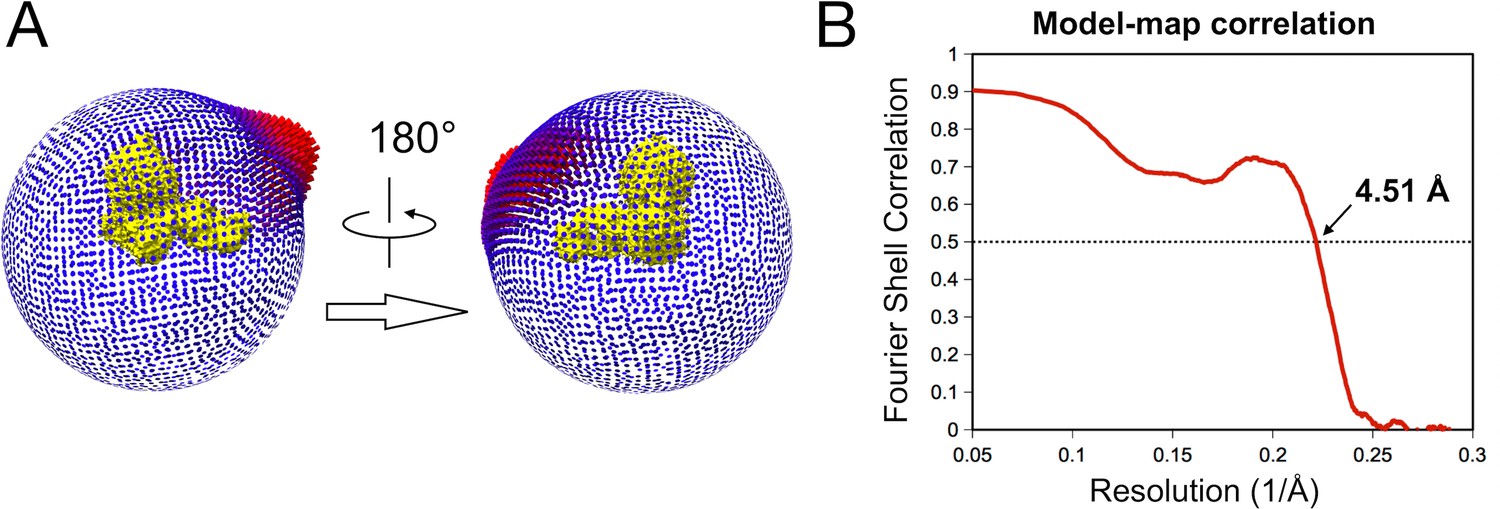
Image processing details.
(A) Angular distribution of the final set of particles (115’000 particles). Removal of particles that contribute to the over-represented views did not improve neither worsen map quality.(B) Spatial correlation between the 3D map and the atomic model. The correlation calculated by mtriage in the Phenix Suite shows the agreement between the 3D map and the atomic model to resolution.
Figure 1—figure supplement 5

3D classification reveals the flexibility of the AH domain of Gαi.
(A) Density map of one 3D class obtained during classification in RELION. The AH domain of the Gα subunit, highlighted in red, becomes visible only at high threshold when visualizing the density map in Chimera. (B) Overview of the three 3D classes selected after 3D classification (see Figure 1—figure supplement 3C). The region corresponding to the Ras domain of Gαi, which displays higher heterogeneity, is indicated with a red circle.
Figure 1—figure supplement 6
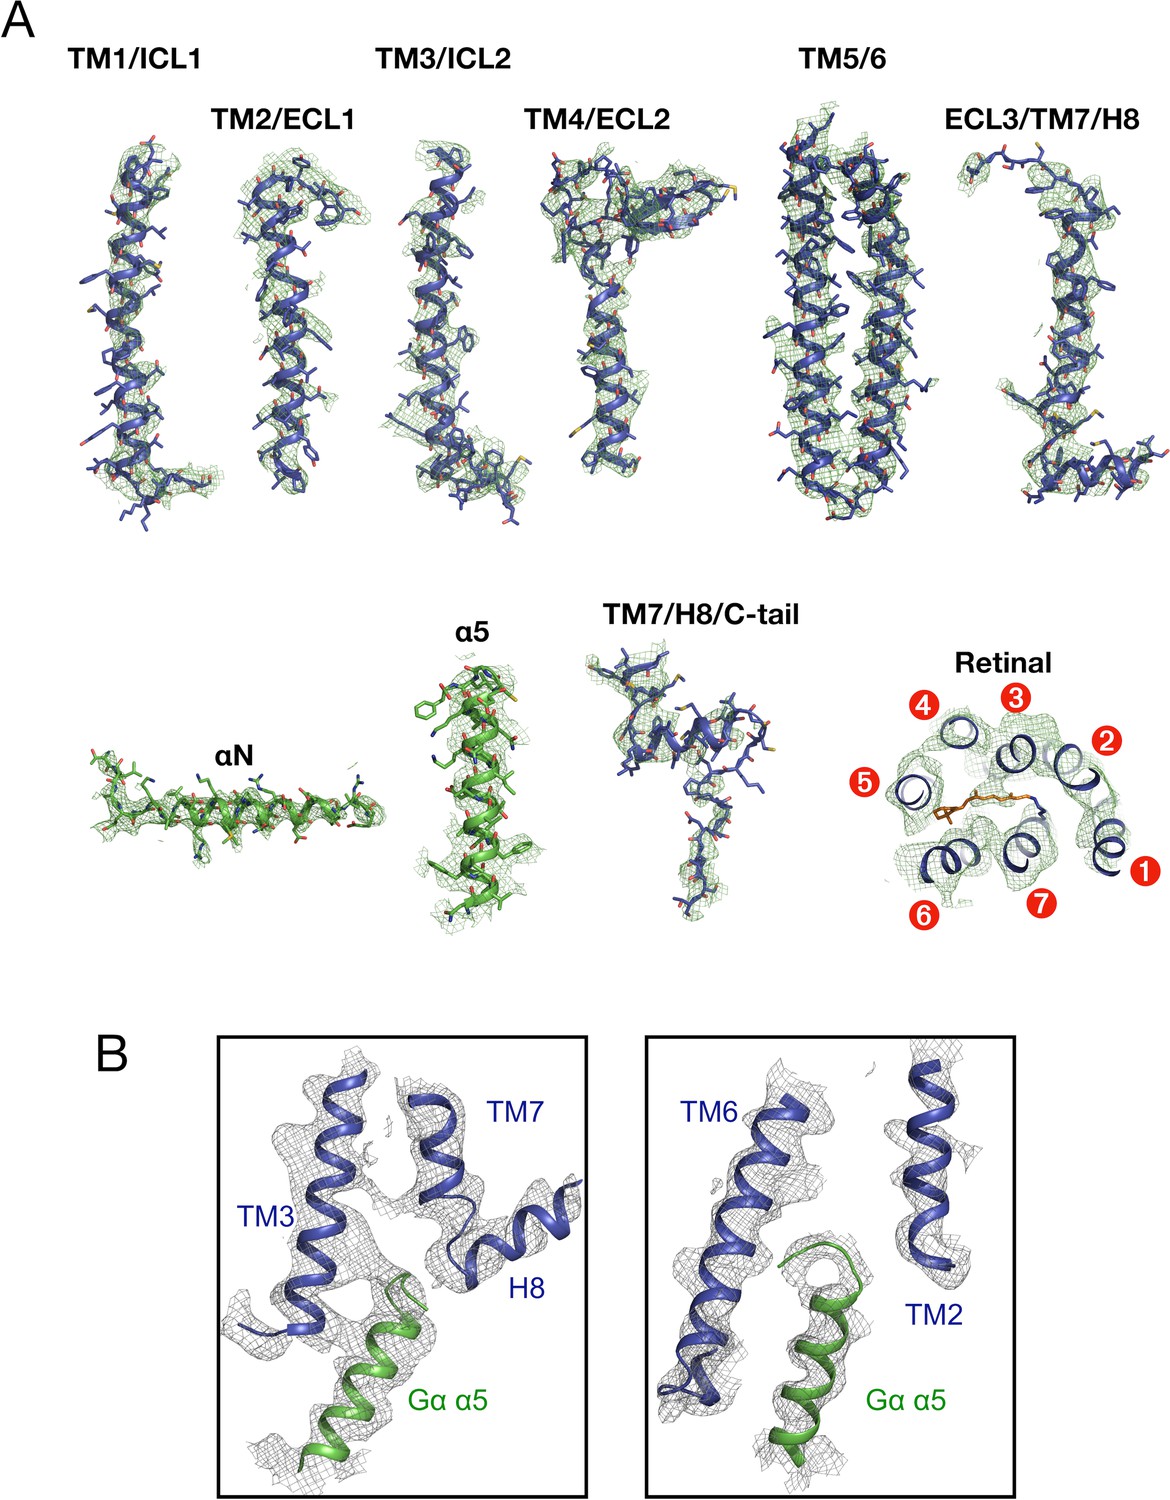
Details of the cryo-EM density map of rhodopsin-Gi-Fab16 with a fitted atomic model.
(A) The segmented density map shows individual regions of rhodopsin (transmembrane helices (TM), intracellular and extracellular loops (ICL, ECL), helix 8 (H8) and the C-terminal tail (C-tail), retinal-binding pocket; rhodopsin – blue, retinal – orange) and Gαi (αN and α5 helices, Gαi in green). Atoms are colored by type (nitrogen – blue; oxygen – red; sulfur – dark yellow). (B) Binding interface between the α5 helix of Gαi (in green) and the TM helices of rhodopsin (in blue). The maps are plotted at a 10 σ cuf-off using Pymol.
Figure 1—figure supplement 7

Comparison of the bovine rhodopsin-Gi complex to the other GPCR-G protein complexes.
(A) The complex structures are aligned to the Cα atoms of the rhodopsin-Gi complex (receptor – blue; Gα – green; Gβ – yellow; Gγ – magenta; peptide ligand – salmon). (B) Binding interface between the receptor and the Gα α5 helix in the structures of rhodopsin-Gi and rhodopsin-mini-Go (PDB id: 6FUF). Rhodopsin and G proteins are colored in blue and green, respectively. The side chains of Leu1313.46, Arg1353.50, Tyr3067.53 are plotted in sticks and the density maps are shown as gray meshes.
Figure 1—figure supplement 8
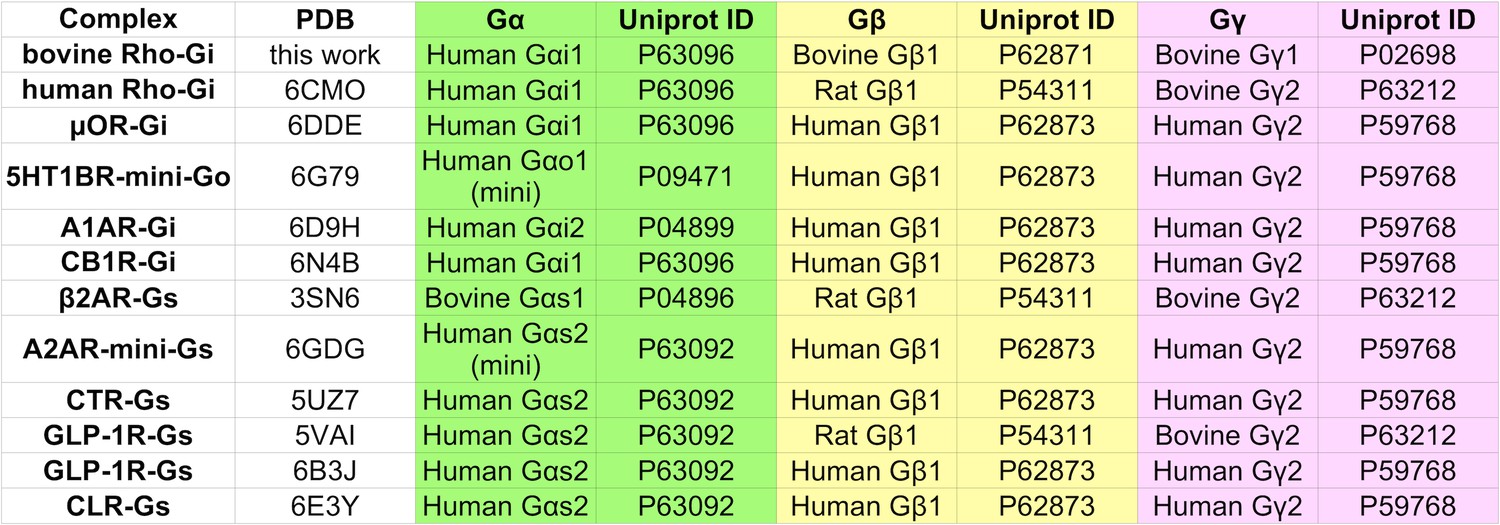
Details of the source organism of the Gα, Gβ, and Gγ proteins used to obtain GPCR G-protein complexes for structure determination.
https://doi.org/10.7554/eLife.46041.010
Figure 2 with 4 supplements
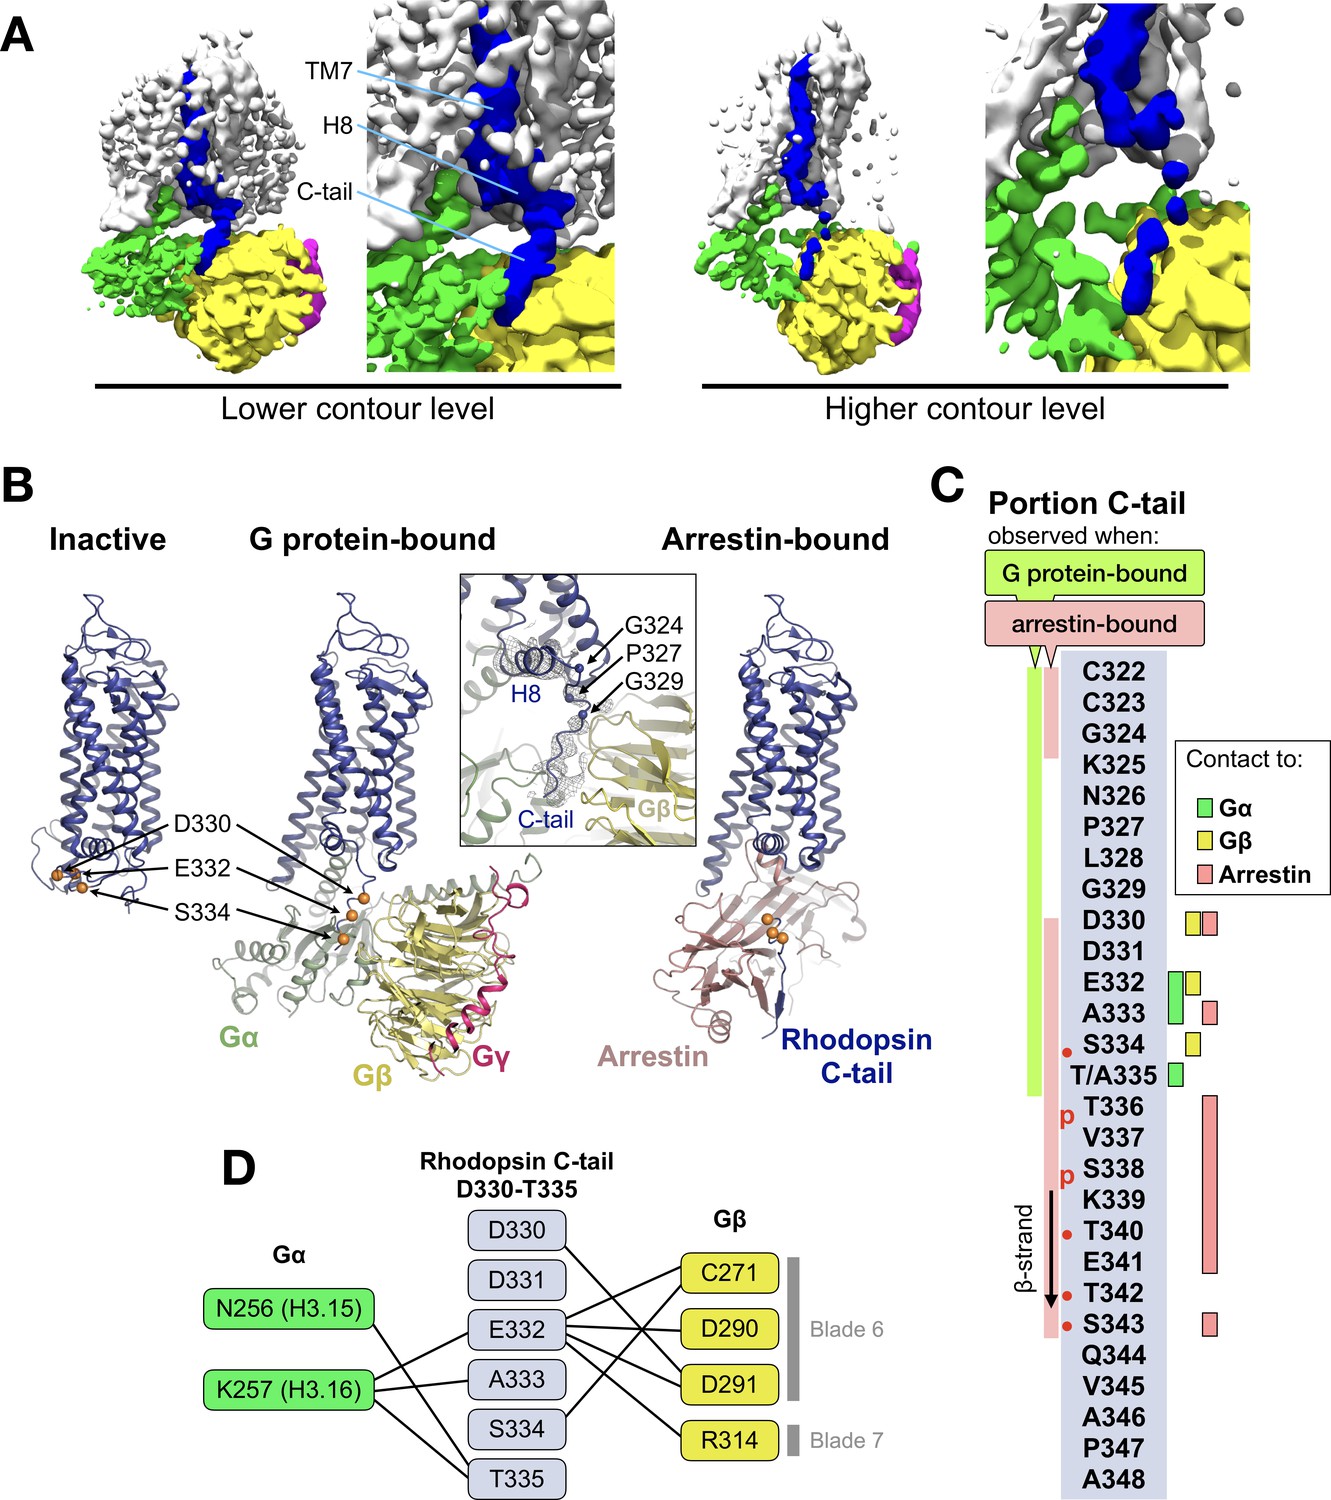
The C-terminal tail of rhodopsin.
(A) The EM map is contoured at two different levels to show the continuity of the density. The weakening at the end of H8 may arise from impaired interactions of the receptor with the detergent micelle (Glukhova et al., 2018). TM7, H8 and the C-tail of the receptor are colored in blue, Gα in green, Gβ in yellow, and Gγ in magenta. (B) Conformational change of the C-tail between three different conformational states of rhodopsin: Inactive state (left, PDB id: 1U19), G protein-bound (center, this work), and arrestin-bound (right, PDB id: 5W0P, chain A). The Cα atoms of residues Asp330, Glu332 and Ser334 are shown as orange spheres to help tracking the structural changes in the C-tail. All structures are aligned to rhodopsin. (C) Schematic representation of the rhodopsin C-tail from Cys322 to Ala348. On the left, colored bars indicate the portion of the C-tail visible in this structure (green), and in the arrestin-bound structure (salmon) (PDB id: 5W0P). On the right, the residue-residue contacts between rhodopsin C-tail and Gα (marked in green), Gβ (yellow), and arrestin (salmon) within 4 Å distance are indicated. Thr336 and Ser338 are phosphorylated in the arrestin-bound structure. The predicted phosphorylation sites are marked with red dots. (D) Model of residue-residue interaction between the rhodopsin C-tail and the G protein subunits. AsnH3.15 and LysH3.16 of the Gαi subunit forms the contact to the C-tail of rhodopsin near Glu332, Ala333 and Thr 335. In this model, the surface region of blades 6 and 7 of Gβ contact the C-tail via hydrophilic residues Cys271, Asp290, Asp 291, and Arg314.
Figure 2—figure supplement 1
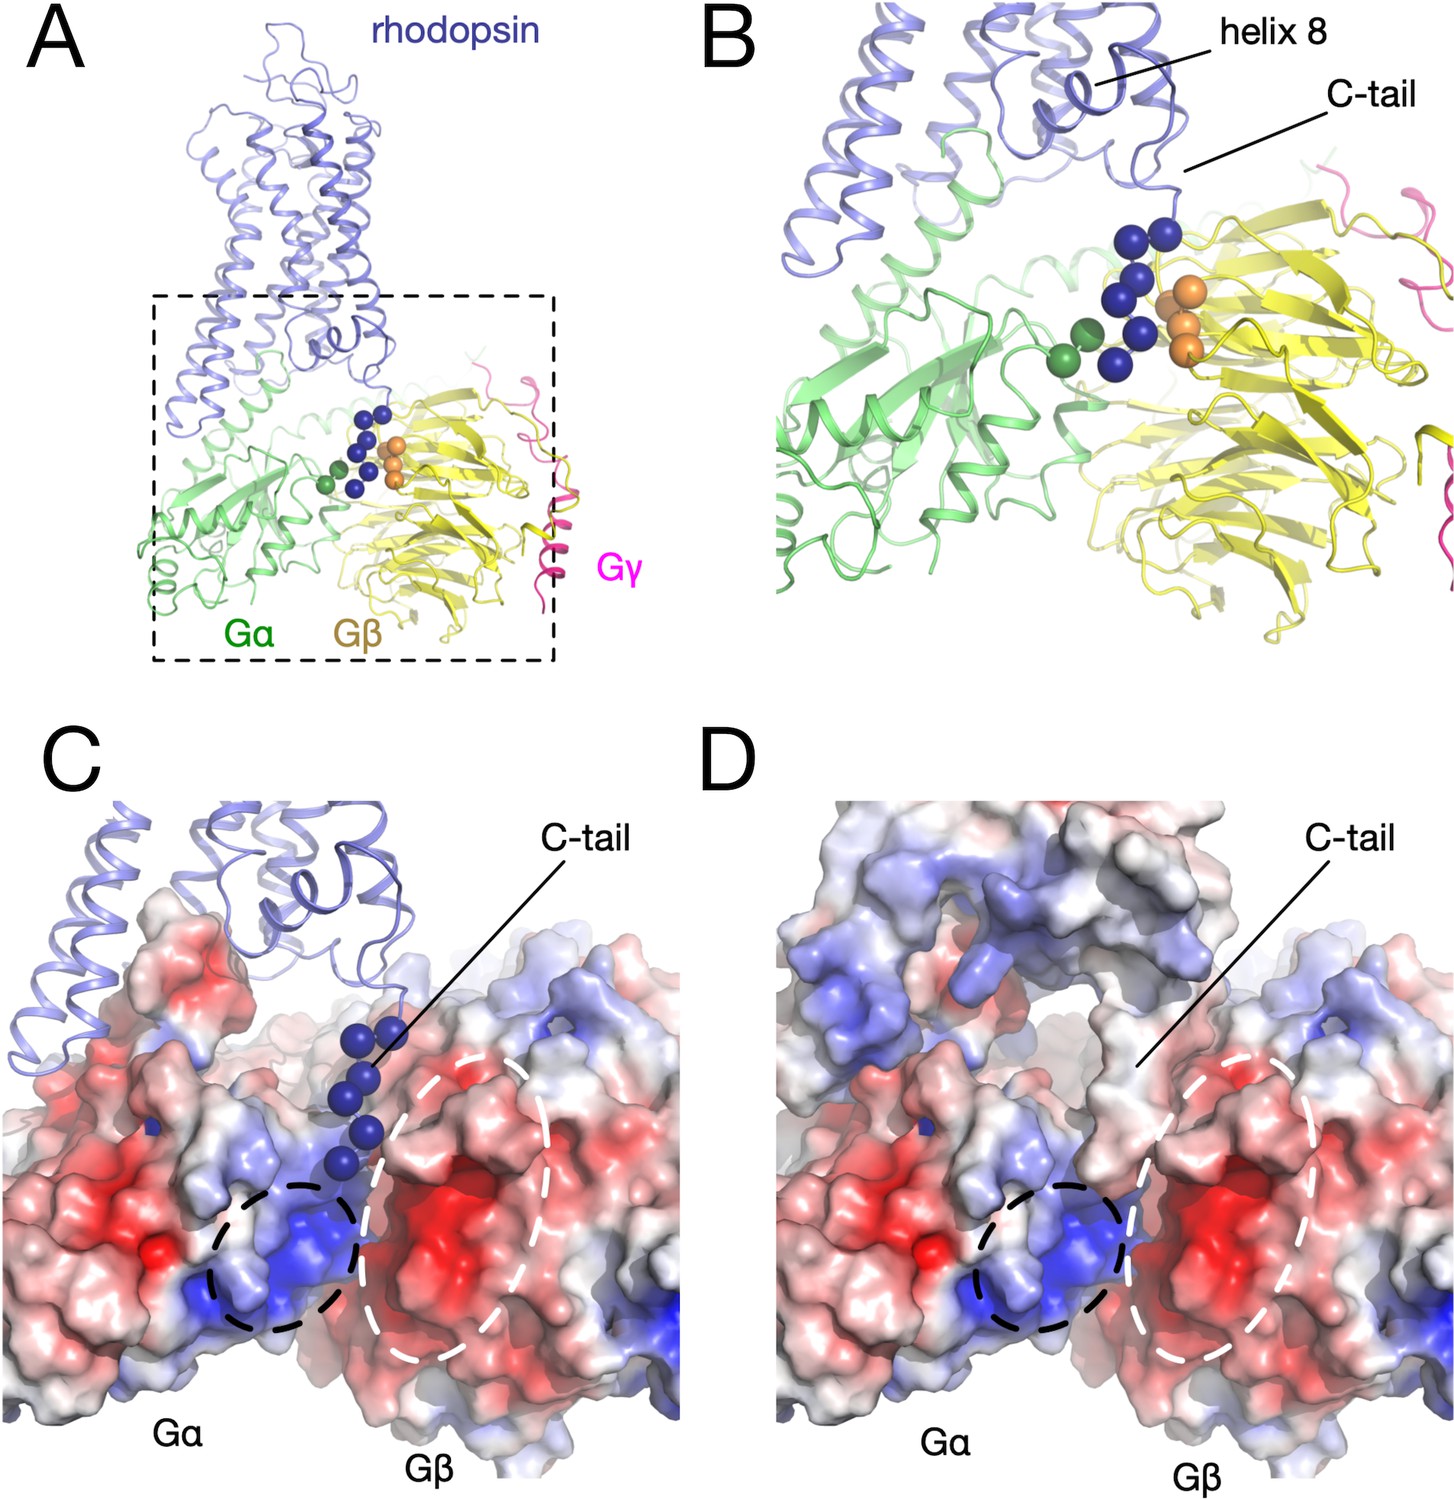
Electrostatic potential.
(A) Three-dimensional structure of the rhodopsin (blue) - Gα (green) – Gβγ (yellow and magenta) complex. The alpha carbons of the interacting residues in each component are displayed as spheres. (B) Detail of the interacting region between the receptor C-tail and the G protein. (C) Electrostatic potential mapped on the surfaces of Gα (positive near the receptor C-tail, black circle) and Gβγ (negative, white circle). (D) Electrostatic potential mapped on the surfaces of the receptor, Gα, and Gβγ.
Figure 2—figure supplement 2
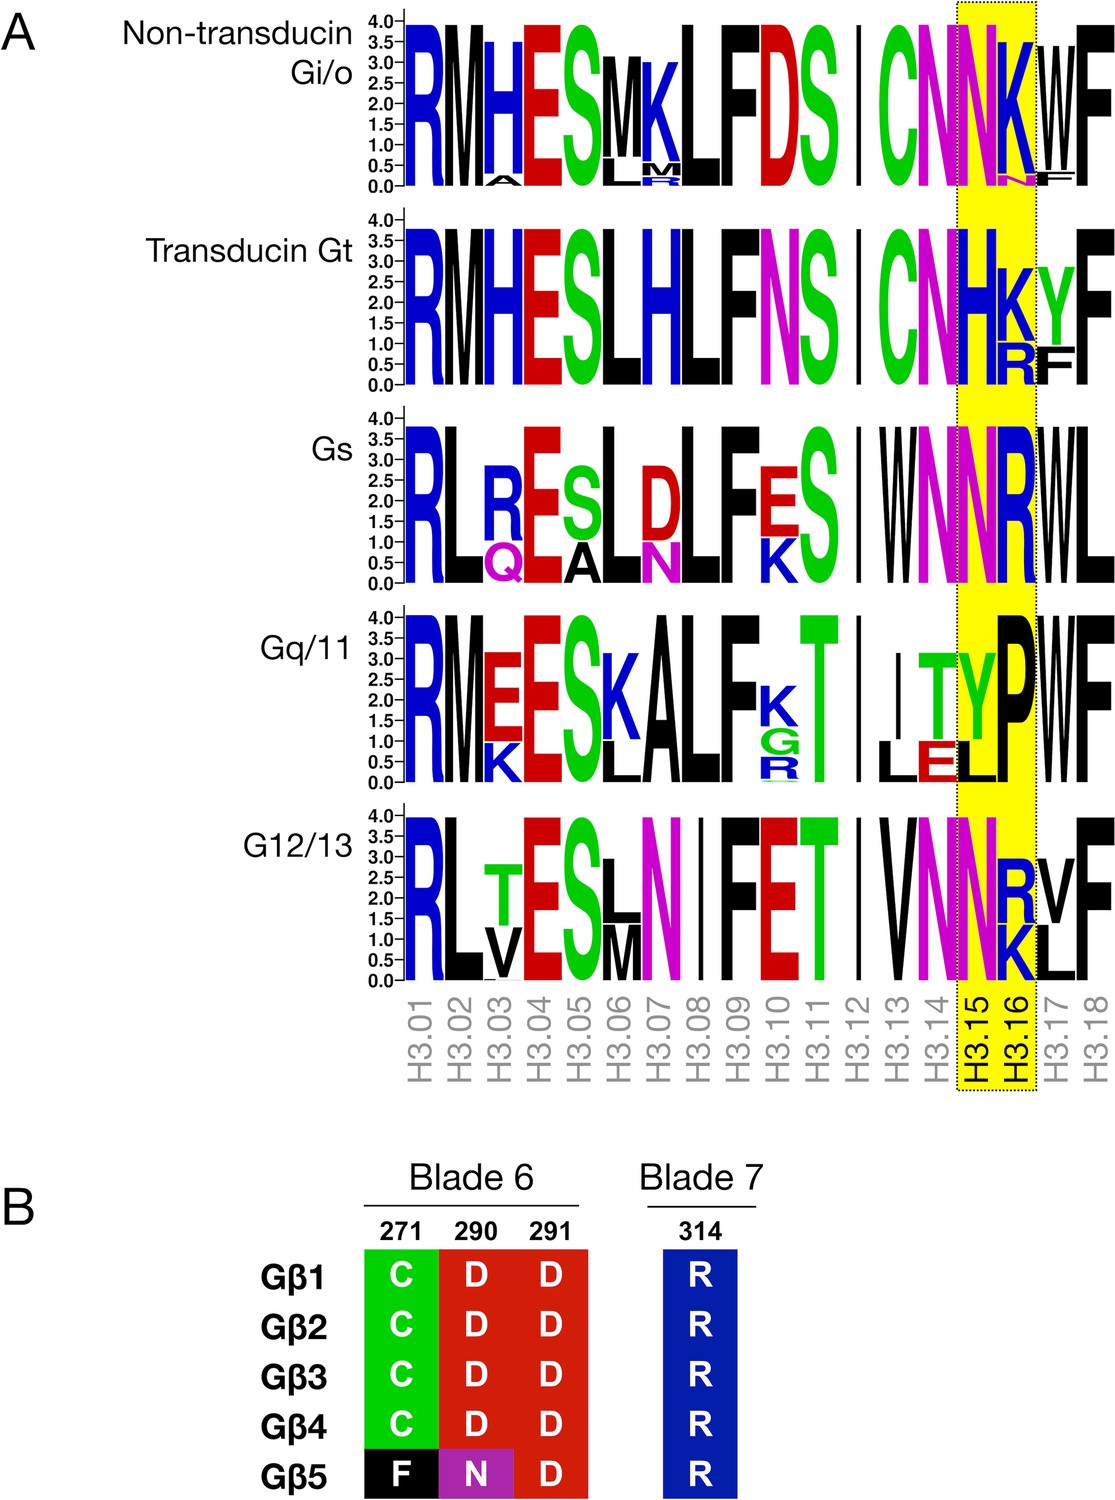
Sequence conservation in Gα and Gβγ.
(A) Sequence logo depicting the sequence conservation in the α3 helix of the Ras domain in different G protein subtypes. The size of the letters represents frequency within a sequence alignment of mammalian Gα proteins. Residues at positions H3.15 and H3.16, which can potentially interact with the C-tail of the receptor, are highlighted in yellow. (B) Alignment of residues C271, D290, and D291 in blade six and R314 in blade 7 of the β-propeller in the five human Gβ subtypes.
Figure 2—figure supplement 3
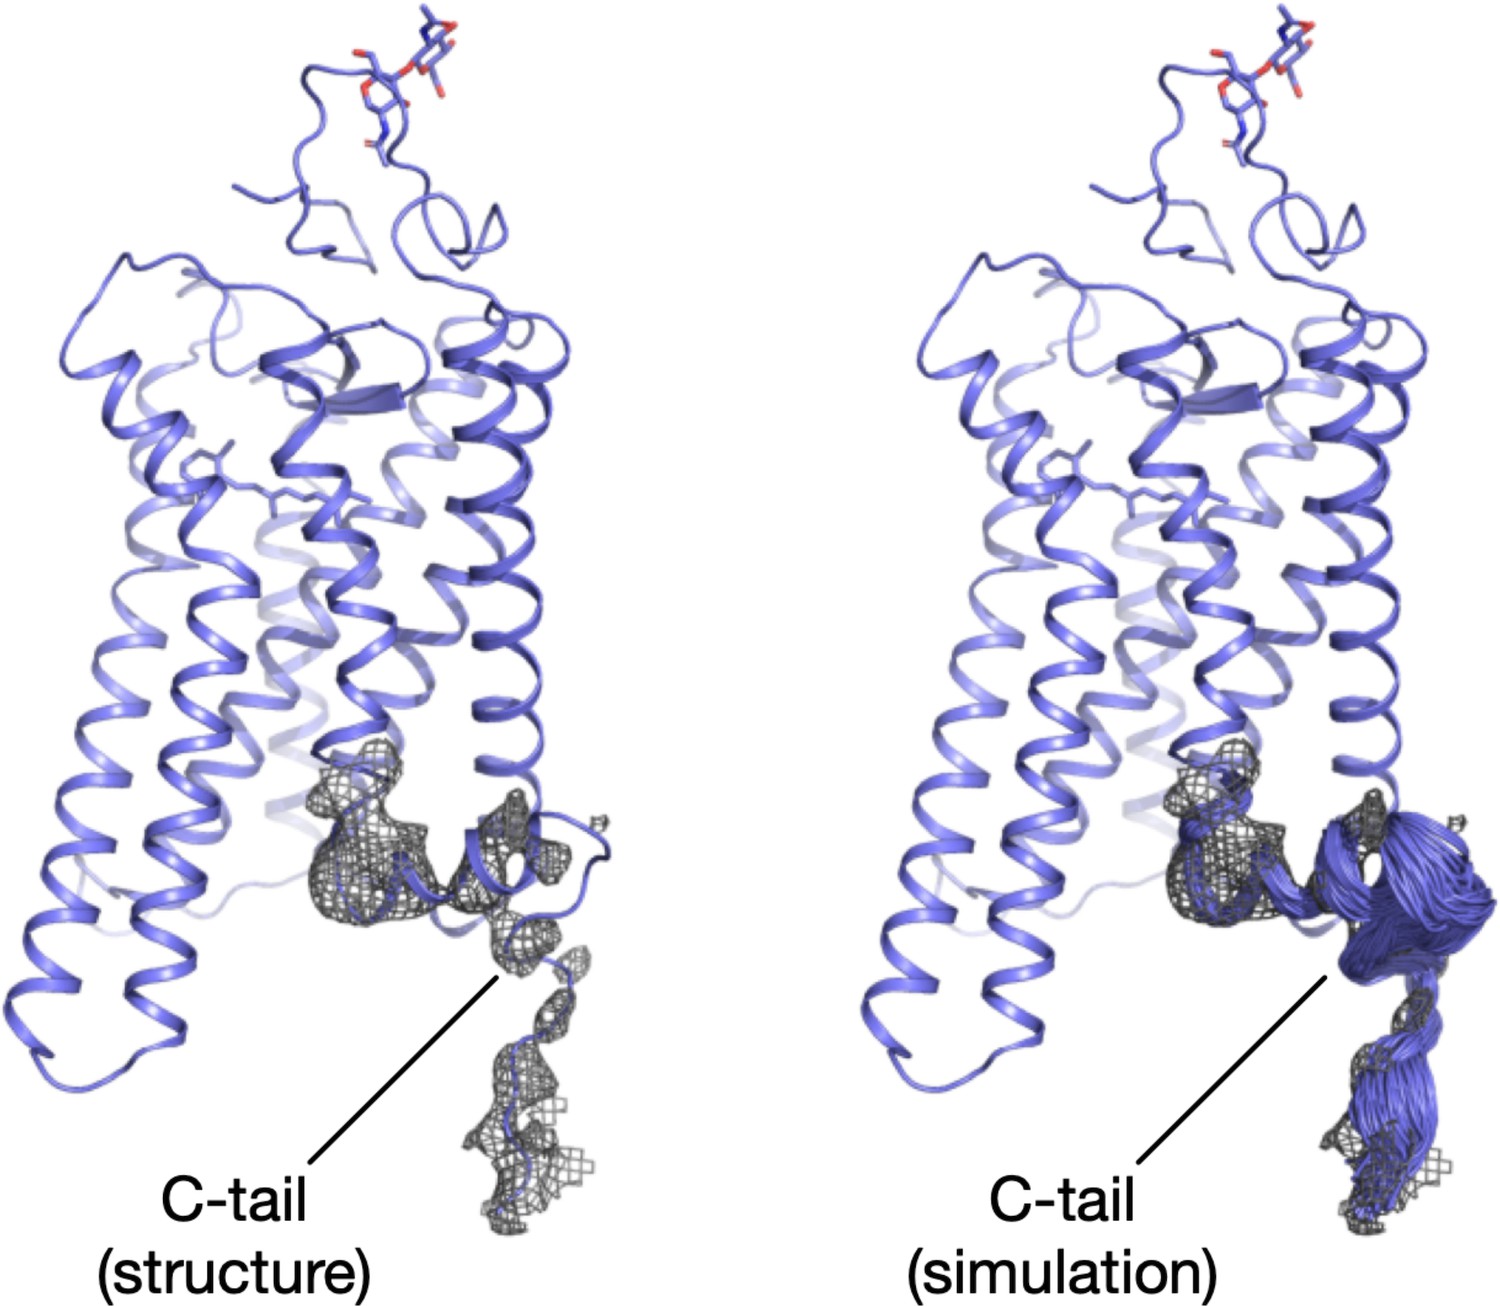
Flexible fitting of the C-tail in the electron density.
Structural model of rhodopsin displaying the electron density at a 10σ cuf-off around H8 and the C-tail (left), and snapshots of this region during the MDFF simulation (right).
Figure 2—figure supplement 4
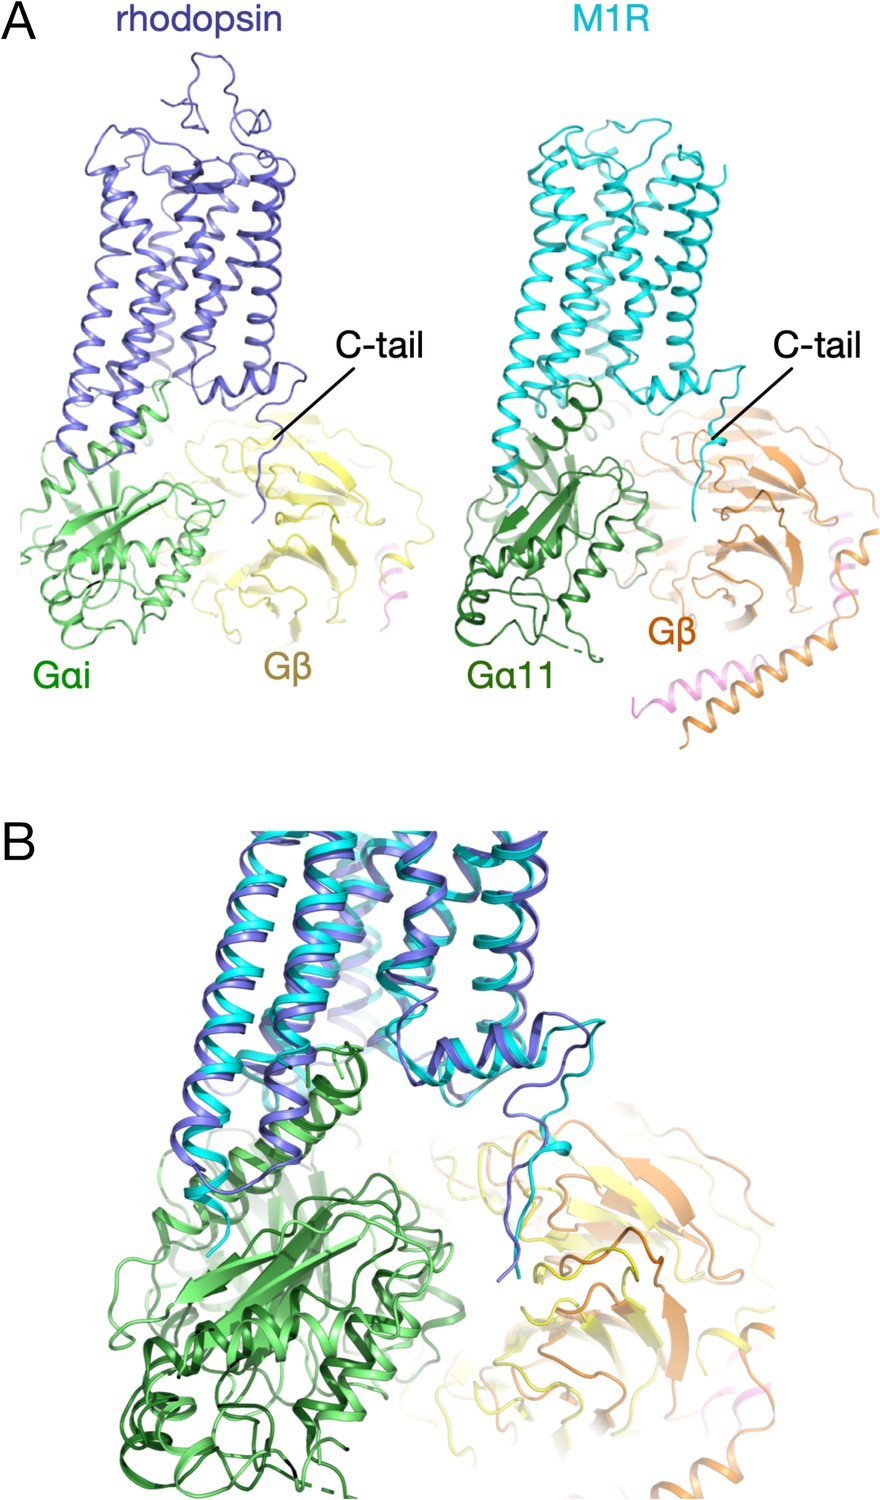
Structure of the C-tail in rhodopsin and M1R.
(A) Three-dimensional structure of the rhodopsin (blue) - Gαi (green) – Gβ (yellow) complex. (B) Three-dimensional structure of the M1 muscarinic acetylcholine receptor (blue) – Gα11 (green) – Gβ (orange) complex. (C) Structural superposition of the complexes.
Figure 3 with 5 supplements
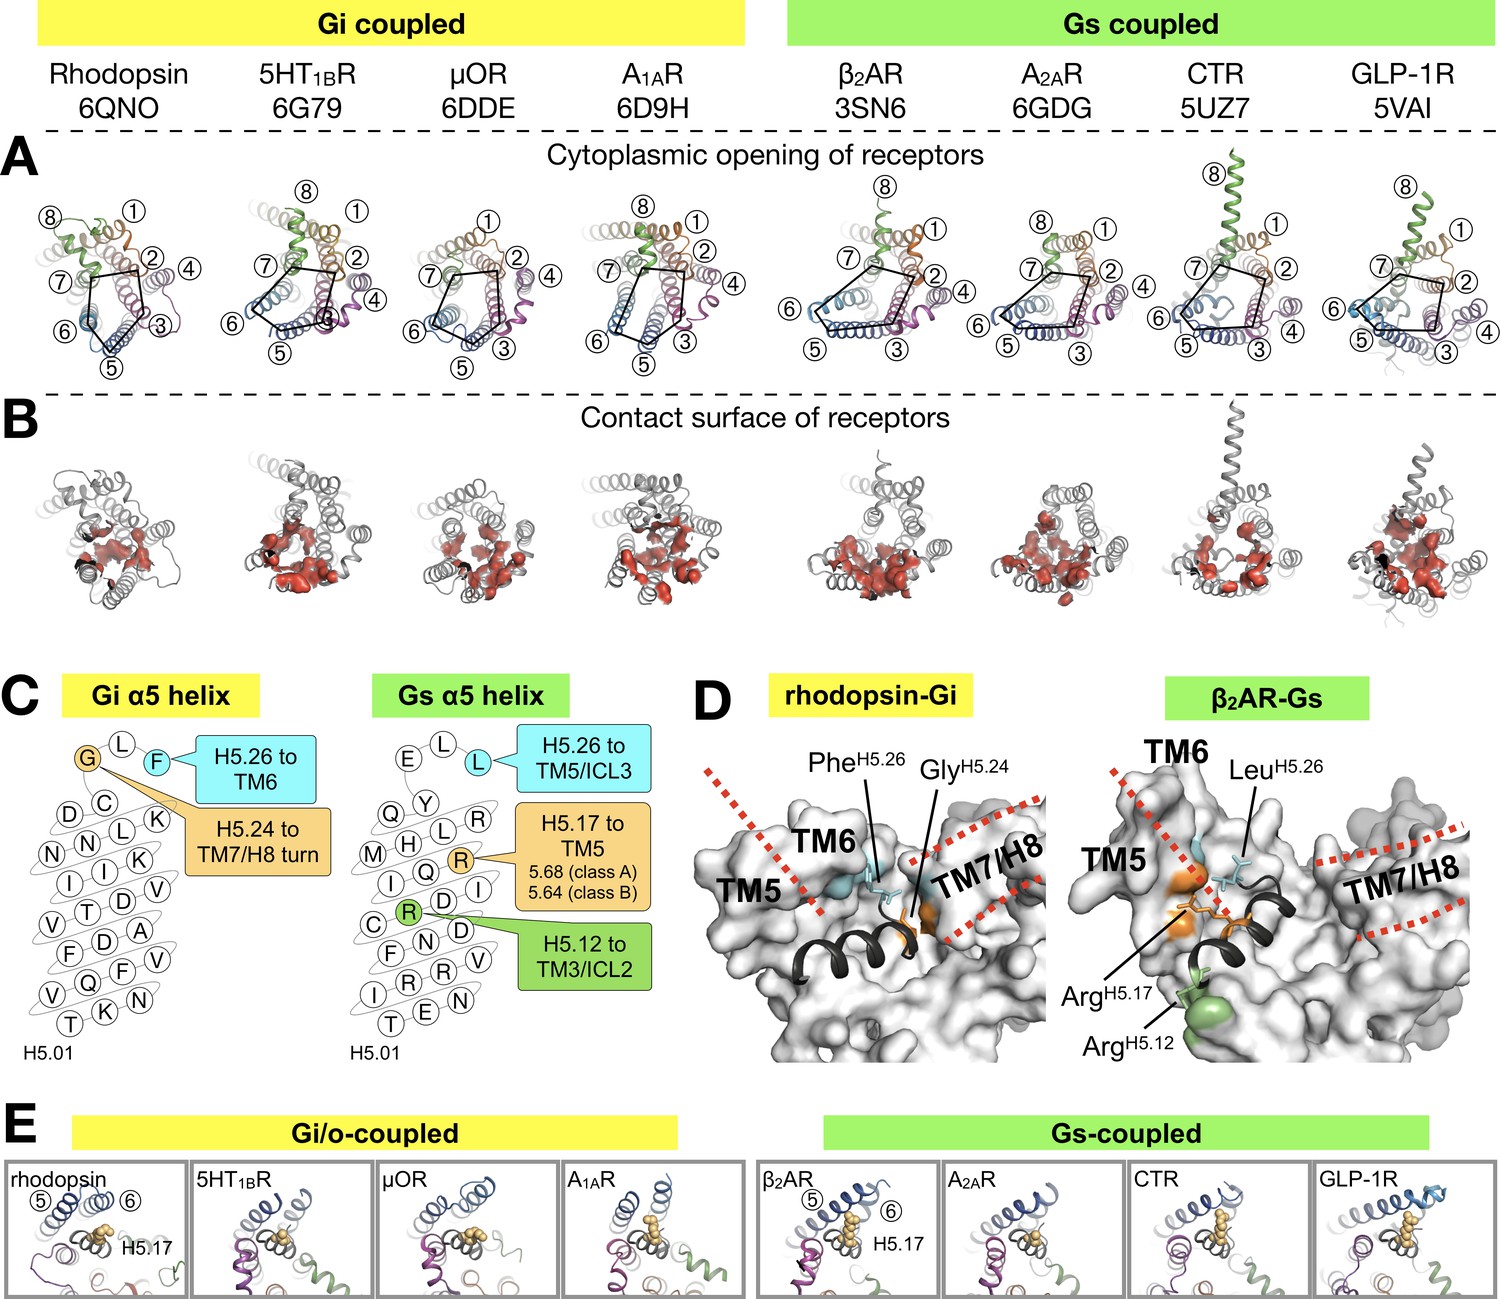
Binding of the Gα α5 helix in GPCR-G protein complexes.
(A) Overview of a subset of GPCR-G protein complexes used for this analysis. For a complete list of the complexes used, see Figure 3—figure supplement 2. The complexes are shown from the cytoplasmic side, and the black pentagons connecting TM2-3-5-6-7 delineate the G protein-binding interface. Receptors are represented in ribbons with their TM helices numbered. (B) The red surfaces depict the contact area (within a distance of 4 Å) between the receptor and the α5 helix of Gα (C) Schematic representation of the α5 helix in Gi- and Gs-subtypes. The residues highlighted, and their respective binding site to the receptor, are conserved among all Gi, and Gs, complexes analyzed. All contacts retrieved from this analysis are reported in Figure 3—figure supplement 2. (D) Position of Gi- and Gs-specific contacts shown in the rhodopsin-Gi (this work, PDB id: 6QNO) and the β2AR-Gs (PDB id: 3SN6) complexes. The cytoplasmic side of the receptors is depicted as gray surface. Red lines mark the border between TM5 and TM6 and delineate H8. (E) Cytoplasmic view of GPCR-G protein complexes showing the interaction between H5.17 (orange spheres) and TM5 and TM6. From left to right, the structures (PDB ids) correspond to: this work, 6G79, 6DDE, 6D9H, 3SN6, 6GDG, 5UZ7, and 5VAI. Throughout the analysis, contacts are defined as atomic distances smaller than 4 Å.
Figure 3—figure supplement 1
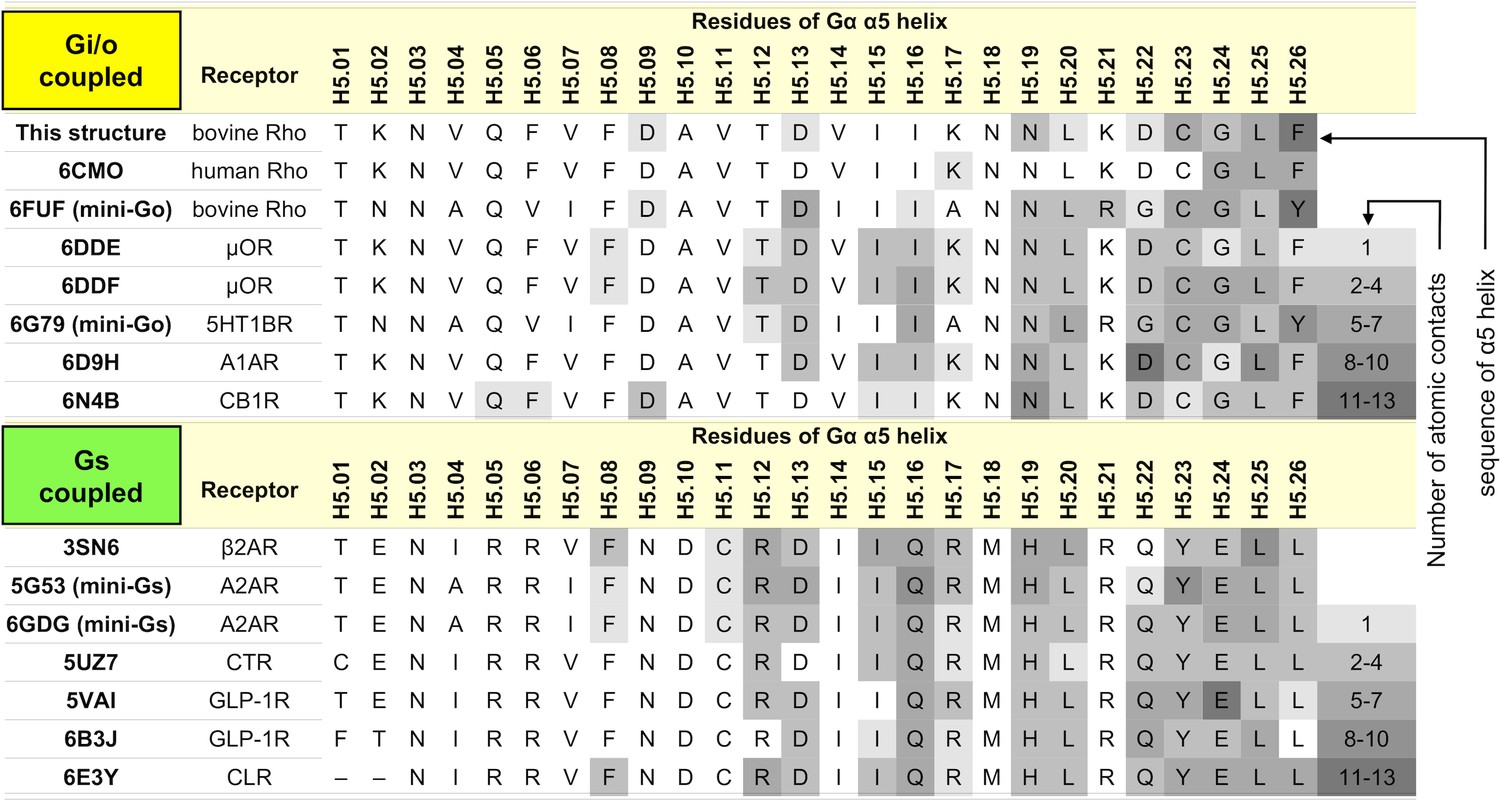
Residue-residue contact list between GPCRs and Gα H5.
11–26 within 4 Å.
Figure 3—figure supplement 2
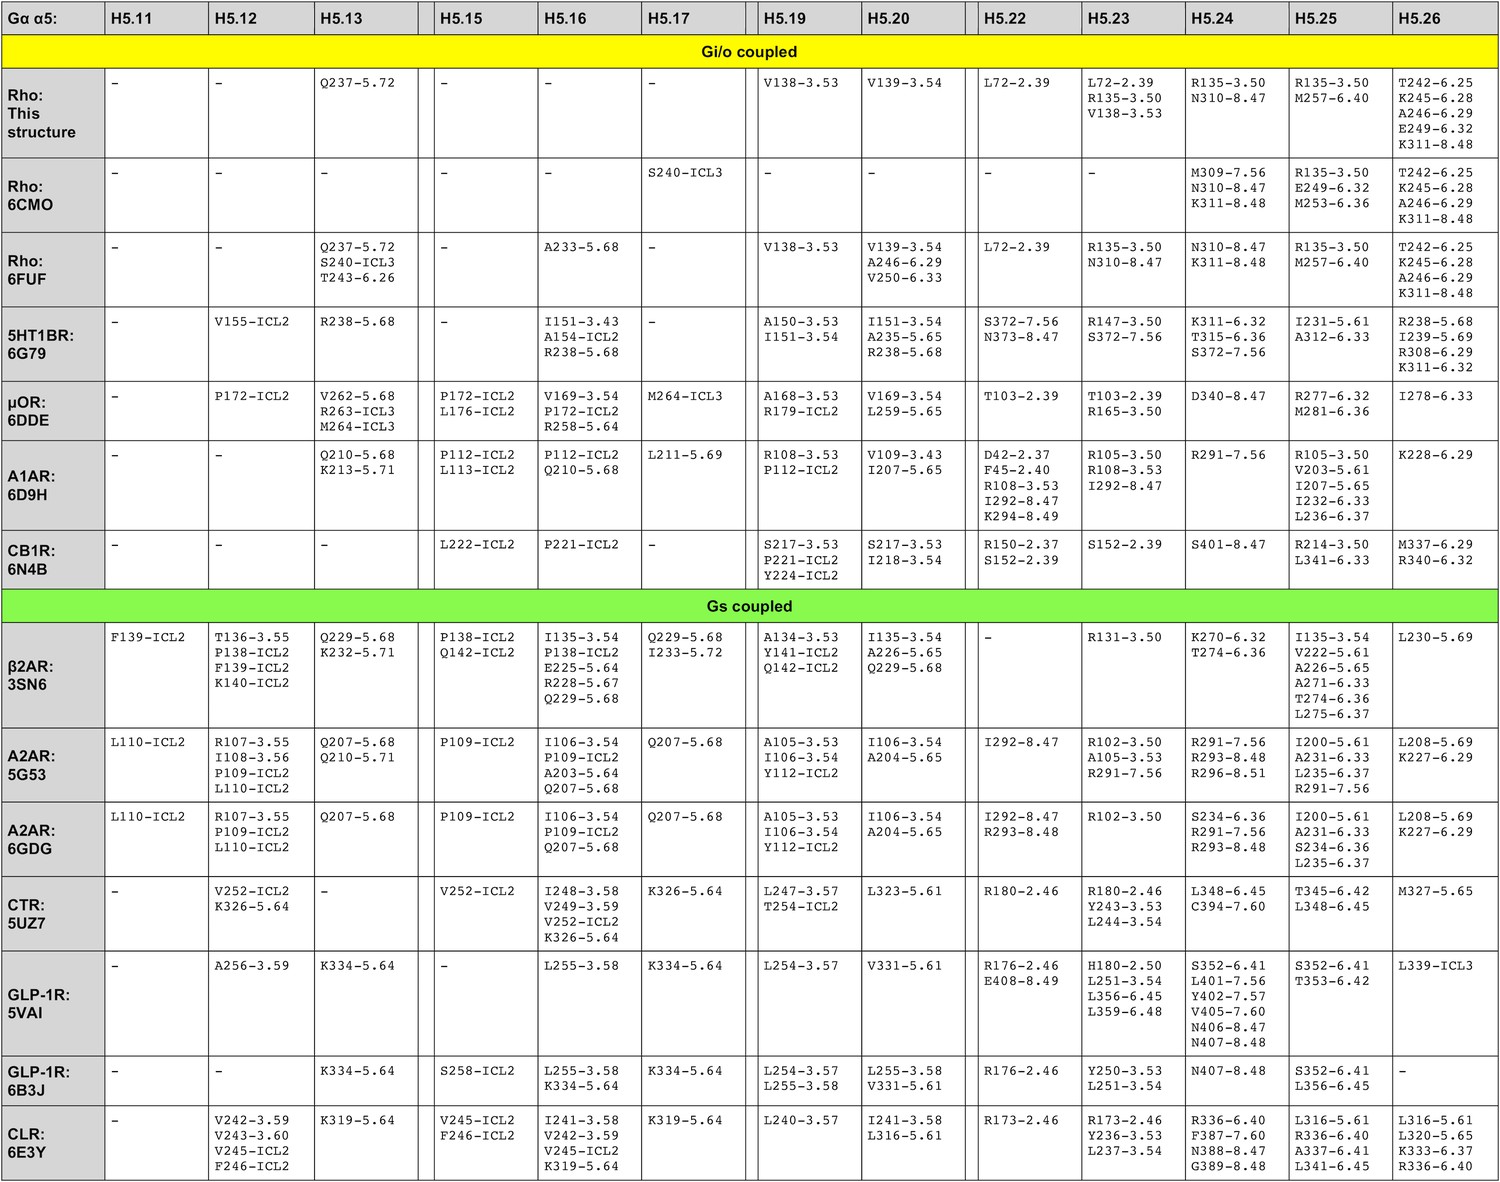
Residue-residue contacts between GPCRs and Gα H5.
11–26.
Figure 3—figure supplement 3
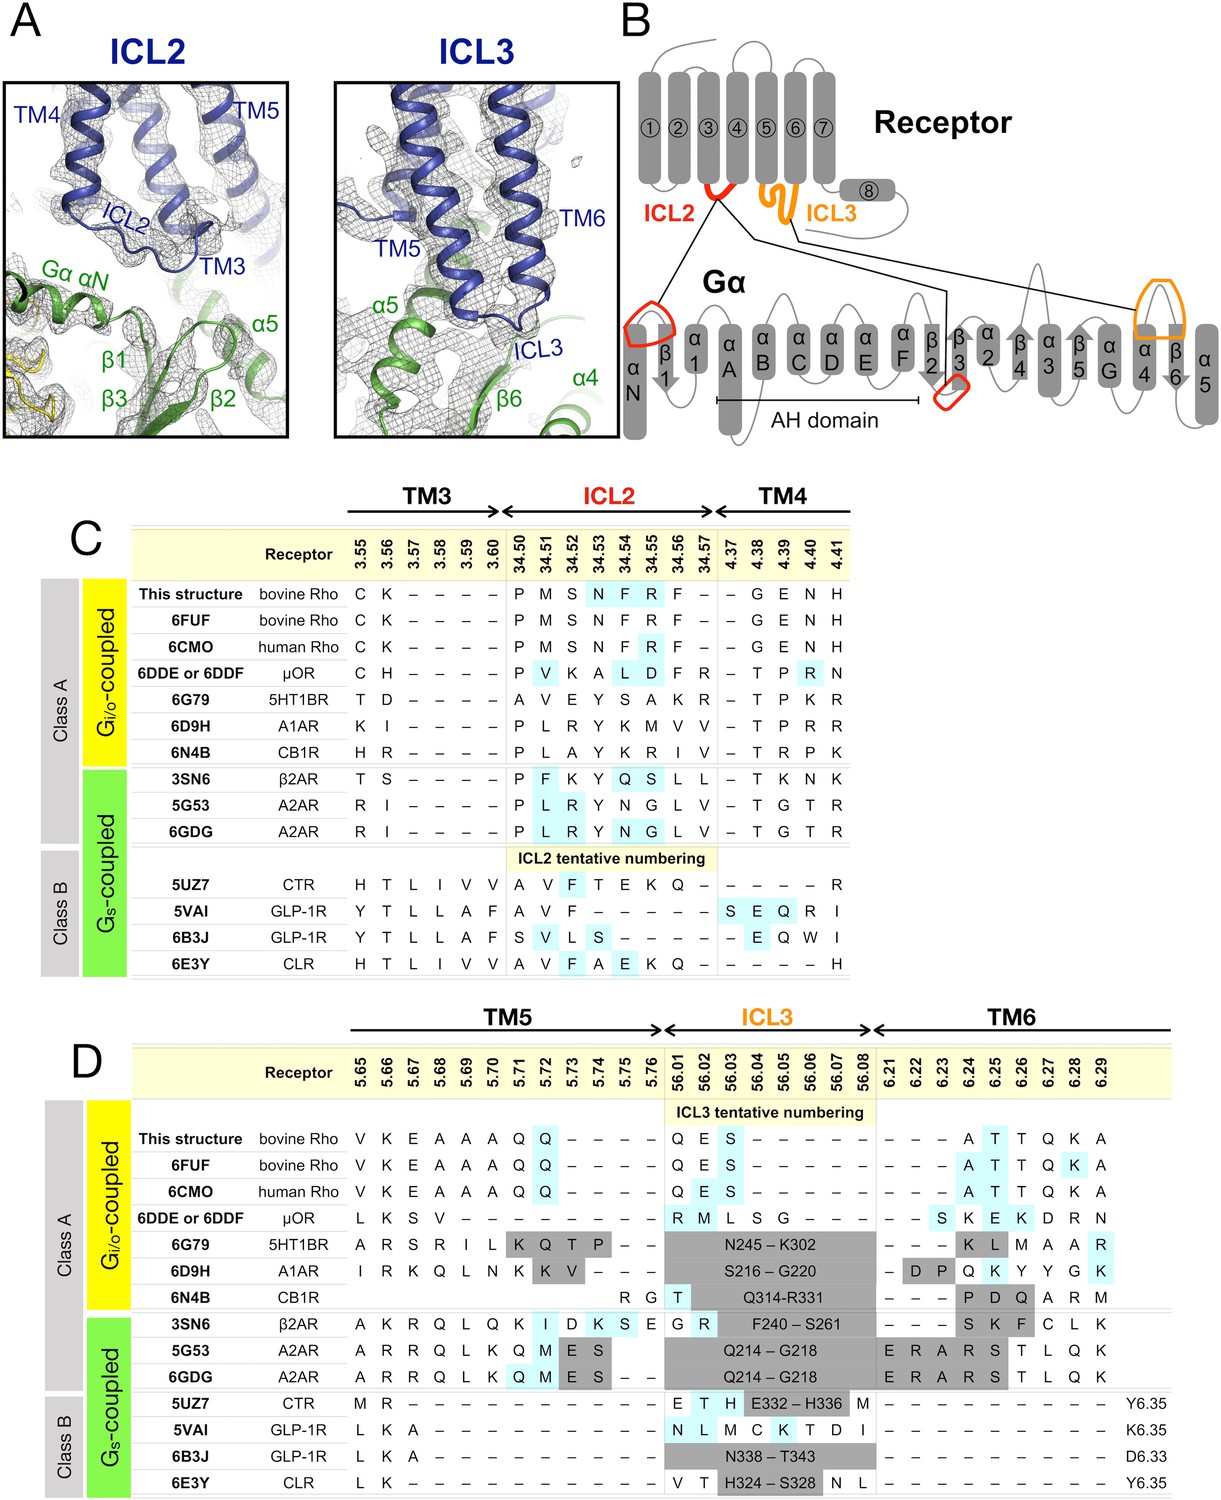
Contacts observed between ICL2/ICL3 and the Gα subunit.
(A) Intracellular loop (ICL) 2 and 3 in the EM density map (B) Schematic overview of the contacts between the intracellular loops of the receptor and Gα. (C) Sequence of ICL2 in the available structures of the GPCR-G protein complexes. Residues that contact to regions of the G protein other than the α5 helix are highlighted in cyan. (D) Same as panel B, but for ICL3. Residues missing from the structure are marked in gray. The residues are numbered using the Ballesteros-Weinstein scheme.
Figure 3—figure supplement 4
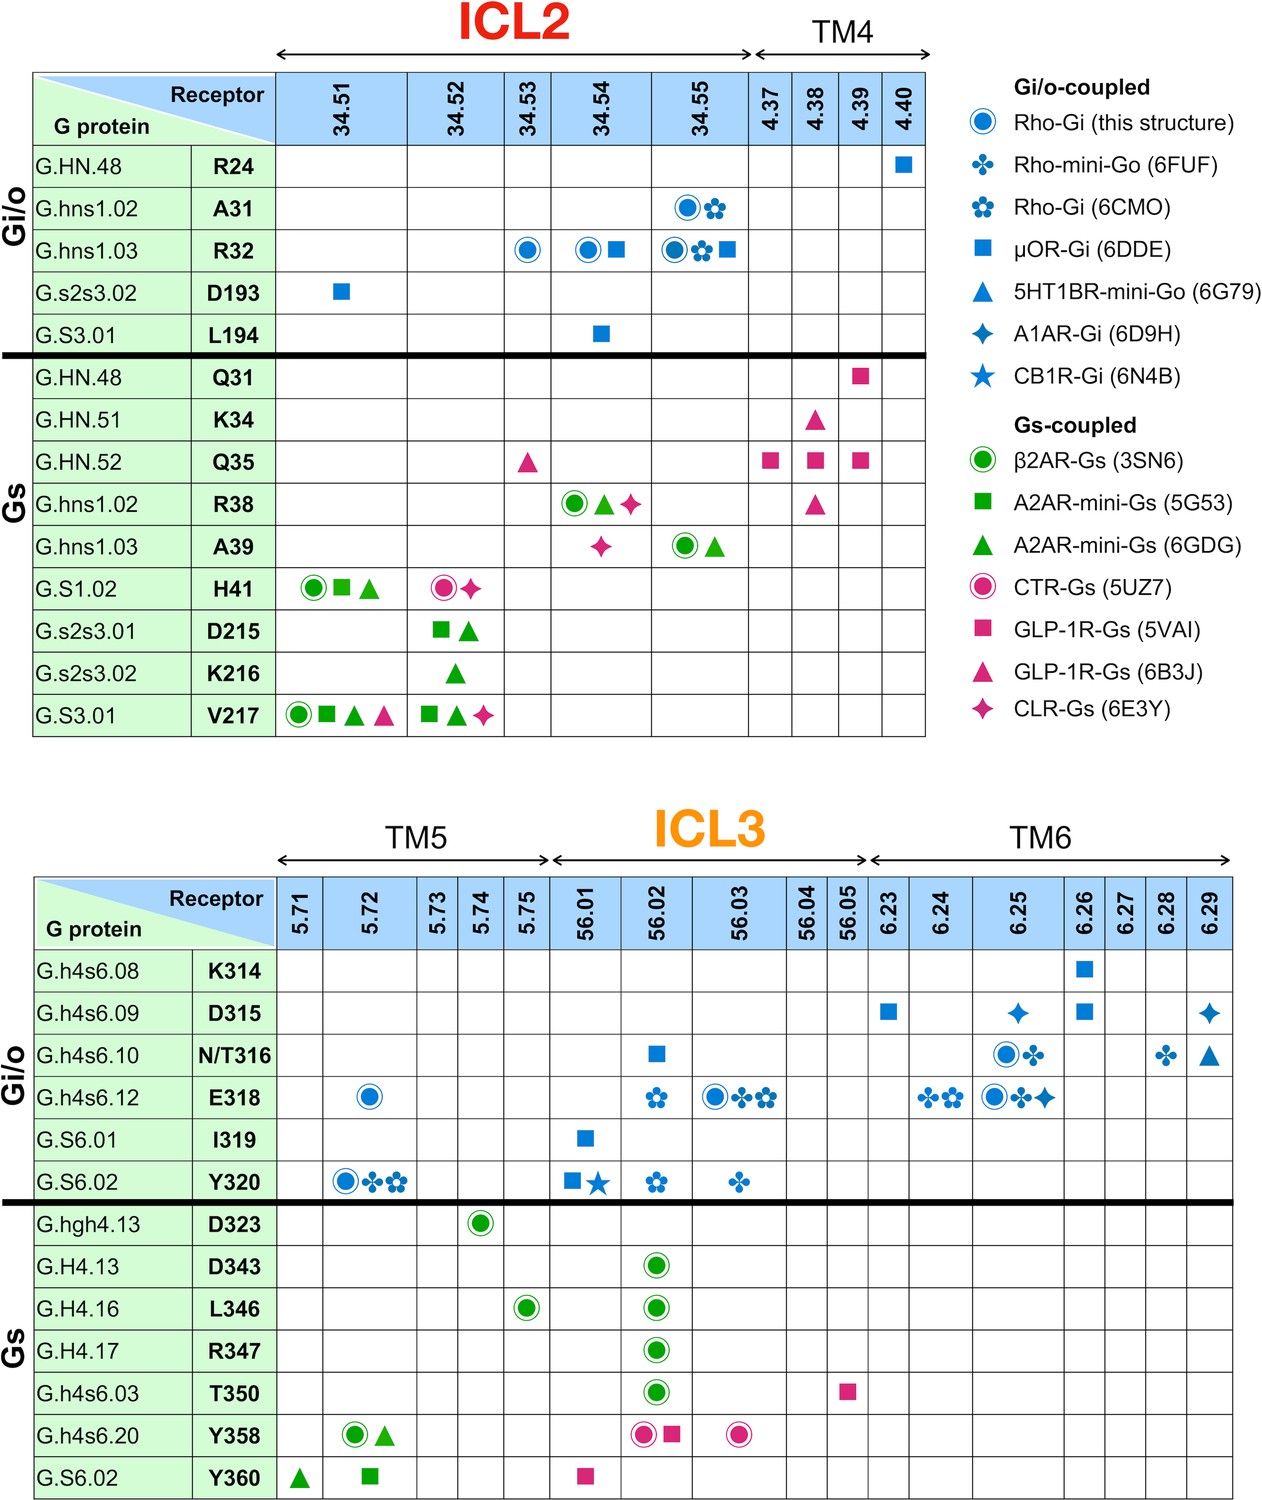
Residue-residue contacts between ICL2/3 and Gα.
Contacts at the regions of ICL2 and 3 are identified using a 4 Å cut-off. Residue-residue contacts are listed for the regions of ICL2 (top panel) and ICL3 (bottom panel). The residues of Gα are numbered following the common Gα protein numbering (CGN). Contacts observed in the individual structures are noted as colored bullet symbols (blue – Gi-coupled receptors; green – Gs-coupled, class A receptors; magenta – Gs-coupled, class B receptors).
Figure 3—figure supplement 5
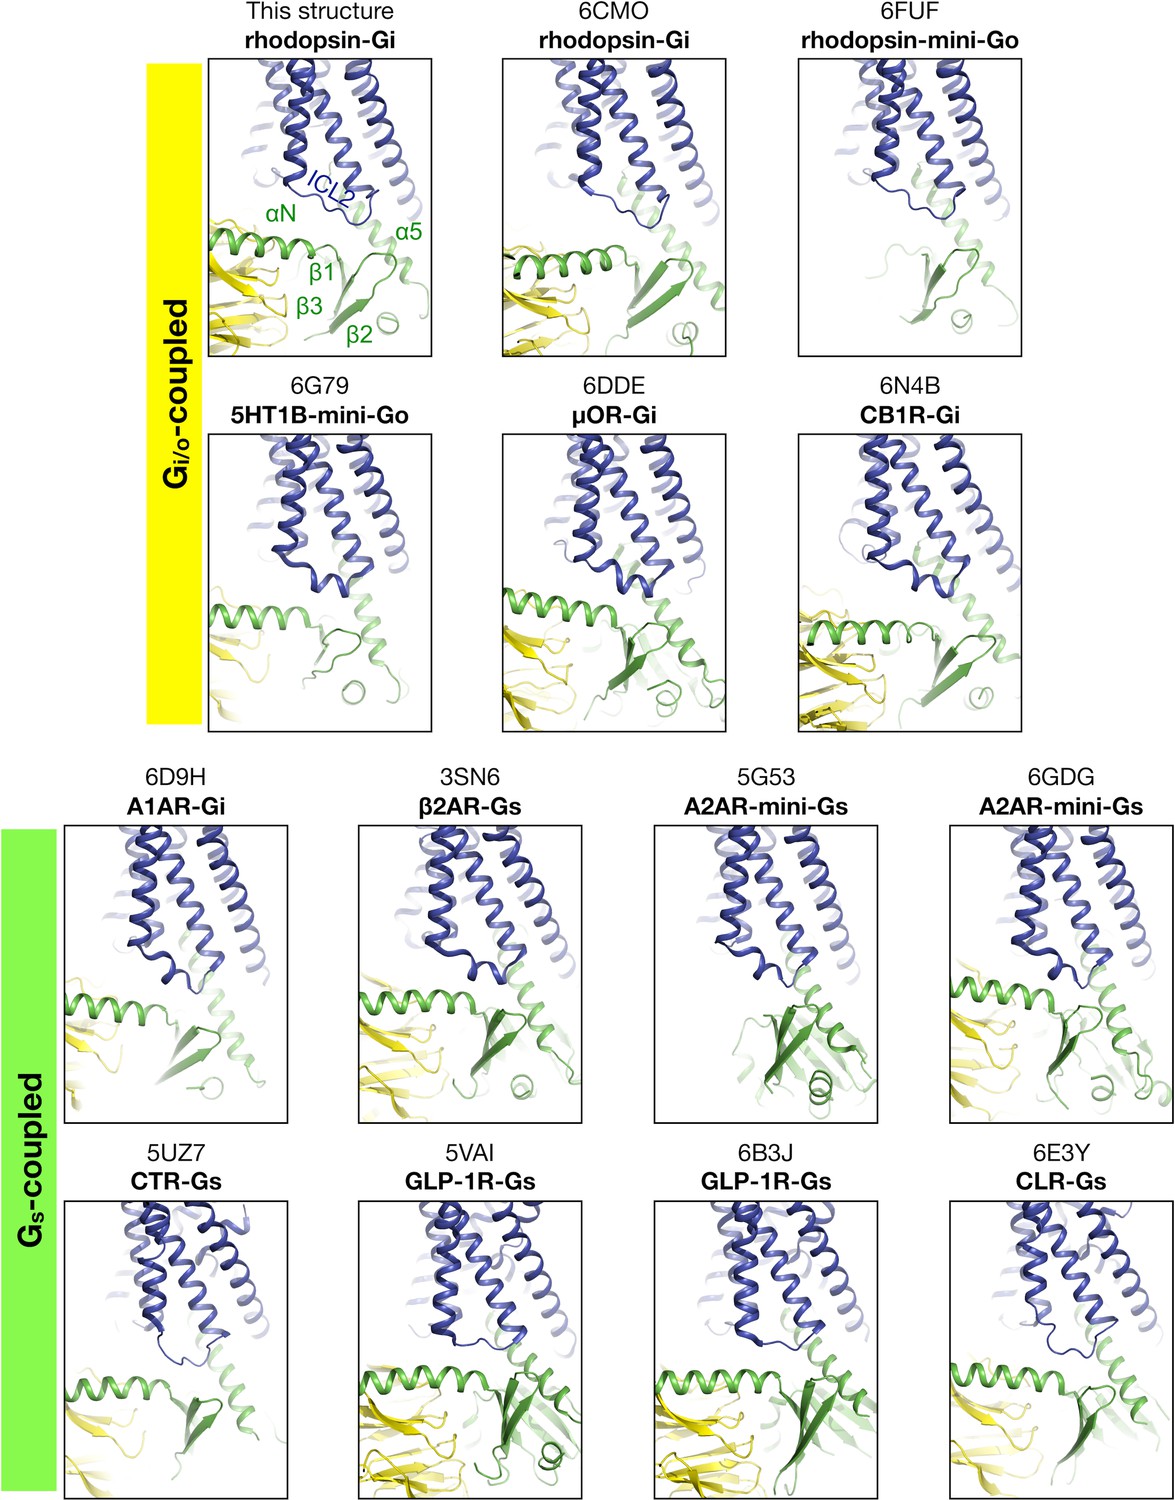
Region near ICL2 in available structures.
View of the existing GPCR-G protein complex structures centered at the ICL2 region. The structures are aligned to the Cα atoms of rhodopsin. The regions of the G protein involved in contacting ICL2 are the αN/β1 and β2/β3 turns, and the α5 helix.
Tables
Key resources table
| Reagent type (species) or resource | Designation | Source or reference | Identifier | Addition information |
|---|---|---|---|---|
| Strain, strain background (E. coli) | BL21(DE3) | Sigma-Aldrich | SA: CMC0014 | |
| Cell line (H. sapiens) | HEK293 GnTI- | Reeves laboratory (gift) | Under MTA with MIT, Cambridge, MA, US. | PMID: 12370423 |
| Cell line (M. musculus) | Hybridoma | Hoffmann-La Roche (by collaboration) | Under MTA with Hoffmann-La Roche, Basel, Switzerland. | Maeda et al., 2018 |
| Biological sample (B. taurus) | Bovine retinae | WL Lawson Company (USA) | https://wllawsoncompany.com/ | |
| Chemical compound, drug | Blue Sepharose 6 Fast Flow | GE Healthcare | GEH: 17094801 | |
| Chemical compound, drug | Chelating Sepharose Fast Flow immobilized metal affinity chromatography resin | GE Healthcare | GEH: 17057501 | |
| Chemical compound, drug | HiTrap Protein G Sepharose HP column | GE Healthcare | GEH: 17040401 | |
| Chemical compound, drug | Immobilized papain agarose resin | Thermo Scientific | TS: 20341 | |
| Chemical compound, drug | Protein A Sepharose | GE Healthcare | GEH: 17078001 | |
| Chemical compound, drug | CNBr-activated sepharose 4B | GE Healthcare | GEH: 17043001 | |
| Chemical compound, drug | Ultra-low IgG fetal bovine serum | Gibco | Gibco: 16250078 | |
| Chemical compound, drug | Interleukin-6 recombinant mouse protein | Invitrogen | Invitrogen: PMC0064 | |
| Chemical compound, drug | cOmplete EDTA-free protease inhibitor cocktail | Sigma-Aldrich | SA: 1873580001 | |
| Chemical compound, drug | Dodecyl β-maltoside | Anatrace | Anatrace: D310 | |
| Chemical compound, drug | Lauryl-maltoside neopentyl glycol | Anatrace | Anatrace: NG310 | |
| Chemical compound, reagent | 1D4 antibody | Cell Essentials Inc | http://www.cell-essentials.com/ | |
| Chemical compound, drug | 1D4 peptide | Peptide 2.0 | https://www.peptide2.com/ | |
| Chemical compound, drug | 9-cis retinal | Sigma-Aldrich | SA: R5754 | |
| Chemical compound, drug | Apyrase | New England Biolabs | NEB: M0398 | |
| Software, algorithm | XDS | http://xds.mpimf-heidelberg.mpg.de | PMID: 20124692; RRID: SCR_015652 | |
| Software, algorithm | PHENIX | https://www.phenix-online.org | Adams et al., 2010; RRID: SCR_014224 | |
| Software, algorithm | UCSF Chimera | https://www.cgl.ucsf.edu/chimera | Pettersen et al., 2004; RRID: SCR_004097 | |
| Software, algorithm | PyMOL | Schrödinger LLC | https://pymol.org | RRID:SCR_000305 |
| Software, algorithm | FOCUS | https://focus.c-cina.unibas.ch/about.php | Biyani et al., 2017 | |
| Software, algorithm | MotionCor2 | http://msg.ucsf.edu/em/software/motioncor2.html | Zheng et al., 2017; RRID: SCR_016499 | |
| Software, algorithm | cryoSPARC | Structura Biotechnology Inc. | https://cryosparc.com | PMID: 28165473; RRID: SCR_016501 |
| Software, algorithm | RELION 2, 3 | http://www2.mrc-lmb.cam.ac.uk/relion | RRID:SCR_016274 | |
| Software, algorithm | NAMD | http://www.ks.uiuc.edu/Research/namd | RRID:SCR_014894 | |
| Software, algorithm | Coot | https://www2.mrc-lmb.cam.ac.uk/personal/pemsley/coot | Emsley and Cowtan, 2004; RRID: SCR_014222 |
Additional files
-
Supplementary file 1
Supplementary Tables.
Supplementary Table 1. Cryo-EM data collection and refinement statistics. Supplementary Table 2. Crystallographic data and structural refinement of Fab16.
- https://doi.org/10.7554/eLife.46041.022
-
Transparent reporting form
- https://doi.org/10.7554/eLife.46041.023
Download links
A two-part list of links to download the article, or parts of the article, in various formats.
Downloads (link to download the article as PDF)
Open citations (links to open the citations from this article in various online reference manager services)
Cite this article (links to download the citations from this article in formats compatible with various reference manager tools)
Cryo-EM structure of the rhodopsin-Gαi-βγ complex reveals binding of the rhodopsin C-terminal tail to the gβ subunit
eLife 8:e46041.
https://doi.org/10.7554/eLife.46041


