Unique-region phosphorylation targets LynA for rapid degradation, tuning its expression and signaling in myeloid cells
- University of Minnesota, United States
- Norwegian University of Science and Technology, Norway
- Hammersmith Hospital, Imperial College London, United Kingdom
Figures
Figure 1 with 2 supplements

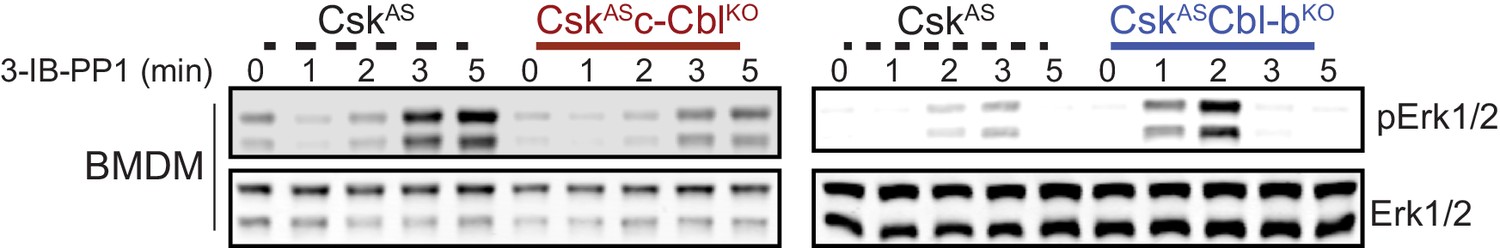
Loss of c-Cbl expression in macrophages leads to steady-state upregulation and delayed degradation of LynA protein.
(A) Immunoblots showing LynA, c-Cbl, and Cbl-b protein in CskAS, CskASc-CblKO, and CskASCbl-bKO BMDMs treated with 3-IB-PP1 for the indicated times. Interdomain-B-phosphorylated SykpY352 (pSyk, Yan et al., 2013; Wang et al., 2010; Law et al., 1996), an SFK target and prerequisite for Syk activation, is shown as a control for 3-IB-PP1-initiated signaling; total Erk1/2 is shown as a loading control. (B–D) Densitometry quantification of relative levels of Cbl and LynA protein, corrected for total protein content using REVERT Total Protein Stain (TPS). (B) Quantification of c-Cbl (red) and Cbl-b (blue) in CskASc-CblKO and CskASCbl-bKO BMDMs relative (rel.) to their steady-state levels in CskAS BMDMs (dotted line). Expression of the other Cbl family member is shown in gray. Error bars reflect the standard error of the mean (SEM), n = 4 from three CskASCbl-/- mice and n = 3 from two CskASCblb-/- mice. (C–D) Quantification of LynA relative to the steady-state level in each genotype (C) or relative to the steady-state level in CskAS BMDMs (D). SEM, n = 8 for CskAS, n = 5 from three CskASCbl-/- mice, n = 3 from two CskASCblb-/- mice. The significance (Sig.) from two-way ANOVA (ANOVA2) with Tukey’s multiple comparison test (-Tukey) are as follows: [CskASc-CblKO vs. CskAS black asterisks], [CskASc-CblKO vs. CskASCbl-bKO, blue asterisks]; ****p<0.0001, ***p=0.0001–0.0005, * P=0.0171–0.0459. No significant difference was detected between other pairs (ns). Note: some of the error bars are smaller than the line width. Refer to Figure 1—source data 1. Paradoxical changes in Erk1/2 phosphorylation in Cbl-deficient cells are shown in Figure 1—figure supplement 1. Supporting siRNA studies are shown Figure 1—figure supplement 2.
-
Figure 1—source data 1
Quantification of Cbl and LynA proteins in BMDMs lacking c-Cbl or Cbl-b.
- https://doi.org/10.7554/eLife.46043.006
Figure 1—figure supplement 1
Paradoxical changes in Erk1/2 phosphorylation in Cbl-deficient cells obscure the contribution of LynA to signaling.
Immunoblot showing impaired activating phosphorylation of Erk1/2pT202/pY204 (pErk1/2) in CskASc-CblKO BMDMs and enhanced Erk phosphorylation in CskASCbl-bKO BMDMs compared to CskAS BMDMs treated with 3-IB-PP1.
Figure 1—figure supplement 2
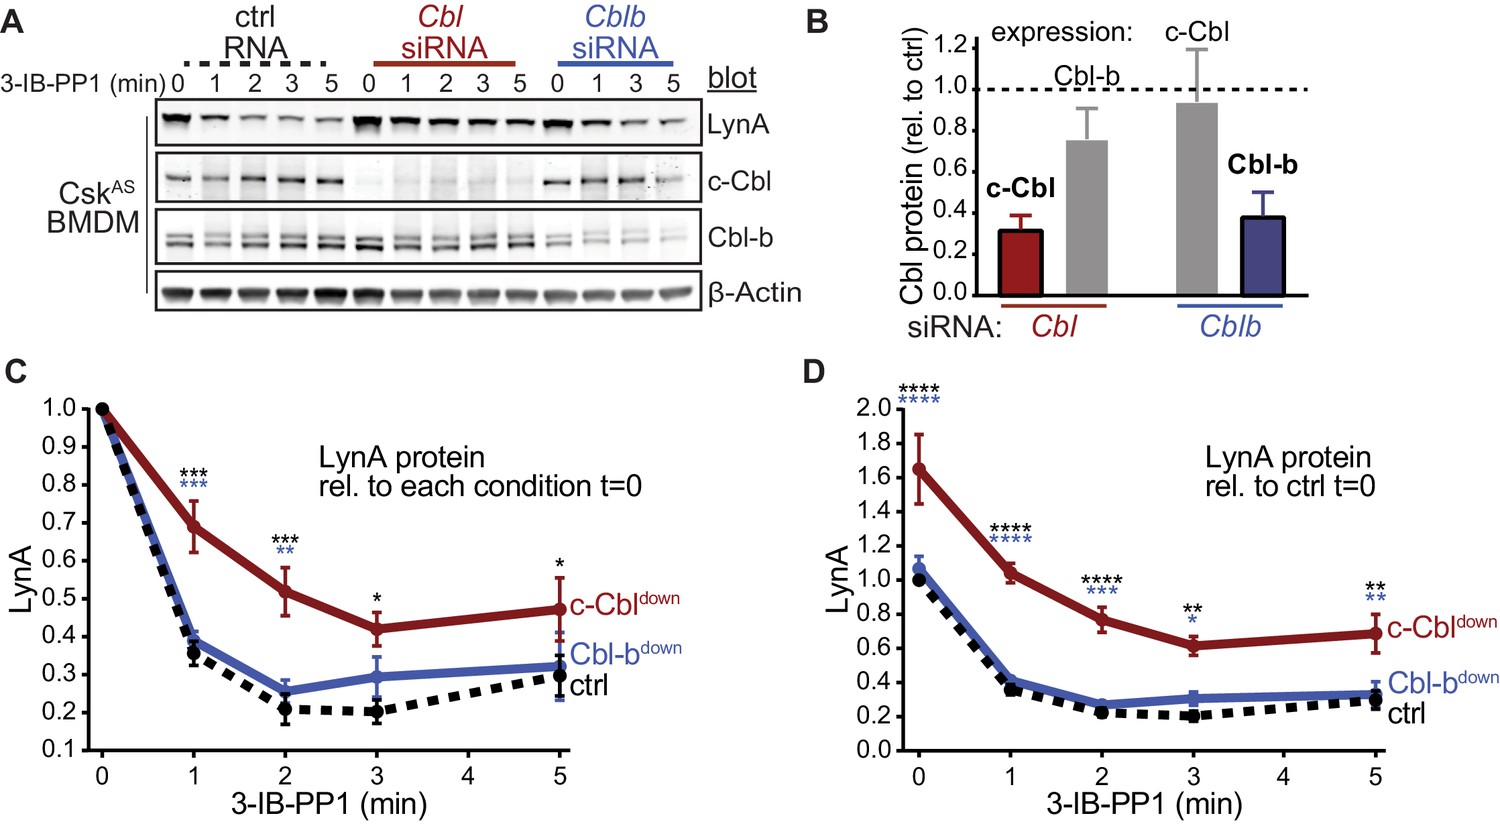
siRNA knockdown of c-Cbl expression in macrophages leads to steady-state upregulation and delayed degradation of LynA protein.
(A) Immunoblots showing LynA, c-Cbl, and Cbl-b protein in CskAS BMDMs transfected with non-targeting RNA (ctrl) or with siRNA constructs targeting Cbl or Cblb mRNA. Rested cells were treated with 3-IB-PP1 for the indicated times; β-Actin is shown as a loading control. (B–D) Quantification of relative c-Cbl, Cbl-b, and LynA protein, corrected for total protein content (TPS). SEM, n = 3. (B) Quantification of c-Cbl protein (red) and Cbl-b protein (blue), reported relative to their expression in ctrl BMDMs (dotted line). Remaining expression of the other Cbl family member is shown in gray. (C–D) Quantification of LynA, reported relative to the steady-state level in each siRNA condition (C) or relative to the level in the ctrl sample at steady state (D) in ctrl (black dotted), c-Cbldown (red), and Cbl-bdown (blue) samples. Sig. from ANOVA2-Tukey: [c-Cbldown vs. ctrl, black asterisks], [c-Cbldown vs. Cbl-bdown, blue asterisks]; ****p<0.0001, ***p=0.0001–0.0005, **p=0.0015–0.0058, * P=0.0105–0.0451. Other pairs ns. Refer to Figure 1—figure supplement 2—source data 1.
-
Figure 1—figure supplement 2—source data 1
Quantification of Cbl and LynA proteins in BMDMs deficient in c-Cbl or Cbl-b.
- https://doi.org/10.7554/eLife.46043.005
Figure 2

LynA is degraded more rapidly than Fyn and Lck during 3-IB-PP1 treatment.
Immunoblots and quantification of SFK levels over the course of 3-IB-PP1 treatment. In both panels total Erk1/2 protein is shown as a loading control. Quantified values are corrected for total protein content (TPS) and reported relative to the steady-state level of each SFK. (A) Levels of Fyn (dark orange), Hck (light orange), LynA (black), and LynB (brown dashed) in 3-IB-PP1-treated CskAS BMDMs. SEM, n = 3. Sig. from ANOVA2-Tukey: [Fyn vs. LynA, dark orange asterisks], [Hck vs. LynA, light orange asterisks], [LynB vs. LynA, brown asterisks]; ****p<0.0001, ***p=0.0006–0.0009, **p=0.0034. (B) Levels of Fyn (dark orange) and Lck (blue dashed) and His6V5-tagged LynA (black) in 3-IB-PP1-treated Jurkat T cells cotransfected with His6V5-tagged LynA, memCskAS, and c-Cbl. SEM, n = 4. Sig. from ANOVA2-Tukey: [Lck vs. LynA, blue asterisks], [Fyn vs. LynA, dark orange asterisks]; **p=0.0018–0.0048. Other pairs ns. Refer to Figure 2—source data 1.
-
Figure 2—source data 1
Quantification of SFKs during 3-IB-PP1 treatment in mouse BMDMs and Jurkat cells.
- https://doi.org/10.7554/eLife.46043.008
Figure 3 with 2 supplements
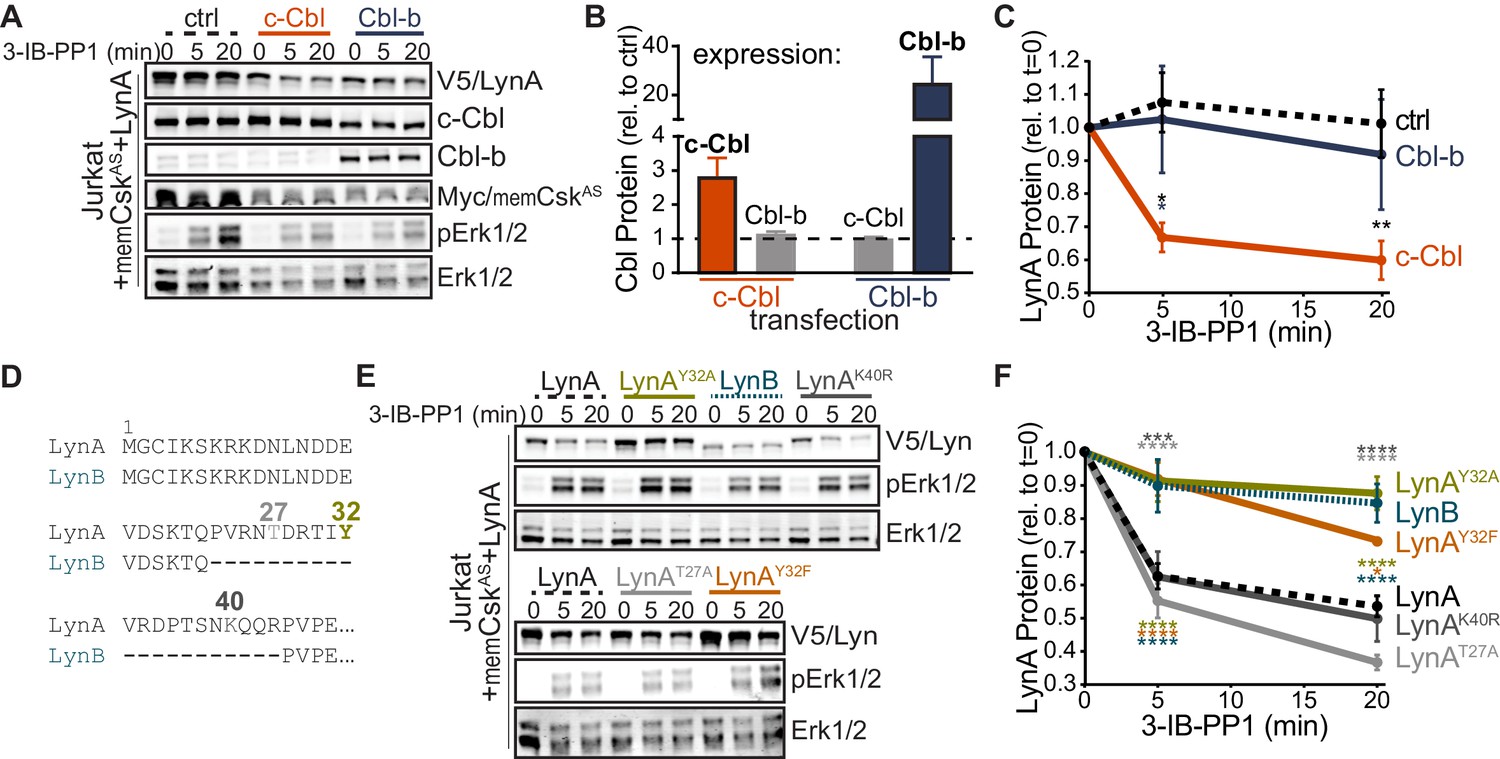
Unique-region tyrosine 32 is required for activation-induced degradation of LynA.
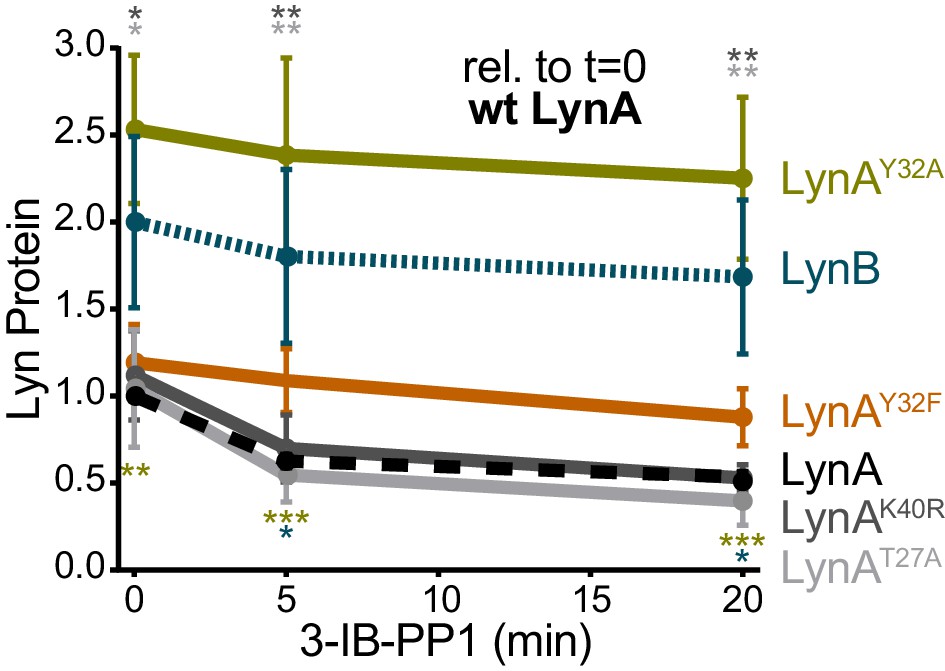
(A) Immunoblots of Jurkat cells cotransfected with His6V5-tagged LynA, Myc-tagged memCskAS, and either empty vector (ctrl), c-Cbl, or Cbl-b and treated with 3-IB-PP1. Phosphorylated Erk1/2pT202/pY204 (pErk1/2) is shown as a qualitative control for 3-IB-PP1-initiated signaling from the combined effects of transfected LynA and endogenous Lck; total Erk1/2 is shown as a loading control. (B–C) Quantification of relative c-Cbl, Cbl-b, and His6V5-tagged LynA protein, corrected for total protein content (TPS). SEM, n = 4. (B) Quantification of overexpressed c-Cbl (orange) and Cbl-b (dark blue) relative to endogenous (ctrl) levels (dotted line). Endogenous expression of the other Cbl family member in each condition is shown in gray. (C) Quantification of LynA protein during 3-IB-PP1 treatment relative to the steady-state level for transfections of empty-vector ctrl (black dotted), c-Cbl (orange), or Cbl-b (dark blue). Sig. from ANOVA2-Tukey: [c-Cbl vs. ctrl, black asterisks], [c-Cbl vs. Cbl-b, blue asterisk]; **p=0.0092, *p=0.0270–0.0102. Other pairs ns. (D) N-terminal amino-acid sequences of mouse LynA and LynB (Yi et al., 1991; Stanley et al., 1991), including the 21 residue insert in the unique region of LynA, highlighting residues Y32 (olive), T27 (light gray), and K40 (dark gray). (E) Immunoblots of 3-IB-PP1-treated Jurkat cells cotransfected with c-Cbl, Myc-tagged memCskAS, and His6V5-tagged Lyn constructs, including wild-type LynA, LynAY32A, LynB, LynAK40R, LynAT27A, and LynAY32F. (F) Quantification of protein levels of V5-tagged LynA (black dotted), LynAY32A (olive), LynB (teal dotted), LynAK40R (dark gray), LynAT27A (light gray), and LynAY32F (orange) over the course of 3-IB-PP1 treatment, corrected for total protein content (TPS) and reported relative to the steady-state level for each Lyn variant. SEM, n = 7 for LynA, n = 4 for LynAY32A and LynB; n = 3 for LynAK40R, LynAT27A, and LynAY32F. Sig. from ANOVA2-Tukey: [LynAY32A vs. LynA, olive asterisks], [LynB vs. LynA, teal asterisks], [LynAY32F vs. LynA, orange asterisks], [LynAK40R vs. LynAY32A, dark gray asterisks], [LynAT27A vs. LynAY32A, light gray asterisks], [LynB vs. LynAK40R, p=0.013, p=0.01], [LynB vs. LynAT27A, p<0001], [LynY32F vs. LynAK40R, p=0.012, 0.0157], [LynT27A vs. LynAY32F, p<0.0001], [LynY32A vs. LynAK10R, p<0.0001]; ****p<0.0001, ***p=0.0006, *p=0.0166. Other pairs ns. Note: the error bar for LynAY32F is smaller than the line width. Refer to Figure 3—source data 1. Refer to Figure 3—figure supplement 1 for microscopy showing localization of unique-region-only constructs of Lyn. Refer to Figure 3—figure supplement 2 for quantification of relative expression levels of LynA variants and LynB.
-
Figure 3—source data 1
Quantification of c-Cbl and Lyn proteins coexpressed in Jurkat cells.
- https://doi.org/10.7554/eLife.46043.013
Figure 3—figure supplement 1
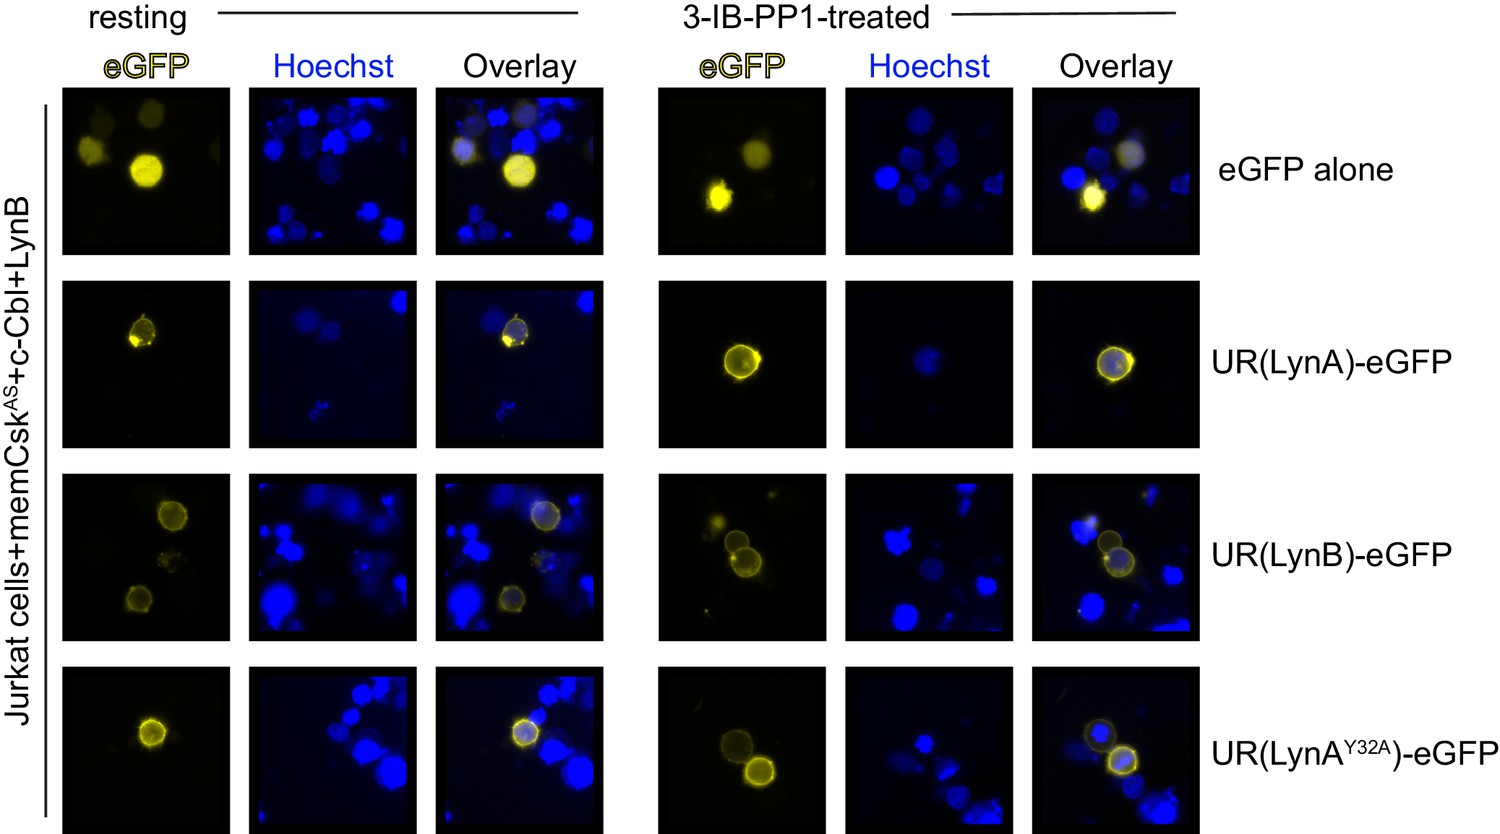
The unique regions of LynA, LynB, and LynAY32A are membrane-localized in resting and 3-IB-PP1-treated cells.
Representative epifluorescence images of GFP-tagged unique-region (UR) constructs of LynA, LynB, and LynAY32A, showing localization in Jurkat cells before and after treatment for 5 min with 3-IB-PP1.
Figure 3—figure supplement 2
LynAY32A and LynB are more highly expressed than wild-type LynA when expressed ectopically in Jurkat cells.
Quantification of His6V5-tagged LynA protein in Jurkat cells, reported relative to the steady-state expression of transfected wild-type His6V5-tagged LynA protein. Sig. from ANOVA2-Tukey: [LynAY32A vs. LynA, olive asterisks], [LynB vs. LynA, teal asterisks], [LynAK40R vs. LynAY32A, dark gray asterisks], [LynAT27A vs. LynAY32A, light gray asterisks]; ***p=0.0002–0.0004, **p=0.0018–0.0062, * P=0.0216–0.0361. Other pairs ns. Refer to Figure 3—figure supplement 2—source data 1.
-
Figure 3—figure supplement 2—source data 1
Quantification of transfected Lyn constructs relative to wild-type LynA.
- https://doi.org/10.7554/eLife.46043.012
Figure 4 with 5 supplements
Tyrosine 32 is a site of activation-induced phosphorylation in macrophages.
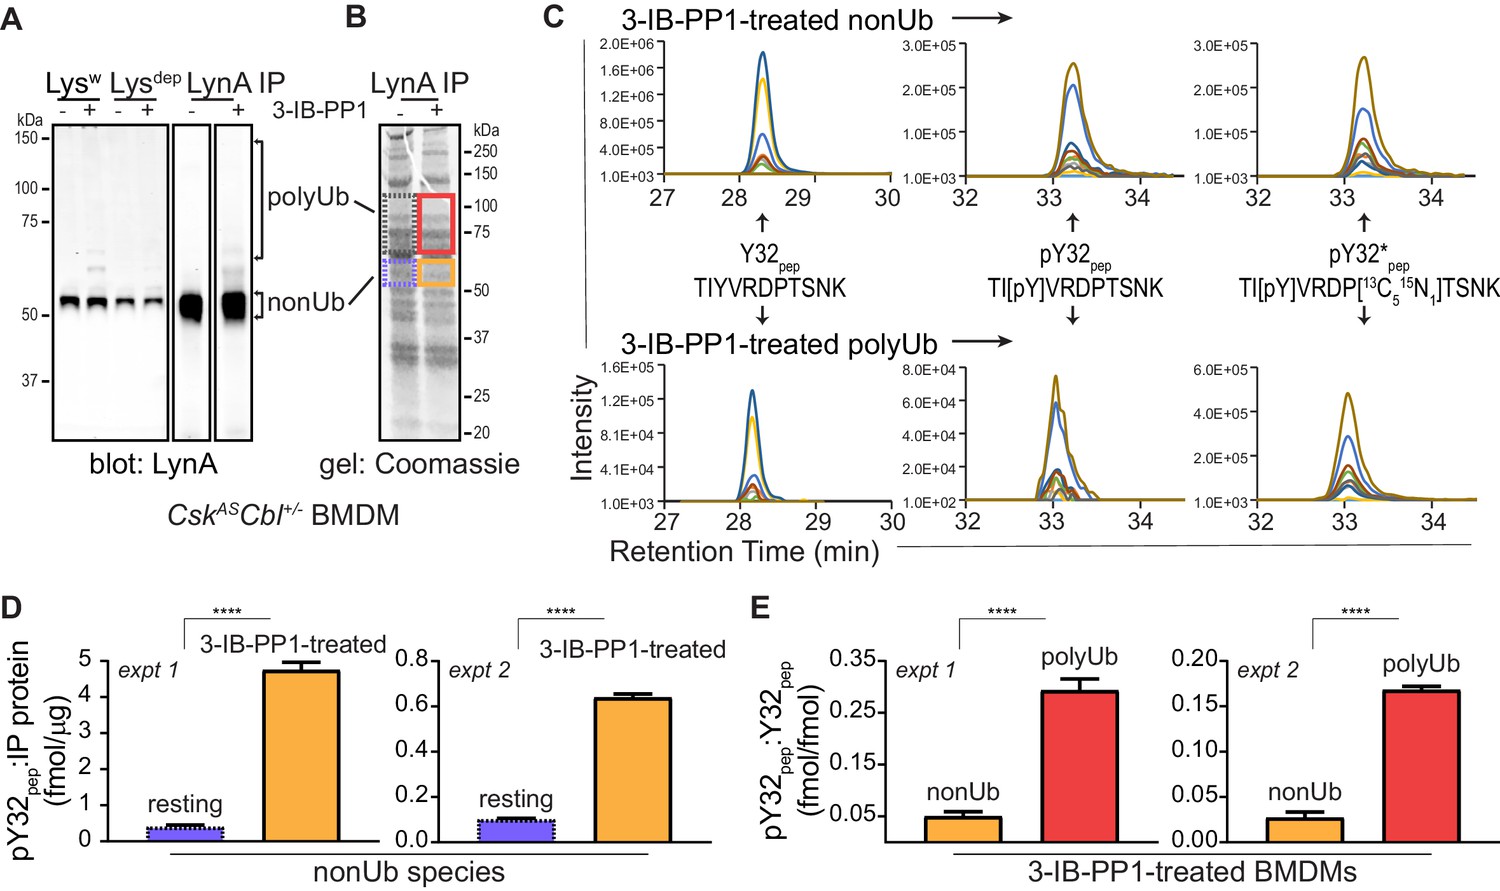
(A) Blots showing immunoprecipitation of LynA from BMDMs derived from CskASCbl+/- mice with (+) or without (-) a 15 s treatment with 3-IB-PP1. Nonubiquitinated (nonUb) and polyubiquitinated (polyUb) LynA species in whole-cell and immunodepleted lysate (Lysw and Lysdep, respectively) and immunoprecipitate (IP) samples are shown. Uncropped immunoblots are shown in Figure 4—figure supplement 1A. (B) Coomassie-stained gel showing regions excised for LC-MS/MS analysis of polyUb LynA (higher boxes) and nonUb LynA (lower boxes); box colors correspond to the bar graphs below. Total IP protein content was quantified by applying densitometry to the whole lane and deriving a mass value via a BSA standard curve, shown in Figure 4—figure supplement 1B. Equivalent amounts of IP material were spiked with 125 fmol isotope-labeled control peptide (pY32*pep, a tryptic peptide containing phosphoY32) and subjected to in-gel trypsin digestion and LC-MS/MS. (C) Tryptic peptides Y32pep (IP-derived unphosphorylated peptide), pY32pep (IP-derived phosphopeptide), and added pY32*pep were quantified by using parallel reaction monitoring (PRM) to collect MS/MS spectra for peptide parent ions 687.3267 and 690.3336 m/z, respectively. Extracted ion chromatograms (XICs) were derived from Skyline for MS/MS fragment ions corresponding to y and b fragments from Y32, pY32, and pY32* peptides and used to quantify the ratios of pY32pep:pY32*pep or pY32pep:Y32pep. Representative ion-annotated XICs are shown in Figure 4—figure supplement 2. Assignment of XIC peaks using synthetic peptides is shown in Figure 4—figure supplement 3. Detection of phosphopeptides in IP samples is shown in Figure 4—figure supplement 4. Peptide calibration curves are shown in Figure 4—figure supplement 5. (D–E) Quantitative analysis of Y32 phosphorylation in resting and 3-IB-PP1-treated BMDMs, including nonUb species from resting BMDMs (blue dotted), nonUb species from 3-IB-PP1-treated BMDMs (orange), and polyUb species from 3-IB-PP1-treated BMDMs (red). Although we analyzed a gel fragment that could contain polyUb species in resting BMDMs (gray dotted), this species was so rare as to be unquantifiable. Error bars represent the standard deviation (stdev) of n = 3 technical replicates. Data from two biological replicates are shown side by side. (D) Quantification of pY32pep in nonUb species from resting vs. 3-IB-PP1-treated BMDMs normalized to the total protein content of each IP. This analysis was used only for nonUb samples, which were roughly equimolar in resting and 3-IB-PP1-treated BMDMs. Sig. from two-tailed t tests for each experiment: [nonUb resting vs. nonUb 3-IB-PP1-treated, asterisks]; ****p<0.0001. (E) Quantification of pY32pep in nonUb vs. polyUb species in 3-IB-PP1-treated BMDMs normalized to the amount of unphosphorylated Y32 pep. Sig. from two-tailed t tests for each experiment: [nonUb resting vs. nonUb 3-IB-PP1-treated, asterisks]; ****p<0.0001. Refer to Figure 4—source data 1. Raw mass spectrometry files are available at the Panorama repository http://panoramaweb.org, http://panoramaweb.org/Freedman_LynA.url, ProteomeXchange ID: PXD014621).
-
Figure 4—source data 1
Summary quantification of pY32 peptide from LC-MS/MS data.
- https://doi.org/10.7554/eLife.46043.027
Figure 4—figure supplement 1
Uncropped blots and BSA standard curve for mass spectrometry samples.
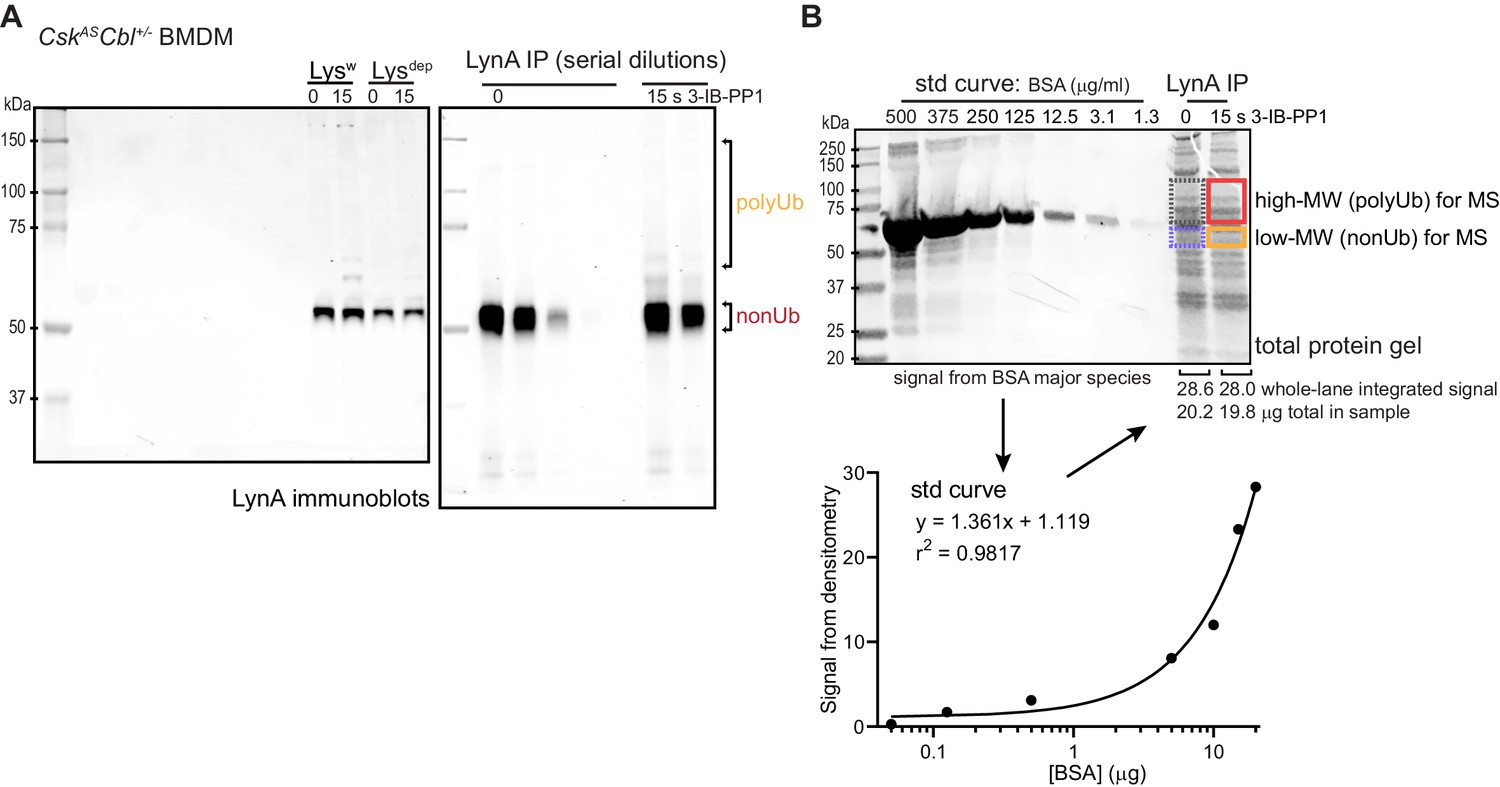
(A) Uncropped images of LynA immunoblots show positions of molecular weight markers and serially diluted LynA immunoprecipitates. (B) Uncropped Coomassie-stained gel shwoing the BSA standard curve (left lanes) and the total protein inputs from the IPs in (A). The lower panel shows densitometry quantification of protein-stain signal intensity from each BSA standard (std) and fitting of the standard curve. The mass of total protein in each immunoprecipitate was then quantified to normalize the sample input for LC-MS/MS. Refer to Figure 4—figure supplement 1—source data 1 for BSA calibration of IPs.
-
Figure 4—figure supplement 1—source data 1
BSA standard curve for quantification of immunoprecipitated protein.
- https://doi.org/10.7554/eLife.46043.016
Figure 4—figure supplement 2
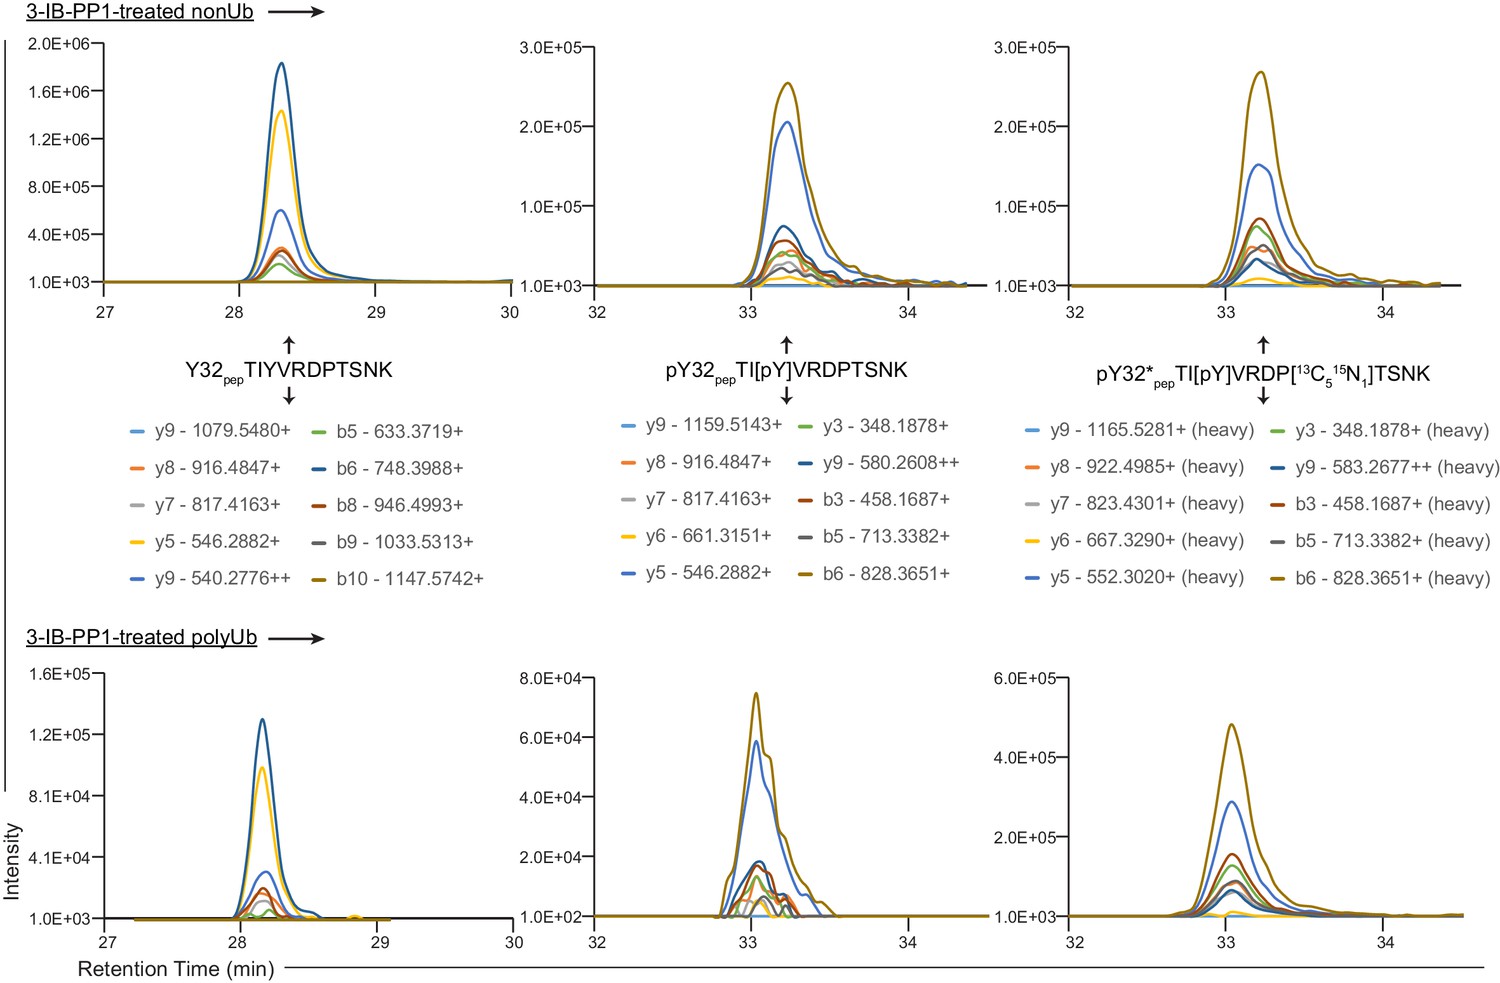
Annotated XICs.
XICs from Figure 4C showing charge states and m/z values for y and b fragments from Y32 pep, pY32 pep, and pY32*pep.
Figure 4—figure supplement 3

PRM chromatograms and spectra for unphosphorylated and phosphorylated LynA Y32 tryptic peptides.
(A) PRM chromatograms illustrating resolution of synthetic phosphorylated and unphosphorylated peptides (top and middle panels), resolution of pY32 and synthetic threonine-phosphorylated (pT) species (middle panel), and coelution of unlabeled pY32pep with isotope-labeled pY32*pep (middle and bottom panels). Species detected in LynA IPs (Y32 pep, pY32 pep, and pY32*pep) are indicated in bold type, phosphorylation sites are shown in red, and the isotope-labeled proline residue is shown in blue. (B–F) MS/MS spectra for synthetic peptides corresponding to tryptic peptides containing LynA Y32. The expected fragmentation pattern for each is indicated with phosphoions labeled in red/bold and isotope-labeled ions labeled in blue/bold. (B) MS/MS for Y32pep run at 647.3435 m/z. (C) MS/MS for pY32pep run at 687.3267 m/z, with highlighted fragment ions from phosphoY32. (D) MS/MS for pT30pep run at 687.3267 m/z, with highlighted fragment ions from phosphoT30. (E) MS/MS for pT37pep run at 687.3267 m/z, with highlighted fragment ions from phosphoT37. (F) MS/MS for pY32*pep run at 687.3267 m/z, with highlighted fragment ions from phosphoY32 and the isotope-labeled proline residue.
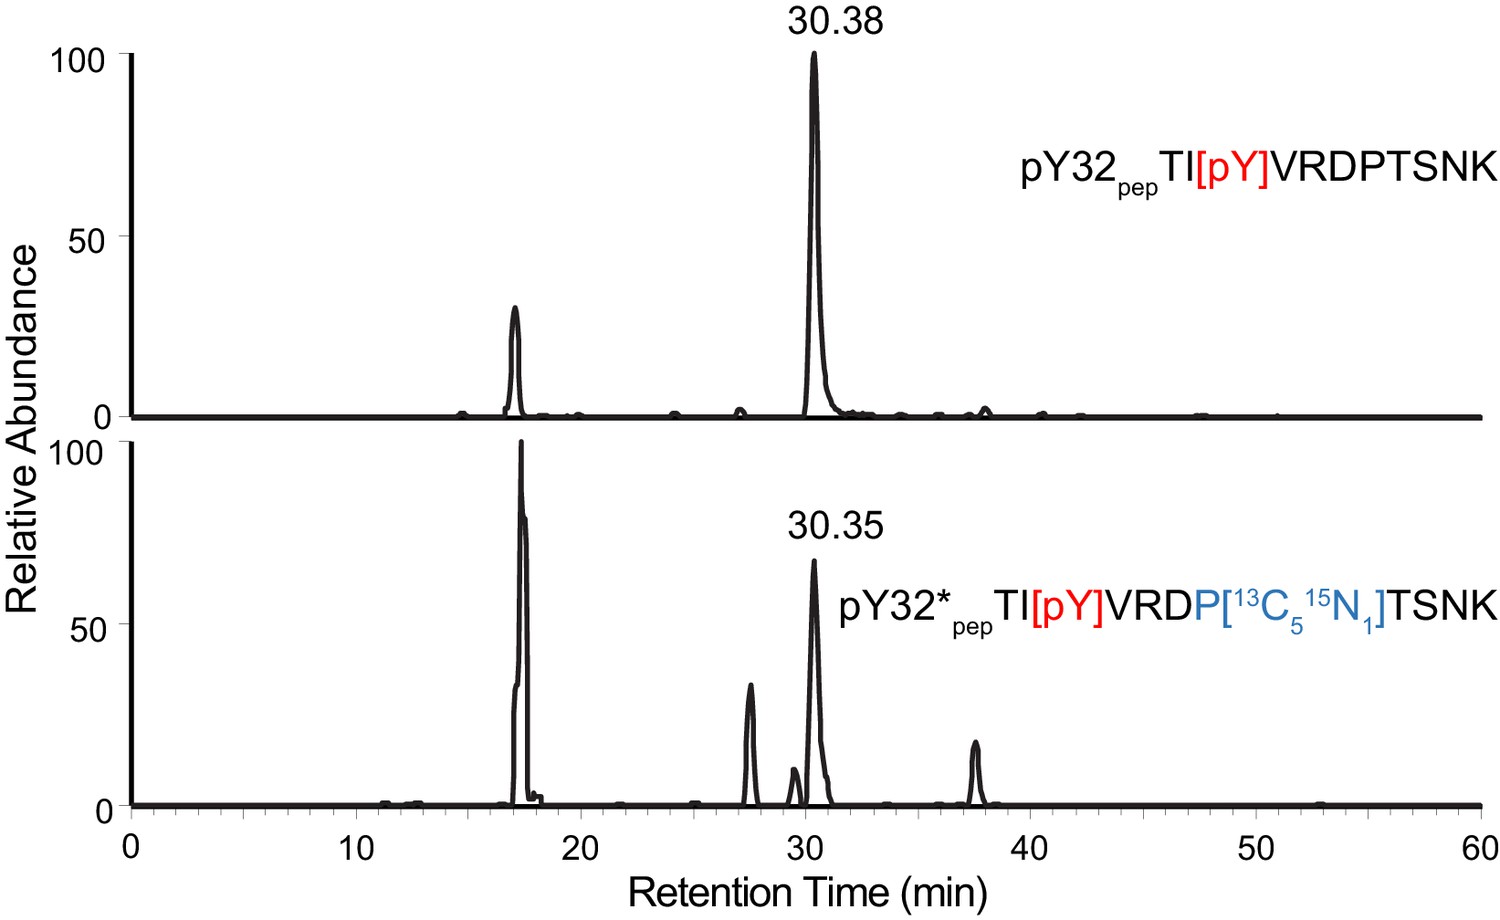
Figure 4—figure supplement 4
Y32 is the only site of phosphorylation detected in LynA Y32-containing tryptic peptide.
XICs of 687.3267 m/z (top) and 690.3336 m/z (bottom) with a 10 ppm tolerance window for nonUb LynA in IPs from 3-IB-PP1-treated BMDMs. The top chromatogram demonstrates that pY32pep TI[pY]VRDPTSNK but not pT30pep [pT]IYVRDPTSNK or pT37pep TIYVRDP[pT]SNK is detected under experimental conditions. The bottom chromatogram shows the co-isolation of isotope-labeled pY32*pep TI[pY]VRDP[13C5 15N1]TSNK from the same sample.
Figure 4—figure supplement 5
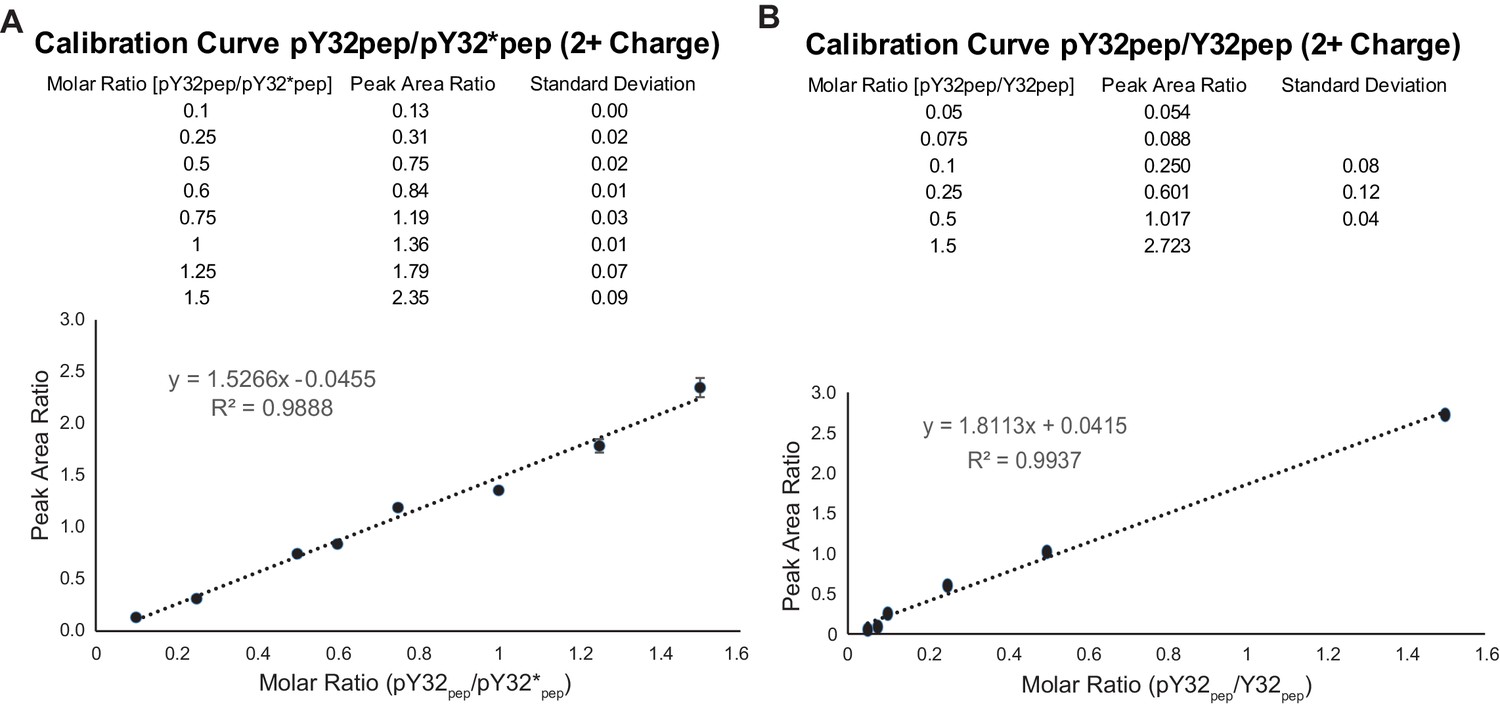
Peptide calibration curves.
(A) Calibration curve for pY32 based on LC-MS/MS analysis. The results reflect the means and standard deviations of data acquired from three independent LC-MS/MS measurements. (B) Calibration curve for Y32 peptide. Refer to Figure 4—figure supplement 5—source data 1, 2 for calibration curve data. Refer to Figure 4—figure supplement 5—source data 3–6 for peptide quantification from Skyline analysis.
-
Figure 4—figure supplement 5—source data 1
Standard curve for quantification of pY32 peptide relative to pY32* peptide in LynA immunoprecipitates.
- https://doi.org/10.7554/eLife.46043.021
-
Figure 4—figure supplement 5—source data 2
Standard curve for quantification of pY32 peptide relative to Y32 peptide in LynA immunopr.
- https://doi.org/10.7554/eLife.46043.022
-
Figure 4—figure supplement 5—source data 3
Quantification of pY32 peptide in nonUb LynA in resting BMDMs.
- https://doi.org/10.7554/eLife.46043.023
-
Figure 4—figure supplement 5—source data 4
Quantification of pY32 peptide in polyUb LynA in resting BMDMs.
- https://doi.org/10.7554/eLife.46043.024
-
Figure 4—figure supplement 5—source data 5
Quantification of pY32 peptide in nonUb LynA in 3-IB-PP1-treated BMDMs.
- https://doi.org/10.7554/eLife.46043.025
-
Figure 4—figure supplement 5—source data 6
Quantification of pY32 peptide in polyUb LynA in 3-IB-PP1-treated BMDMs.
- https://doi.org/10.7554/eLife.46043.026
Figure 5
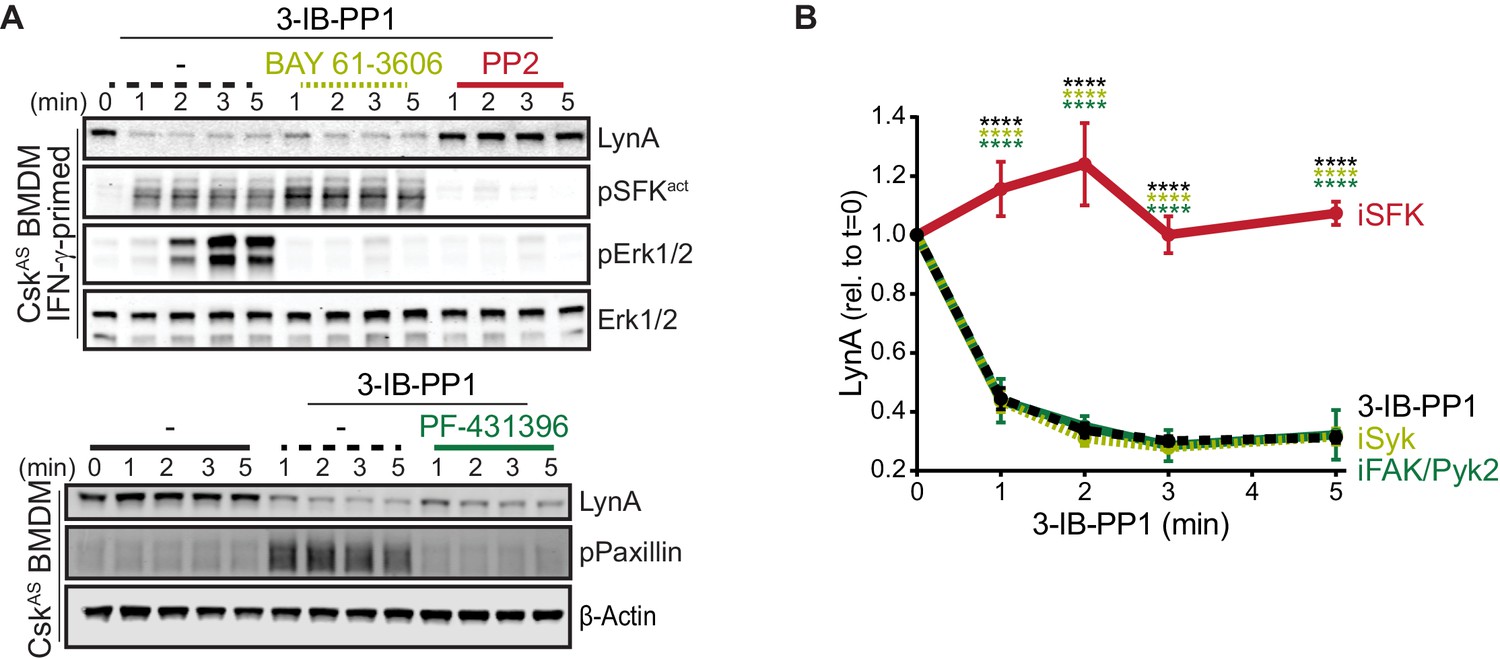
Syk, FAK, and Pyk2 kinase activities are not necessary for the rapid degradation of LynA.
(A) Immunoblots showing expression of endogenous LynA protein in CskAS BMDMs treated with 3-IB-PP1 only or cotreated with 3-IB-PP1 and the Syk inhibitor BAY 61–3606, the SFK inhibitor PP2, or the FAK/Pyk2 inhibitor PF-431396. Activated signaling proteins including SFKs (pSFKact, activation-loop-phosphorylation corresponding to SrcpY416), pErk1/2, and PaxillinpY118 (pPaxillin) are shown as controls for inhibitor function; β-Actin and total Erk1/2 are shown as loading controls. (B) Quantification of LynA protein during 3-IB-PP1 treatment only (black dotted) or with the inhibitors BAY 61–3606 (iSyk, light olive), PP2 (iSFK, red), or PF-431396 (iFAK/Pyk2, green), corrected for total protein content (TPS) and reported relative to the steady-state level of LynA. SEM, n = 3. Sig. from ANOVA2-Tukey: [3-IB-PP1 only vs. 3-IB-PP1+PP2, black asterisks], [3-IB-PP1+BAY 61–3606 vs. 3-IB-PP1+PP2, light olive asterisks], [3-IB-PP1+PF-431396 vs. 3-IB-PP1+PP2, green asterisks]; ****p<0.0001. Other pairs ns. Refer to Figure 5—source data 1.
-
Figure 5—source data 1
Quantification of LynA degradation in BMDMs treated with 3-IB-PP1 and inhibitors.
- https://doi.org/10.7554/eLife.46043.029
Figure 6 with 1 supplement
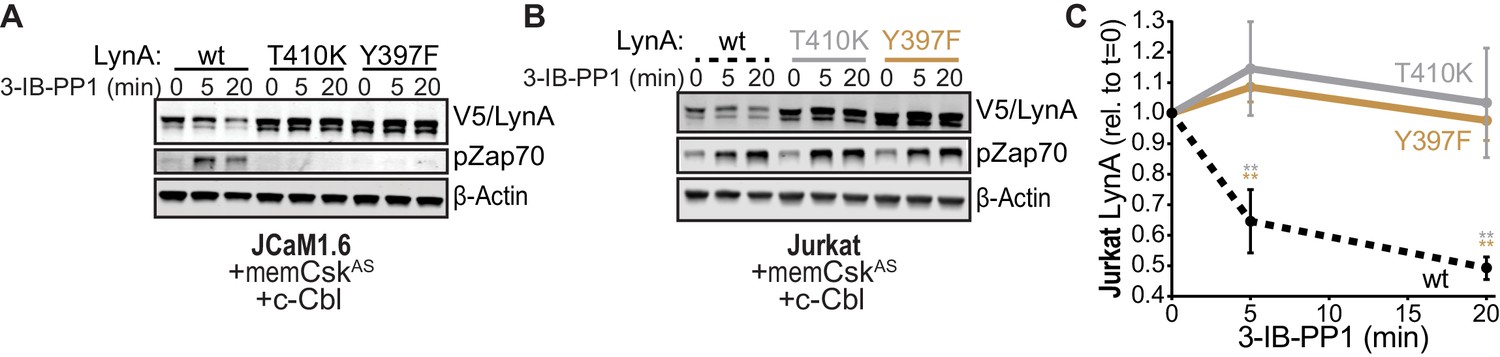
SFK activity is required for rapid degradation of LynA.
(A) Immunoblots showing expression of transfected wild-type (wt), substrate-binding-impaired (T410K), or activation-loop-mutated (Y397F) His6V5-tagged LynA protein coexpressed in JCaM1.6 cells with memCskAS and c-Cbl and treated with 3-IB-PP1. Interdomain-B-phosphorylated Zap70pY319 (pZap70), an SFK target and prerequisite for Zap70 activation, reflects the catalytic activity of LynA; β-Actin is shown as a loading control. (B) Overexpression of LynA variants in Jurkat cells. pZap70 reflects 3-IB-PP1-induced Lck activation. (C) Quantification of V5-tagged LynA variants wt (black dotted), T410K (gray), and Y397F (orange) in Jurkat cells during 3-IB-PP1 treatment, corrected for total protein content (TPS) and reported relative to the steady-state level for each variant of LynA. SEM, n = 3. Sig. from ANOVA2-Tukey: [T410K vs. wt, gray asterisks], [Y397F vs. wt, orange asterisks]; **p=0.0015–0.0083. Other pairs ns. Refer to Figure 6—source data 1. Refer to Figure 6—figure supplement 1 for additional experiments with the catalytic-site mutant LynAK275R.
-
Figure 6—source data 1
Quantification of kinase-impaired LynA proteins expressed in Jurkat cells.
- https://doi.org/10.7554/eLife.46043.033
Figure 6—figure supplement 1
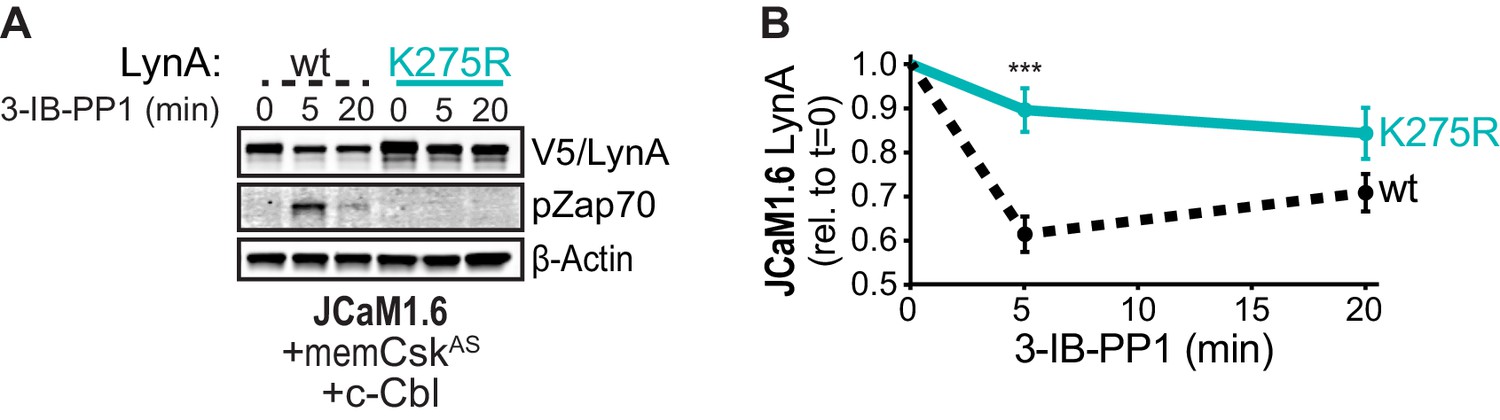
Catalytically dead LynAK275R is not targeted for rapid degradation.
(A) Immunoblots showing ectopic expression of wild-type (wt, black dotted) and active-site-mutated (K275R, cyan) His6V5-tagged LynA protein coexpressed in JCaM1.6 cells with memCskAS and c-Cbl and treated with 3-IB-PP1. pZap70 shows the impaired function of LynAK275R; β-Actin is shown as a loading control. (B) Quantification of V5-tagged LynA protein corrected for total protein content (TPS), reported relative to the steady-state level for each LynA variant. SEM, n = 3. Sig. from ANOVA2 with Sidak’s multiple comparison test: [K275R vs. wt] ***p=0.0008. Refer to Figure 6—figure supplement 1—source data 1.
-
Figure 6—figure supplement 1—source data 1
Quantification of LynAK275R protein in Jurkat cells during 3-IB-PP1 treatment.
- https://doi.org/10.7554/eLife.46043.032
Figure 7 with 2 supplements
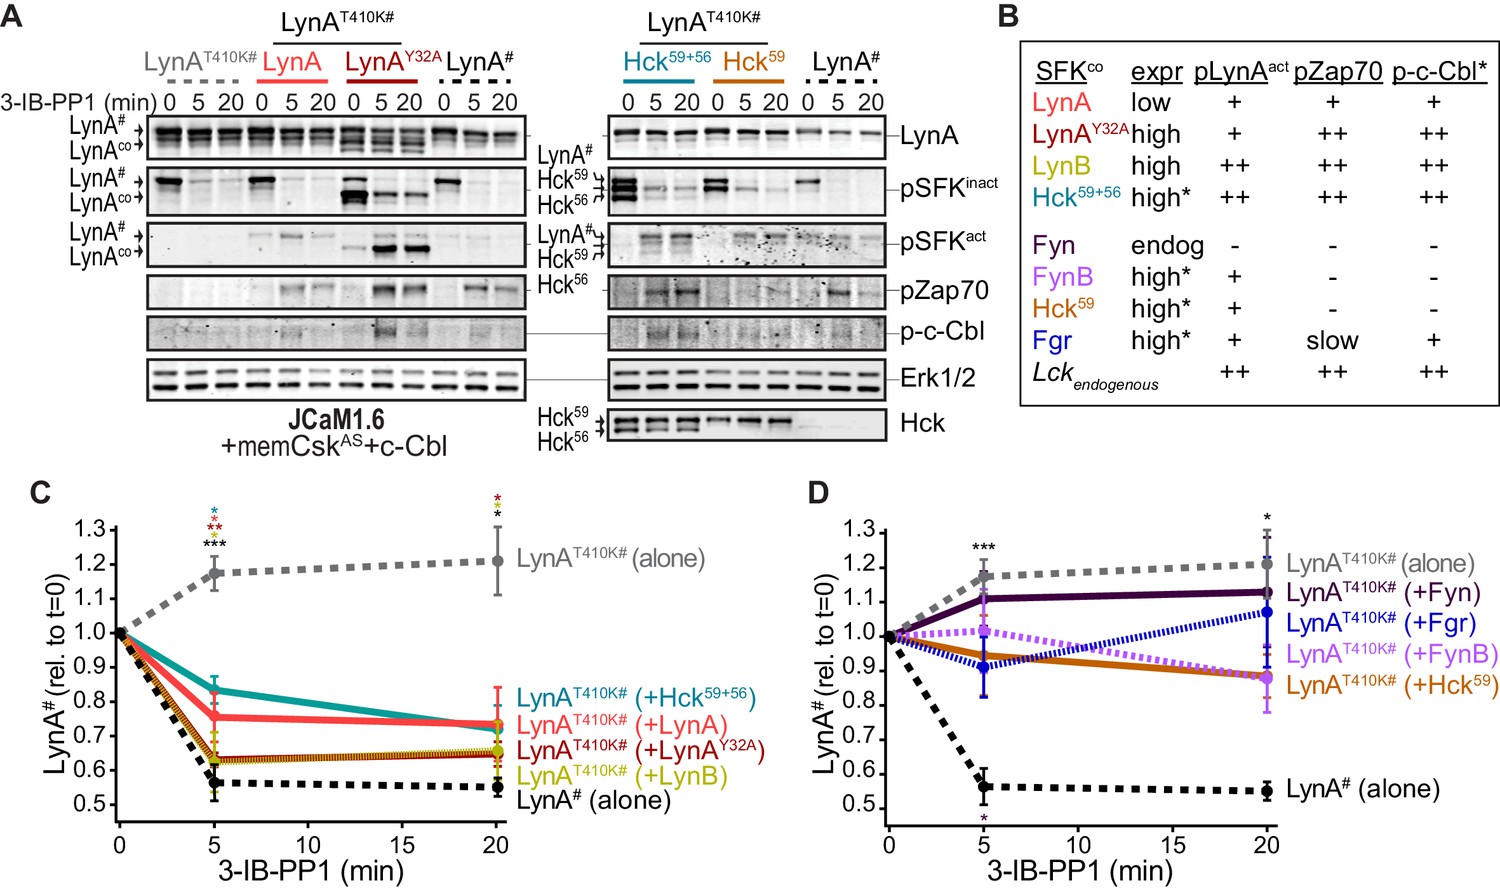
Cotransfected LynA, LynB, and Hck56 can induce rapid degradation of LynAT410K in trans.
(A) Representative immunoblots showing levels of His6V5-tagged LynAT410K (#) cotransfected with empty vector or active SFK (co) in memCskAS- and c-Cbl-expressing JCaM1.6 cells. Refer to Figure 7—figure supplement 1 for an illustration of the experimental layout. Cotransfected SFKs include untagged LynA, untagged LynAY32A, His6V5-tagged LynB, the long and short isoforms of Hck (Hck59+56), the long isoform of Hck (Hck59), FynT (Fyn), FynB, and Fgr. FynT is also expressed endogenously. His6V5-tagged LynAT410K# (or wild-type LynA# in the positive control condition) was quantified from a total LynA blot (top panel). Colors correspond to later figure panels. Coexpressed SFKs are visualized via total SFK and pSFKinact (inhibitory-tail phosphorylated SFK, corresponding to SrcpY530) blots as indicated. pSFKact (activation-loop phosphorylated, corresponding to SrcpY416), pZap70, and p-c-Cbl blots are used to show 3-IB-PP1-induced activity of the cotransfected SFK; Erk1/2 is shown as a loading control. Refer to Figure 7—figure supplement 2A for immunoblots of LynB, Fgr, and Fyn cotransfections. When cotransfected with LynAT410K, untagged wild-type LynA was expressed at very low levels, but its presence is inferred based on induction of Zap70 and c-Cbl phosphorylation with 3-IB-PP1 treatment. (B) Comparison of the expression (expr) levels of cotransfected SFKs (SFKco) and their ability to induce phosphorylation of the LynAT410K activation loop (pLynAact, the highest band in the pSFKact blots), Zap70pY319 and c-CblpY731 (p-c-Cbl) following 3-IB-PP1 treatment. If expression could not be directly compared with the wild-type LynA in the positive-control sample, pSFKinact and/or pSFKact blots werecompared, with the caveat that the antibodies may not bind different SFKs equally well (marked with asterisks). Despite transfection, Fyn was expressed at endogenous levels (endog). Refer to Figure 7—figure supplement 2B for blots showing the effects of activating endogenous Lck. (C–D) Quantification of His6V5-tagged wild-type LynA alone (black dotted) or His6V5-tagged LynAT410K alone (gray dotted) or cotransfected with the kinase-active SFKs. All LynA quantifications (#) are corrected for total protein content (TPS) and reported relative to the steady-state level for each transfection condition. SEM, n = 5 for LynAT410K and LynA alone, SEM, n = 4 for all others. Sig. from ANOVA2-Tukey: [LynAT410K vs. LynA black asterisks], LynAT410K vs. LynAT410K+LynA, coral asterisks], [LynAT410K vs. LynAT410K+LynAY32A, dark orange asterisks], [LynAT410K vs. LynAT410K+LynB, gold asterisks], [LynAT410K vs. LynAT410K+Hck59+56, teal asterisks], [Lyn vs. LynAT410K+Fyn, dark purple asterisk]; ***p=0.0007, **p=0.0017, *p=0.0180–0.0466. Other pairs ns. (C) Quantification of His6V5-tagged LynAT410K cotransfected with SFKs that induce degradation of LynAT410K. These include: untagged wild-type LynA (coral), untagged LynAY32A (dark orange), His6V5-tagged LynB (gold dotted), and Hck59+56 (teal). (D) Quantification of His6V5-tagged LynAT410K cotransfected with SFKs that do not induce degradation of LynAT410K: Hck59 (tan), Fgr (blue dotted), Fyn (purple), and FynB (light purple). Refer to Figure 7—source data 1.
-
Figure 7—source data 1
Quantification of LynAT410K coexpressed in Jurkat cells with other SFKs.
- https://doi.org/10.7554/eLife.46043.037
Figure 7—figure supplement 1

Assessing degradation of LynA mediated by SFKs in trans.
Experimental layout, showing interactions of a substrate-binding-impaired His6V5-tagged LynAT410K, which is not on its own degradable, with functionally-competent SFKs cotransfected into JCaM1.6 cells.
Figure 7—figure supplement 2
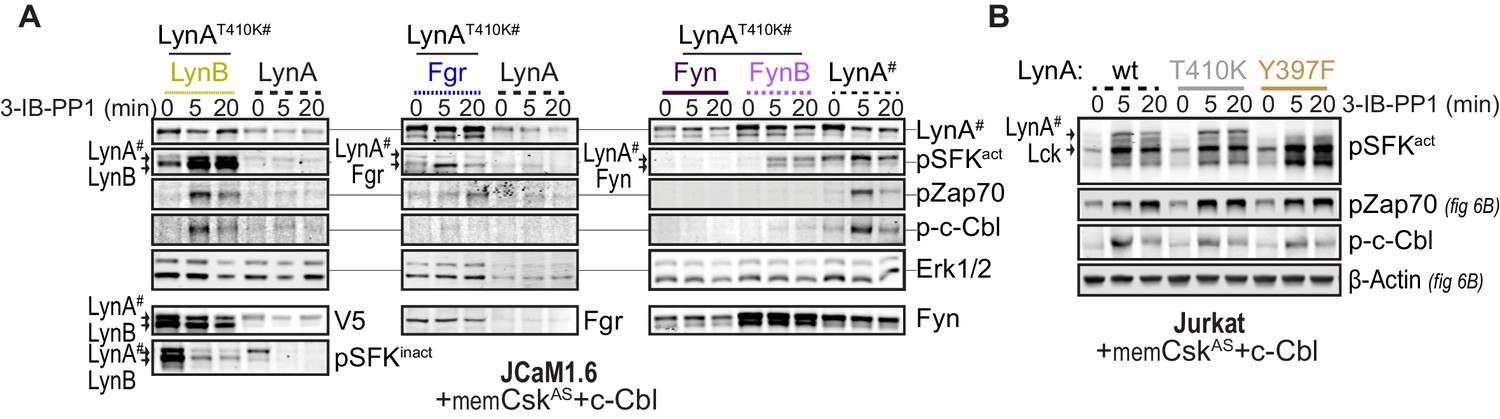
Additional immunoblots from cotransfection experiments.
(A) Immunoblots showing cotransfected LynB, Fgr, and Fyn and 3-IB-PP1-mediated phosphorylation events. (B) Immunoblots from Lck-expressing Jurkat cells showing phosphorylation of activation-loop Y397 of LynAT410K, interdomain B tyrosine 319 of Zap70, and tyrosine 731 of c-Cbl due to the activity of endogenous Lck in cells cotransfected with kinase-dead LynA constructs.
Figure 8
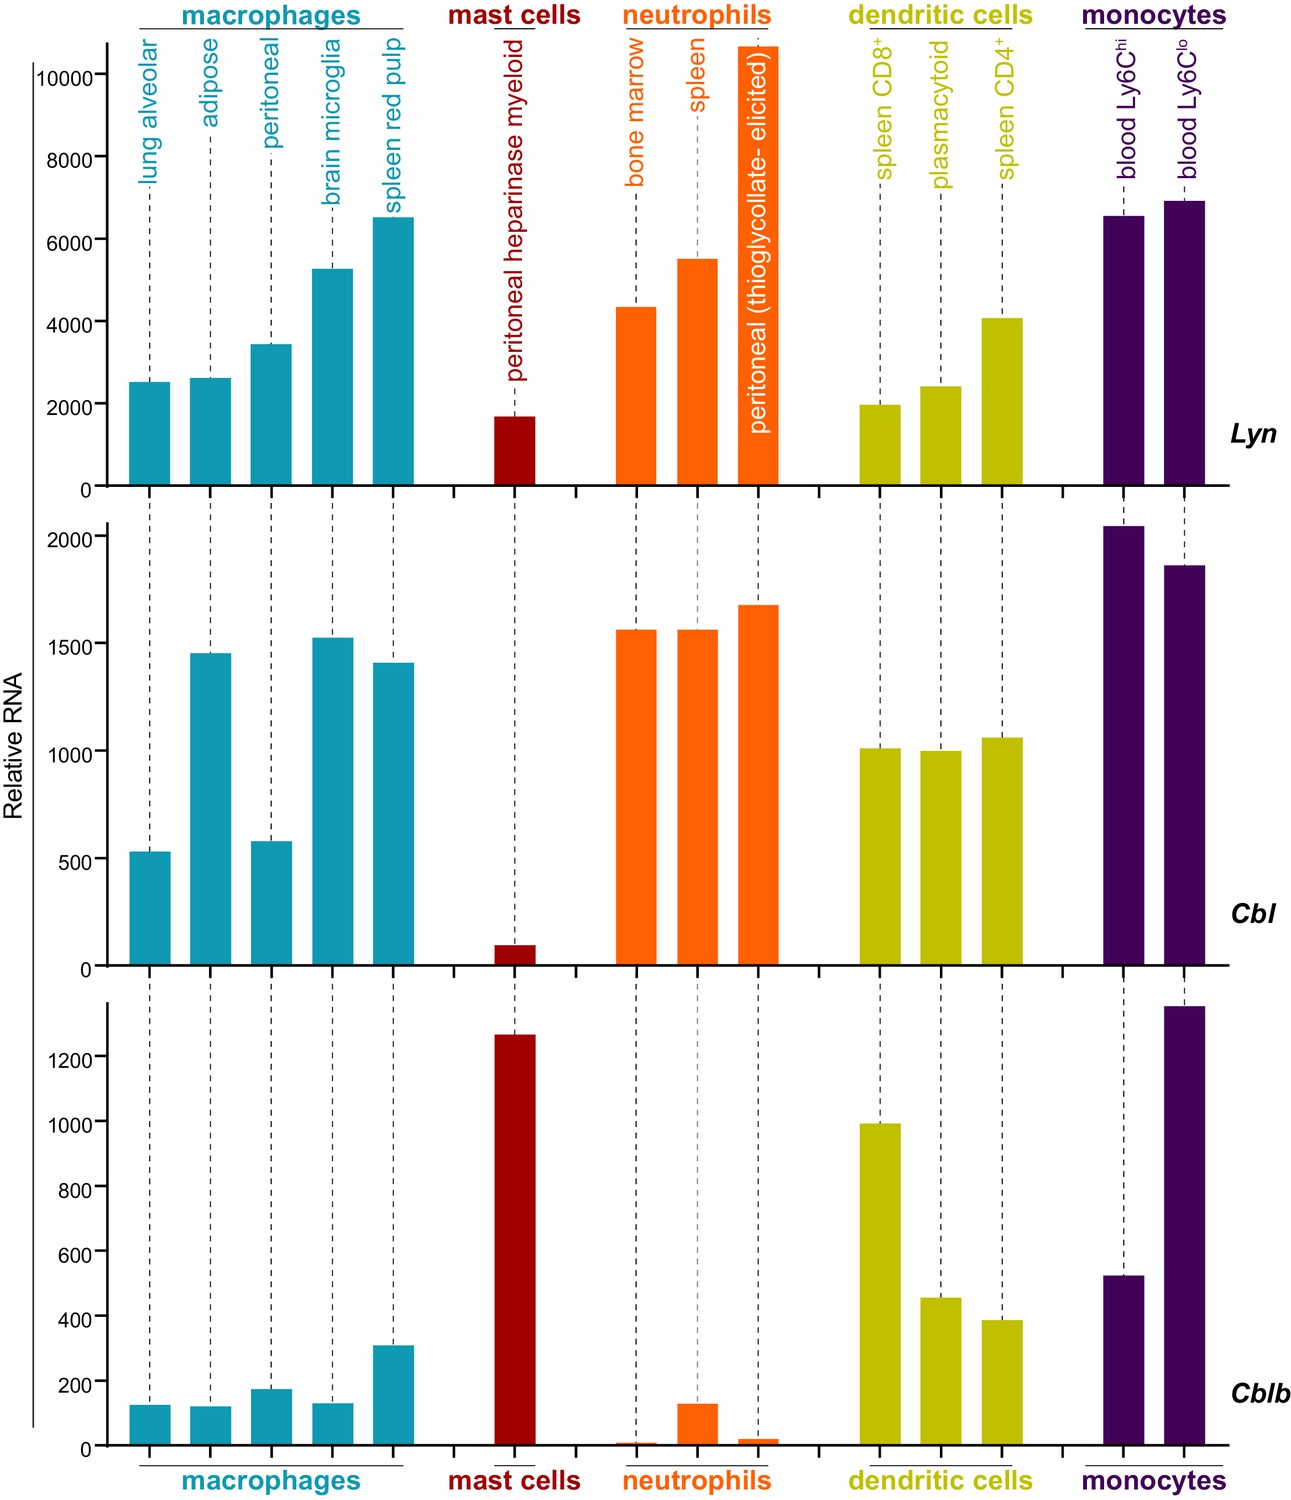
Expression levels of Lyn, Cbl, and Cblb are regulated differentially in myeloid cells.
Mouse RNAseq data derived from the Immunological Genome Project (ImmGen, http://rstats.immgen.org/Skyline/skyline.html, Heng and Painter, 2008; Dwyer et al., 2016). Lyn, Cbl, and Cblb mRNA expression levels are shown for macrophages, mast cells, neutrophils, dendritic cells, and monocytes. Refer to Figure 8—source data 1.
-
Figure 8—source data 1
Expression data from Immgen.
- https://doi.org/10.7554/eLife.46043.039
Figure 9
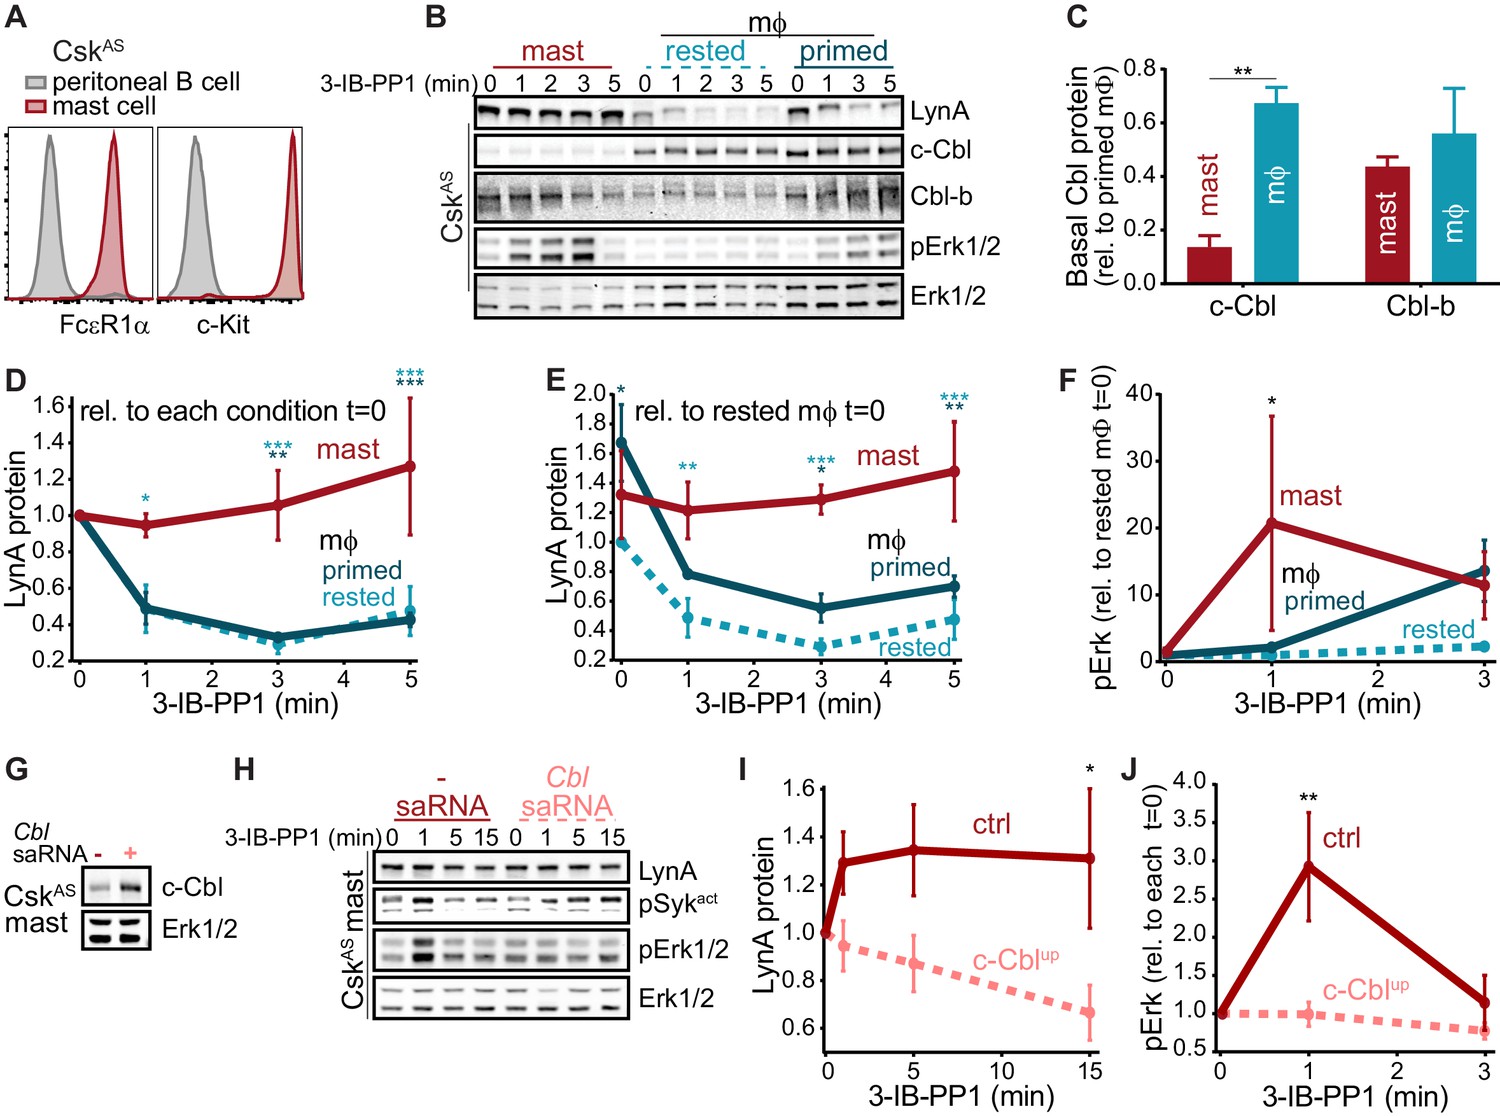
Differential expression of c-Cbl tunes LynA protein levels and SFK-mediated downstream signaling in macrophages and mast cells.
(A) Flow cytometry showing surface expression of the mast-cell markers FcεR1α and c-Kit (CD117) in CskAS bone-marrow-derived mast cells (red) compared to peritoneal B cells (gray). (B) Immunoblots of CskAS mast cells and BMDMs (mϕ) after resting or IFN-γ priming, showing the levels of LynA, c-Cbl, Cbl-b, and pErk1/2 during 3-IB-PP1 treatment; total Erk1/2 is shown as a loading control. (C–F) Quantification of c-Cbl, Cbl-b, LynA, and pErk in mast cells (red), IFN-γ-primed mϕs (dark teal), and rested mϕs (light teal). (C) Quantification of steady-state c-Cbl and Cbl-b protein in mast cells and rested mϕs, corrected for total protein content (TPS) and reported relative to levels in primed mϕs. SEM, n = 3. Sig. from one-way ANOVA with Sidak’s multiple comparison test: [mast vs. rested mϕs] **p=0.0035. Others pairs ns. (D–E) Quantification of LynA in mast cells and mϕs during 3-IB-PP1 treatment, corrected for total protein content (TPS) and reported relative to the steady-state level of LynA in each cell type (D) or relative to the steady-state level of LynA in rested mϕs (E). SEM, n = 3 for mast cells and primed mϕs, n = 4 for rested mϕs. Sig. from ANOVA2-Tukey: [mast vs. rested mϕs, light teal asterisks], [mast vs. primed mϕs, dark teal asterisks]; ***p=0.0004–0.0008, **p=0.0025–0.0088, * P=0.0134–0.0466. Other pairs ns. (F) Quantification of pErk1/2 induction during 3-IB-PP1 treatment, corrected for total Erk1/2 expression and reported relative to the steady-state level of pErk1/2 in rested mϕs. SEM, n = 3 for mast cells, n = 4 for primed mϕs, n = 5 for rested mϕs. Sig. from ANOVA2-Sidak: [mast vs. rested mϕs, asterisk]; *p=0.0330. Other pairs ns. (G) Immunoblots showing steady-state expression of c-Cbl in CskAS mast cells transfected in the presence or absence of Cbl-specific saRNA; Erk1/2 is shown as a loading control. (H) Immunoblots showing levels of LynA protein, pSyk, and pErk1/2 during 3-IB-PP1 treatment of Cbl-saRNA-transfected or mock-transfected mast cells. (I–J) Quantification of LynA and pErk in mast cells with (pink) and without (red) saRNA-induced upregulation of c-Cbl protein. SEM, n = 3. (I) Quantification of LynA protein during 3-IB-PP1 treatment, corrected for total protein content (TPS) and reported relative to the steady-state level for each transfection condition. Sig. from mixed-effects ANOVA analysis: *p=0.0229. (J) Quantification of pErk1/2 induction during 3-IB-PP1 treatment in saRNA-treated and mock-treated mast cells, corrected for total Erk1/2 expression and reported relative to the steady-state level for each condition. SEM, n = 3 for mast cells. Sig. from ANOVA2-Sidak: **p=0.0045. Refer to Figure 9—source data 1.
-
Figure 9—source data 1
Comparison of mast cells and macrophages.
- https://doi.org/10.7554/eLife.46043.041
Tables
Key resources table
| Reagent type (species) or resource | Designation | Source or reference | Identifiers | Additional information |
|---|---|---|---|---|
| Genetic reagent (M. musculus) | CskAS | PMID: 21917715 | MGI: 5563915 | Dr. Arthur Weiss (University of California San Francisco) |
| Genetic reagent (M. musculus) | Cbl-/- | PMID: 17868091 | MGI: 2180576 | Dr. Erik Peterson (University of Minnesota) |
| Genetic reagent (M. musculus) | Cblb-/- | PMID: 10646609 | MGI: 2180572 | Dr. Michael Farrar (University of Minnesota) |
| Cell line (H. sapiens) | Jurkat | American Type Culture Collection | Cat#: TIB-152, RRID: CVCL_0367 | Dr. Arthur Weiss (University of California San Francisco) |
| Cell line (H. sapiens) | JCaM1.6 | American Type Culture Collection | Cat#: CRL-2063, RRID: CVCL_0354 | Dr. Yoji Shimizu (University of Minnesota) |
| Recombinant DNA reagent (plasmid) | (mouse) LynA-V5-His6 | This paper | Progenitor from Dr. Juan Rivera (NIH) Vector: pEF6/V5-His | |
| Recombinant DNA reagent (plasmid) | (mouse) LynB-V5-His6 | This paper | Progenitor from Dr. Juan Rivera (NIH) Vector: pEF6/V5-His | |
| Recombinant DNA reagent (plasmid) | (mouse) LynAY32A-V5-His6 | This paper | Progenitor from Dr. Juan Rivera (NIH) Vector: pEF6/V5-His | |
| Recombinant DNA reagent (plasmid) | (mouse) LynAK40R-V5-His6 | This paper | Progenitor from Dr. Juan Rivera (NIH) Vector: pEF6/V5-His | |
| Recombinant DNA reagent (plasmid) | (mouse) LynAT27A-V5-His6 | This paper | Progenitor from Dr. Juan Rivera (NIH) Vector: pEF6/V5-His | |
| Recombinant DNA reagent (plasmid) | (mouse) LynAY32F-V5-His6 | This paper | Progenitor from Dr. Juan Rivera (NIH) Vector: pEF6/V5-His | |
| Recombinant DNA reagent (plasmid) | (mouse) LynAT410K-V5-His6 | This paper | Progenitor from Dr. Juan Rivera (NIH) Vector: pEF6/V5-His | |
| Recombinant DNA reagent (plasmid) | (mouse) LynAY397F-V5-His6 | This paper | Progenitor from Dr. Juan Rivera (NIH) Vector: pEF6/V5-His | |
| Recombinant DNA reagent (plasmid) | (mouse) LynAK275R-V5-His6 | This paper | Progenitor from Dr. Juan Rivera (NIH) Vector: pEF6/V5-His | |
| Recombinant DNA reagent (plasmid) | (mouse) LynA | This paper | Progenitors from Dr. Juan Rivera (NIH) Vector: pEF6/V5-His | |
| Recombinant DNA reagent (plasmid) | (mouse) LynAY32A | This paper | Progenitors from Dr. Juan Rivera (NIH) Vector: pEF6/V5-His | |
| Recombinant DNA reagent (plasmid) | His6-Xpress-c-Cbl (human) | PMID: 17110436 | Dr. Arthur Weiss (University of California San Francisco) Vector: pEF | |
| Recombinant DNA reagent (plasmid) | Xpress-Cbl-b (human) | PMID: 17110436 | Dr. Arthur Weiss (University of California San Francisco) Vector: pEF | |
| Recombinant DNA reagent (plasmid) | (mouse) Hckp59kDa | This paper | Dr. Clifford Lowell (University of California San Francisco) Vector: pMIG-W | |
| Recombinant DNA reagent (plasmid) | (mouse) Hckp59+p56kDa | This paper | Dr. Clifford Lowell (University of California San Francisco) Vector: pMIG-W | |
| Recombinant DNA reagent (plasmid) | (mouse) FynT | This paper | Dr. Clifford Lowell (University of California San Francisco) Vector: pUC18 | |
| Recombinant DNA reagent (plasmid) | (human) FynB | This paper | Dr. Clifford Lowell (University of California San Francisco) Vector: pLNCX | |
| Recombinant DNA reagent (plasmid) | (mouse) Fgr | This paper | Vector: pEF | |
| Recombinant DNA reagent (plasmid) | UR(LynA)-eGFP | This paper | vector: pcDNA3.1 | |
| Recombinant DNA reagent (plasmid) | UR(LynB)-eGFP | This paper | vector: pcDNA3.1 | |
| Recombinant DNA reagent (plasmid) | UR(LynAY32A)-eGFP | This paper | vector: pcDNA3.1 | |
| Recombinant DNA reagent (plasmid) | eGFP | This paper | Dr. Michael Farrar (University of Minnesota) vector: pMIGR | |
| Sequence based reagent | Cbl siRNA | This paper | 5’-CCUACCAGGACAUUCAGAAAGCUUU-3’ 5’-AAAGCUUUCUGAAUGUCCUGGUAGG-3’ | |
| Sequence based reagent | Cblb siRNA | This paper | 5’-CUGACUUCUUGGUAUCUGAUAUATA-3’ 5’-UAUAUAUCAGAUACCAAGAAGUCAGGU-3’ | |
| Sequence based reagent | Cbl saRNA | This paper | 5’-UCAAUUCUAGAUAAAGGCG-3’ 5’-CGCCUUUAUCUAGAAUUGA-3’ | |
| Antibody | Mouse anti- β-Actin (8H10D10) | Cell Signaling | Cat. #: 3700 RRID: AB_2242334 | WB (1:2000) |
| Antibody | Rabbit anti- c-Cbl (D4E10) | Cell Signaling | Cat. #: 8447 RRID: AB_10860763 | WB (1:2000) |
| Antibody | Rabbit anti-Cbl-b (D3C12) | Cell Signaling | Cat. #: 9498 RRID: AB_2797707 | WB (1:2000) |
| Antibody | Rabbit anti-p-c-Cbl (phosphoTyr731) | Cell Signaling | Cat. #: 3554 RRID: AB_2070452 | WB (1:1000) |
| Antibody | Rabbit anti-pErk1/2 (phosphoThr202/phosphoTyr204, D13.14.4E) | Cell Signaling | Cat. #: 4370 RRID: AB_10694057 | WB (1:2000) |
| Antibody | Mouse anti-Erk1/2 (3A7) | Cell Signaling | Cat. #: 9107 RRID: AB_10695739 | WB (1:2000) |
| Antibody | Mouse anti-Fgr (6G2) | ProMab | Cat. #: 20318 RRID: AB_2802161 | WB (1:2000) |
| Antibody | Rabbit anti-Fyn | Cell Signaling | Cat. #: 4023 RRID:AB_10698604 | WB (1:2000) |
| Antibody | Goat anti-Hck (M-28) | Santa Cruz Biotechnology | Cat. #: sc-1428 RRID: AB_2114872 | WB (1:1000) |
| Antibody | Rabbit anti-Lck (D88) XP(R) | Cell Signaling | Cat. #: 2984 RRID: AB_2136313 | WB (1:2000) |
| Antibody | Rabbit anti-LynA (C13F9) | Cell Signaling | Cat. #: 2796 RRID: AB_2138391 | WB (1:2000) |
| Antibody | Mouse anti-LynA + LynB (Lyn-01) | abcam | Cat. #: ab1890 RRID: AB_1204641 | WB (1:1000) |
| Antibody | Mouse anti-Myc (9B11) | Cell Signaling | Cat. #: 2276 RRID: AB_2148465 | WB (1:2000) |
| Antibody | Rabbit anti-pPaxillin (phosphoTyr118) | Cell Signaling | Cat. #: 2541 RRID: AB_2174466 | WB (1:2000) |
| Antibody | Rabbit anti-pSFKact(phosphoTyr416) | Cell Signaling | Cat. #: 2101 RRID: AB_331697 | WB (1:2000) |
| Antibody | Rabbit anti-pSFKinact(phosphoTyr530) | Life Technologies/ThermoFisher | Cat. #: 44–912 RRID: AB_2533793 | WB (1:1000) |
| Antibody | Rabbit anti-pZap70/pSyk (phosphoTyr319(Zap)/352(Syk), 65E4) | Cell Signaling | Cat. #: 2717 RRID: AB_2218658 | WB (1:2000) |
| Antibody | Rabbit V5-Tag (D3H8Q) | Cell Signaling | Cat. #: 13202 RRID: AB_2687461 | WB (1:2000) |
| Antibody | Mouse anti-V5 | Invitrogen | Cat. #: R960-25 RRID: AB_2556564 | IP (1:200) |
| Antibody | Donkey anti-rabbit IgG 800CW | LI-COR | Cat. #: 925–32213 RRID: AB_2715510 | WB (1:20000) |
| Antibody | Donkey anti-rabbit IgG 680LT | LI-COR | Cat. #: 925–68023 RRID: AB_10706167 | WB (1:20000) |
| Antibody | Donkey anti-mouse IgG 800CW | LI-COR | Cat. #: 925–32212 RRID: AB_2716622 | WB (1:20000) |
| Antibody | Donkey anti-mouse IgG 680LT | LI-COR | Cat. #: 925–68022 RRID: AB_10715072 | WB (1:20000) |
| Antibody | Donkey anti-goat IgG 800CW | LI-COR | Cat. #: 926–32214 RRID: AB_621846 | WB (1:20000) |
| Antibody | Anti FcεRIa (FITC) | BioLegend | Cat. #: 134305 RRID: AB_1626102 | Flow cytometry (1:100) |
| Antibody | Anti c-Kit (APC) | BioLegend | Cat. #: 105811 RRID: AB_313220 | Flow cytometry (1:100) |
| Peptide, recombinant protein | recombinant mouse IFN-g | PeproTech | Cat. #:AF-315–05 | 25 U/mL |
| Peptide, recombinant protein | recombinant mouse IL-3 | PeproTech | Cat. #: 213–13 | 10 ng/mL |
| Purified protein | Trypsin, sequencing grade | Promega | Cat. #: V5111 | |
| Commercial assay | Pierce BCA Protein Assay | ThermoFisher | Cat. #: 23225 | |
| Chemical compound, drug | 3-IB-PP1 | Kevan Shokat (University of California, San Francisco) | 10 µM | |
| Chemical compound, drug | PP2 | ThermoFisher | Cat. #: PHZ1223 | 20 µM |
| Chemical compound, drug | Bay 61–3606 | EMD Millipore | Cat. #: 574714 | 1 µM |
| Chemical compound, drug | PF-431396 | Tocris | Cat. #: 4278/10 | 10 µM |
| Software | Prism | GraphPad | RRID: SCR_002798 | |
| Software | Image Studio | LI-COR | RRID:SCR_013715 | |
| Software | Illustrator | Adobe | RRID:SCR_010279 | |
| Software | Photoshop | Adobe | RRID:SCR_014199 | |
| Software | Fiji | RRID:SCR_002285 |
Additional files
-
Transparent reporting form
- https://doi.org/10.7554/eLife.46043.042
Download links
A two-part list of links to download the article, or parts of the article, in various formats.
Downloads (link to download the article as PDF)
Open citations (links to open the citations from this article in various online reference manager services)
Cite this article (links to download the citations from this article in formats compatible with various reference manager tools)
Unique-region phosphorylation targets LynA for rapid degradation, tuning its expression and signaling in myeloid cells
eLife 8:e46043.
https://doi.org/10.7554/eLife.46043


