Mouse TRPA1 function and membrane localization are modulated by direct interactions with cholesterol
- KU Leuven, Belgium
- VIB Center for Brain & Disease Research, Belgium
- Université Libre de Bruxelles, Belgium
Figures
Figure 1 with 1 supplement
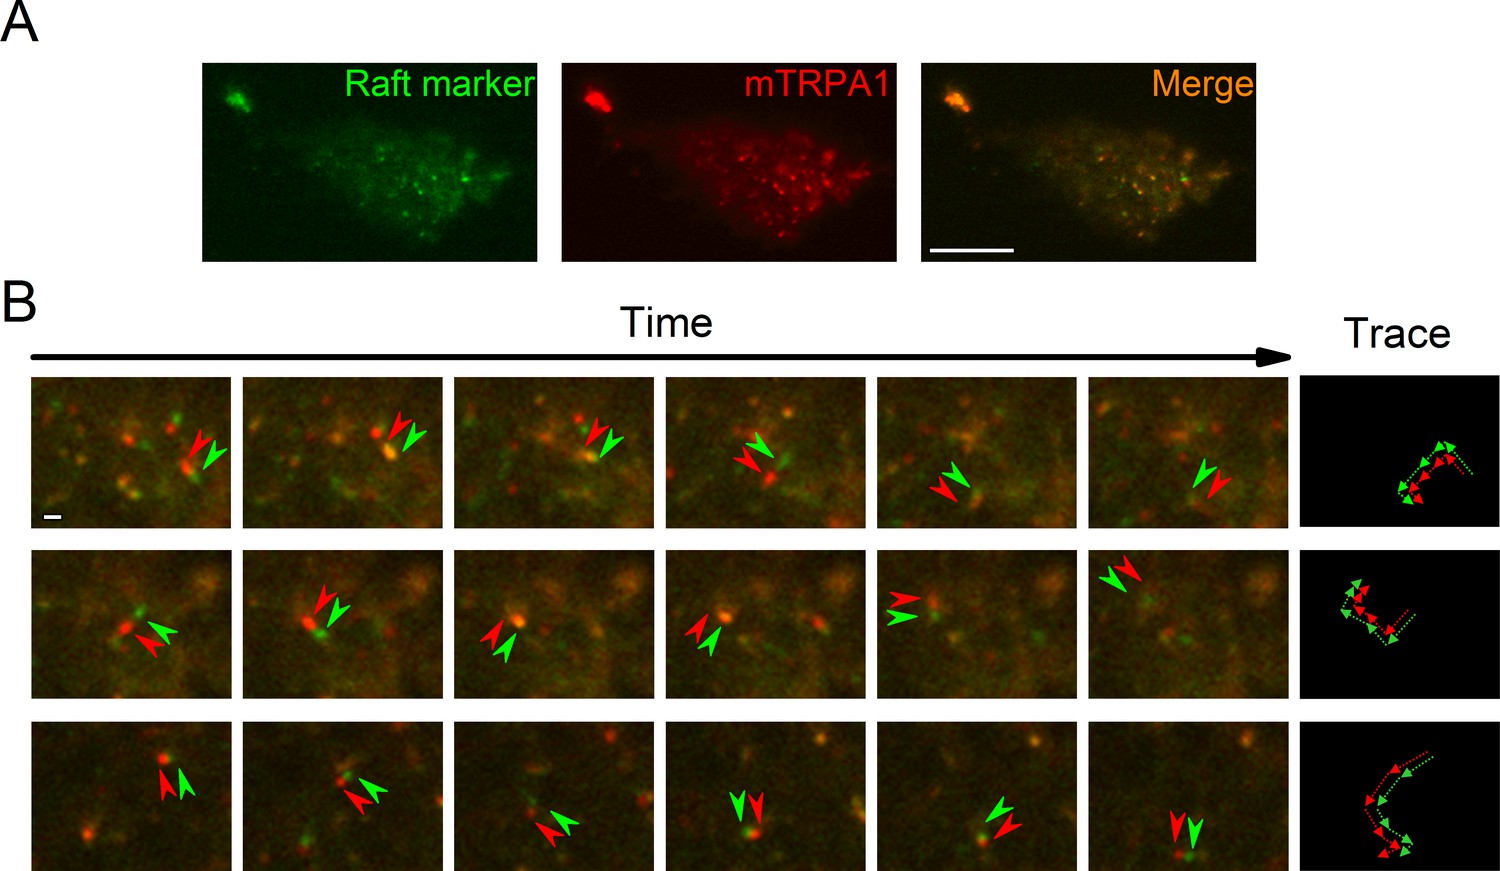
TRPA1 colocalizes with the lipid raft marker in the mobile intracellular vesicles near to the plasma membrane.
(A) Snapshot of TIRF microscopy images recorded in HEK293T cells transfected with the mTRPA1-mCherry construct (red) and stained with Vybrant Alexa Flour 488 lipid raft labeling kit (green). The third panel shows a merged image. Scale bar 10 µm. (B) Dual-color TIRF microscopy images at consecutive intervals (every 2 s) displaying the movement of mTRPA1-mCherry (red) along with lipid raft marker (green). Arrowheads indicate traced vesicles whose movements are shown in the rightmost column. Scale bar 2 µm.
Figure 1—figure supplement 1
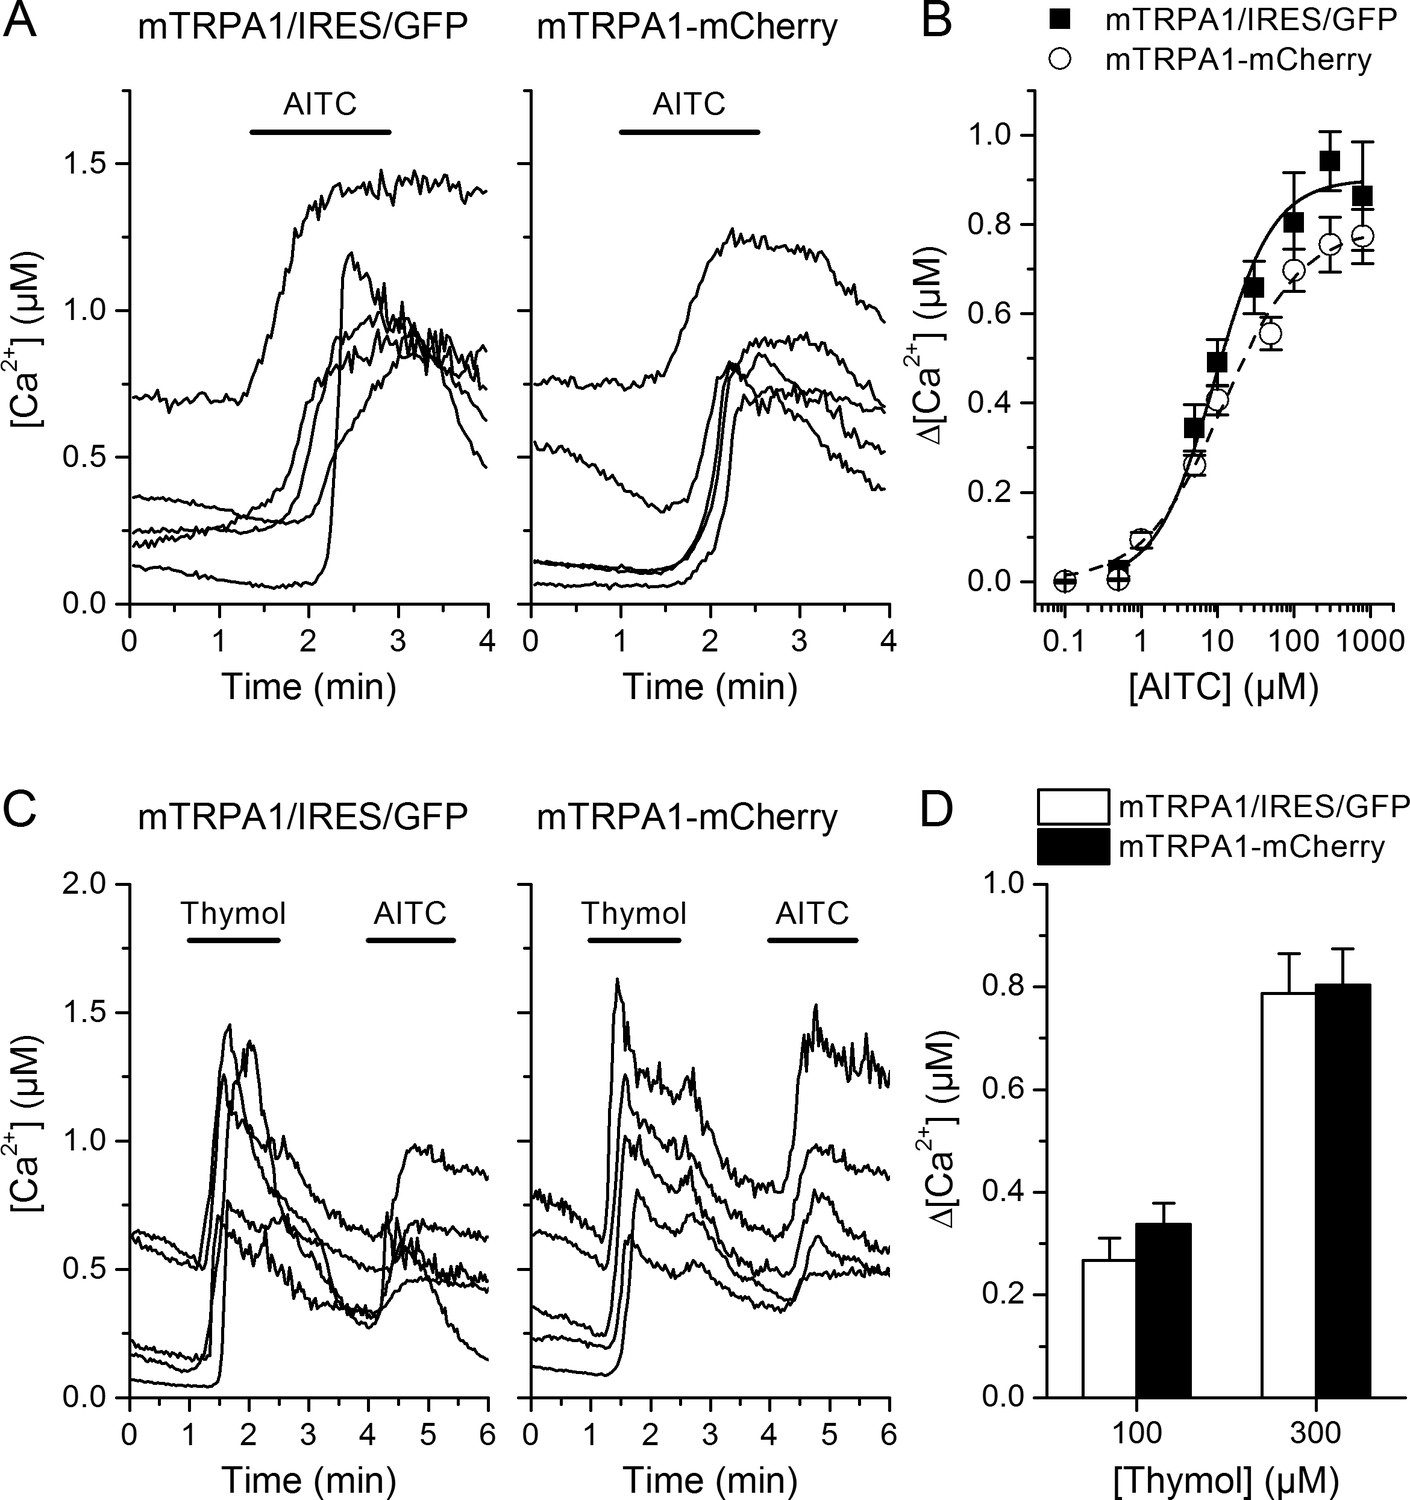
Intracellular calcium responses of mTRPA1 are not influenced by addition of the mCherry tag to channel C-terminus.
(A) Representative traces of intracellular Ca2+ change evoked by 10 µM AITC (roughly EC50 concentration) in HEK293T cells transfected with mTRPA1 or mTRPA1-mCherry channels. (B) Dose-response relationships comparing AITC responses of mTRPA1 (black line representing fit with Hill equation) and mTRPA1-mCherry (dash fit line). Obtained EC50 concentrations were 11.7 ± 2.2 µM for mTRPA1 and 11.8 ± 2.5 µM for TRPA1-mCherry. (C) Representative traces of intracellular Ca2+ change evoked by 300 µM thymol in HEK293T cells transfected with mTRPA1 or mTRPA1-mCherry channels. (D) Average [Ca2+] amplitude change evoked by 100 µM and 300 µM thymol in cells expressing mTRPA1 or mTRPA1-mCherry. No significant changes in evoked responses were detected (n > 50 cells). Error bars represent the standard error of the mean.
-
Figure 1—figure supplement 1—source data 1
mTRPA1 response amplitudes and statistical analysis.
- https://doi.org/10.7554/eLife.46084.004
Figure 2 with 1 supplement
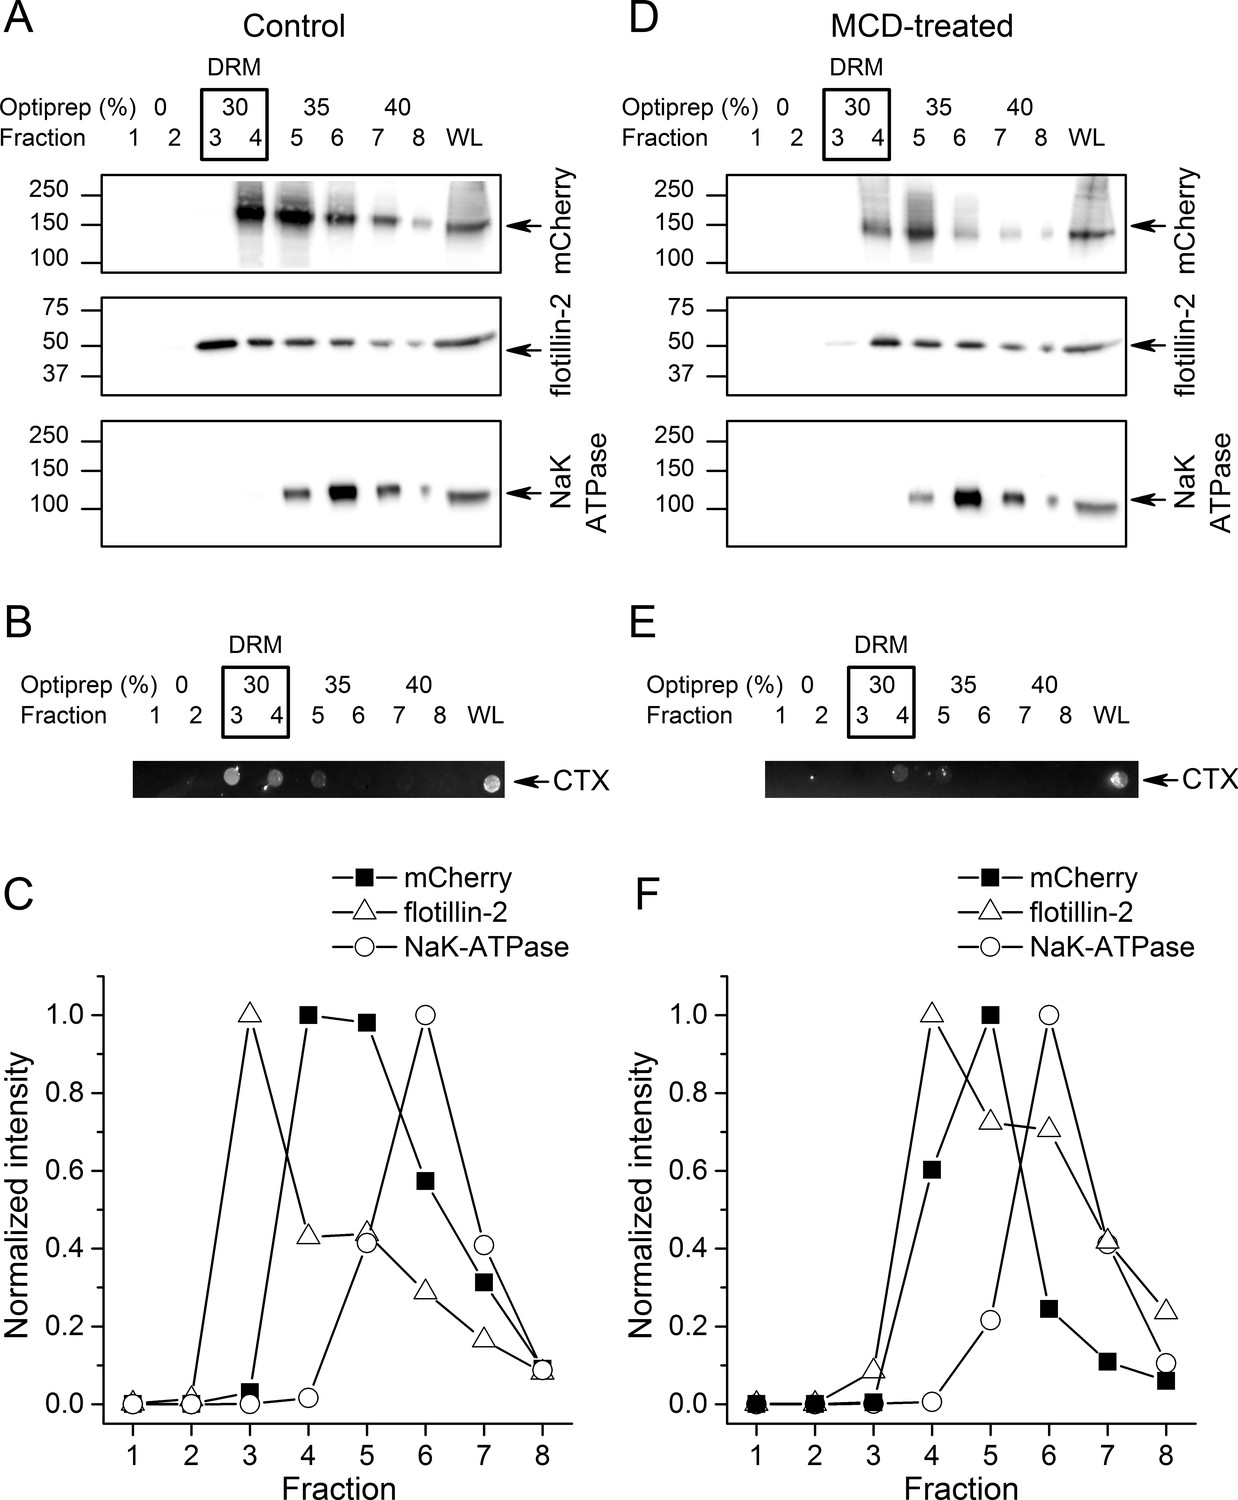
TRPA1 localizes in cholesterol-rich domains.
(A) Immunoblots of different fractions obtained after detergent-free lipid raft preparation presenting mTRPA1-mCherry immunoreactivity associated with detergent-resistant membrane (DRM) fractions and whole cell lysate (WL) in HEK293T-mTRPA1-mCherry cells (top panel); immunoreactivity against endogenous lipid raft marker flotillin-2 (middle panel); immunoreactivity against NaK-ATPase as a marker of non-raft membrane protein (bottom panel). (B) Dot blot presenting immunoreactivity associated with fluorescent cholera toxin subunit B (CT-B). (C) Quantitative analysis of density gradients for mCherry, flotillin-2 and NaK-ATPase. (D) Cholesterol depletion of HEK293T-mTRPA1-mCherry cells by treatment with 10 mM MCD interrupts association of TRPA1 (top panel) and flotillin-2 (middle panel) with the detergent-resistant membrane fractions. NaK-ATPase expression remains similar to control condition. (E) Dot blot presenting deficiency of fluorescent cholera toxin subunit B binding after lipid raft disruption. (F) Quantitative analysis of density gradients for mCherry, flotillin-2 and NaK-ATPase after MCD treatment reveals a shift of mTRPA1-mCherry and flotillin-2 to higher density gradients. Equal volumes of each collected fraction were determined by SDS-PAGE electrophoresis and blotted with specific anti-mCherry, anti-flotillin-2 or anti-NaK-ATPase antibodies.
Figure 2—figure supplement 1
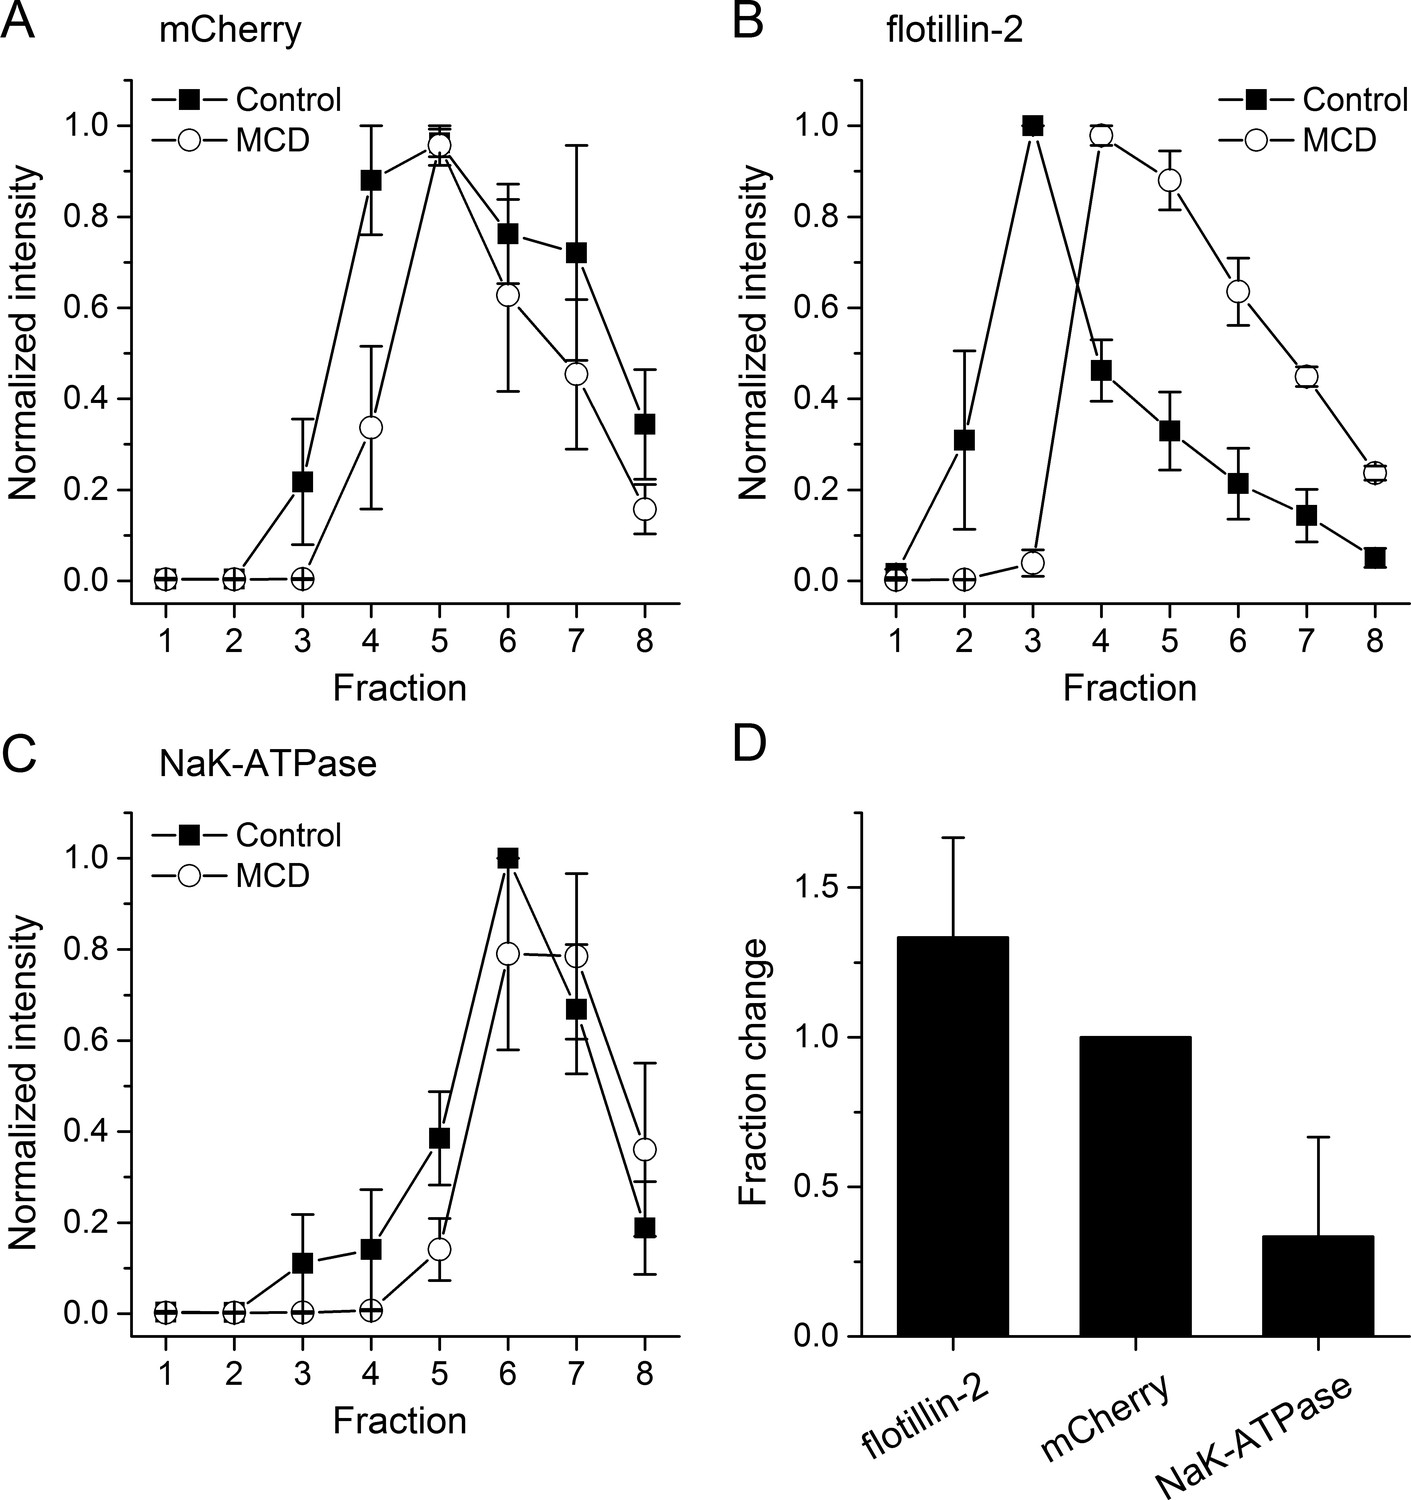
Cholesterol depletion by MCD treatment induces shift of lipid raft proteins into higher density fractions.
(A–C) Normalized intensity of (A) mTRPA1-mCherry, (B) flotillin-2 or (C) NaK-ATPase protein distribution (mean ± s.e.m. from three different experiments) in the density gradients in control condition and after cholesterol depletion with 10 mM MCD. (D) Average fraction shift of flotillin-2, mTRPA1-mCherry and NaK-ATPase distribution (mean ± s.e.m. from three different experiments) after cholesterol depletion with MCD.
-
Figure 2—figure supplement 1—source data 1
Protein intensities.
- https://doi.org/10.7554/eLife.46084.008
Figure 3 with 3 supplements
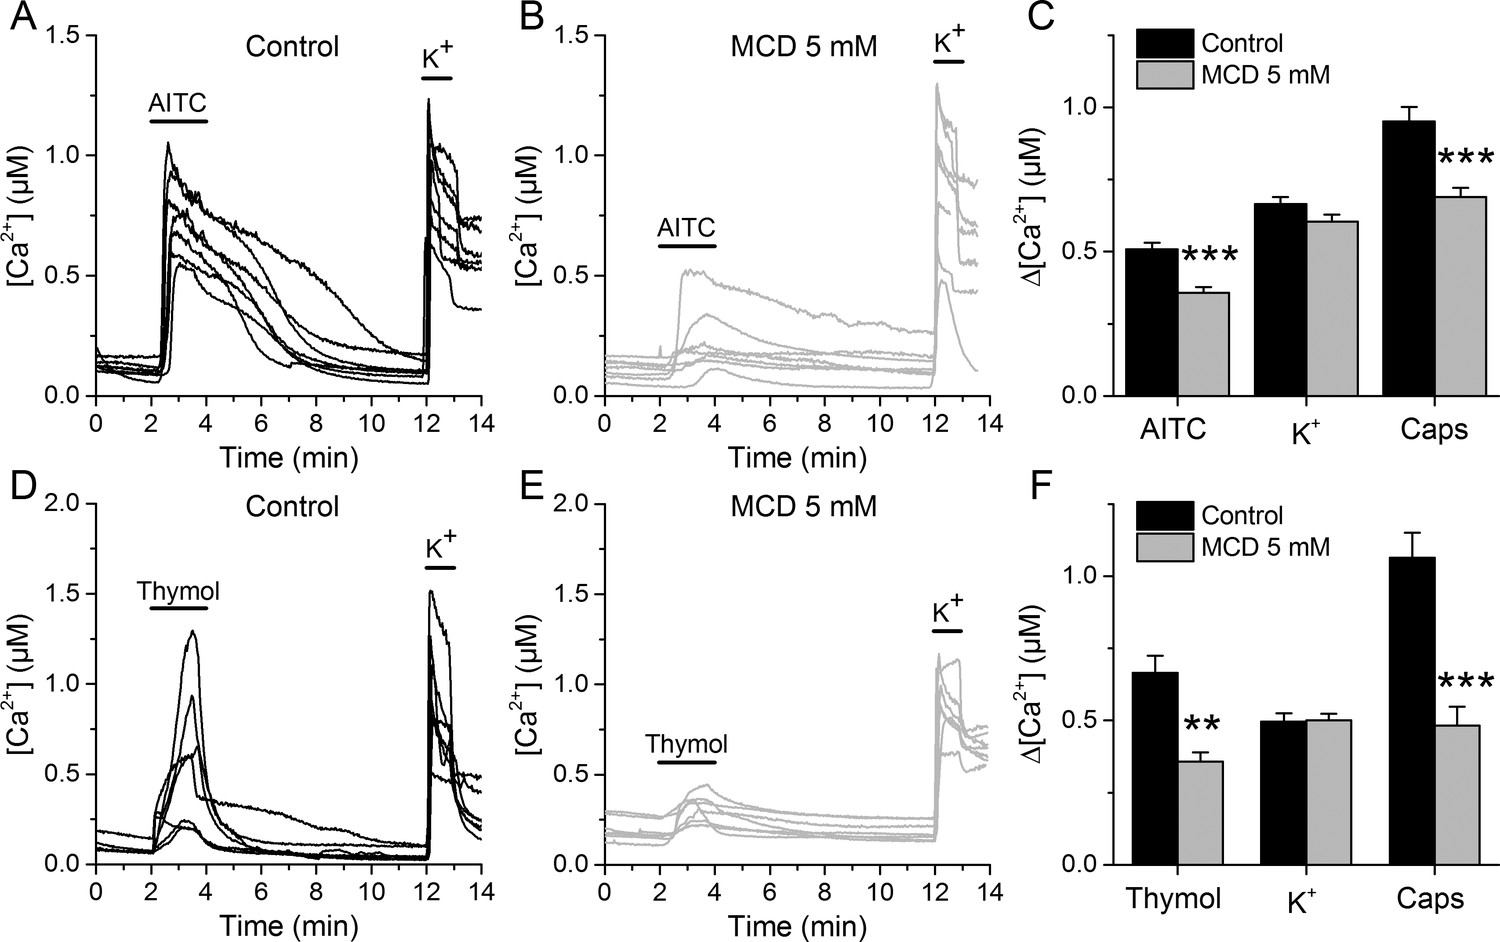
TRPA1-mediated responses of mouse sensory neurons are reduced after cholesterol depletion with MCD.
(A, B) Examples of [Ca2+] responses of mouse DRG neurons to AITC (30 µM) high K+ (50 mM) in control condition (A), n = 340) and after 30 min pretreatment with 5 mM MCD (B), n = 306). (C) Average [Ca2+] amplitude change evoked by AITC, capsaicin (Caps) and high K+ in control condition and after MCD (5 mM) treatment. (D, E) Examples of [Ca2+] responses of mouse DRG neurons to thymol (300 µM) and high K+ (50 mM) in control condition (D), n = 147) and after MCD treatment (E), n = 122). (F) Average [Ca2+] amplitude change evoked by thymol and Caps in control condition and after MCD treatment. The error bars represent the standard error of the mean. *, p<0.05; **, p<0.01; ***, p<0.001; two-tailed Mann-Whitney U test.
-
Figure 3—source data 1
mTRPA1 response amplitudes and statistical analysis.
- https://doi.org/10.7554/eLife.46084.015
Figure 3—figure supplement 1
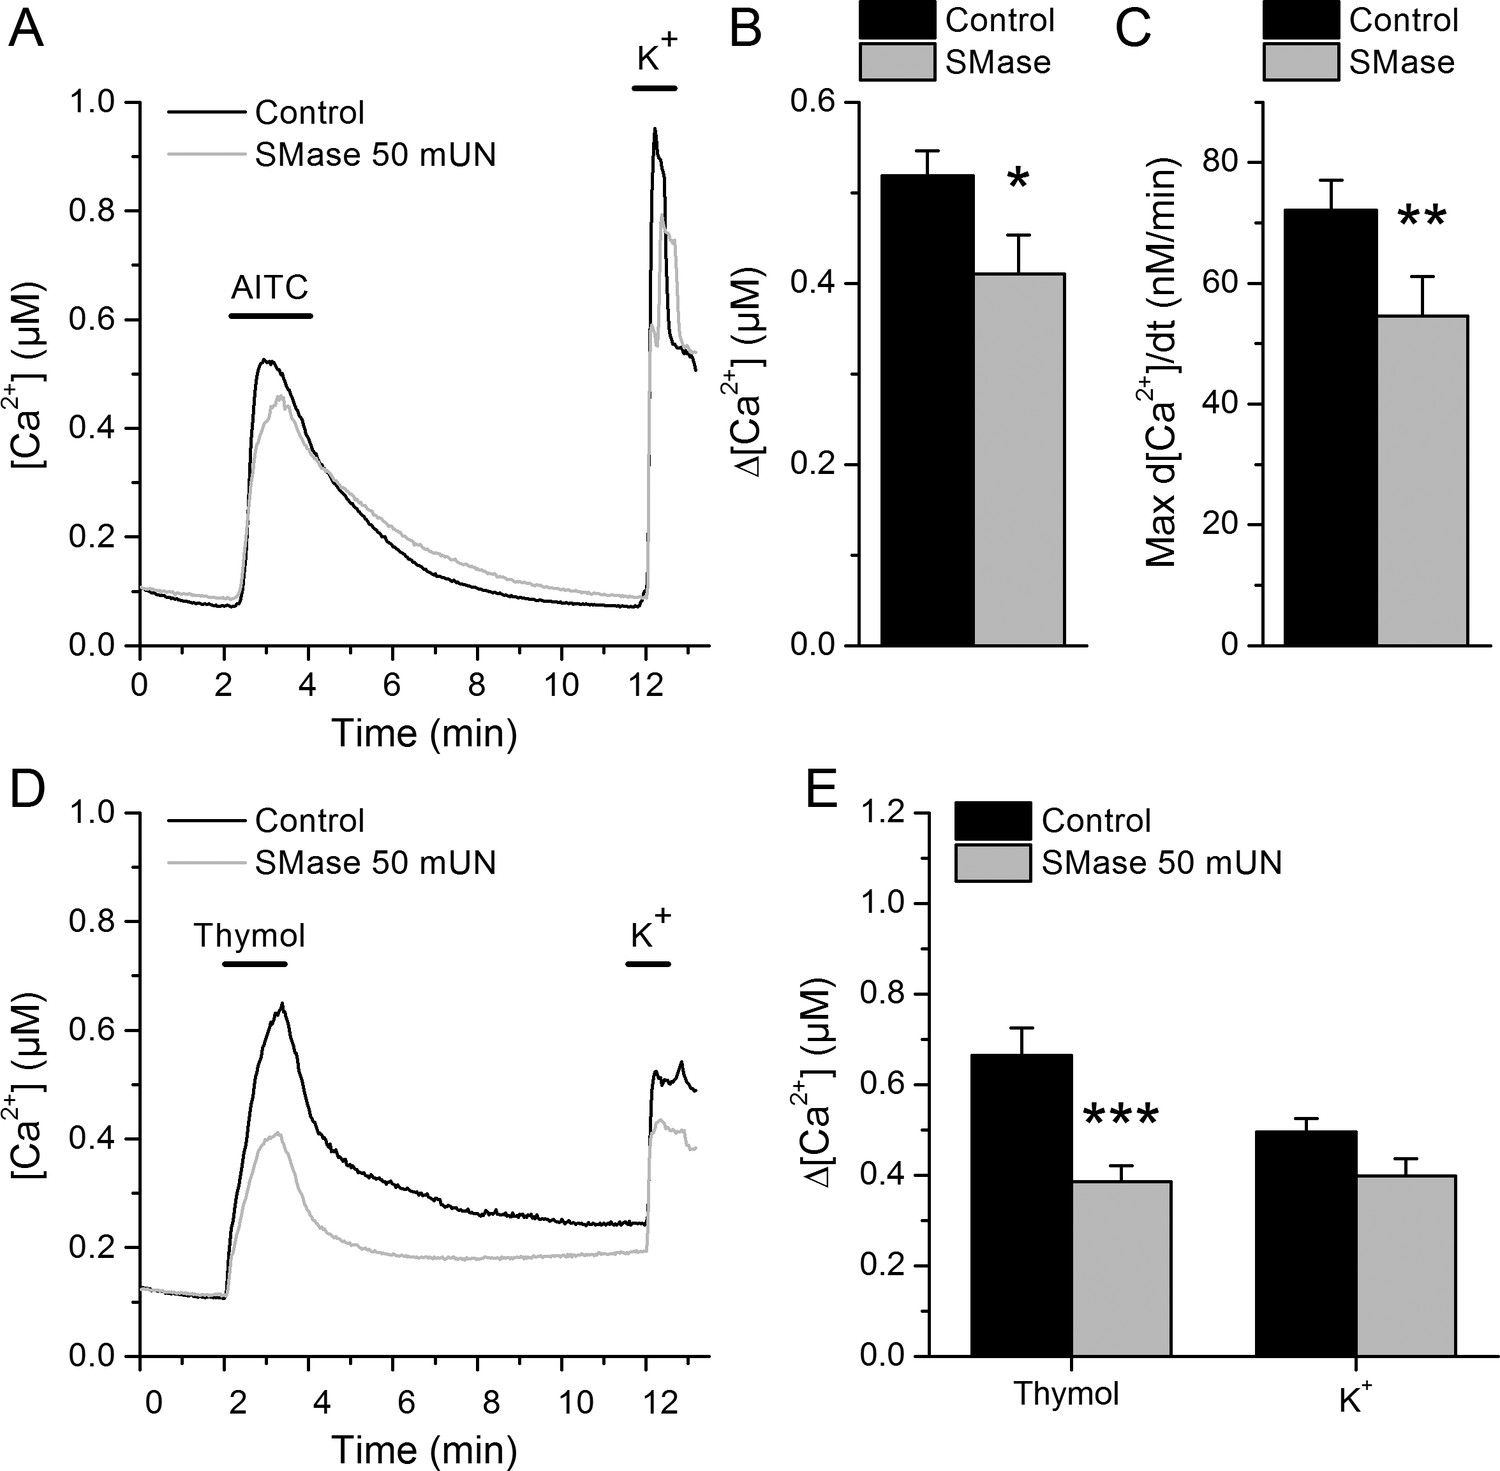
TRPA1-mediated responses of mouse sensory neurons are reduced after lipid raft disruption with SMase.
(A) Mean [Ca2+] traces (n > 50 cells) of mouse DRG neurons to AITC (30 µM) and high K+ (50 mM) in control condition and after pretreatment with 50 mUN SMase. (B) Mean [Ca2+] change in control condition and after treatment with SMase at time point corresponding to mTRPA1 maximal response (t = 2.97 s). (C) Average of the first derivative maxima showing a delay in the Ca2+ response after treatment with SMase with respect to the control condition. (D) Mean [Ca2+] traces (n > 50 cells) of mouse DRG neurons to thymol (300 µM) and high extracellular K+ (50 mM) in control condition and after treatment with 50 mUN SMase (gray). (E) Average [Ca2+] amplitude change evoked by thymol application in DRG neurons expressing mTRPA1 in control condition and after treatment with SMase. *, p<0.05; **, p<0.01; ***, p<0.001; two-tailed Mann-Whitney U test.
-
Figure 3—figure supplement 1—source data 1
mTRPA1 response amplitudes and statistical analysis.
- https://doi.org/10.7554/eLife.46084.011
Figure 3—figure supplement 2
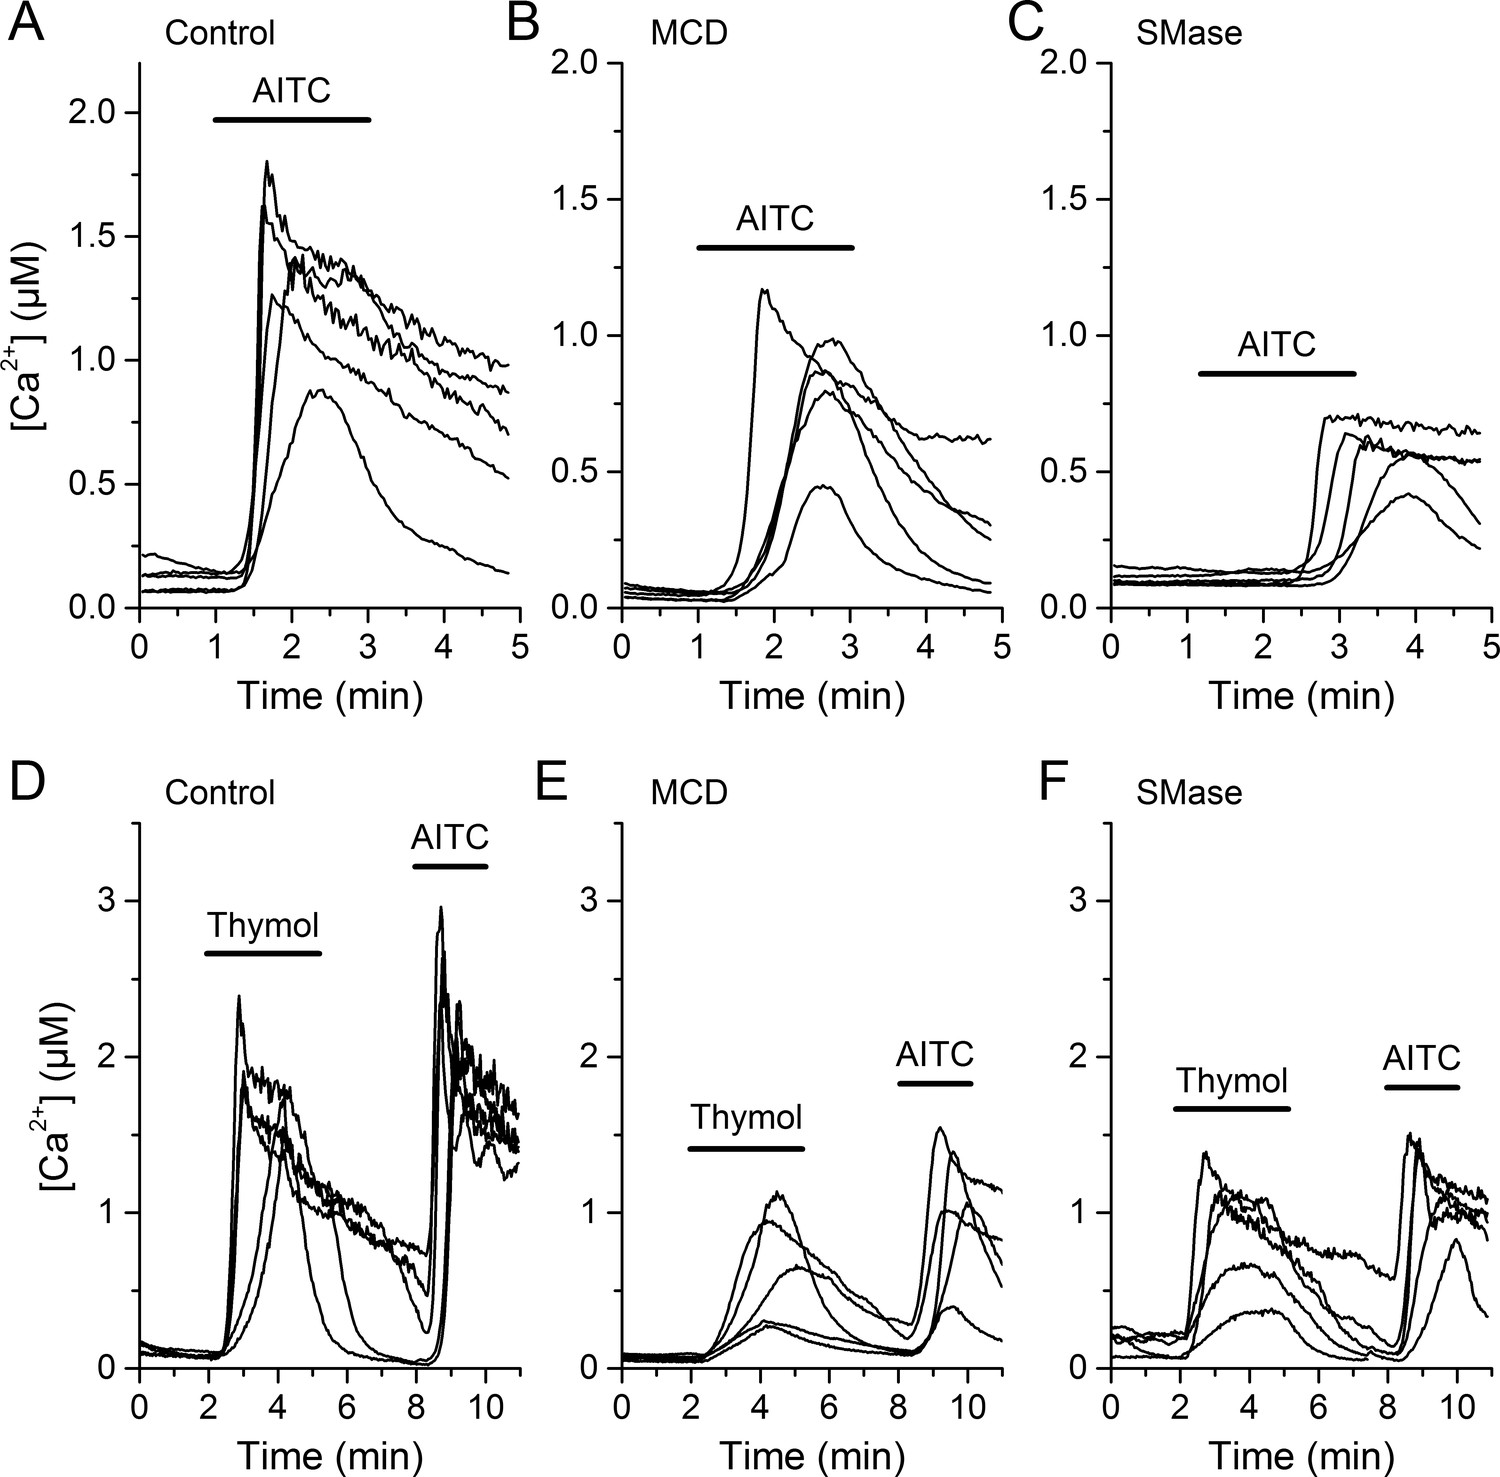
CHO-mTRPA1 responses to AITC and thymol are reduced after MCD or SMase treatment.
(A–C) Representative traces of [Ca2+] change induced by AITC (100 µM) in the control condition (A) and after pretreatment with 10 mM MCD (B) or 50 mUN SMase (C) in the CHO-K1 cells stably expressing mTRPA1. (D–F) Representative traces of [Ca2+] change induced by thymol (300 µM) in the control condition (D) and after pretreatment with 10 mM MCD (E) or 50 mUN SMase (F) in the CHO-K1 cells stably expressing mTRPA1. Black line represents compound application time.
Figure 3—figure supplement 3
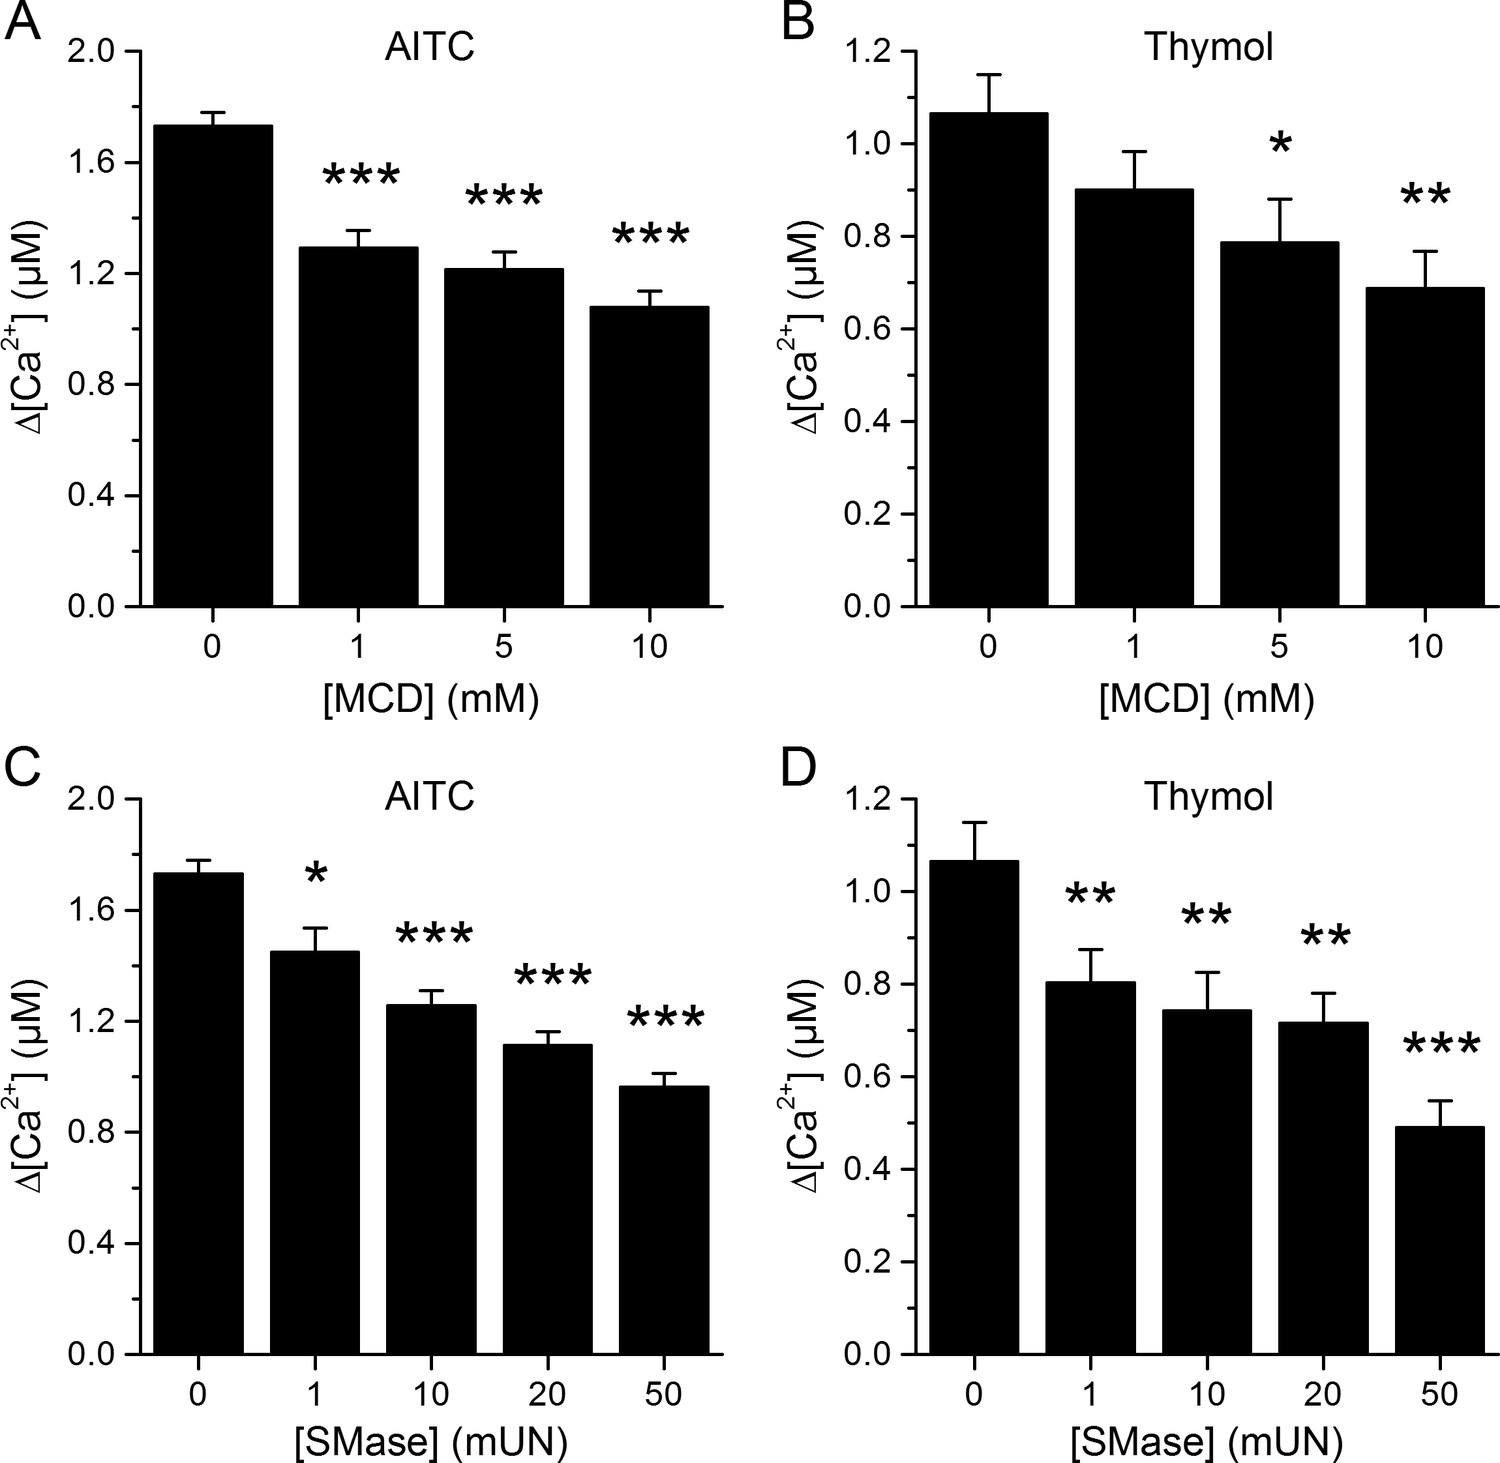
Responses of mTRPA1 channels are reduced after MCD or SMase treatment.
(A, B) Average [Ca2+] amplitude change evoked by AITC (A) thymol (B) in control condition (first bar) and after pretreatment with 1, 5, 10 mM of MCD. *, p<0.05; **, p<0.01; ***, p<0.001; two-tailed Mann-Whitney U test. (C, D) Average [Ca2+] amplitude change evoked by AITC (C) thymol (D) in control condition (first bar) and after pretreatment with 1, 10, 20, 50 mUN of SMase. *, p<0.05; **, p<0.01; ***, p<0.001; two-tailed Mann-Whitney U test.
-
Figure 3—figure supplement 3—source data 1
mTRPA1 response amplitudes and statistical analysis.
- https://doi.org/10.7554/eLife.46084.014
Figure 4
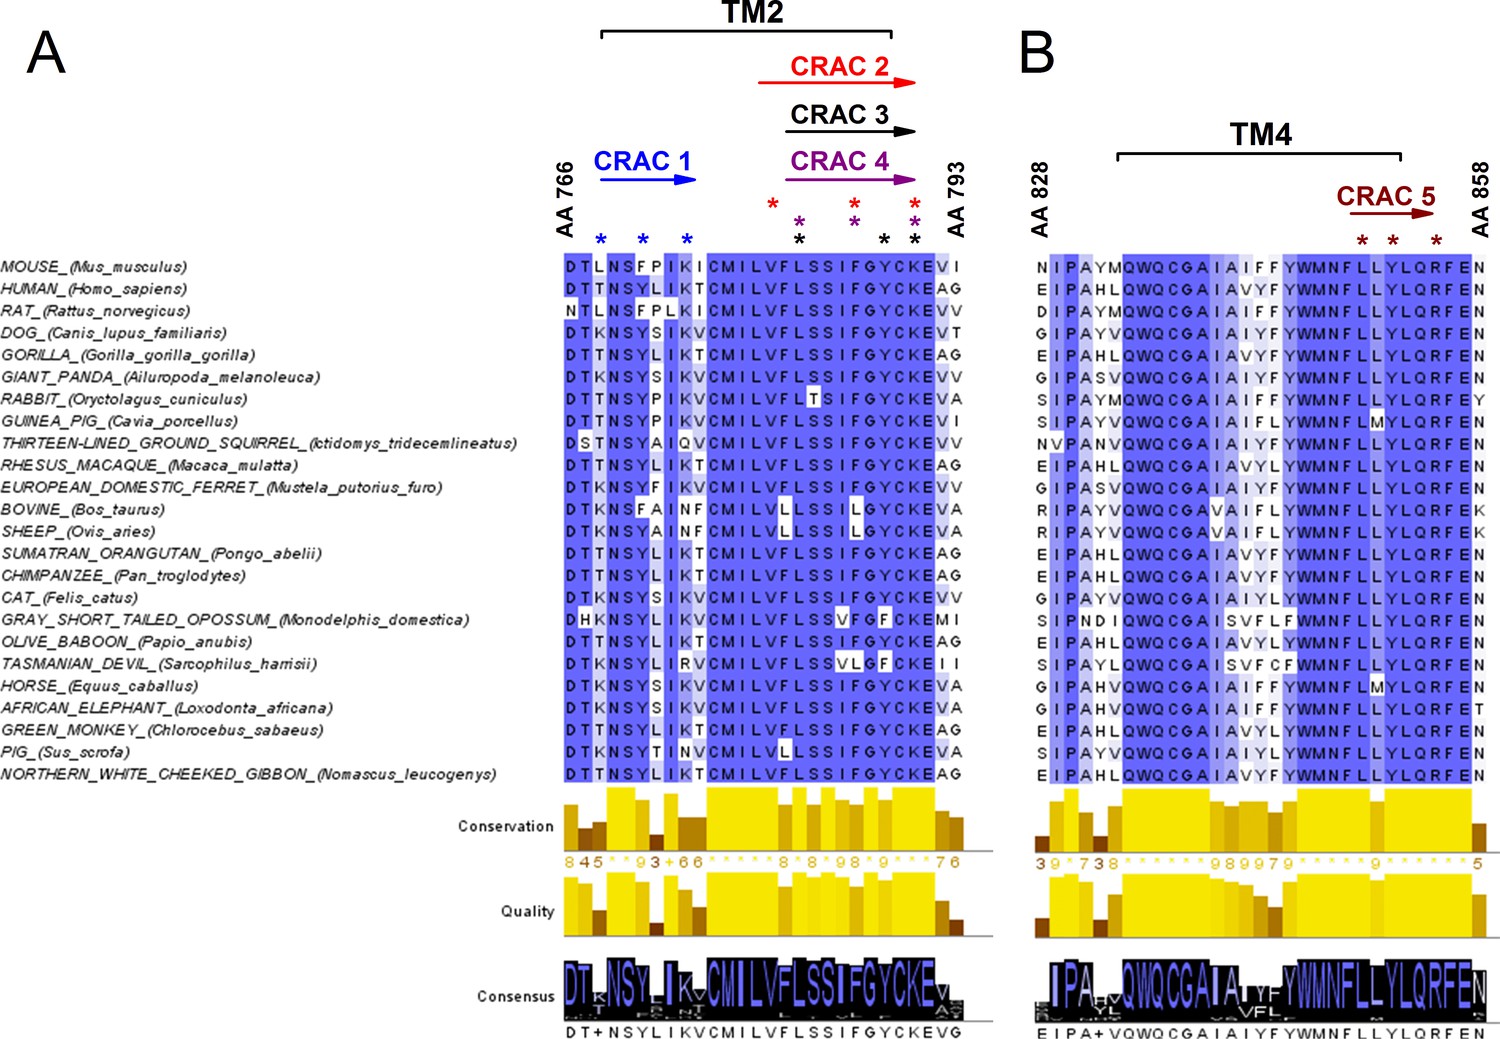
Conservation analysis of mammalian TRPA1 reveals highly conserved cholesterol-interaction motifs in TM2 and TM4 domains.
(A, B) Sequence alignment of the TM 2 (A) and TM 4 (B) domains of mouse TRPA1 (AA 766–793 and AA 828–858, respectively) with those of 23 other mammals exposes five highly conserved CRAC motifs. Asterisks (*) display localization of residues essential for cholesterol interaction and defined with the algorithm (L/V)-X1-5-(Y/F/W)-X1-5-(K/R). Conservation, quality and consensus graphs are shown below. Conservation histogram shows the relative similarity score for each column with conserved residues indicated with an asterisk. Columns with mutations where all properties are preserved are marked with a plus. Consensus status is demonstrated as a consensus logo with the scale of the letter in agreement with the conservation of the residues. Multiple sequence alignment was performed with Clustal O in Jalview software.
Figure 5
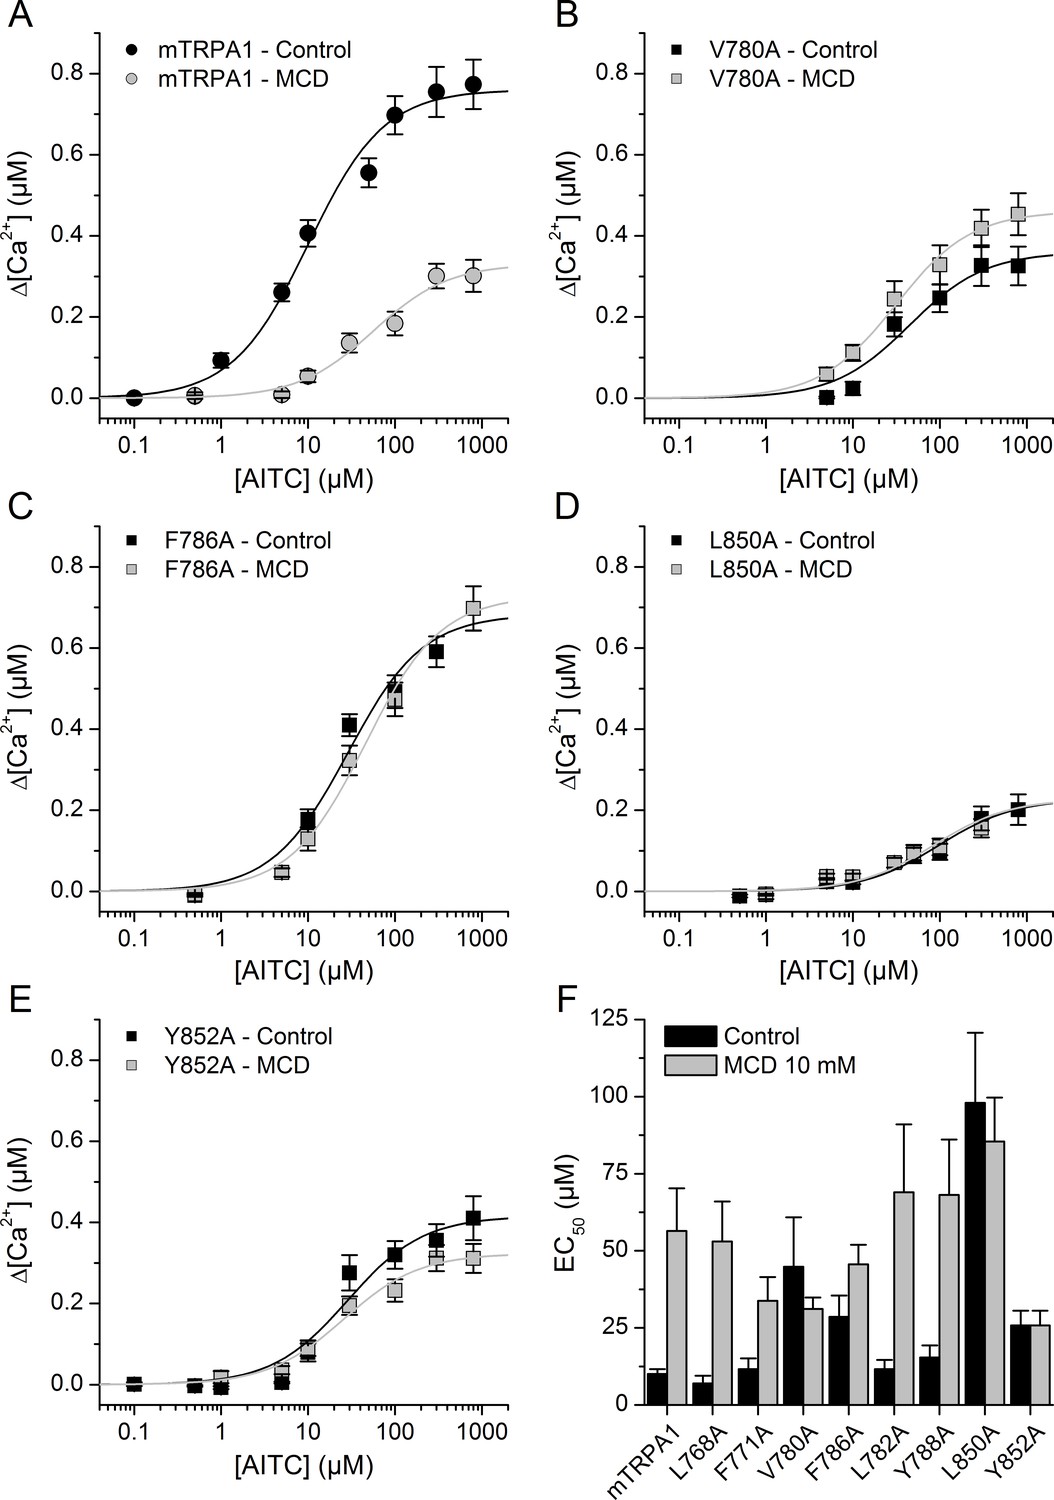
Mutation of residues in TM2 and TM4 segments unveils cholesterol binding motifs important for normal mTRPA1 function.
(A–D) Dose-response curves derived from [Ca2+] measurements (peak fluorescence baseline corrected) in HEK293T cells expressing mTRPA1-mCherry (WT mTRPA1 and single point mutants). EC50 curves for (A) WT, (B) V780A mutant, (C) F786A mutant, (D) L850A mutant, (E) Y852A mutant. Black lines represent fit with Hill equation in the control condition and gray lines after cholesterol removal with MCD. (F) AITC EC50 concentrations in HEK293T cells expressing WT mTRPA1 channel or single-point CRAC mutants in control condition and after cholesterol depletion with 10 mM MCD. Estimation of AITC EC50 (± fitting error) for each condition was performed using n > 50 cells from three independent transfection experiments.
-
Figure 5—source data 1
WT mTRPA1 and mutant mTRPA1 response amplitudes and statistical analysis.
- https://doi.org/10.7554/eLife.46084.018
Figure 6
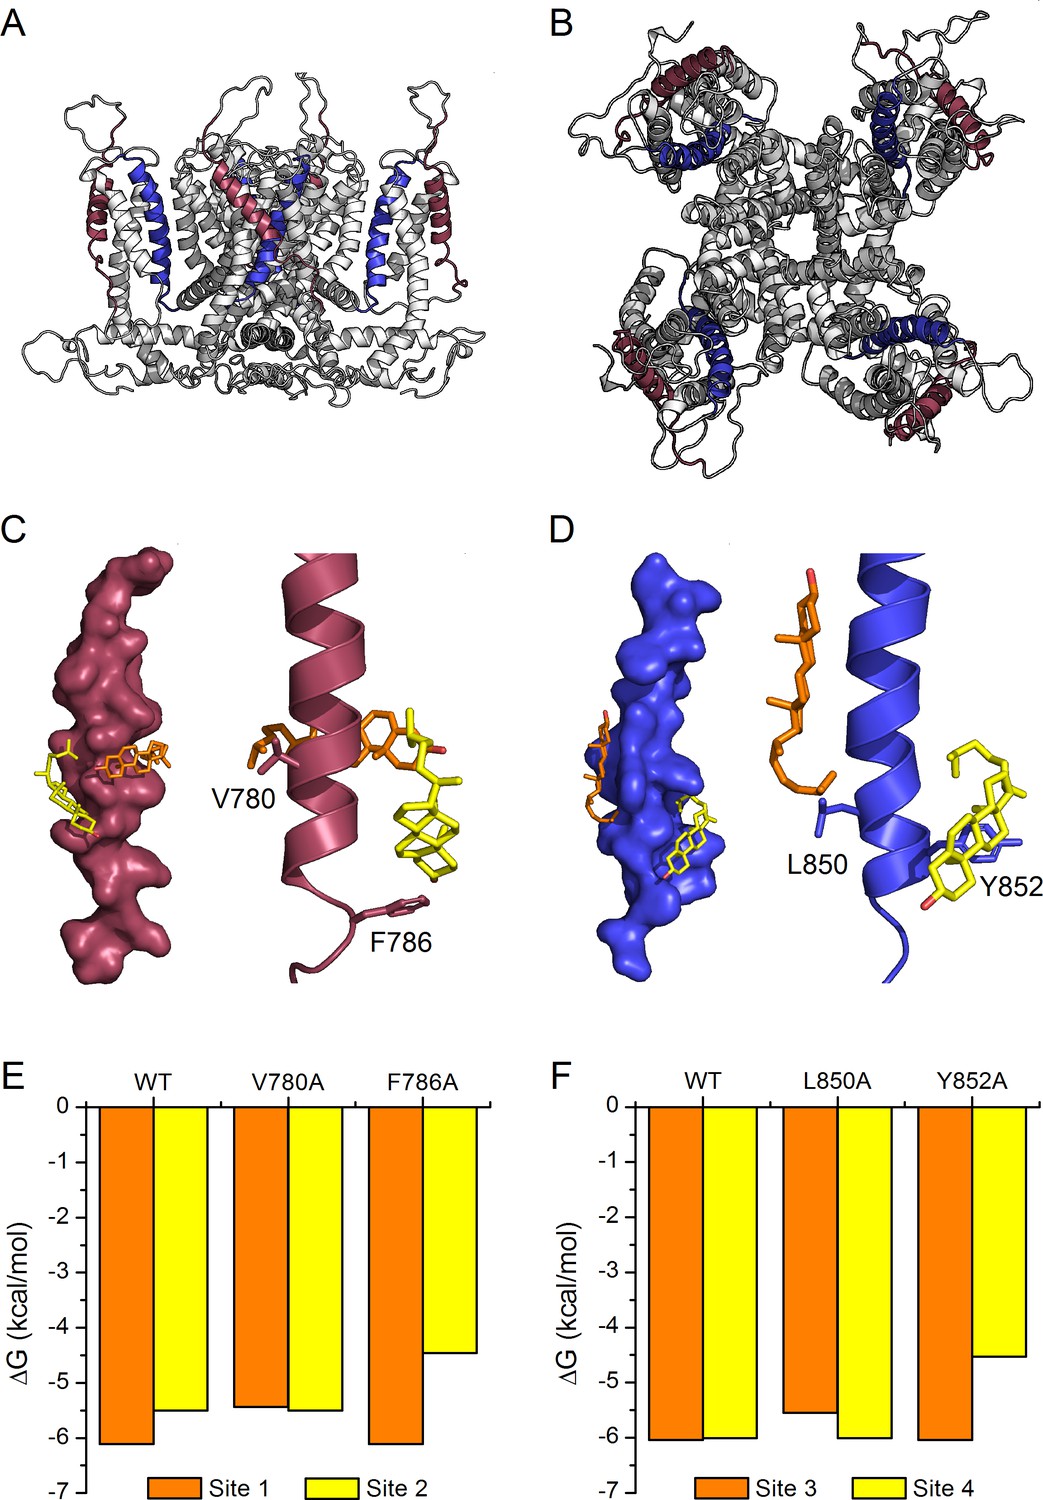
Model of cholesterol binding to TM2 and TM4 in TRPA1.
(A, B) Model of the mTRPA1 channel (A), side view and (B), top view) presenting localization of TM2 (colored purple) and TM4 (colored blue) segments. (C, D) Two cholesterol molecules (orange and yellow) interact simultaneously with TM2 and TM4 segments (panels C-left and D-left), a zoom-in of residues V780 and F786 (in TM2) and L850 and Y852 (in TM4) showing the close proximity of the cholesterol molecules to the side chains (panels C-right and D-right). (E, F) Calculated energies of cholesterol binding to the docking sites in the WT and mutant channels.
Figure 7 with 1 supplement
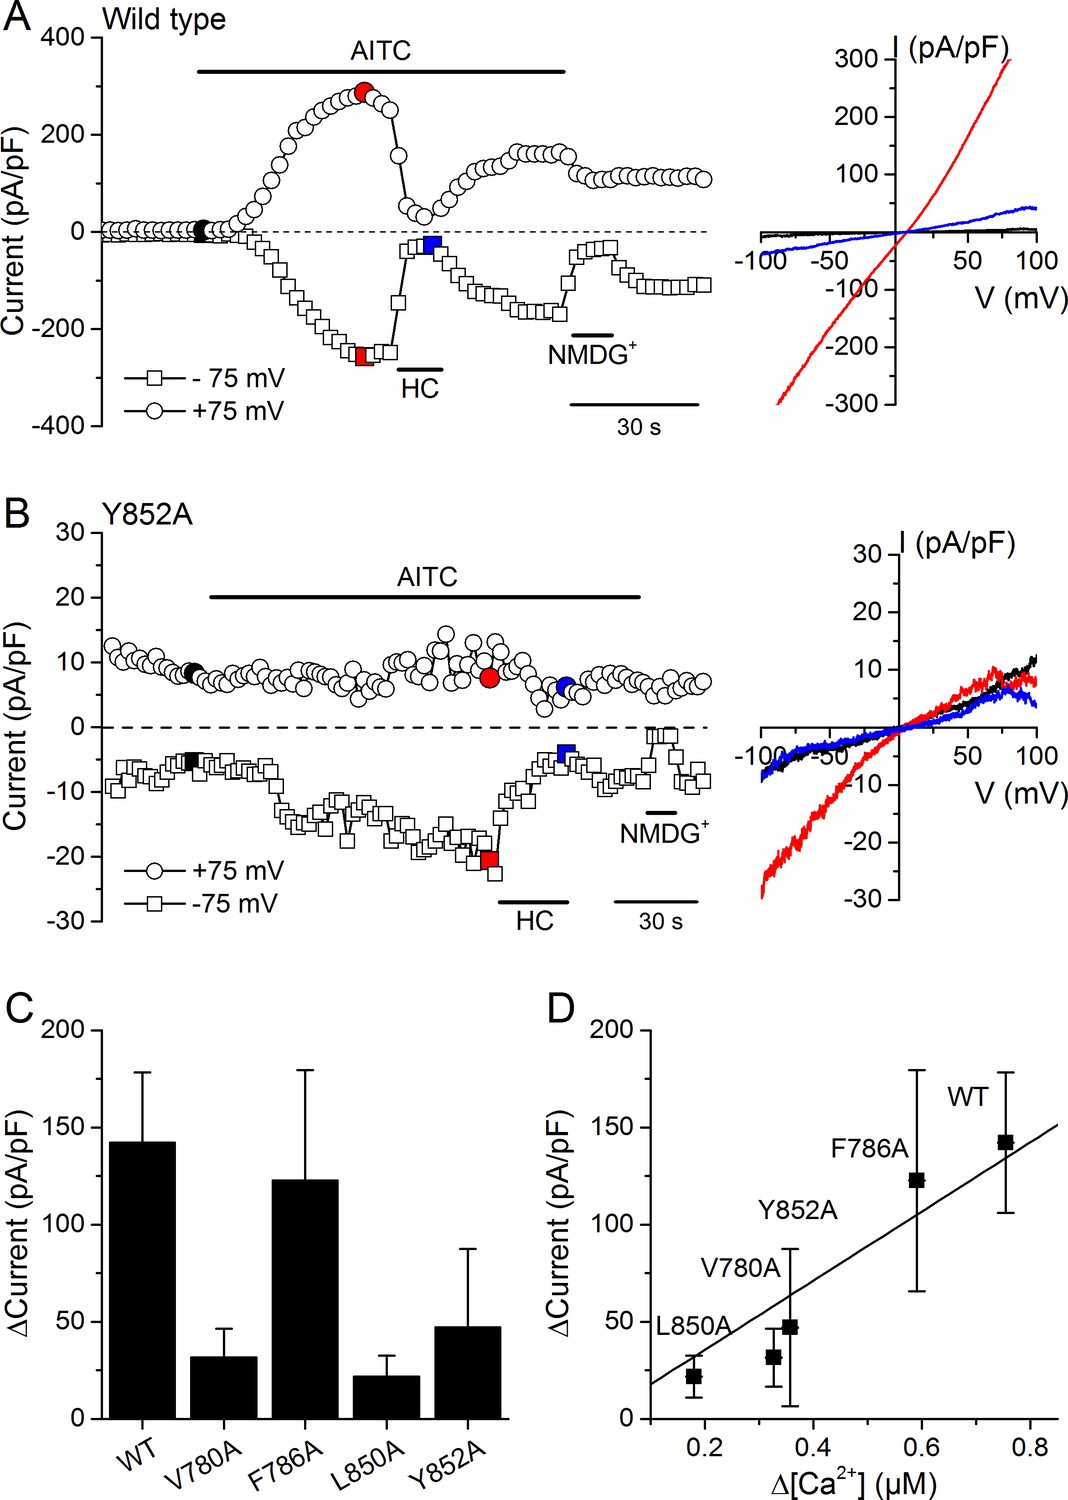
Effects of mutations in CRAC motifs in TM2 and TM4 on AITC-evoked TRPA1 currents.
(A, B) Time course of mTRPA1-mCherry (Wild type) (A) or Y852A TRPA1 mutant (B) currents response to 300 µM AITC. Currents were blocked using 100 µM HC030031 (HC). The colored data points correspond to the current traces shown on the right. (C) Maximal amplitude of currents recorded at −75 mV upon application of AITC (300 µM) in HEK293T cells expressing WT TRPA1, V780A, F786A, L850A or Y852A mutants (n = 4–8). (D) Correlation between the increases in current density and intracellular [Ca2+] induced by 300 µM AITC in cells expressing WT TRPA1 or channel mutants.
-
Figure 7—source data 1
Currents of mTRPA1 and channel mutants upon AITC application.
- https://doi.org/10.7554/eLife.46084.022
Figure 7—figure supplement 1
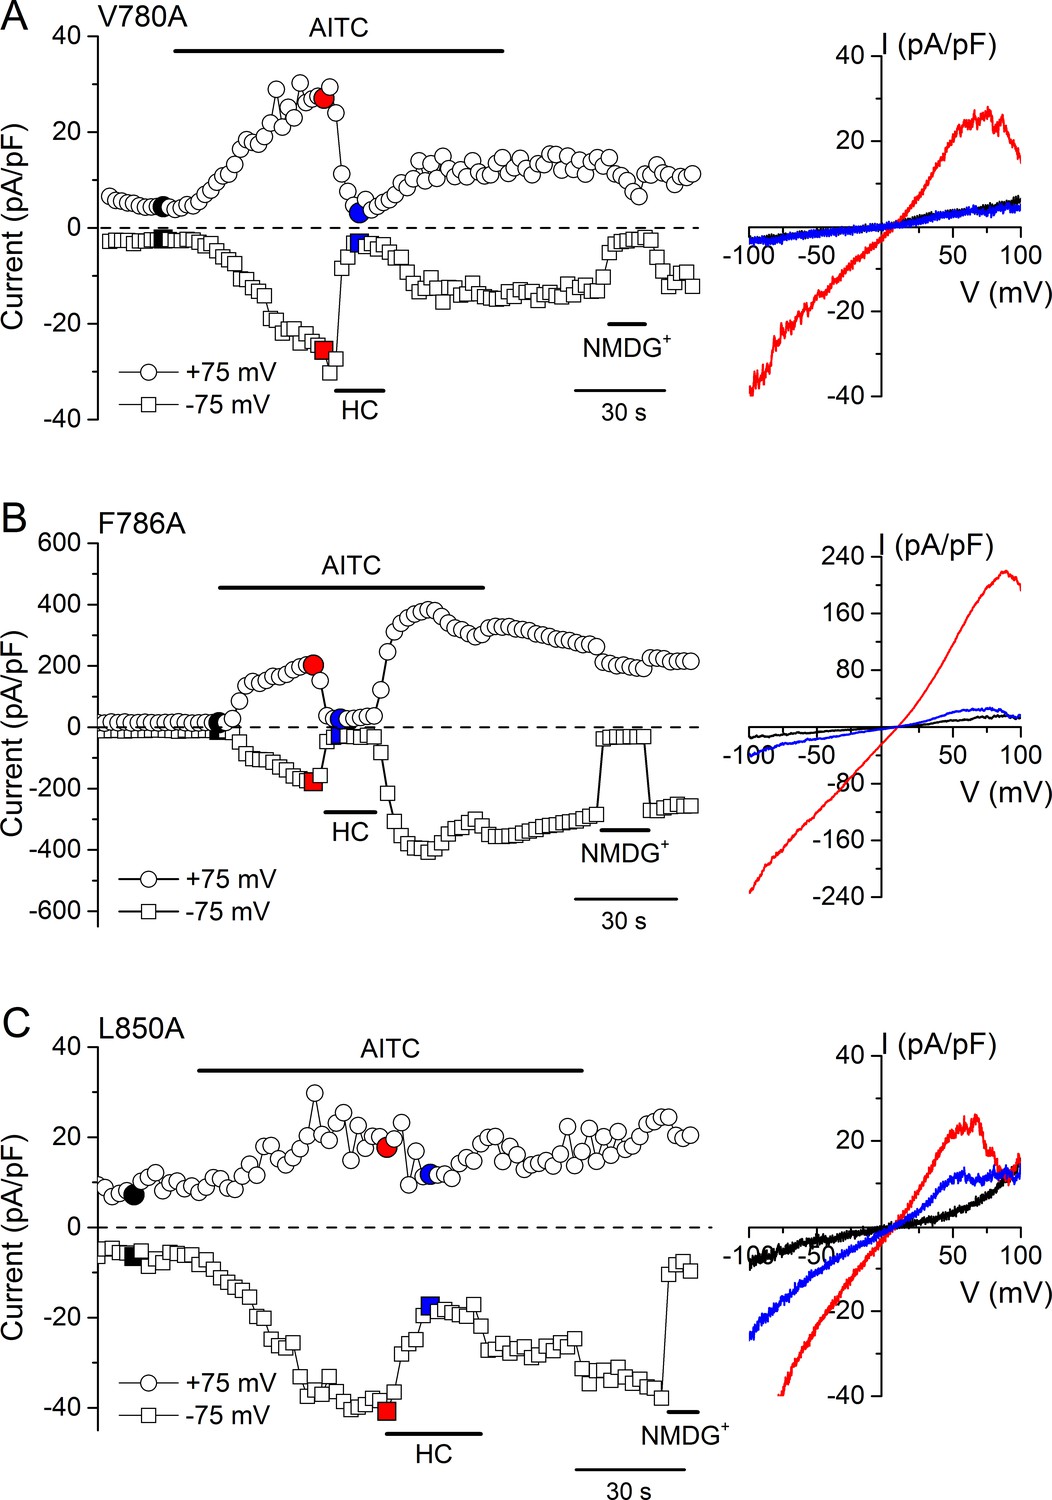
Changes in AITC-evoked TRPA1 currents induced by point mutations in TM2 and TM4 CRAC motifs.
(A–C) Time course of a whole-cell currents recorded from HEK293T cells expressing V780A (A), F786A (B) or L850A (C) TRPA1 mutant channels in response to 300 µM AITC. Currents were blocked by 100 µM HC030031 (HC). The colored data points correspond to the current traces shown on the right.
Figure 8
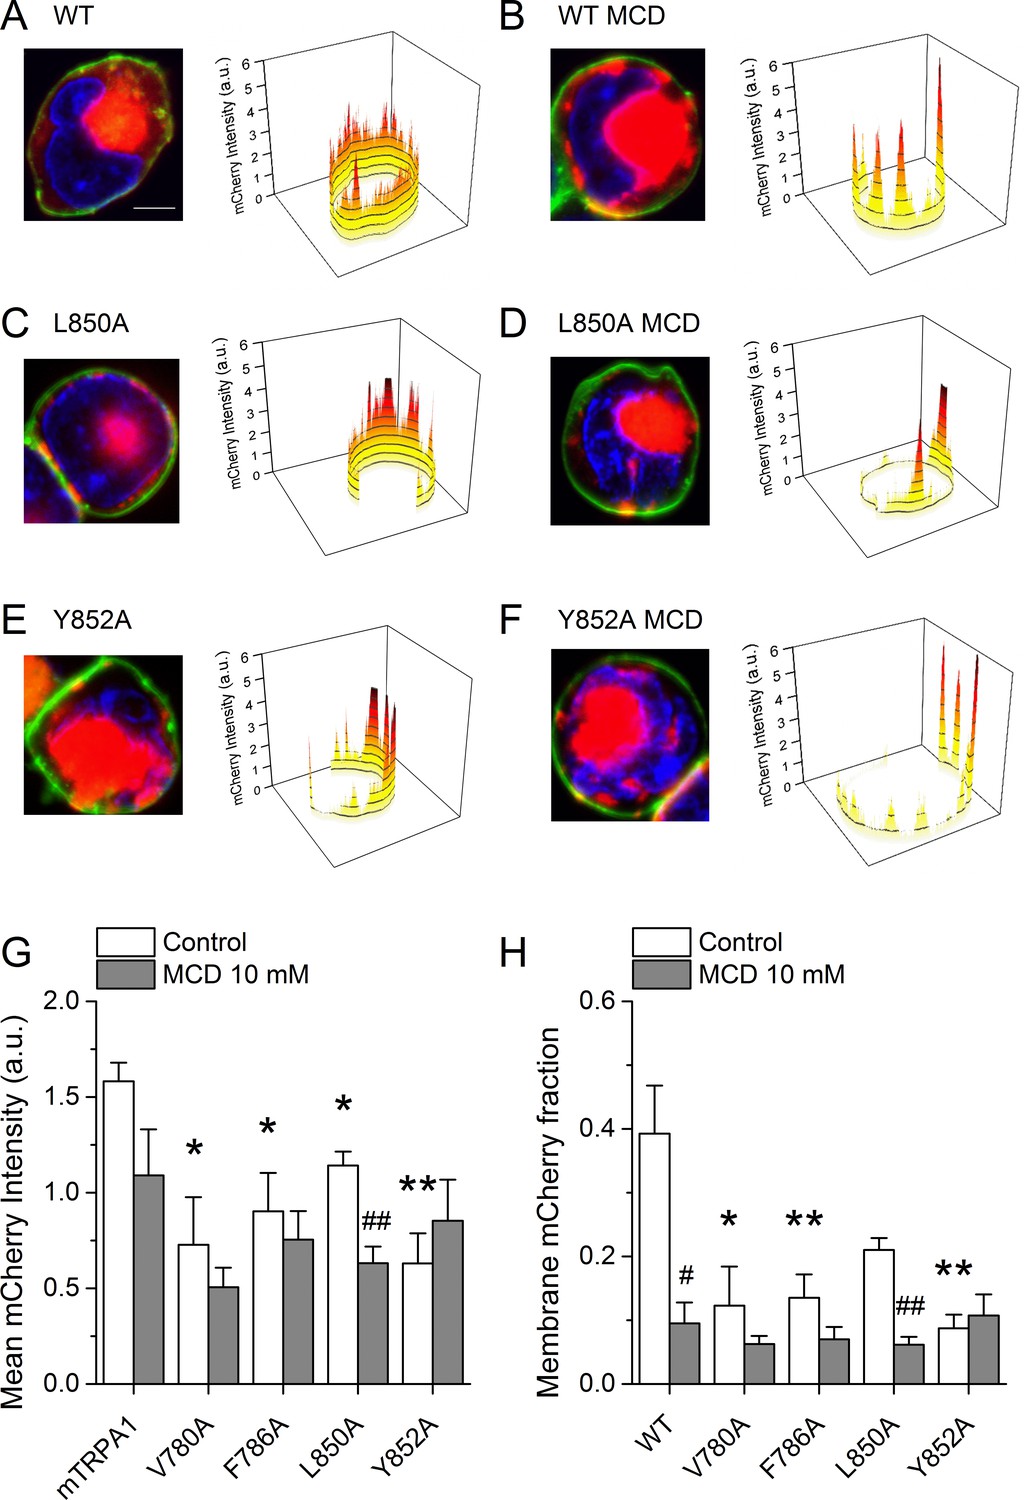
Cholesterol-TRPA1 interactions are essential for normal channel distribution in the membrane.
(A–B) Confocal microscopy images of HEK293T cells expressing mTRPA1-mCherry (red) in the control condition (A) and after treatment with MCD (10 mM) (B). Expression pattern of mutant L850A TRPA1-mCherry (C and D) or Y852A TRPA1-mCherry (E and F). Cells were stained with the membrane dye CellBrite (green) and DAPI (blue). Scale bar, 5 µm. Right panels, 3D graph representing total membrane mCherry intensity corresponding the green-stained cell membrane area. (G) Mean membrane mCherry intensity in HEK293T expressing WT or mutated TRPA1 in control condition and after MCD treatment quantified from confocal microscopy images (n ≥ 5). (H) Mean mCherry membrane fractions quantified using custom design software representing distribution pattern of HEK293T expressing WT or mutated TRPA1 in control or after MCD treatment (n ≥ 5). *, p<0.05; **, p<0.01; #, p<0.05; ##, p<0.01; two-tailed Mann-Whitney U test.
-
Figure 8—source data 1
Intensities obtained from confocal microscopy and statistical analysis.
- https://doi.org/10.7554/eLife.46084.024
Videos
Video 1
TIRF microscopy recording of HEKT293 cell transfected with mTRPA1-mCherry (red) and stained with Vybrant Alexa Flour 488 lipid raft labeling kit (green).
Time series of images were recorded at intervals of 500 ms and displayed with delay of 200 ms, scale bar 10 µm, digital gain 2, binning 2 × 2.
Additional files
-
Source code 1
MATLAB script.
- https://doi.org/10.7554/eLife.46084.025
-
Transparent reporting form
- https://doi.org/10.7554/eLife.46084.026
Download links
A two-part list of links to download the article, or parts of the article, in various formats.
Downloads (link to download the article as PDF)
Open citations (links to open the citations from this article in various online reference manager services)
Cite this article (links to download the citations from this article in formats compatible with various reference manager tools)
Mouse TRPA1 function and membrane localization are modulated by direct interactions with cholesterol
eLife 8:e46084.
https://doi.org/10.7554/eLife.46084


