Ancient origins of arthropod moulting pathway components
- University of Vienna, Austria
Figures
Figure 1
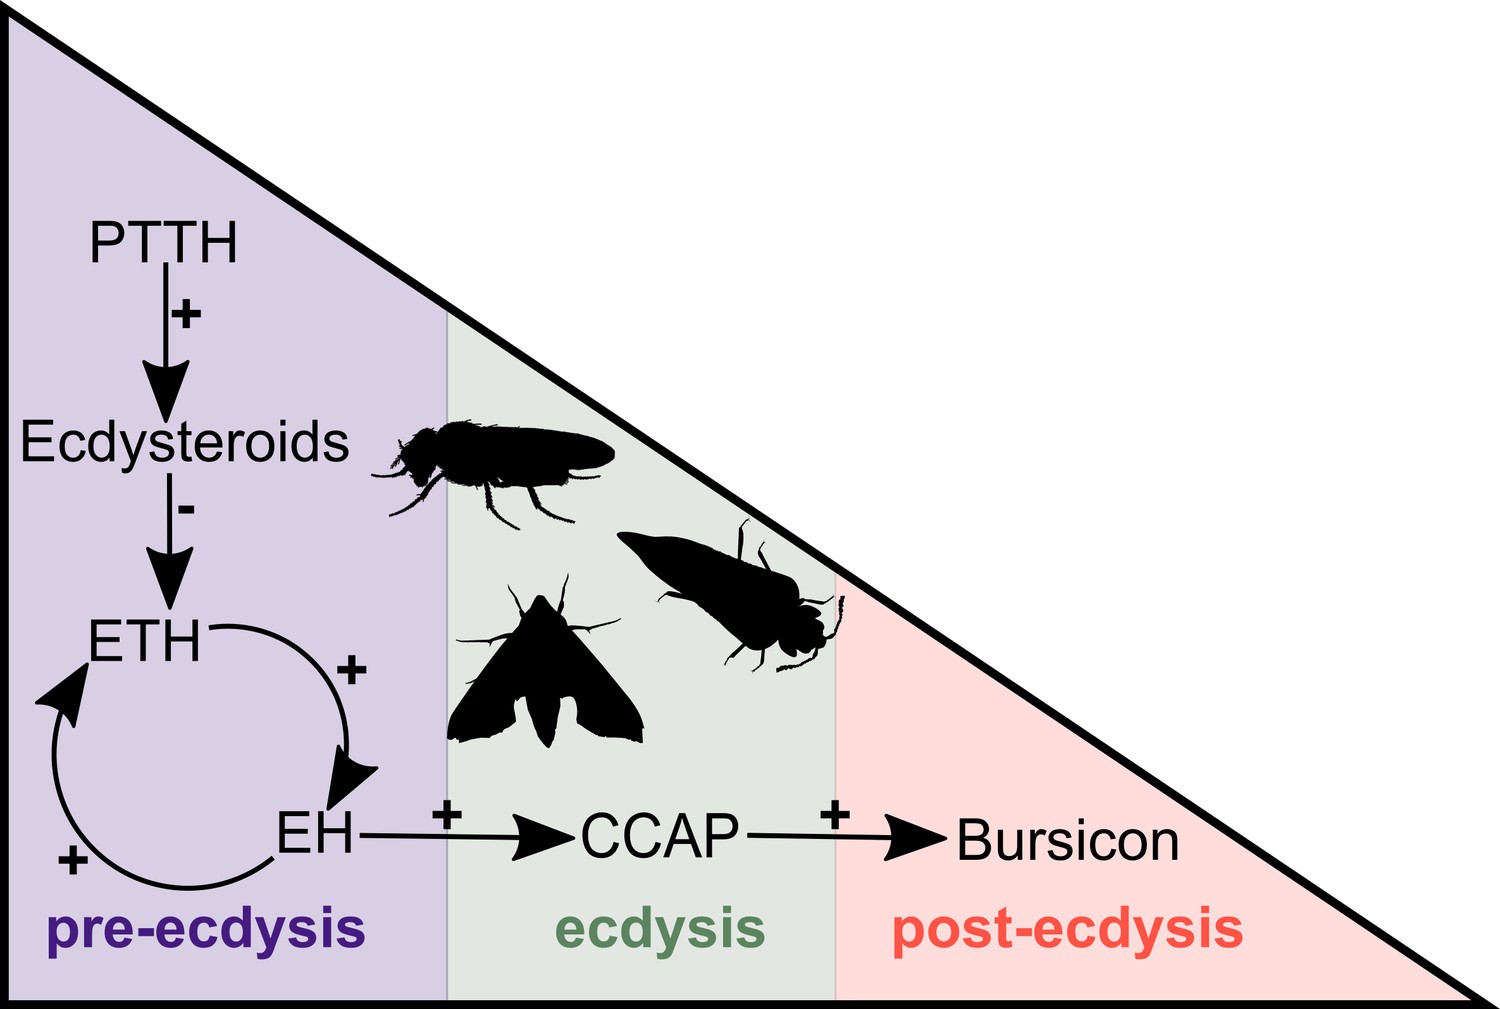
Simplified overview of the neuropeptide/hormone signalling pathway at moulting.
PTTH initiates a signalling cascade that results in the biosynthesis of ecdysone. The decline of the ecdysone titre triggers the release of ETH that, in turn, causes the release of EH. These two hormones mutually enhance one another in a positive feedback loop to control and regulate pre-ecdysis behaviour. With the ensuing release of CCAP, caused by EH, pre-ecdysis ceases and the ecdysis motor program is started. Finally, bursicon responds to the increasing levels of CCAP and initiates post-ecdysis behaviour and cuticle tanning. This figure is based on the studies of McNabb et al. (1997) and Clark et al. (2004). Animal silhouettes were obtained under Public Domain licence at phylopic (http://phylopic.org/), unless otherwise indicated. Beetle: T. Michael Keesey after Ponomarenko (available for reuse under https://creativecommons.org/publicdomain/zero/1.0/); moth: by Gareth Monger (available for reuse under https://creativecommons.org/licenses/by/3.0/); Drosophila: Thomas Hegna (available for reuse under https://creativecommons.org/publicdomain/zero/1.0/).
Figure 2 with 6 supplements
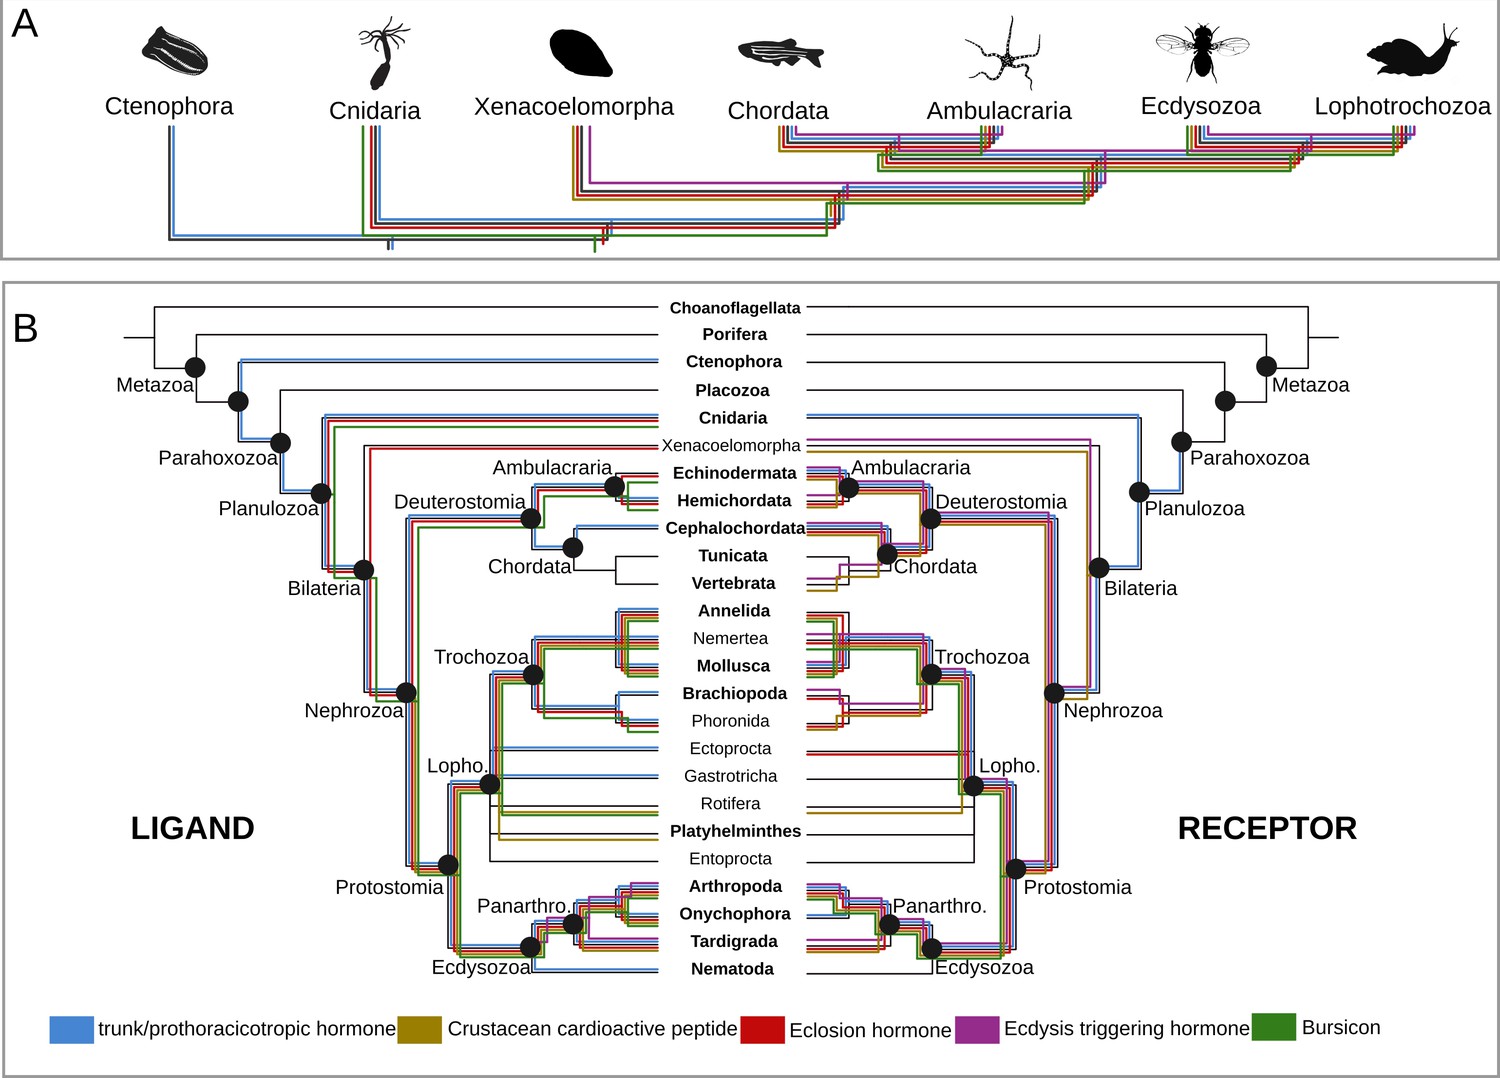
Origin and distribution of the key ligand-receptor components of the arthropod moulting signalling pathway across Metazoa.
(A) Simplified phylogeny (based on Dunn et al., 2014) of Metazoa showing the lineages in which the key components of the arthropod moulting signalling pathway are present. Note that Porifera and Placozoa, that lack the moulting pathway components investigated here, are omitted for clarity. Coloured lines indicate the presence of a given ligand and/or receptor in a given lineage. Eclosion hormone and bursicon peptidergic systems originated prior to the cnidarian-bilaterian split, whereas the ecdysis-triggering hormone and crustacean cardioactive peptide trace back to the last common ancestor of Bilateria. PTTH is an insect-specific neuropeptide. (B) Expanded phylogeny of Metazoa with Porifera as the earliest branching clade (adapted from Dunn et al., 2014). Coloured lines indicate the presence of a given ligand (right side) and receptor (left side) in a given lineage. Phylum name in bold indicates the availability of genomic data. Note that although the trunk ortholog was not retrieved from the genomes of Nematostella vectensis and Caenorhabditis elegans, similarity searches against publicly available protein databases identified this gene in other cnidarian and nematode species. Animal silhouettes were obtained under Public Domain licence at phylopic (http://phylopic.org/), unless otherwise indicated. Credited images: Ctenophora: Martini (available for reuse under https://creativecommons.org/publicdomain/zero/1.0/); Cnidaria: Jack Warner (available for reuse under https://creativecommons.org/publicdomain/zero/1.0/); Xenacoelomorpha: Andreas Hejnol (available for reuse under https://creativecommons.org/licenses/by-nc/3.0/); Chordata: Jake Warner (available for reuse under https://creativecommons.org/publicdomain/zero/1.0/); Ambulacraria: Noah Schlottman (photograph from Casey Dunn available for reuse under https://creativecommons.org/licenses/by-sa/3.0/); Ecdysozoa: Thomas Hegna based on picture by Nicolas Gompel (available for reuse under https://creativecommons.org/publicdomain/mark/1.0/); Lophotrochozoa: Fernando Carezzano (available for reuse under https://creativecommons.org/publicdomain/zero/1.0/).
-
Figure 2—source data 1
PTTH/trunk/torso proteins and tree associated files.
Compressed. zip file containing the 3D-cluster map of the PTTH and trunk ligands in. rtf format, the torso receptor proteins in fasta format, the multiple sequence alignment of the receptor (trimmed and untrimmed), and the tree files genereted by RAxML, PhyML and mrbayes programs. The 3D cluster peptide map can be visualised and manipulated using the program clans (Frickey and Lupas, 2004; see ftp://ftp.tuebingen.mpg.de/pub/protevo/CLANS/). The multiple sequence alignment files can be viewed with aliview (Larsson, 2014). The phylogenetic tree files can be viewed using Figtree (http://tree.bio.ed.ac.uk/software/figtree/) or TreeGraph2 (Stöver and Müller, 2010).
- https://doi.org/10.7554/eLife.46113.011
-
Figure 2—source data 2
ETH/ETH-receptor proteins and tree associated files.
Compressed. zip file containing the 3D-cluster map of the ETH ligands in. rtf format, the ETH receptor proteins in fasta format, the multiple sequence alignment of the receptor (trimmed and untrimmed), and the tree files genereted by RAxML, PhyML and mrbayes programs. The 3D cluster peptide map can be visualised and manipulated using the program clans (Frickey and Lupas, 2004a; see ftp://ftp.tuebingen.mpg.de/pub/protevo/CLANS/). The multiple sequence alignment files can be viewed with aliview (Larsson, 2014a). The phylogenetic tree files can be viewed using Figtree (http://tree.bio.ed.ac.uk/software/figtree/) or TreeGraph2 (Stöver and Müller, 2010a).
- https://doi.org/10.7554/eLife.46113.012
-
Figure 2—source data 3
EH/EH-receptor proteins and tree associated files.
Compressed. zip file containing the 3D-cluster map of the EH ligands in. rtf format, the EH receptor proteins in fasta format, the multiple sequence alignment of the receptor (trimmed and untrimmed), and the tree files genereted by RAxML, PhyML and mrbayes programs. The 3D cluster peptide map can be visualised and manipulated using the program clans (see ftp://ftp.tuebingen.mpg.de/pub/protevo/CLANS/). The multiple sequence alignment files can be viewed with aliview (Larsson, 2014a). The phylogenetic tree files can be viewed using Figtree (http://tree.bio.ed.ac.uk/software/figtree/) or TreeGraph2 (Stöver and Müller, 2010a).
- https://doi.org/10.7554/eLife.46113.013
-
Figure 2 - source data 4
CCAP/CCAP-receptor proteins and associated tree files.
Compressed. zip file containing the 3D-cluster map of the CCAP ligands in. rtf format, the CCAP receptor proteins in fasta format, the multiple sequence alignment of the receptor (trimmed and untrimmed), and the tree files genereted by RAxML, PhyML and mrbayes programs. The 3D cluster peptide map can be visualised and manipulated using the program clans (Frickey and Lupas, 2004; see ftp://ftp.tuebingen.mpg.de/pub/protevo/CLANS/). The multiple sequence alignment files can be viewed with aliview (Larsson, 2014a). The phylogenetic tree files can be viewed using Figtree (http://tree.bio.ed.ac.uk/software/figtree/) or TreeGraph2 (Stöver and Müller, 2010a).
- https://doi.org/10.7554/eLife.46113.014
-
Figure 2—source data 5
Bursicon/rickets protein and tree associated files.
Compressed. zip file containing the 3D-cluster map of the bursicon ligands in. rtf format, the rickets receptor proteins in fasta format, the multiple sequence alignment of the receptor (trimmed and untrimmed), and the tree files genereted by RAxML, PhyML and mrbayes programs. The 3D cluster peptide map can be visualised and manipulated using the program clans (Frickey and Lupas, 2004a; see ftp://ftp.tuebingen.mpg.de/pub/protevo/CLANS/). The multiple sequence alignment files can be viewed with aliview (Larsson, 2014). The phylogenetic tree files can be viewed using Figtree (http://tree.bio.ed.ac.uk/software/figtree/) or TreeGraph2 (Stöver and Müller, 2010).
- https://doi.org/10.7554/eLife.46113.015
Figure 2—figure supplement 1
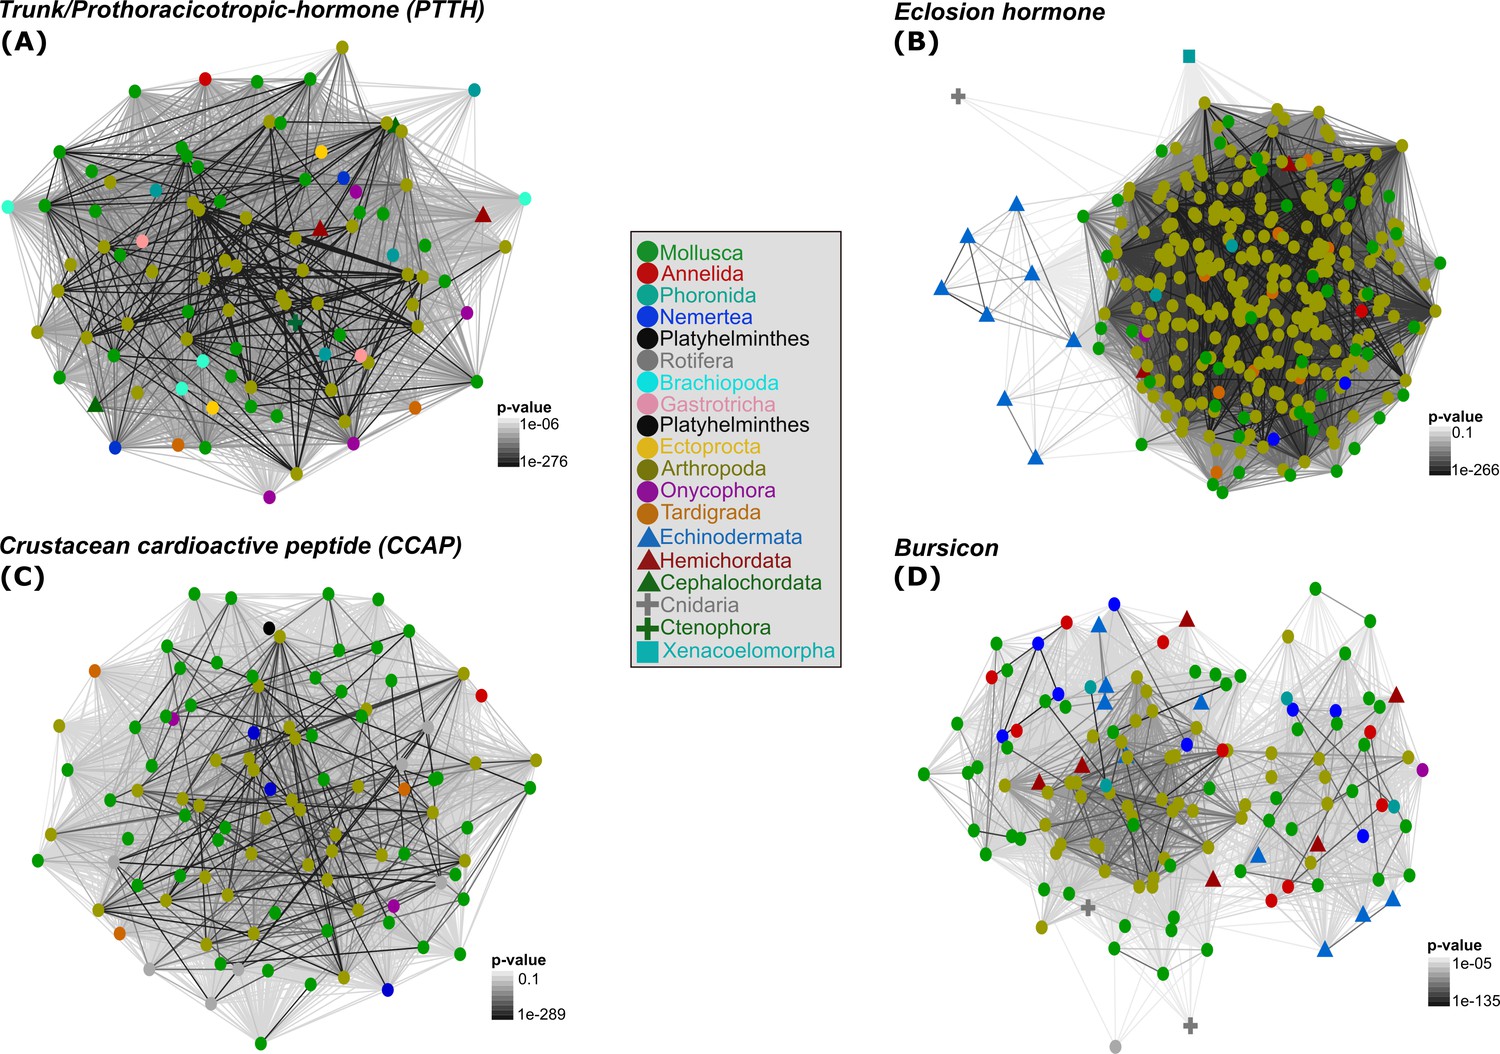
2D cluster maps of trunk/PTTH, EH, CCAP and bursicon ligands reflecting the evolutionary relatedness of the key arthropod moulting components among metazoans.
Colour shapes and nodes are based on the different metazoan phyla investigated (circles = protostome animals; triangles = deuterostome animals; crosses = cnidarians and ctenophores; square = xenacoelomorphs). Edges correspond to BLAST connections. The ctenophore trunk sequence (A) is circled and marked with a white arrow.
Figure 2—figure supplement 2
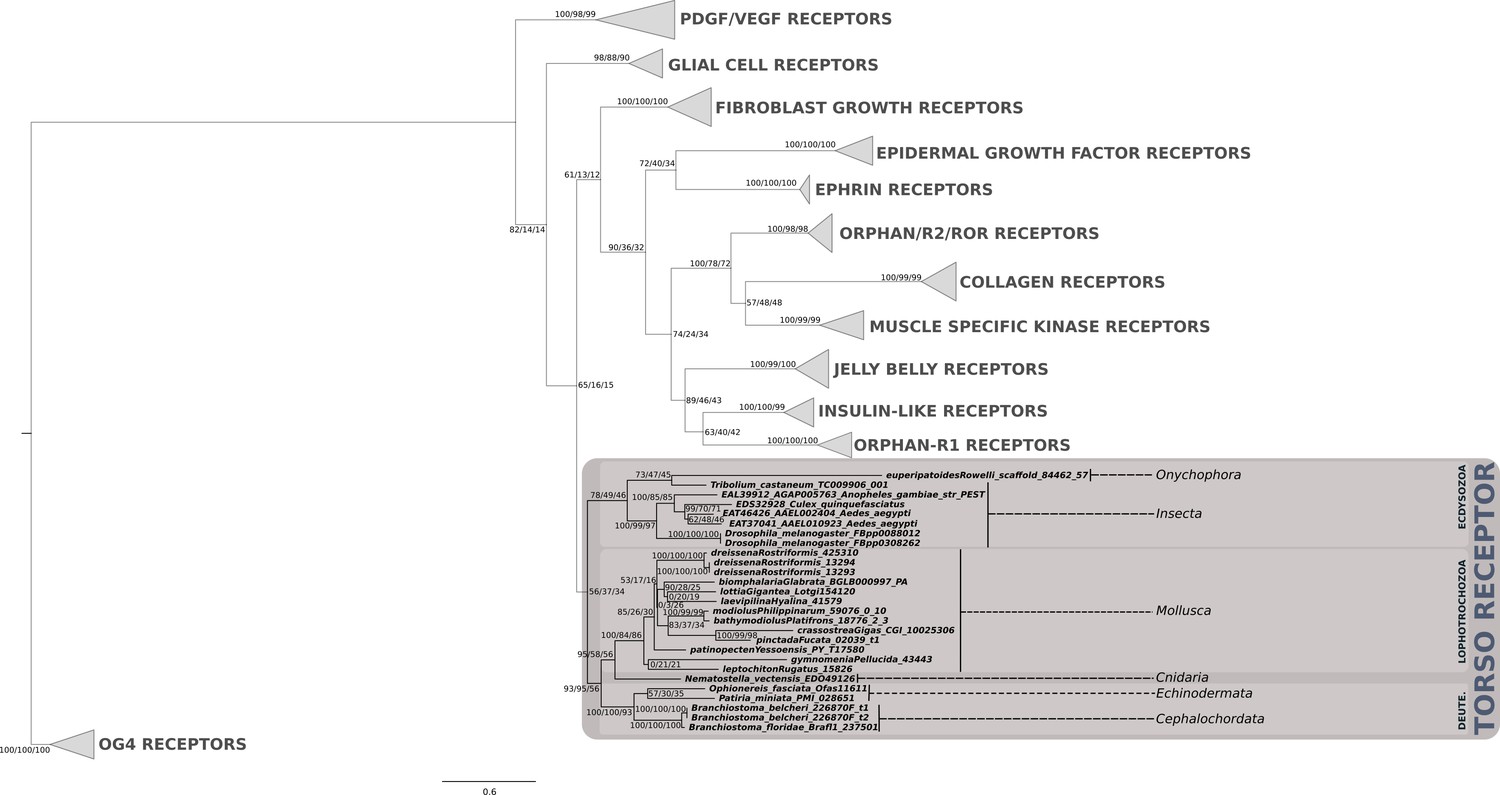
Phylogenetic analysis of the PTTH/trunk receptor tyrosine kinase torso showing the presence of torso receptor in cnidarians, lophotrochozoans, ecdysozoans and deuterostomes.
Support values for the tree nodes obtained from mrbayes, RAxML and PhyML are shown as percentage. Tree topology obtained from RAxML was used as a backbone, and conflicting topology branches from mrbayes and PhyML inferred trees are marked by brackets ([]) around the support values.
Figure 2—figure supplement 3
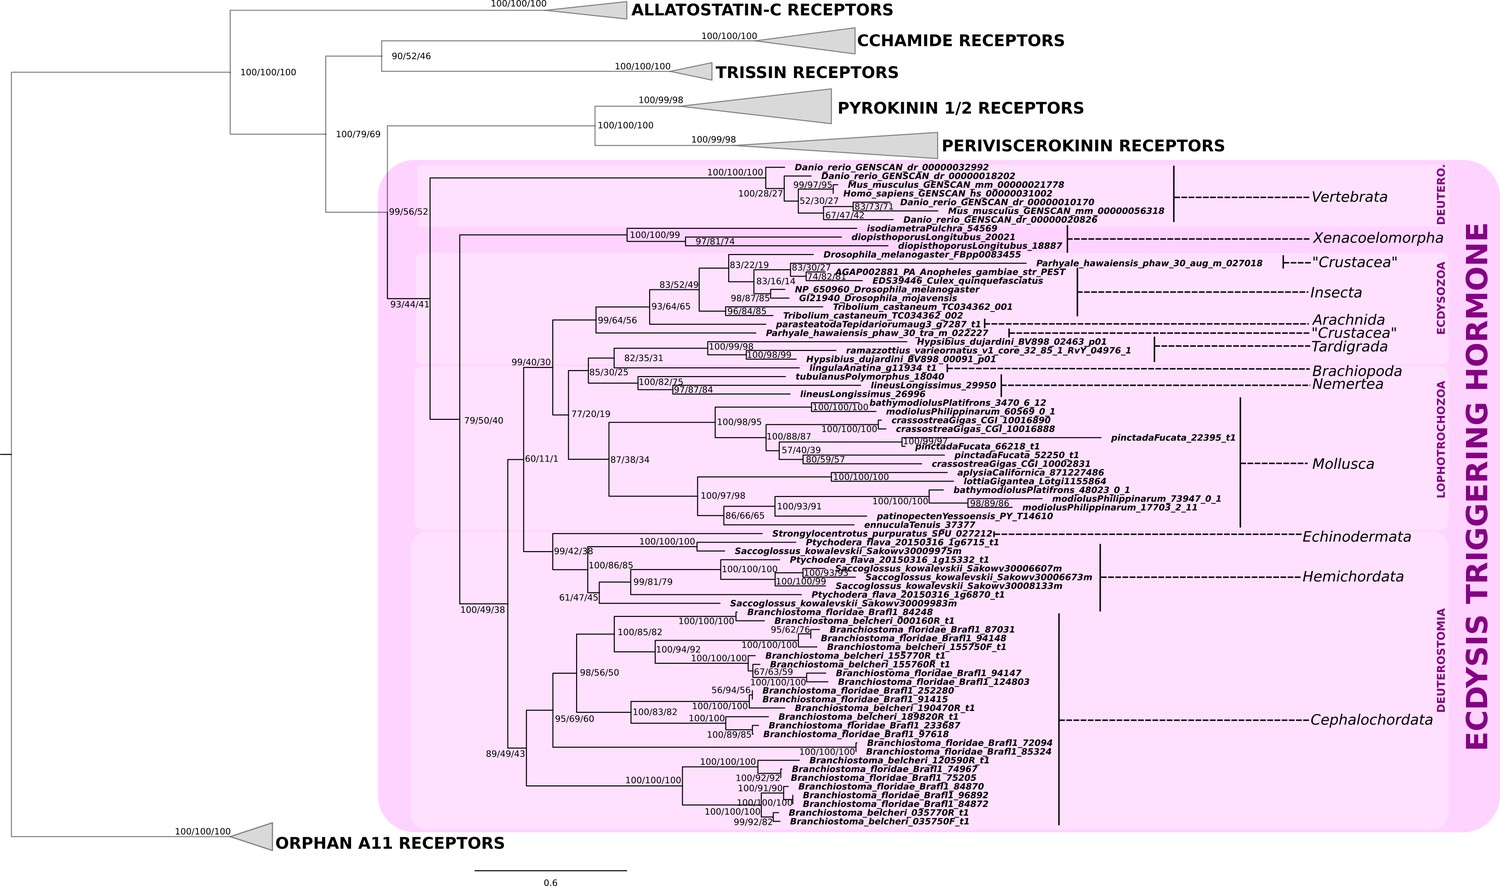
Phylogenetic analysis of the ecdysis-triggering hormone receptor showing the presence of ETH-receptor in bilaterians.
Note a substantial expansion of the eth-receptor homologs in the genomes of the Branchiostoma floridae and B. belcheri. Support values for the tree nodes obtained from mrbayes, RAxML and PhyML are shown as percentage. Tree topology obtained from RaXML was used as a backbone, and conflicting topology branches from RAxML and PhyML inferred trees are marked by brackets ([]) around the support values.
Figure 2—figure supplement 4
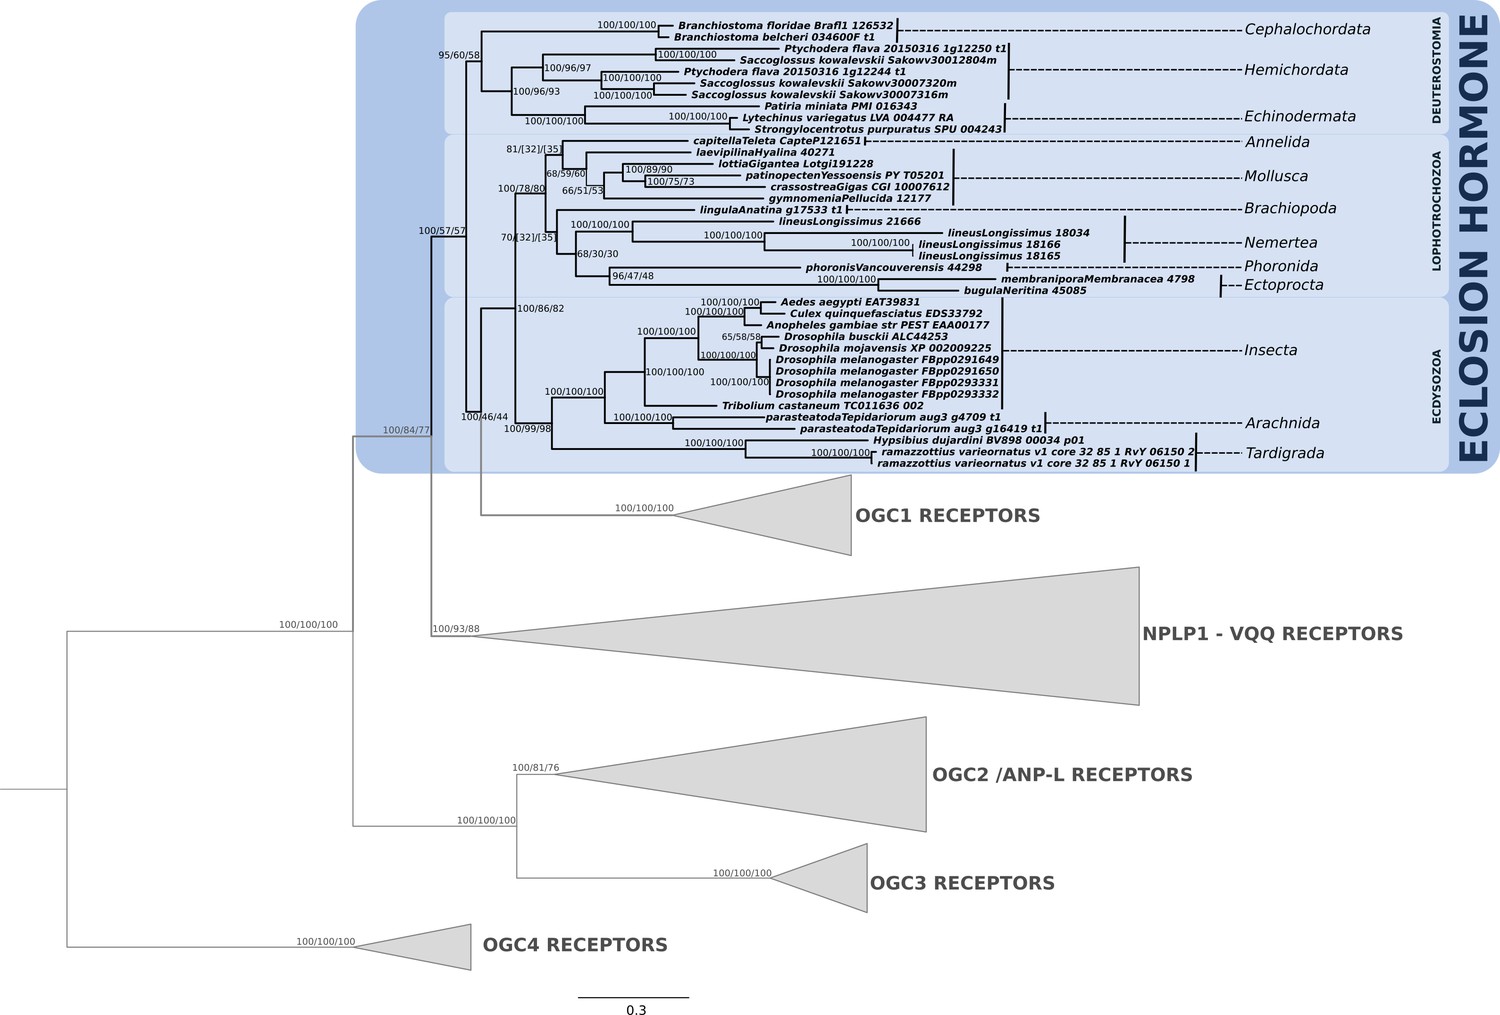
Phylogenetic analysis of the guanylyl cyclase eclosion hormone receptor showing the presence of EH-receptor in ecdysozoans, lophotrochozoans, ambulacrarians and cephalochordates.
Support values for the tree nodes obtained from mrbayes, RAxML and PhyML are shown as percentage. Tree topology obtained from mrbayes was used as a backbone, and conflicting topology branches from RAxML and PhyML inferred trees are marked by brackets ([]) around the support values.
Figure 2—figure supplement 5
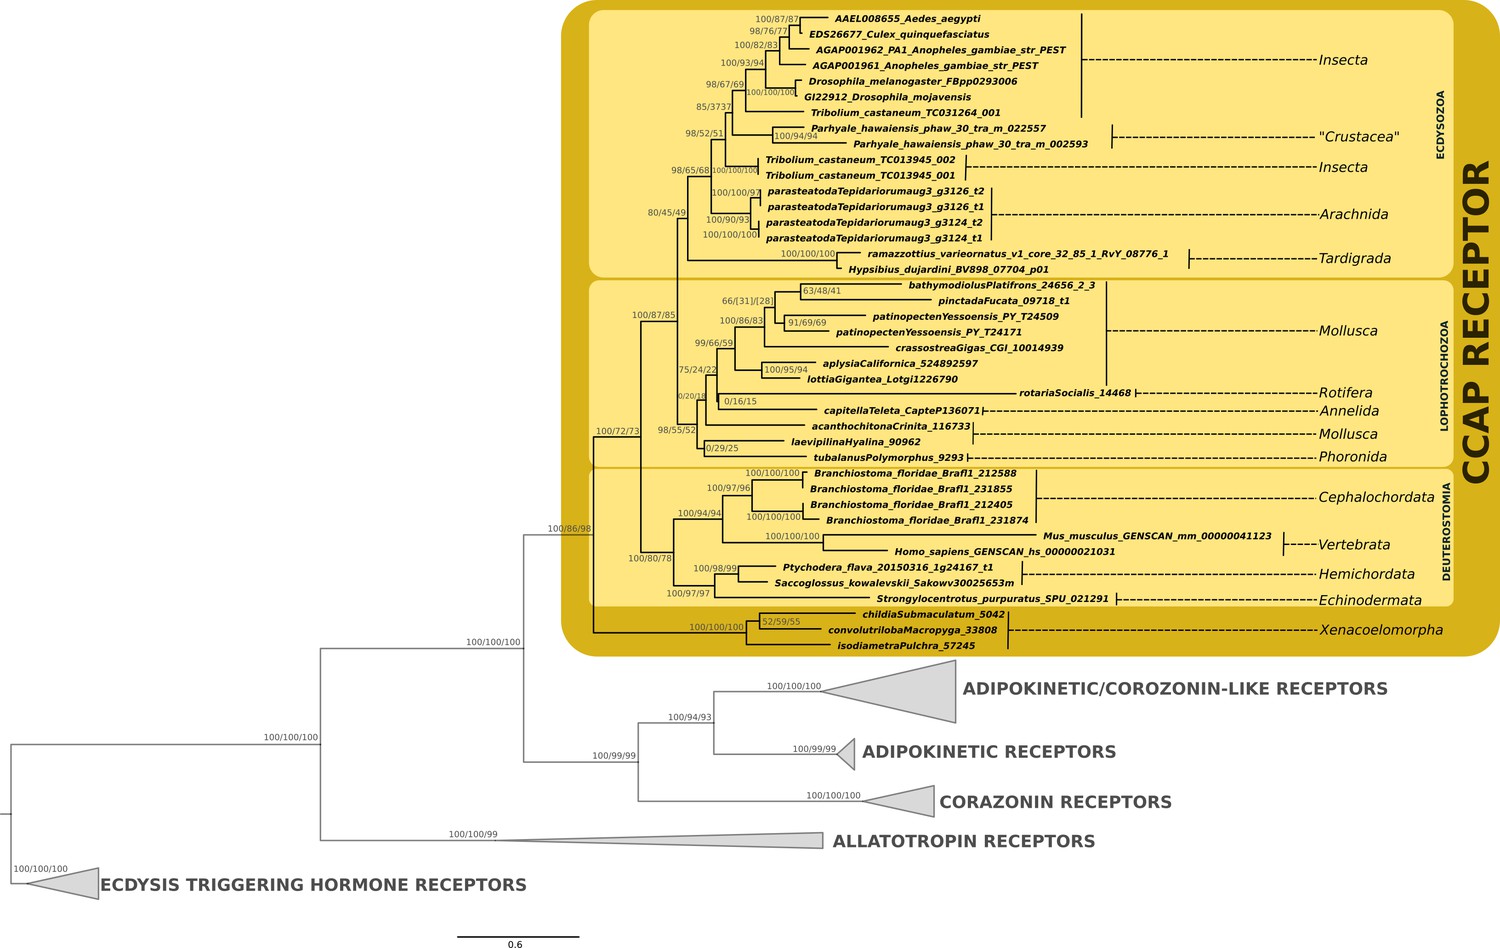
Phylogenetic analysis of the G protein-coupled CCAP receptor showing the presence of CCAP-receptor in ecdyzosoans, lophotrochozoans, deuterostomes (including vertebrates) and acoels.
Support values for the tree nodes obtained from mrbayes, RAxML and PhyML are shown as percentage. Tree topology obtained from RAxML was used as a backbone, and conflicting topology branches from mrbayes and PhyML inferred trees are marked by brackets ([]) around the support values.
Figure 2—figure supplement 6
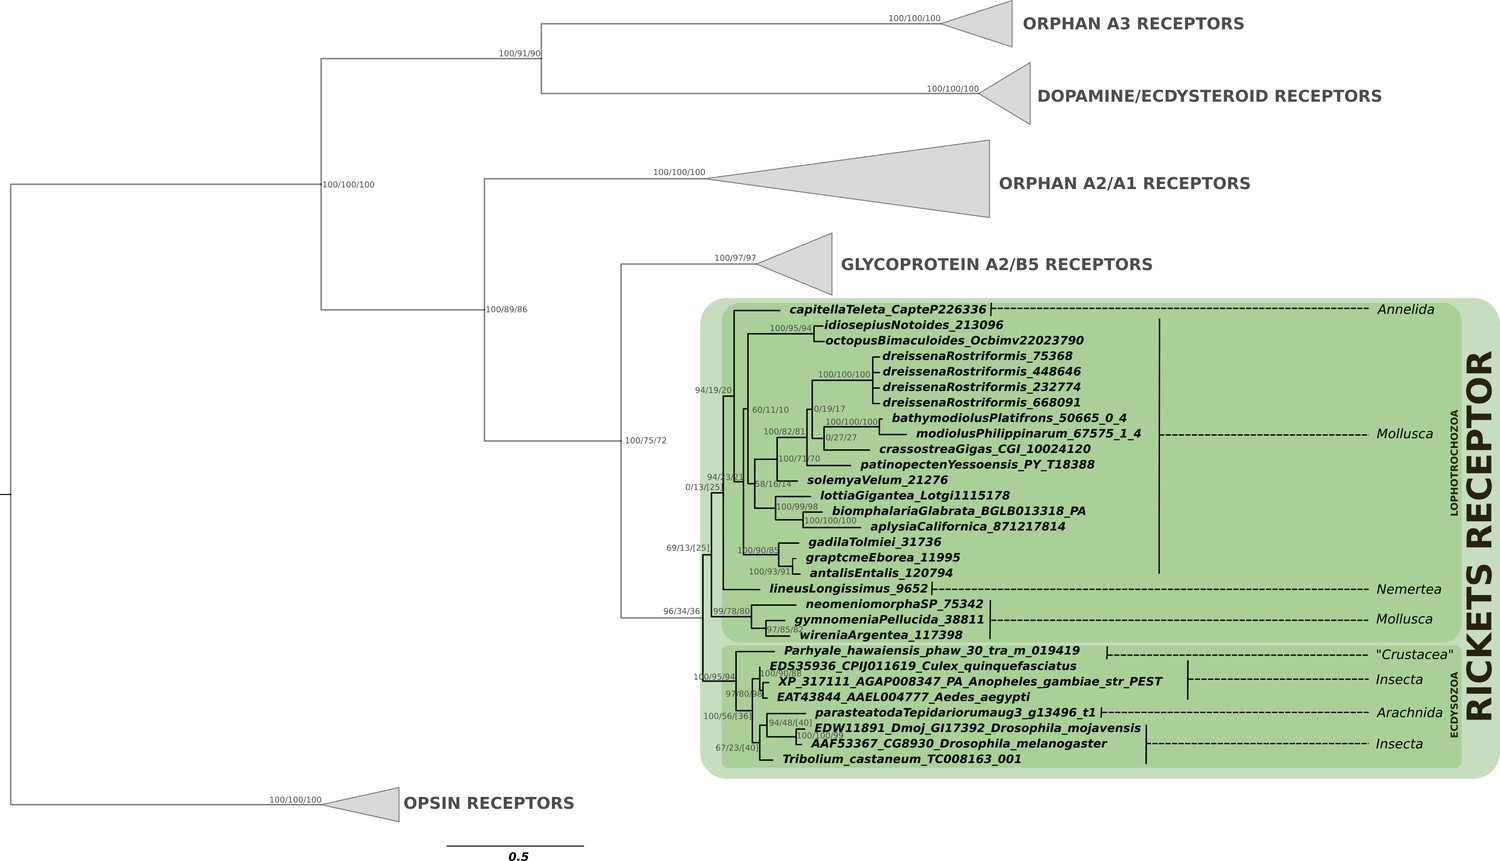
Phylogenetic analysis of the bursicon G protein-coupled receptor rickets showing the presence of rickets receptor in arthropods and lophotrochozoans.
Note the restriction of the rickets receptor to arthropods and lophotrochozoans, while its ligand is also present in cnidarians and various deuterostomes. Support values for the tree nodes obtained from mrbayes, RAxML and PhyML are shown as percentage. Tree topology obtained from RAxML was used as a backbone, and conflicting topology branches from mrbayes and PhyML inferred trees are marked by brackets ([]) around the support values.
Figure 3
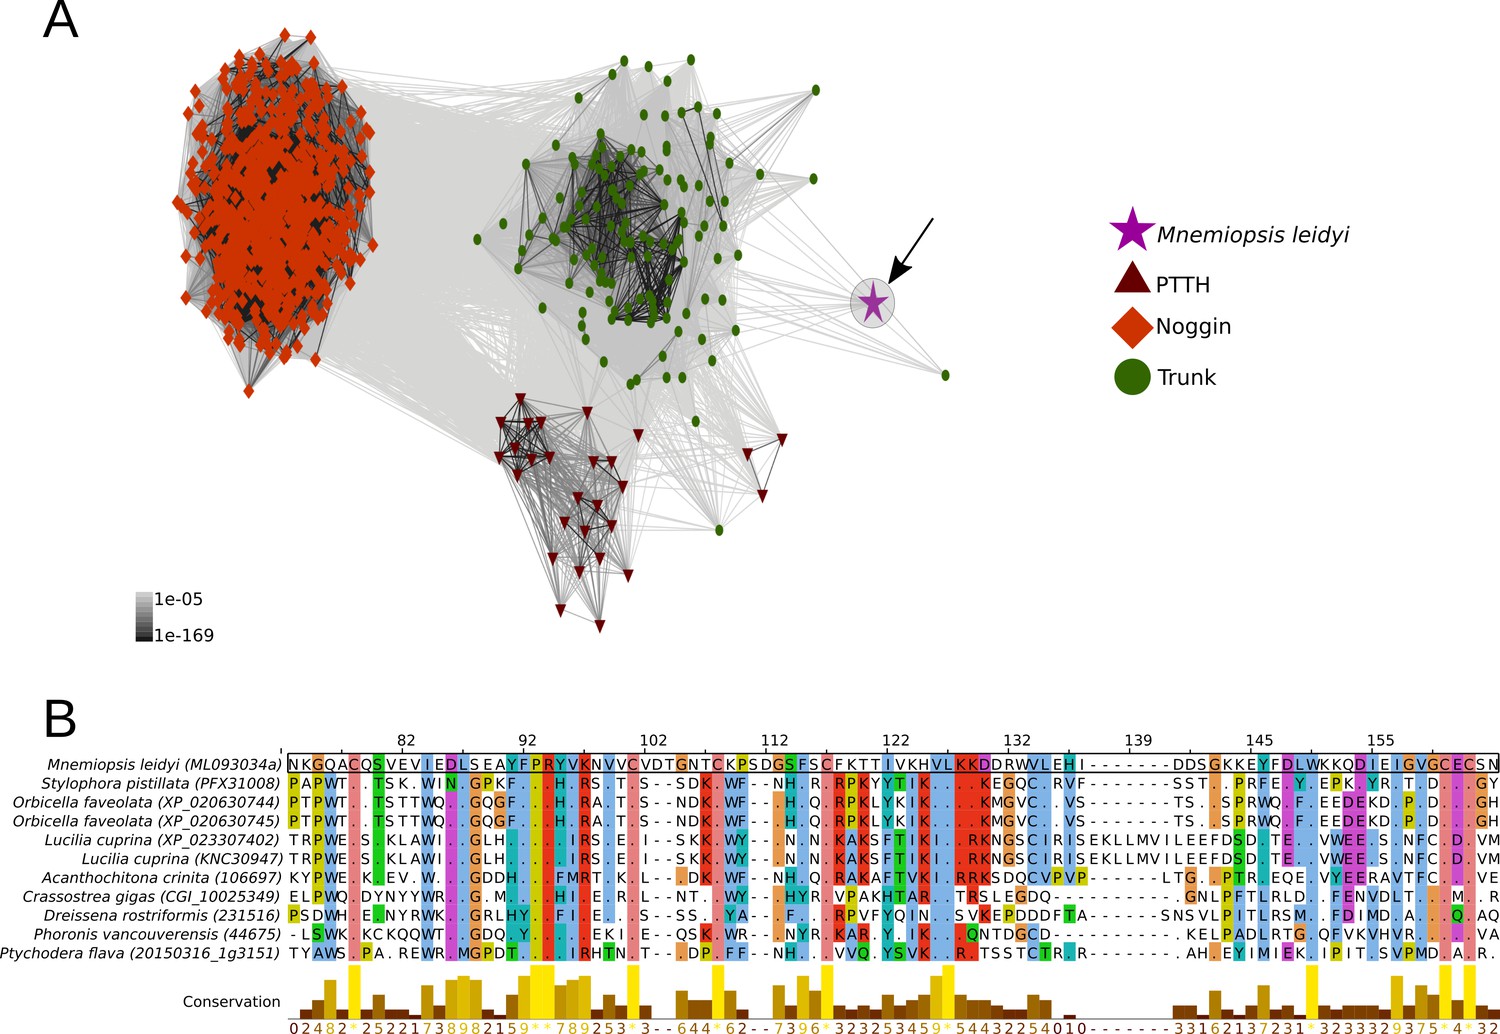
Cluster analysis of prothoracicotropic hormone (ptth), trunk, noggin orthologs and multiple sequence alignment of the ctenophore trunk-like peptide and the metazoan ortholog sequences.
(A) 2D cluster map of ptth, trunk and noggin genes. Red triangles correspond to ptth homologs, green parallelograms correspond to noggin homologs and red circles correspond to trunk homologs. The ctenophore trunk gene sequence is represented by the pink star. Edges represent BLAST connections of P value > 1e-05. Note that the ctenophore trunk peptide is indirectly connected to insect PTTH sequences via transitive BLAST connections. (B) Multiple sequence alignment representation of ctenophore trunk sequence and its metazoan orthologs produced by Jalview 2 (Waterhouse et al., 2009). Only the sequences directly connected to the ctenophore sequence in the 2D cluster map are included in the multiple sequence alignment. The conservation histogram corresponds to the number of conserved amino acid physico-chemical properties for each column of the alignment.
-
Figure 3—source data 1
Ctenophore trunk cluster peptide map.
Compressed. zip file containing the 3D-cluster map of ptth, trunk and noggin orthologs in. rtf format. he 3D cluster peptide map can be visualised and manipulated using the program clans (Frickey and Lupas, 2004a; see ftp://ftp.tuebingen.mpg.de/pub/protevo/CLANS/).
- https://doi.org/10.7554/eLife.46113.017
Figure 4

Distribution of the arthropod peptidergic system components throughout Metazoa.
(A) Simplified phylogeny of Metazoa with Porifera as the most basally branching clade (adapted from Dunn et al., 2014) showing the origin of the trunk/PTTH, eclosion-hormone (EH), bursicon, crustacean cardioactive peptide (CCAP) and ecdysis-triggering hormone (ETH) peptigergic systems. (B) Distribution of the arthropod peptigerdic system components within Panarthropoda. Secondary losses are depicted by the red crosses followed by the name of the peptide system absent in the lineage. Note that ETH and bursicon, two vital components underlying moulting in insects, were possibly secondarily lost in the Onychophora and Tardigrada (indicated by the red cross), respectively. Genomic and transcriptomic homology searches within the Kinorhyncha, Priapulida and Loricifera (condensed into the clade Scalidophora in Figure 1B) were not performed in this study (indicated by the question mark). Animal silhouettes were obtained under Public Domain licence at phylopic (http://phylopic.org/), unless otherwise indicated. Arthropoda: T. Michael Keesey after Ponomarenko (available for reuse under https://creativecommons.org/publicdomain/zero/1.0/); Onychophora: Noah Schlottman, photo by Adam G. Clause (available for reuse under https://creativecommons.org/licenses/by-sa/3.0/); Tardigrada: Fernando Carezzano (available for reuse under https://creativecommons.org/publicdomain/zero/1.0/); Nematoida: Mali'o Kodis, image from the Smithsonian Institution (available for reuse under https://creativecommons.org/licenses/by-nc-sa/3.0/); Scalidophora: Noah Schlottman, photo by Martin V. Sørensen (available for reuse under https://creativecommons.org/licenses/by-sa/3.0/).
Additional files
-
Supplementary file 1
List of molecular databases included in this study.
Superphylum and/or phylum of the investigated species and the online repositories for each of the databases are also listed.
- https://doi.org/10.7554/eLife.46113.019
-
Transparent reporting form
- https://doi.org/10.7554/eLife.46113.020
Download links
A two-part list of links to download the article, or parts of the article, in various formats.
Downloads (link to download the article as PDF)
Open citations (links to open the citations from this article in various online reference manager services)
Cite this article (links to download the citations from this article in formats compatible with various reference manager tools)
Ancient origins of arthropod moulting pathway components
eLife 8:e46113.
https://doi.org/10.7554/eLife.46113


