Generation of endogenous pH-sensitive EGF receptor and its application in high-throughput screening for proteins involved in clathrin-mediated endocytosis
- University of Pittsburgh, United States
- Carnegie Mellon University, United States
- Sharp Edge Laboratories, United States
Figures
Figure 1
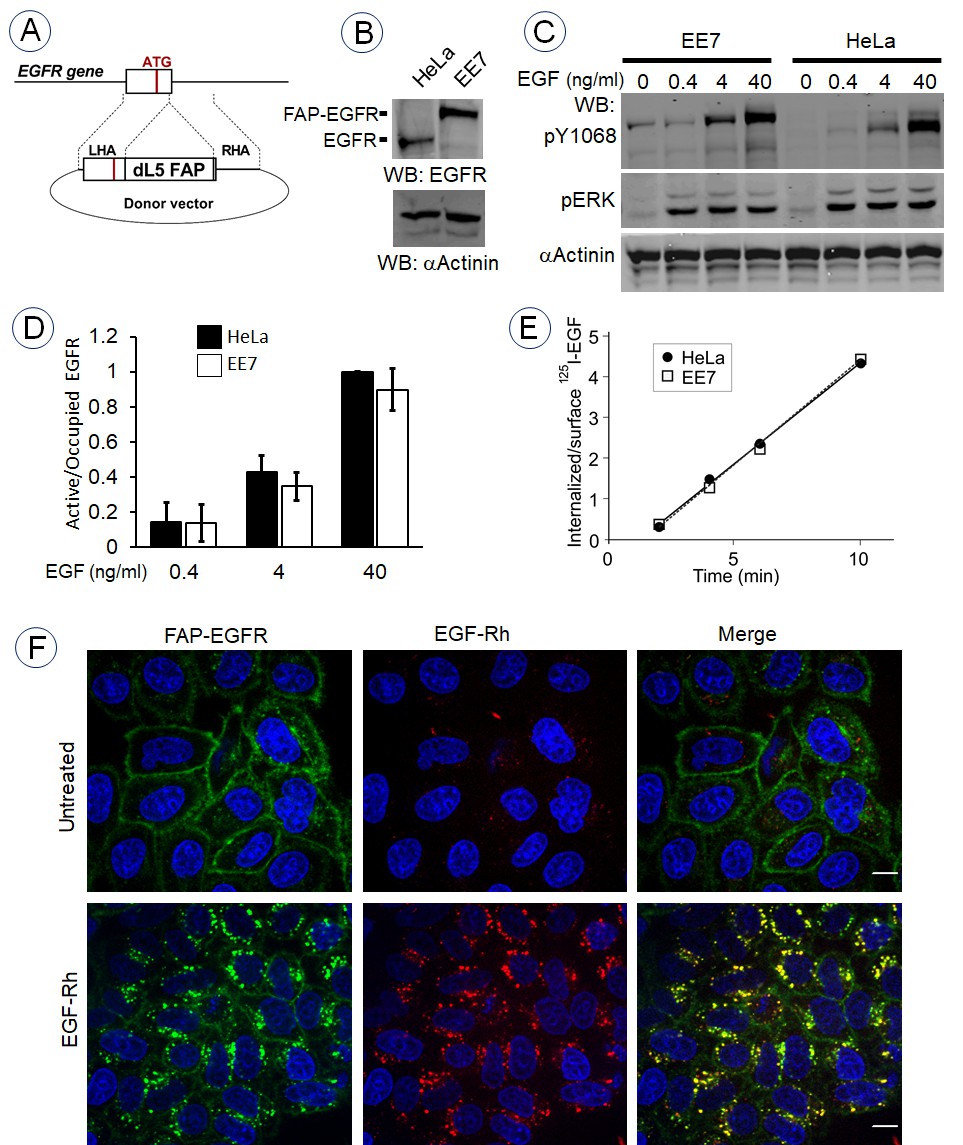
Generation and characterization of cells expressing endogenous FAP-tagged EGFR.
(A) Schematics of the gene-editing of EGFR gene by inserting the FAP dL5 sequence between the sequence encoding the signal peptide and the mature EGFR. See ‘Materials and methods’ for description of sgRNAs and a donor vector. (B) EE7 clone of HeLa cells expressing FAP-EGFR and parental HeLa cells were lysed, lysates were electrophoresed in 6% acrylamide gel, and western blot analysis was performed with the EGFR and α-actinin (loading control) antibodies. (C) Parental HeLa and EE7 cells were serum-starved and stimulated with the range of EGF concentrations for 5 min at 37°C. Lysates were probed by western blotting using indicated antibodies. (D) Quantification of western blotting images exemplified in (C). The amount of EGFR or FAP-EGFR phosphorylated at Tyr1068 was determined by normalizing the pY1068 signal by the loading control and by the amount of ligand-occupied receptors in cells determined by incubating cells with 125I-EGF under conditions identical to those used in (C). Mean values from three independent experiments are presented (± SEM). (E) Internalization rates of 1 ng/ml 125I-EGF in parental HeLa and EE7 cells were measured as described in ‘Materials and methods’. (F) Serum-starved EE7 cells were incubated for 1 min with MG-B-Tau (50 nM) and then the cells were further incubated in the absence or presence of 6 ng/ml EGF-Rh at 37°C for 15 min. Imaging was performed through the 561 nm (red, EGF-Rh) and 640 nm channels (green, MG-B-Tau). Nuclei were stained with Hoechst 33342 (blue). Scale bar, 10 μm.
Figure 2
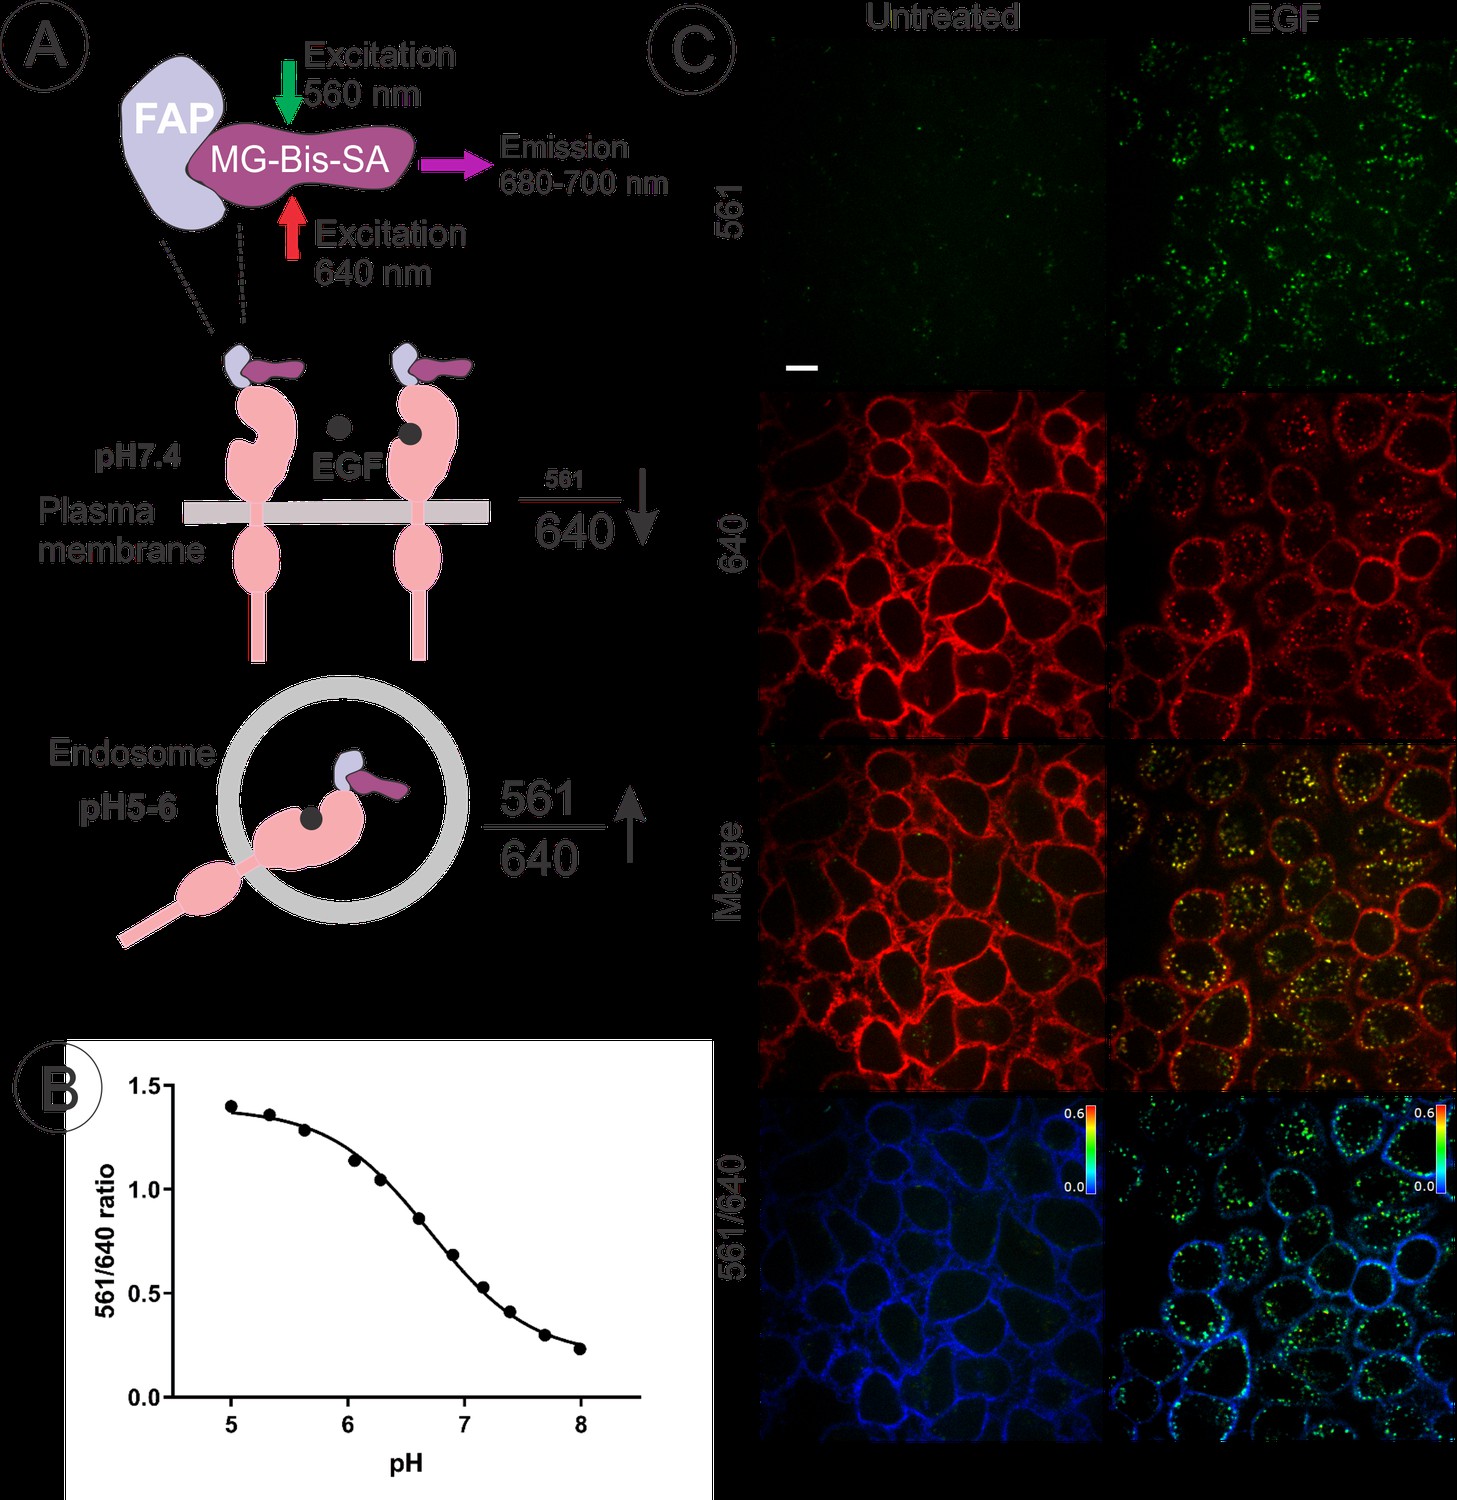
Quantitative analysis of FAP-EGFR endocytosis in EE7 cells.
(A) The basis of the pH dependence of the 561/640 ratio of the fluorescence emission of MG-Bis-SA bound to FAP-EGFR and its use to measure the amount of FAP-EGFR in endosomes. Far-red emission of MG-Bis-SA results from the direct excitation at 640 nm (independent of pH) and the excitation of Cy3 at 561 nm and energy transfer to MG (dependent on pH and high at low pH). (B) pH dependence of the 561/640 ratio measured by labeling of surface-exposed FAP-EGFR in EE7 cells grown in 96-well plates with MG-Bis-SA and conducting fluorescence measurements in a series of buffers with different pH. Each data point is a mean of 7 wells (±S.D.) (C) An example of EGF-induced internalization of FAP-EGFR visualized using dual-excitation MG-Bis-SA imaging. EE7 cells were serum-starved and incubated with MG-Bis-SA (100 nM in DMEM) for 1 min, and then with 4 ng/ml EGF for 15 min at 37°C. 3-D live-cell imaging through the FRET channel (green, excitation 561 nm; emission 680 nm) and the 640 nm channel (red, excitation 640 nm; emission 680 nm) was performed. Individual confocal sections through the middle of the cells are presented. The 561/640 ratio image is presented as pseudocolored image modulated to the intensity of the 640 nm channel. All fluorescence intensities scales are identical between untreated and EGF-treated cells. Scale bar, 10 μm.
Figure 3

Time-course, dose-dependence and receptor-kinase-dependence of FAP-EGFR endocytosis.
(A) Time-course of the 561/640 ratio measured in serum-starved EE7 cells grown in 96-well plates. The cells were labeled with MG-Bis-SA and incubated with 1, 4 or 20 ng/ml EGF at 37°C. The 561/640 ratio was measured as described in ‘Material and methods’. (B) To test the robustness of the assay at physiologically relevant EGF concentrations, we calculated the Z’-factor from the assay run with half a plate run as control and the other half with the addition of 1, 2 or 4 ng/ml EGF. The Z’-factor was calculated to be 0.76–0.88, indicating the high robustness of the assay. (C) EE7 cells grown in 96-well plates were serum-starved, incubated with vehicle (DMSO) or PD158780 (50 nM) for 30 min, labeled with MG-Bis-SA and further incubated with the range of EGF concentrations for 15 min at 37°C in the same media. The 561/640 ratio was measured as described in ‘Material and methods’.
Figure 4

Screening a human phosphatase siRNA library for effects on FAP-EGFR internalization.
(A) Each 96-well plate contained 80 siRNA pools targeting different phosphatases as well as eight negative control wells with non-targeted siRNA and four positive control wells each with siRNA targeting either clathrin heavy chain (CHC) or dynamin-2. Three plates covered the entire siRNA library of 240 phosphatases. (B) An example of the typical data resulting from this screen. EE7 cells were labeled with MG-Bis-SA and incubated with 1 ng/ml EGF for 15 min at 37°C followed by ratiometric imaging as described in ‘Materials and methods’. In the top panel, green is the signal from 561 nm excitation (FRET) and red is the signal from 640 nm excitation (MG) and as expected, a clear difference is seen between negative control wells and wells with knockdown of clathrin heavy chain or dynamin-2. The heatmap (bottom image) shows the calculated 561/640 ratio. (C) Summarized results from siRNA screening presented as a dual-flashlight plot. For each well, the average log2 fold change in the 561/640 emission ratio from the median of the negative controls of three independent screen repeats is plotted versus the strictly-standardized mean of the difference (SSMD). See Figure 4—source data 1 for all values of the 561/640 ratio and SSMD obtained in three rounds of screening.
-
Figure 4—source data 1
The data obtained in three independent screenings of the phosphatase siRNA library are presented.
The data are sorted by the extent of the inhibition of FAP-EGFR endocytosis (expressed as average value of the difference from median of controls (non-targeting siRNA); n = 3) from the lowest to highest values.
- https://doi.org/10.7554/eLife.46135.006
Tables
Key resources table
| Reagent type (species) or resource | Designation | Source or reference | Identifiers | Additional information |
|---|---|---|---|---|
| Gene (Homo sapiens) | EGFR | NA | Q504U8 | |
| Recombinant DNA reagent | PX459 V2.0 | Addgene | #62988 | |
| Recombinant DNA reagent | pUC18 | Thermo Fisher Scientific | SD0051 | |
| Genetic reagent (human) | Dharmacon siGENOME SMARTpool siRNA Library – Human Phosphatase | Thermo Fisher Scientific | G-003705, Lot 10161 | |
| Antibody | anti-EGFR (mouse monoclonal) | Millipore (Transduction Laboratories) | 05–104 | (1:1000) |
| Antibody | anti- pTyr1068 EGFR (mouse monoclonal) | Cell Signaling Technology | 2236 | (1:1000) |
| Antibody | anti-α-actinin (rabbit polyclonal) | Cell Signaling Technology | 3134 | (1:1000) |
| Antibody | anti-pERK1/2 (rabbit polyclonal) | Cell Signaling Technology | 9101 | (1:1000) |
| Antibody | IRDye-800 (goat anti mouse) | LI-COR | 926–32210 | (1:20000) |
| Antibody | IRDye-680 (goat anti mouse) | LI-COR | 926–32220 | (1:20000) |
| Chemical compound, drug | MG-B-Tau | Bruchez laboratory | Yan et al., 2015 | |
| Chemical compound, drug | MG-Bis-SA | Bruchez laboratory | Perkins et al., 2018b | |
| Chemical compound, drug | PD158780 | Millipore (Calbiochem) | 513035 | |
| Chemical compound, drug | human recombinant EGF | BD Bioscience | 354052 | |
| Chemical compound, drug | mouse receptor-grade EGF | Corning | 354010 | |
| Chemical compound, drug | 125-iodine, carrier free | PerkinElmer | NEZ033A | |
| Chemical compound, drug | EGF-Rhodamine | Thermo Fisher Scientific | E3481 | |
| transfected construct (human) | siRNA to Dynamin 2 (SMARTpool) | Dharmacon/Thermo Fisher Scientific | Huang et al., 2004 | |
| Transfected construct (human) | siRNA to Clathrin heavy chain (SMARTpool) | Dharmacon/Thermo Fisher Scientific | Huang et al., 2004 | |
| Cell line (human) | HeLa | ATCC | CCL-2 | |
| Sofware | SlideBook6 | Intelligent-imaging Innovations, Inc | NA | |
| Sofware | Image Studio Lite | Li-COR, Inc | NA | |
| Software | NIS Elements | Nikon | NA |
Additional files
-
Transparent reporting form
- https://doi.org/10.7554/eLife.46135.007
Download links
A two-part list of links to download the article, or parts of the article, in various formats.
Downloads (link to download the article as PDF)
Open citations (links to open the citations from this article in various online reference manager services)
Cite this article (links to download the citations from this article in formats compatible with various reference manager tools)
Generation of endogenous pH-sensitive EGF receptor and its application in high-throughput screening for proteins involved in clathrin-mediated endocytosis
eLife 8:e46135.
https://doi.org/10.7554/eLife.46135


