Trans-toxin ion-sensitivity of charybdotoxin-blocked potassium-channels reveals unbinding transitional states
- Universidad de Valparaíso, Chile
- Universidad de Talca, Chile
Figures
Figure 1
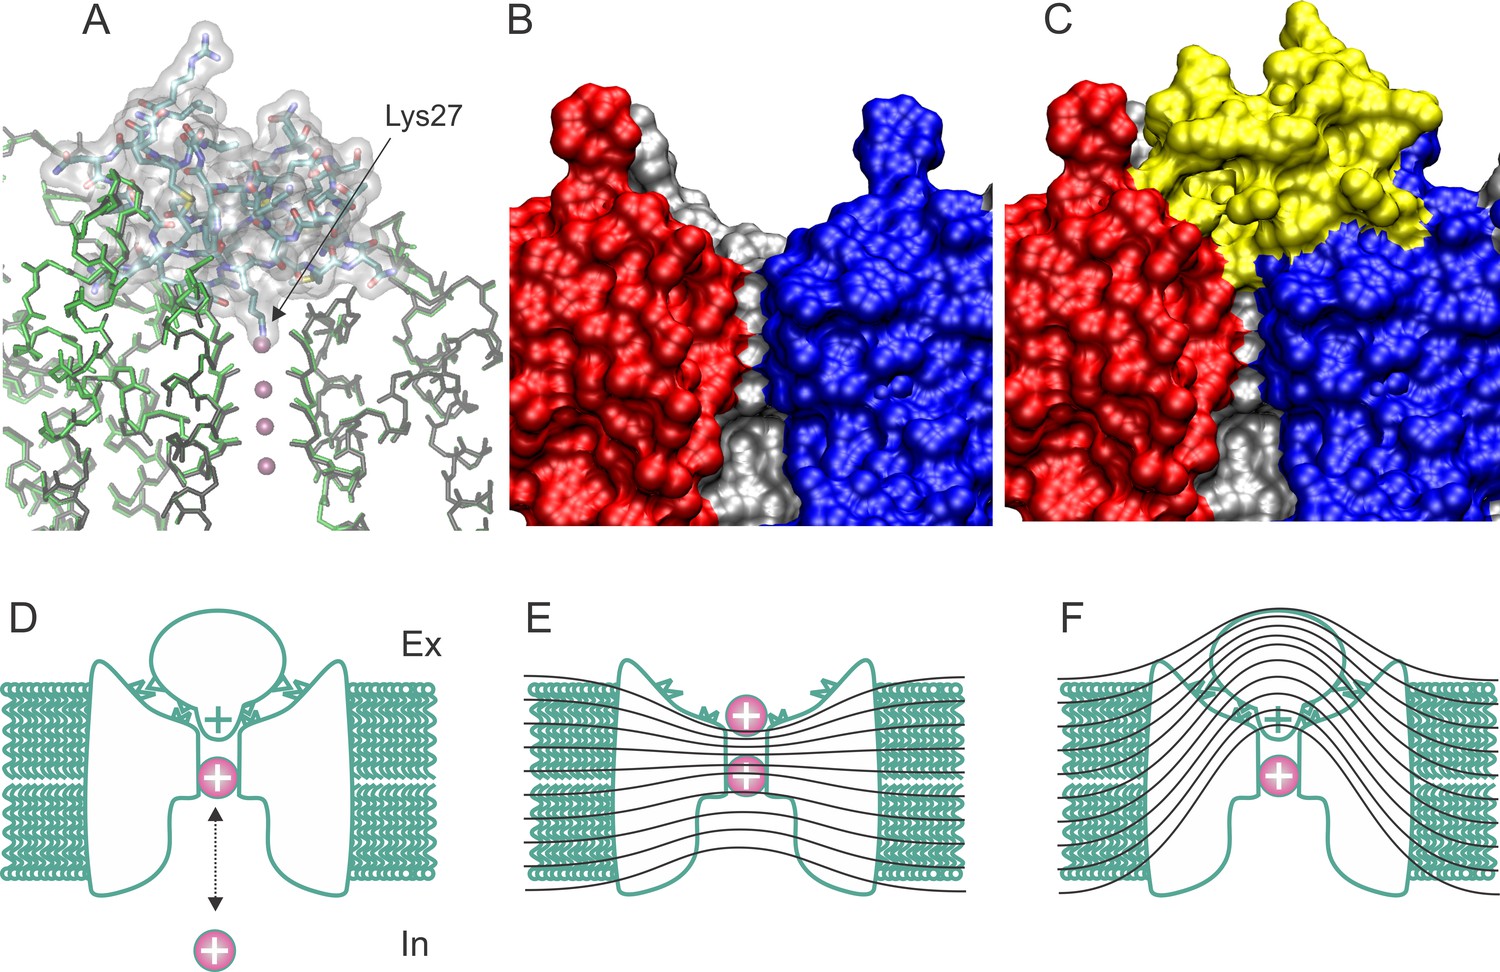
Structure and blockade mechanism of the complex CTX/Kv1.2–2.1 paddle chimera.
(A) Superposition of the blocked and unblocked pore domain Kv-channel structures (PDB:4JTA and 2R9R, respectively). CTX is represented as a transparent surface with the Lys27 ε-amino group occupying the most external ion binding site (S1). Meanwhile both channel backbones are in stick representations (brown for 4JTA and green for 4R9R). Front and back subunits were omitted for clarity. The large superposition of both backbones indicates that the conformational effects of toxin binding are minimal. (B–C) Toxin and channel surfaces are complementary and tight. Surface representation of three pore domains of the blocked Kv-channel (back, left and right) without CTX (B) and with CTX (yellow surface). Note that the external ion binding site is not empty in the toxin bound structure. (D) Cartoon representation of CTX plugging the pore at the external end of the Kv-channel (inspired from MacKinnon and Miller, 1988). The selectivity filter is in equilibrium with internal K+ ions, and its occupation repels the bound toxin. (E) Schematic cartoon of the drop of the electric field along the pore of conductive channels and its alteration in the toxin blocked channel (F), such that some permeant ions movements do not cross the electric field. Lines represent iso-potential curves.
Figure 2
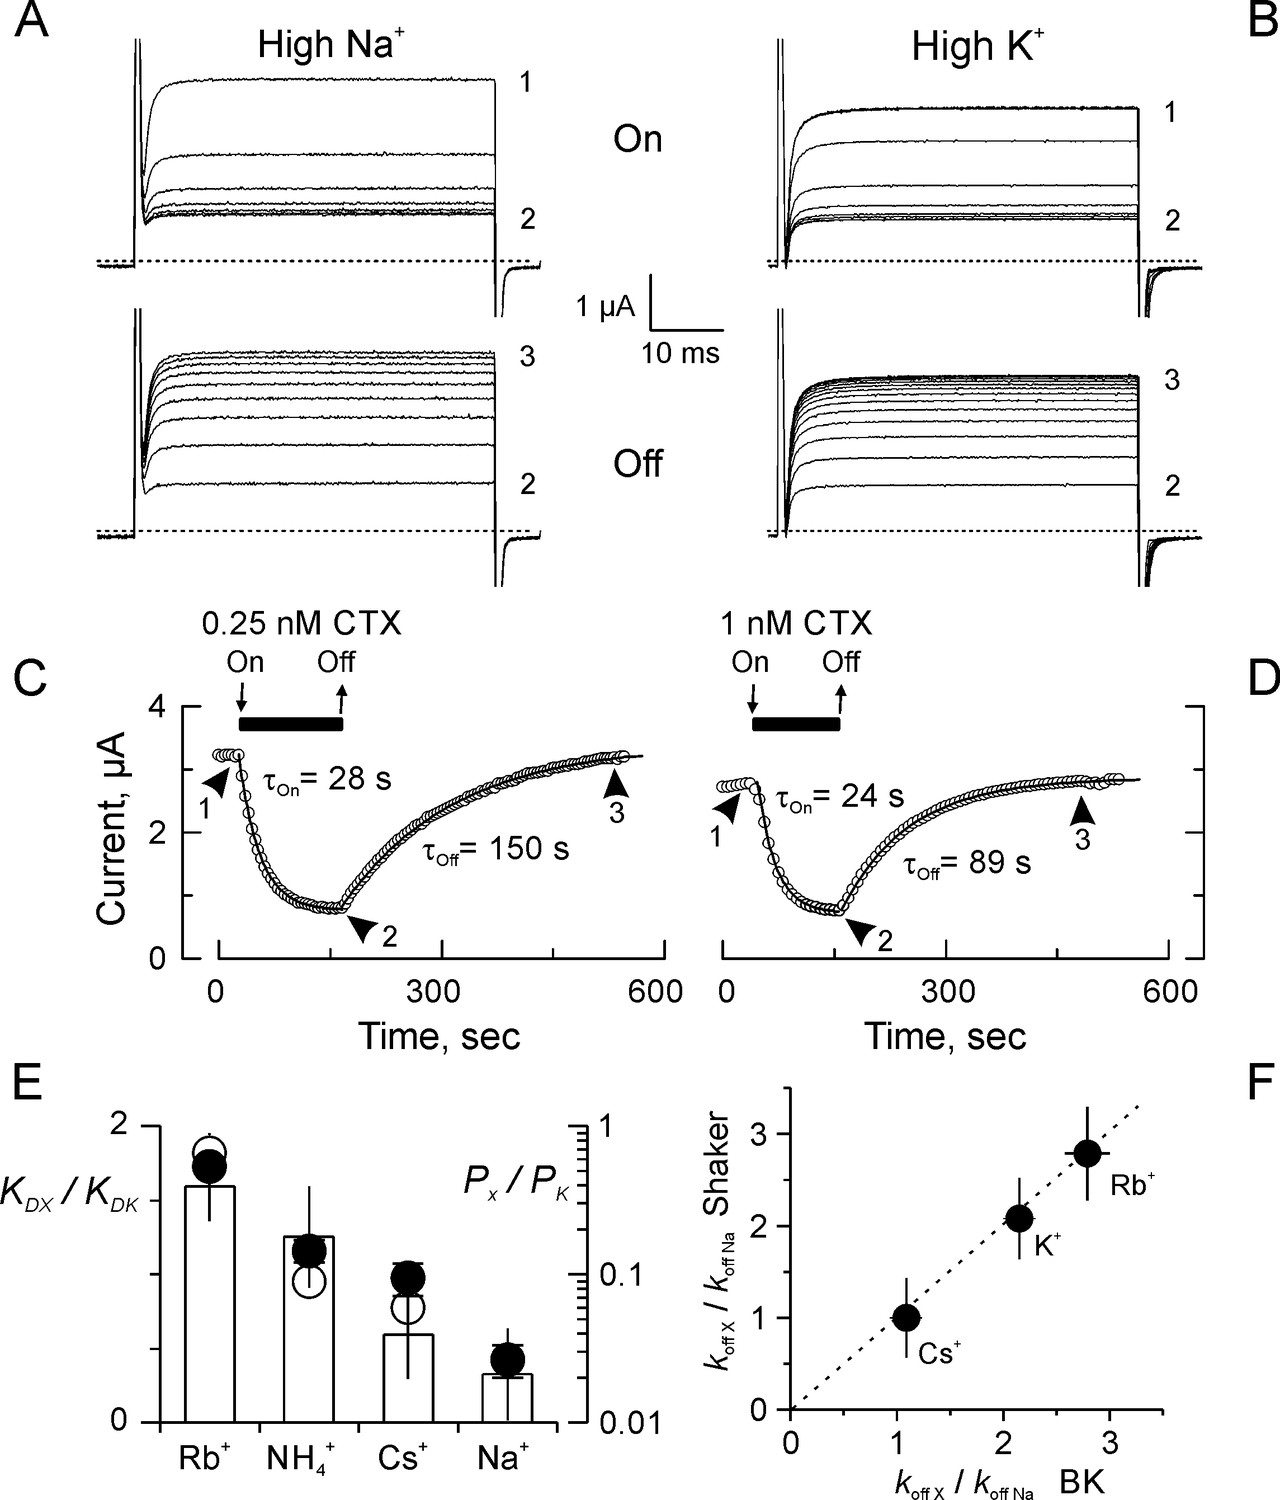
Kinetics and ion selectivity of CTX binding to Shaker-F425G channels in ‘High Na+’ and ‘High K+”.
(A–B) Application (Upper panel; ‘On’) and removal (Lower panel; ‘Off’) of CTX in High Na+ (A) or High K+ (B) recording solutions. To watch the progress of the perfusion, current traces elicited by 50 ms/50 mV voltage pulses applied every 3 s. Traces marked 1, 2 and 3 were taken: before toxin application, before removal, and at the end of the recovery, respectively. (C–D) Time course of the inhibition and recovery in High Na+ (C) or High K+ (D) recording solutions. CTX application is marked by the black bar on top of the time-course plot. Each point is the average current-amplitude in the last 10 ms of each trace. The ‘On’ and ‘Off’ phases of the experiments were fitted to a single exponential function, and the time constant for each fit is written near each time course. (E) Ion selectivity of the dissociation enhancement site. The KD relative to ‘High K+’ (white bars) were obtained measuring inhibition when the main external ion was the test ion (See Materials and methods). Each value corresponds to the average (± SEM) of 3 to 7 oocytes). For comparison, the relative selectivity ratios for permeation in bi-ionic from are plotted in log scale, according to Díaz-Franulic et al. (2015), filled circles, and to Heginbotham and MacKinnon (1993), open circles. (F) Ion dependent dissociation enhancements, relative to control (High Na+) external solution (koff X/koff Na), is near identical to the effect of internal cations in the dissociation of CTX from BK-channels reconstituted in lipid bilayers (MacKinnon and Miller, 1988). The discontinuous straight line has a slope of 1.
Figure 3
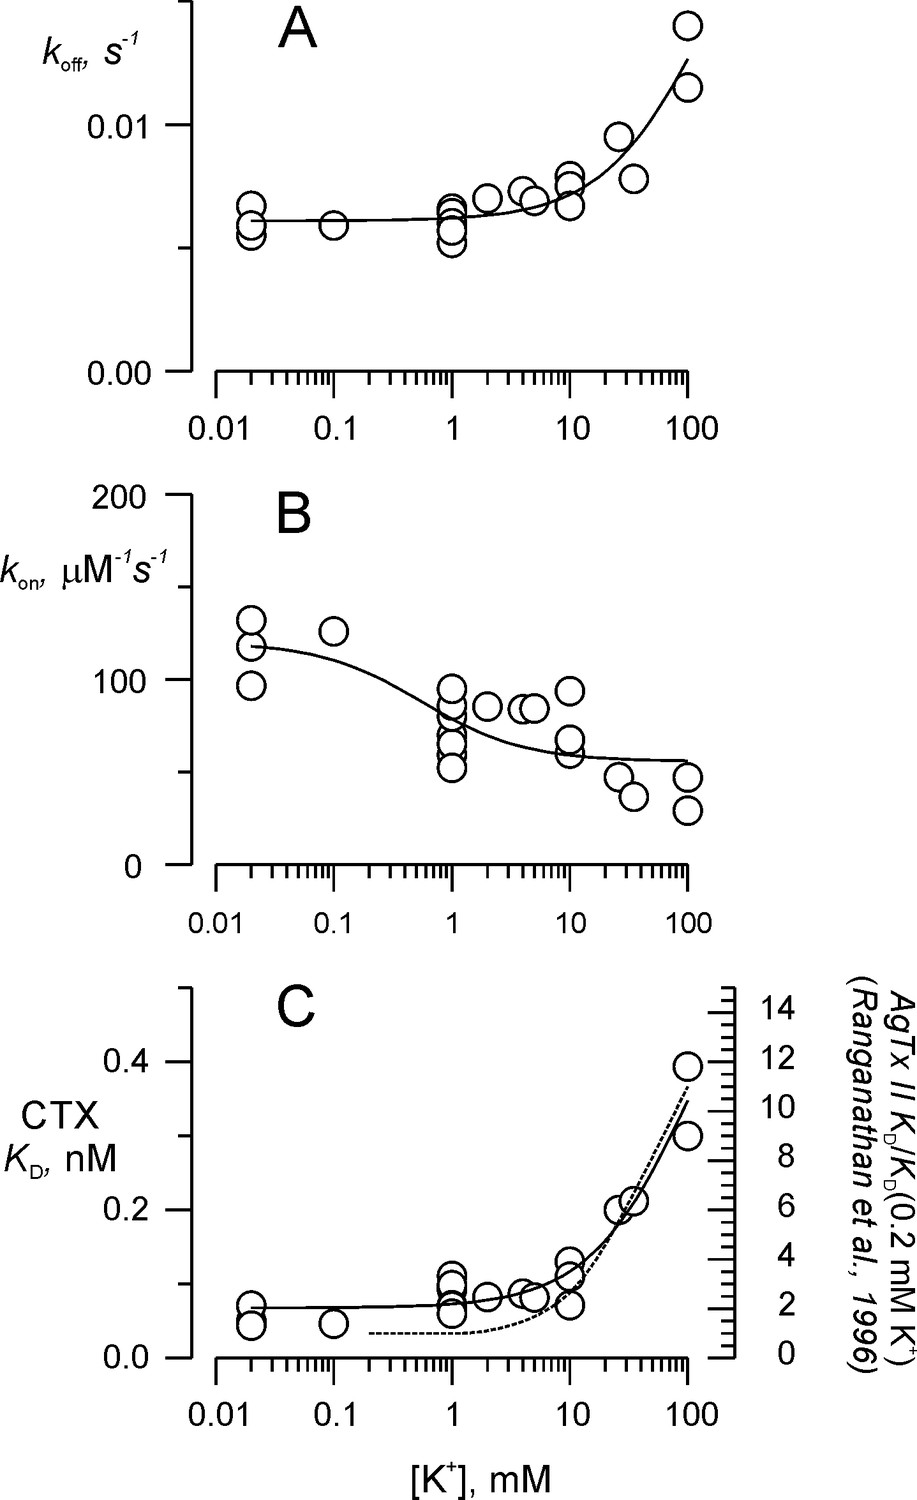
Potassium titration of the toxin dissociation enhancement site.
(A) Potassium dependency of the dissociation rate, koff, (B) association rate, kon, and (C) dissociation constant, KD. To compare with Ranganathan et al. (1996), we show in (C) the fit of Equation 2a (solid line), in which KD replaces koff, KD0 replaces koff0 and KDK replaces koffK. Fit parameters were (± SE), KD0 = 0.068 ± 0.008 nM, KDK = 0.65 ± 0.18 nM, with KK1 = 108 ± 60 mM. For comparison, the dashed line on C represents AgTx II - KD as function of external K+ from Ranganathan et al. (1996). Values are individual experiments.
Figure 4
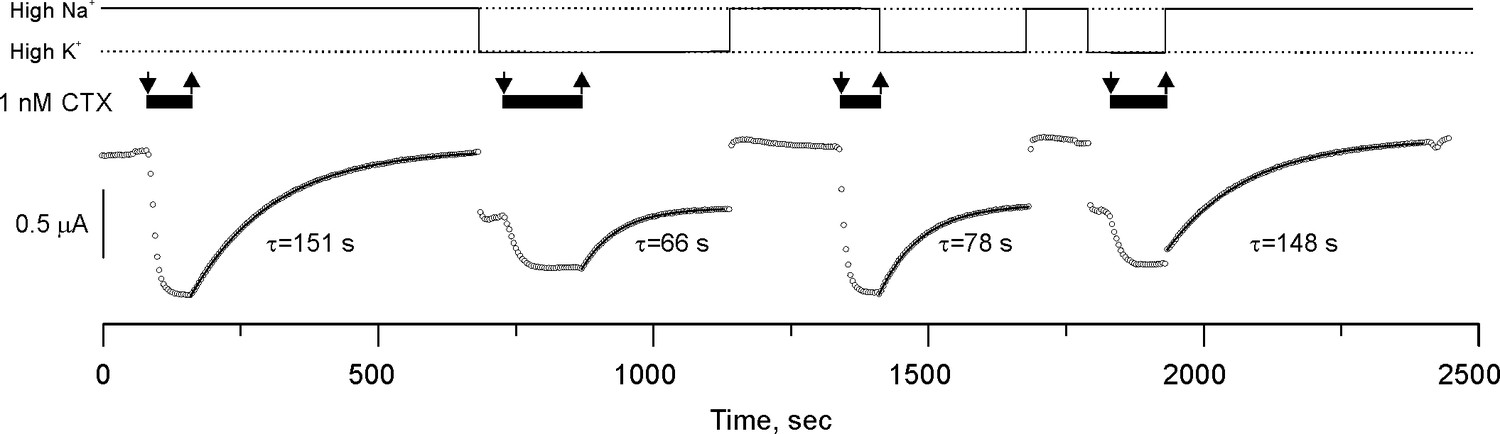
CTX blockade of Shaker-F425G has no memory.
Potassium currents from an oocyte perfused with solutions having 1 nM CTX (black bars on top of the traces) in alternating High K+ or High Na+ conditions (continuous line on top of the figure). The sudden changes of current amplitude correspond to the changes in the potassium driving force produced by the High K+/Low K+ solution exchange. Toxin application occurred in these two recording solutions and recovery was also in either High K+ or Low K+. Toxin dissociation time courses were fit to a single exponential function (the time constants are below each curve). Note that the rate of recovery was solely specified by the ionic composition of the solution being perfused, indicating that binding retains no memory of the ionic composition at the instant of blockade. We performed three more high-Na/high-K experiments with similar results (see data repository).
Figure 5
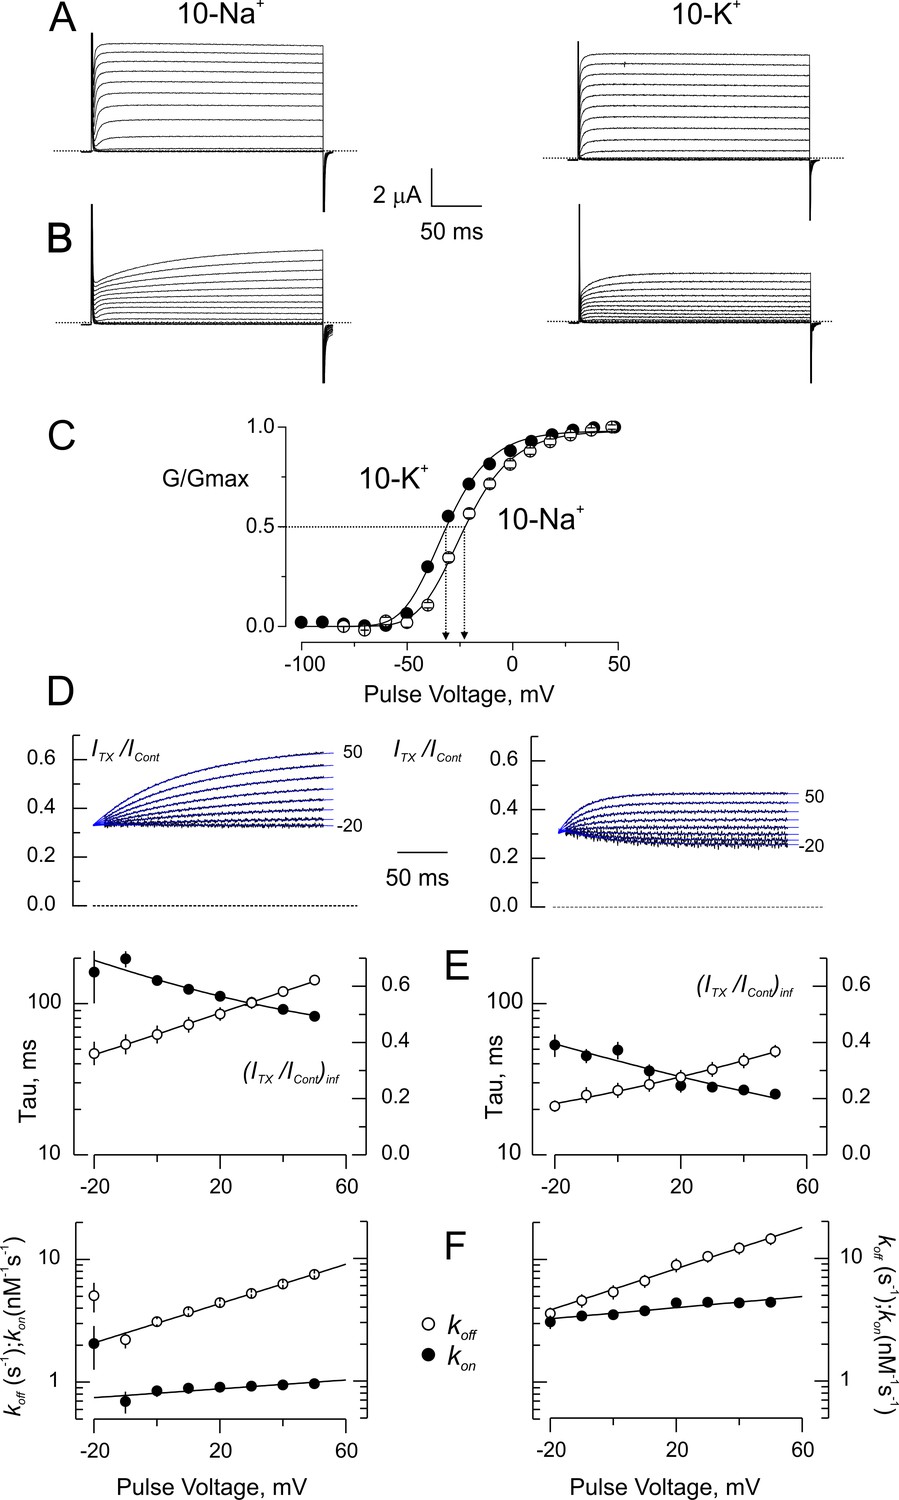
Blockade of wild type-Shaker by CTX in low ionic strength.
(A) Potassium currents from the same oocyte recorded in external solutions in which the main cation is ~ 10 mM Na+ (10 Na+; left) or ~ 10 mM K+ (10 K+; left). (B) Same oocytes as in A, in the presence of 5 nM CTX. The time course of the currents appears as a delayed channel activation (C). Relative conductance (G/Gmax) vs. Voltage in low ionic strength. Data points are average of 5 different experiments in 10-Na+ (open circles) and 10-K+ (filled circles). The solid lines are fits to a Boltzmann distribution. The dashed lines indicate the approximate voltages at which G/Gmax is 0.5 (−30 and −22 mV, for 10-K+ and 10-Na+, respectively). (D) Point-by-point quotient ratios of the CTX current traces divided by the control current traces at their corresponding voltages. The blue lines are mono-exponential fits to the ratios. Note that all relaxations converge to the same point at the beginning of the pulse, pointing to the CTX inhibition at resting. (E) Fitting parameters of the traces in C. The average time constants (filled symbols) and the asymptotic, or equilibrium, inhibition at each voltage (open symbols) from five experiments each were used to calculate the association and dissociation rates. Lines have no theoretical meaning. (F) Rates constants of CTX binding to the channel calculated according to Equation 3a and 3b. The continuous lines are mono-exponential fits of the function , where F, R and T have their usual meaning. V is the applied voltage and zδ is the effective valence of the voltage dependence. For five measurements in each condition, the mean (± SEM) were: in 10 Na+, koff(V=0)=3.02 ± 0.02 s−1 with zδ=0.47 ± 0.02; kon(V=0)=812 ± 26 μM−1s−1 with zδ=0.106 ± 0.026; meanwhile in 10 K+, koff(V=0)=5.6 ± 0.16 s−1 with zδ=0.4 ± 0.016 and kon(V=0)=3572 ± 96 μM−1s−1 with zδ=0.133 ± 0.023.
Figure 6
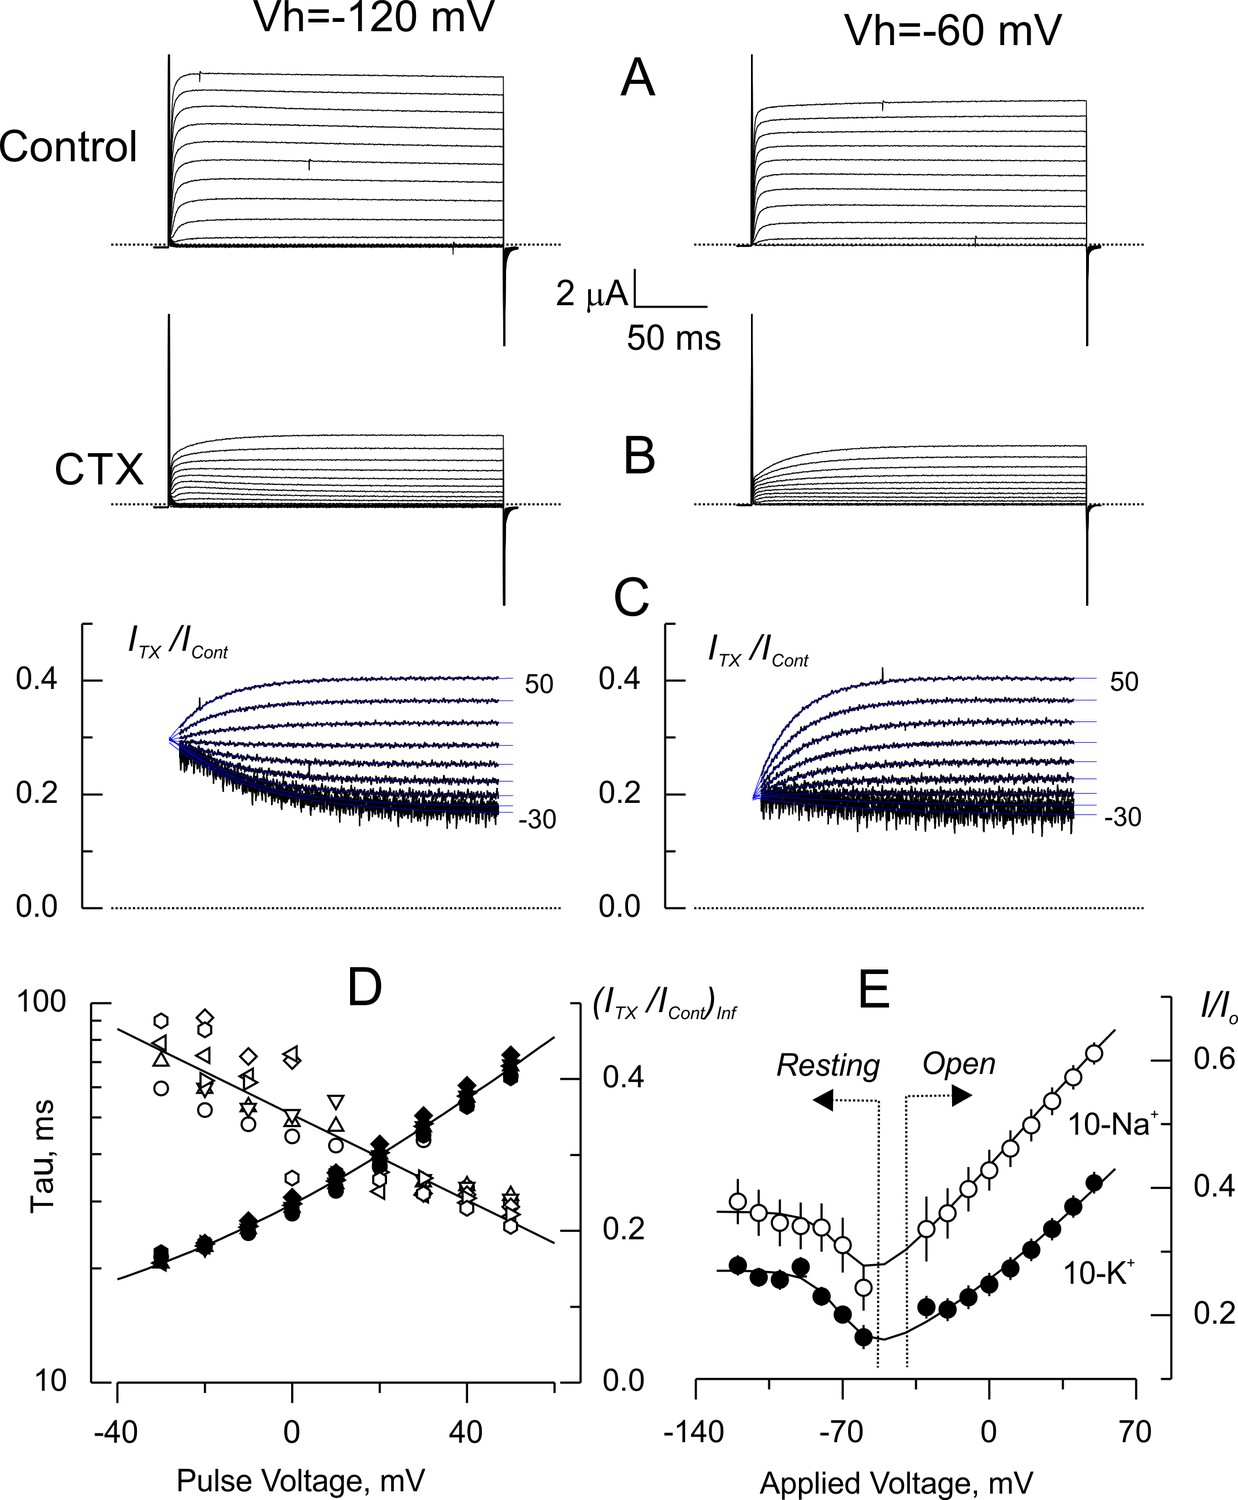
Voltage dependence of tonic CTX inhibition of wild type-Shaker.
(A) Representative recordings of potassium currents elicited from holding voltages (Vh) of −120 mV (left) and −60 mV (right) in 10 K+ solution in the same oocyte. The small reduction of currents is probably due to Shaker slow inactivation (González-Pérez et al., 2008). (B). Potassium currents elicited in the presence of 5 nM CTX. Same oocyte and Vh as in A. (C) Point-by-point quotient ratios of traces as in Figure 5. The blue traces are mono-exponential fits to the resulting relaxations within the length of the voltage pulse. Note that the CTX inhibition at resting is different between Vh= −120 and Vh= −60 mV. (D) Fitting parameters of the traces in C. The average time constants (open symbols) and equilibrium inhibition at each voltage (filled symbols) from relaxations elicited from different Vh in the same oocyte (circles: −120 mV; triangles: −120 mV; inverted triangles: −100 mV; diamonds: −90 mV; left rotated triangles: −80 mV; right rotated triangles: −70 mV; hexagons: −60 mV). The continuous lines are polynomial fits with no theoretical meaning. (E). Tonic inhibition as a function of the voltage. Resting indicates measurements made from the resting inhibition at different Vh, while Open specifies the inhibition at equilibrium from the asymptotic values of the voltage dependent relaxations as those shown in C. Each data point corresponds to average of 5 and 6 different oocytes (± SEM) for 10-Na+ and 10-K+ data, respectively. The continuous lines are fits to Equation 5 with the Levenberg-Marquardt method. To fit Equation 5 we used: where z is the toxin effective valence, and where Z is the effective valence of Kv-channel opening, Vo is the voltage at which Po = 0.5. The rest of the parameters as declared. The fit parameters (± SE) for 10-Na+ were: KDO = 3.9 ± 0.16 nM, z = 0.36 ± 0.03, Vo = −67 ± 7 mV, Z = 4.0 ± 3.1, and KDC = 2.81 ± 0.27 nM; for 10-K+ were: KDO = 1.7 ± 0.05 nM, z = 0.29 ± 0.02, Vo = −66 ± 2 mV, Z = 3.9 ± 0.89 and KDC = 1.84 ± 0.06 nM.
Scheme 1

CTX binding equilibrium to open and closed channels.
https://doi.org/10.7554/eLife.46170.008
Figure 7 with 2 supplements
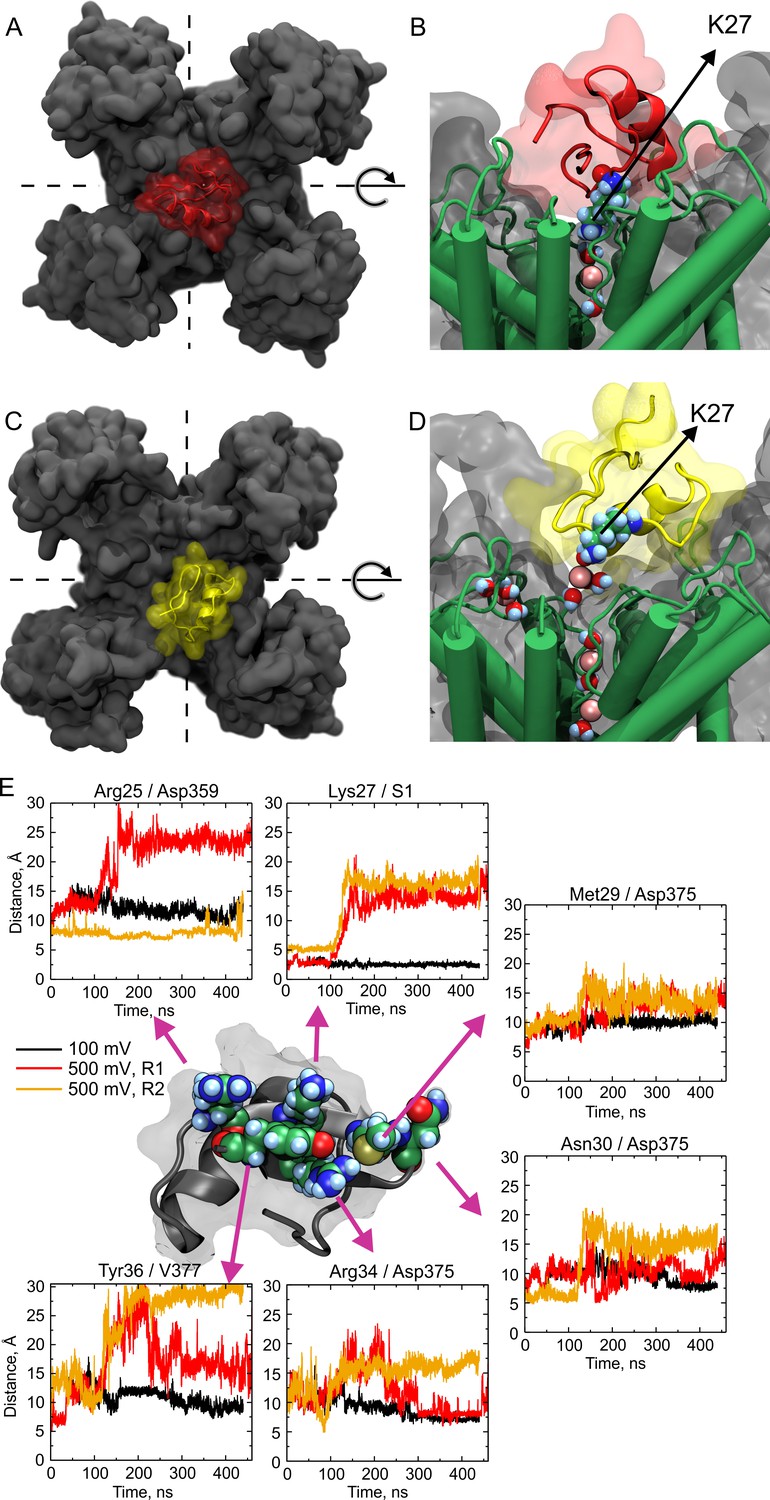
Molecular dynamics show large wobbling.
(A, B) CTX bound to the Kv-channel at the beginning of Replica 2. The toxin is attached to the vestibule and the ε-amino group of Lys27 sits in S1 replacing permeant ions in the site. (C, D) CTX bound to the Kv-channel 400 ns later. In C, CTX end up ~ 90° rotated CCW with respect to A while Lys27 amino group is elevated ~10 Å from the floor of the interaction surface; K+ ions populate the interaction surface and fill the selectivity filter vacant S1, increasing the pore occupancy. (E) Distances between sidechain contacts at the bottom of the interaction surface. The plotted values are the distances between the centers of mass of the indicated interacting sidechains, except for S1, in which the center of the site was used. CTX´s Arg25, Lys27, Met29, Asn30, Arg34, and Tyr36 are depicted as reference at the center of the figure. The Kv-channel residues were: Asp359 from chain D, Asp375 from chain B for Met29 and Asn30, and from chain A for Arg34. Val377 is from chain A. A movie showing wobbling and potassium competition with with Lys27 amino group rebinding is available on Dryad (https://doi.org/10.5061/dryad.0p77qk4).
Figure 7—figure supplement 1
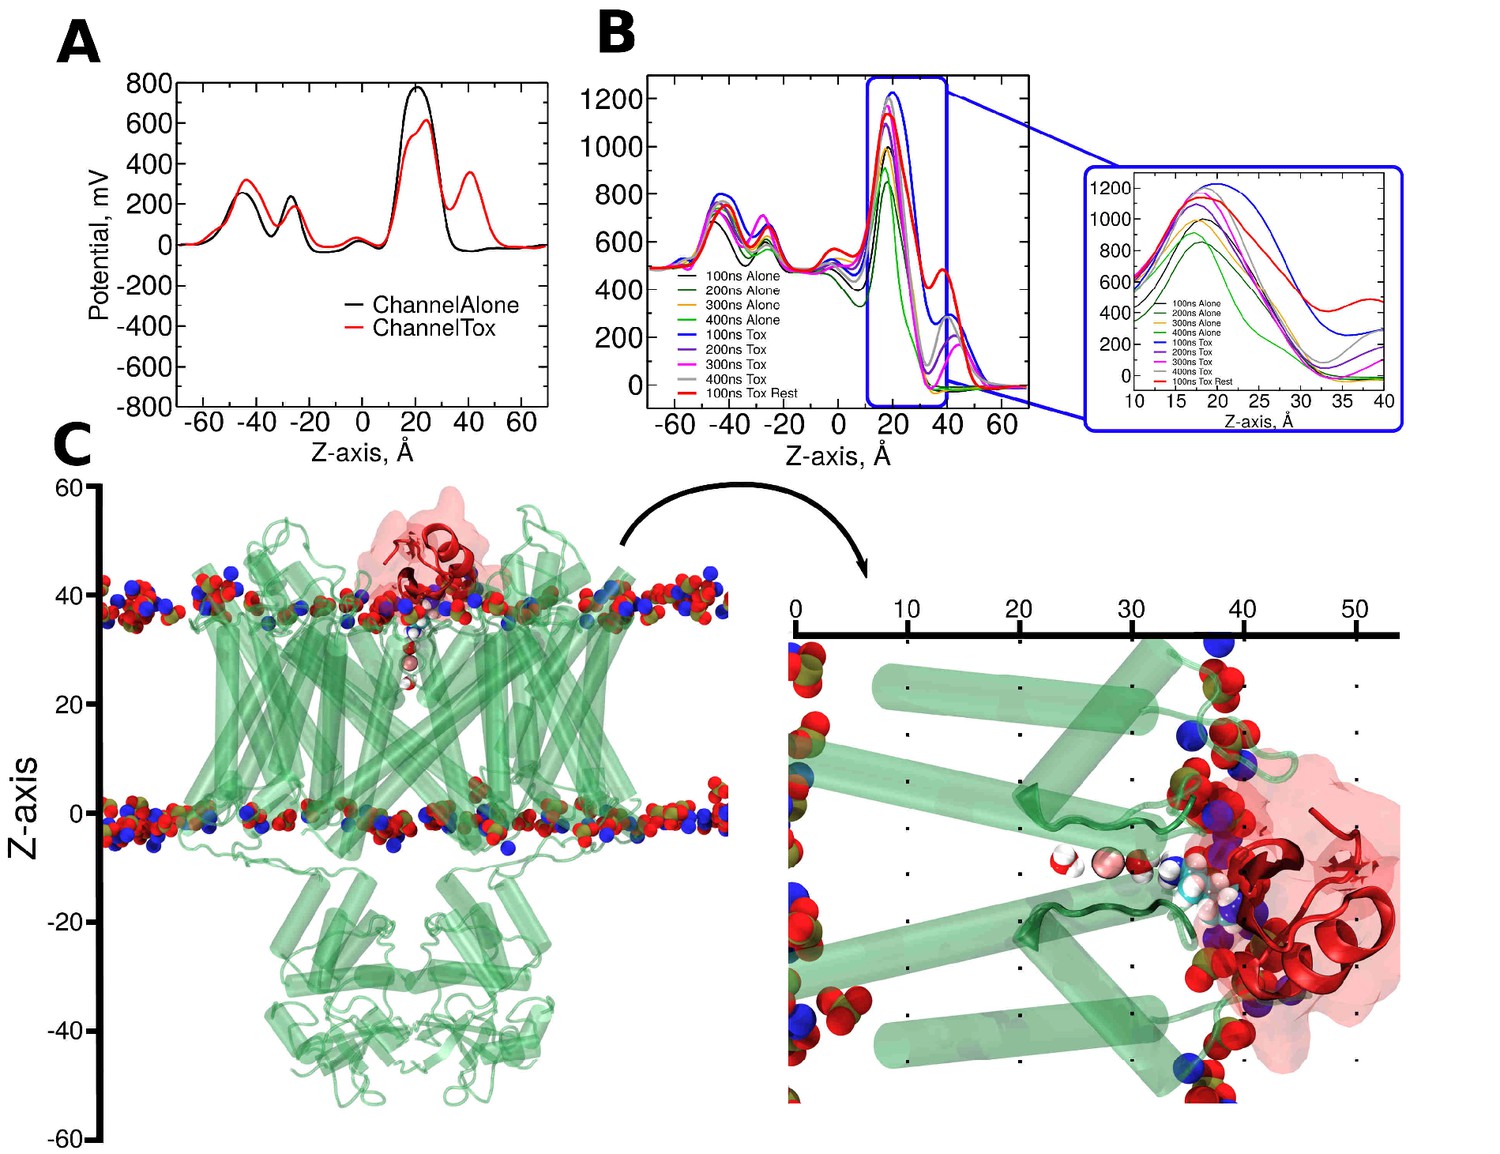
CTX binding alters the electrostatic profile along the pore.
(A) Native electrostatic profile along the z-axis in the pore in the absence (black) and presence of CTX bound to the pore (red). (B) Electrostatic profiles resulting from the application of +500 mV to the inner side of the membrane. Calculation on the simulations with (traces: black, dark-green, orange, and green) and without CTX (traces: blue, purple, pink, and gray) were averaged along non-overlapping windows of Replica 2. The red trace shows the profile on a restrained 500 mV simulation. Inset: magnification of the pore/filter sections along the z-axis. (C-Left) Representative snapshot of the channel (translucent green) bound to CTX (translucent red). Red-blue-yellow spheres represent the phospholipid head groups of the membrane. (C-right) Rotation and magnification of CTX/channel complex shows the pore (0 to ~20 Å), selectivity filter (~20 to ~35 Å) and the bound CTX (~32 to ~50 Å) regions.
Figure 7—figure supplement 2
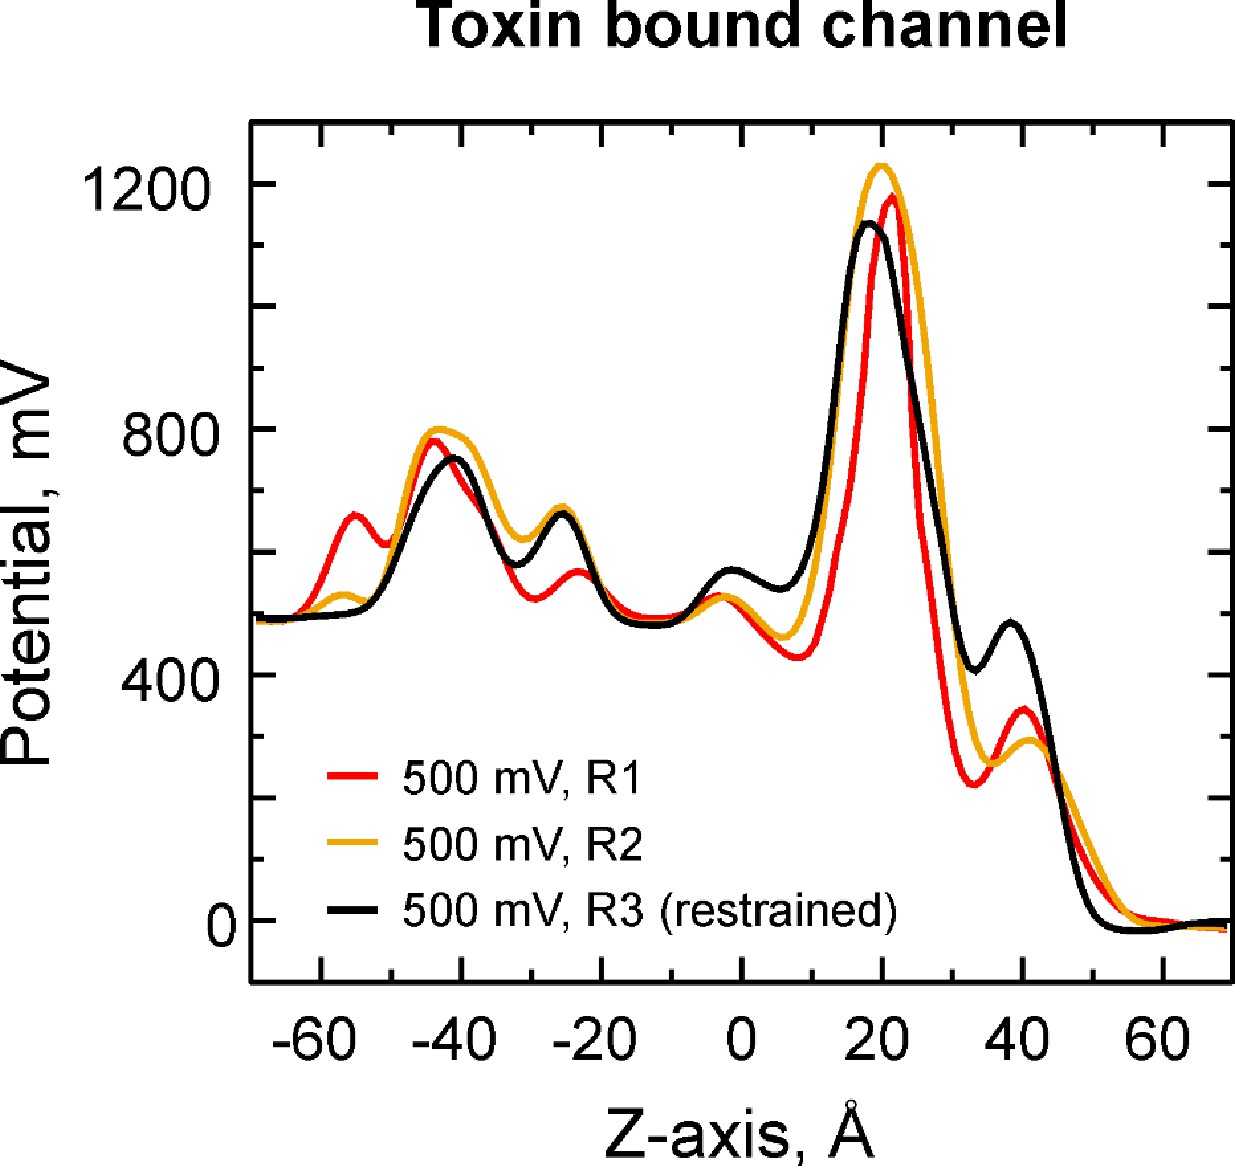
Electrostatic profiles along the pore of the Kv-channel with CTX bound in tight mode.
Traces are average electrostatic profiles of the first 100ns of simulation time in the presence of +500 mV applied to the internal side of the membrane. In both Replica 1 and 2, CTX´s Lys27 remained mostly attached to its binding site during the first 100 ns of simulation time (See Figure 7C–D, traces red and yellow, respectively). Electrostatic profiles from Replicas 1 and 2 are compared with that of Replica 3 (black trace), in which the simulation, also in the presence of + 500 mV, was run under harmonic restrains to 11 crystallographic distances separating toxin-channel contacts, including Lys27 from S1 (details in Materials and methods).
Figure 8
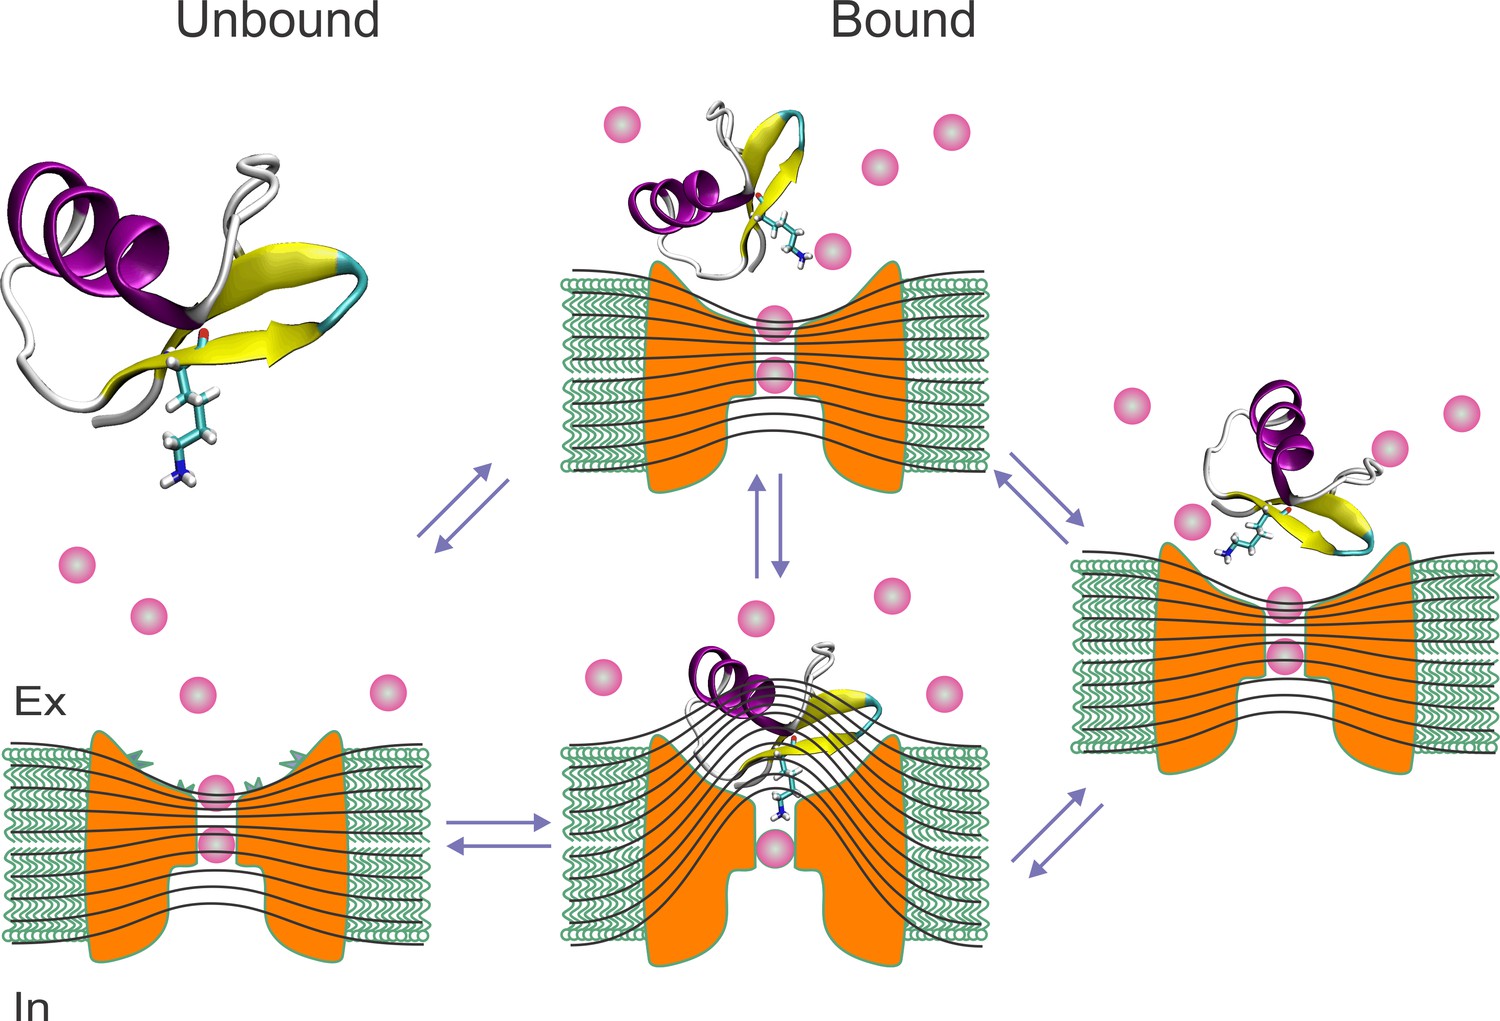
Toxin wobbling restores the concentration and the electric gradient across the pore.
(A) The bound toxin transits among different contact configurations in quasi-equilibrium. Some configurations restore the pore occupancy by permeant ions, and the trans-pore electric field, as in the unblocked channel, and may yield to the final dissociation step.
Additional files
-
Transparent reporting form
- https://doi.org/10.7554/eLife.46170.013
Download links
A two-part list of links to download the article, or parts of the article, in various formats.
Downloads (link to download the article as PDF)
Open citations (links to open the citations from this article in various online reference manager services)
Cite this article (links to download the citations from this article in formats compatible with various reference manager tools)
Trans-toxin ion-sensitivity of charybdotoxin-blocked potassium-channels reveals unbinding transitional states
eLife 8:e46170.
https://doi.org/10.7554/eLife.46170


