Family history of Alzheimer’s disease alters cognition and is modified by medical and genetic factors
- The Translational Genomics Research Institute, United States
- Arizona Alzheimer’s Consortium, United States
- Norwegian University of Science and Technology, Norway
- University of Miami, United States
- University of Arizona, United States
Figures
Figure 1 with 2 supplements
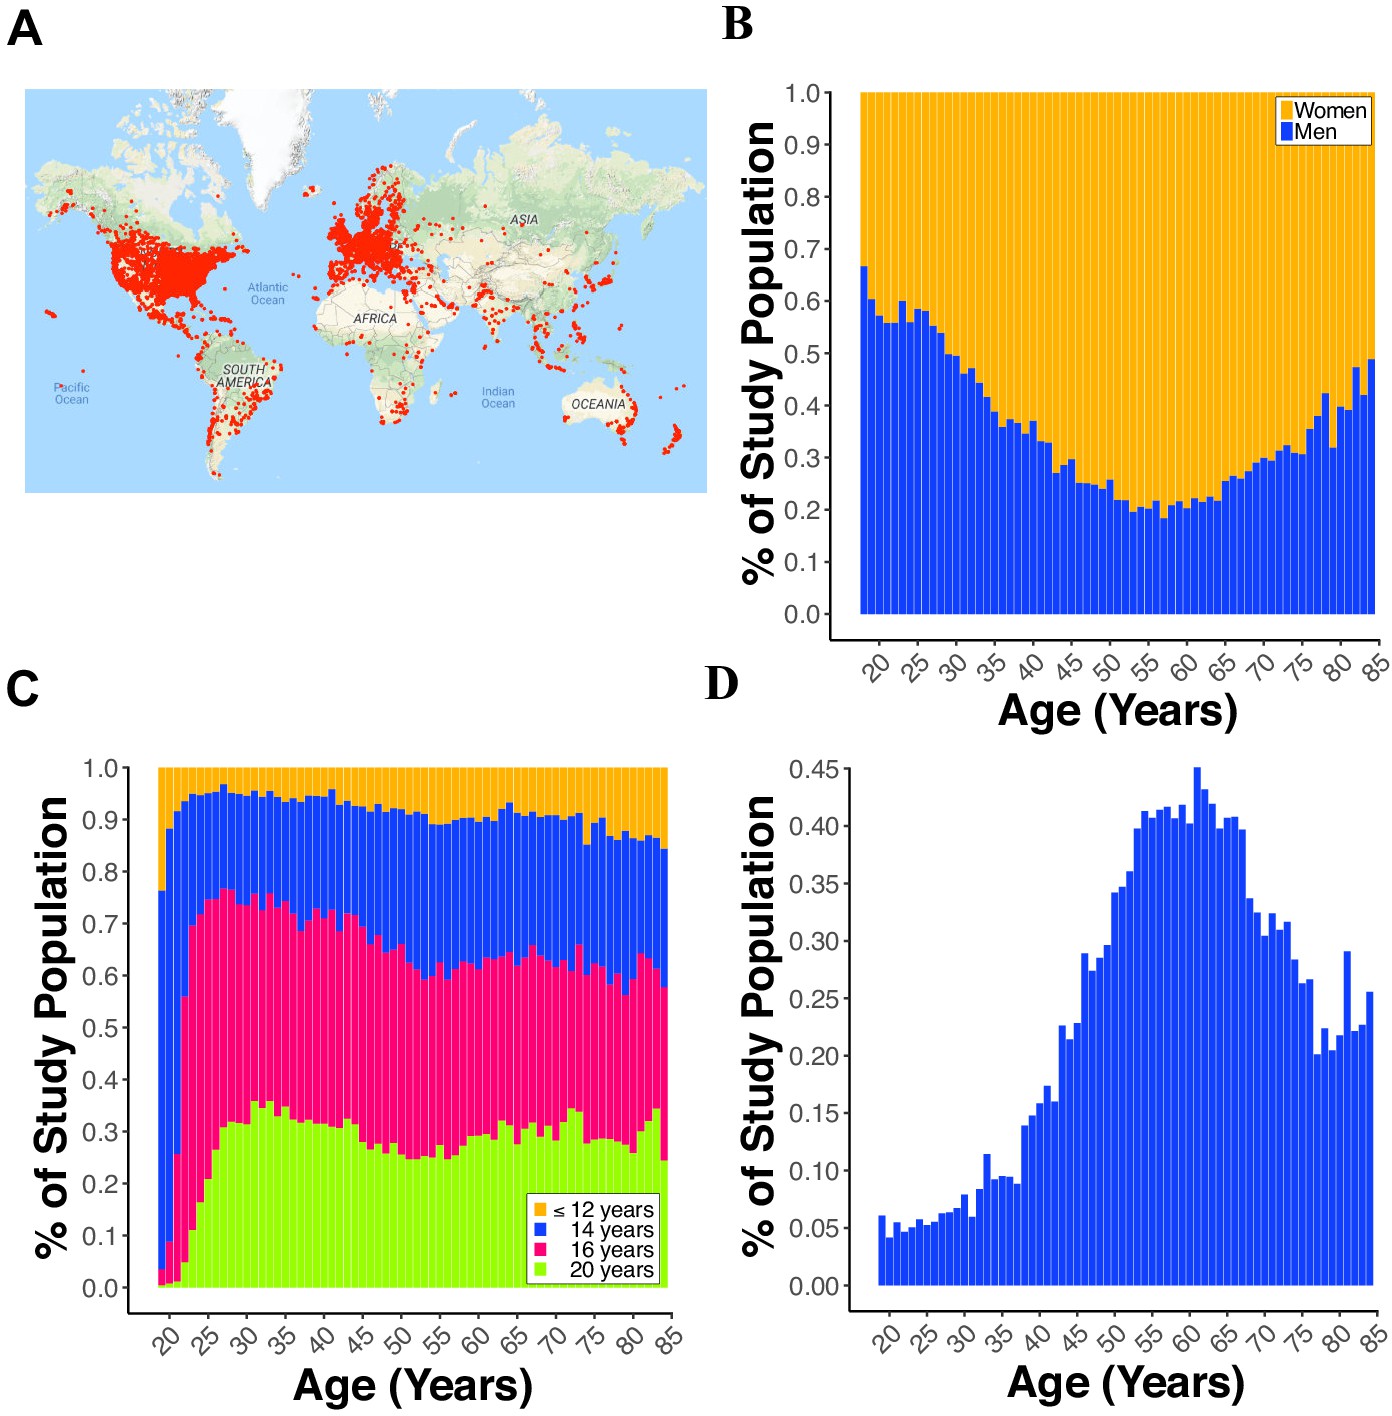
Demographics of participants.
(A) World map displaying a red dot (i.e., one dot = one IP address) at the location of a participant completing the paired-associates learning (PAL) task. (B) Line plot showing the percent of males and females from 18 to 85 years old. (C) Line plot displaying the percent of participants with 12, 14, 16, or 20 years of education for each year of age from 18 to 85 years old. (D) Line plot showing the percent of participants reporting a first-degree family history of Alzheimer’s disease (FH) for each year of age from 18 to 85 years old.
Figure 1—figure supplement 1
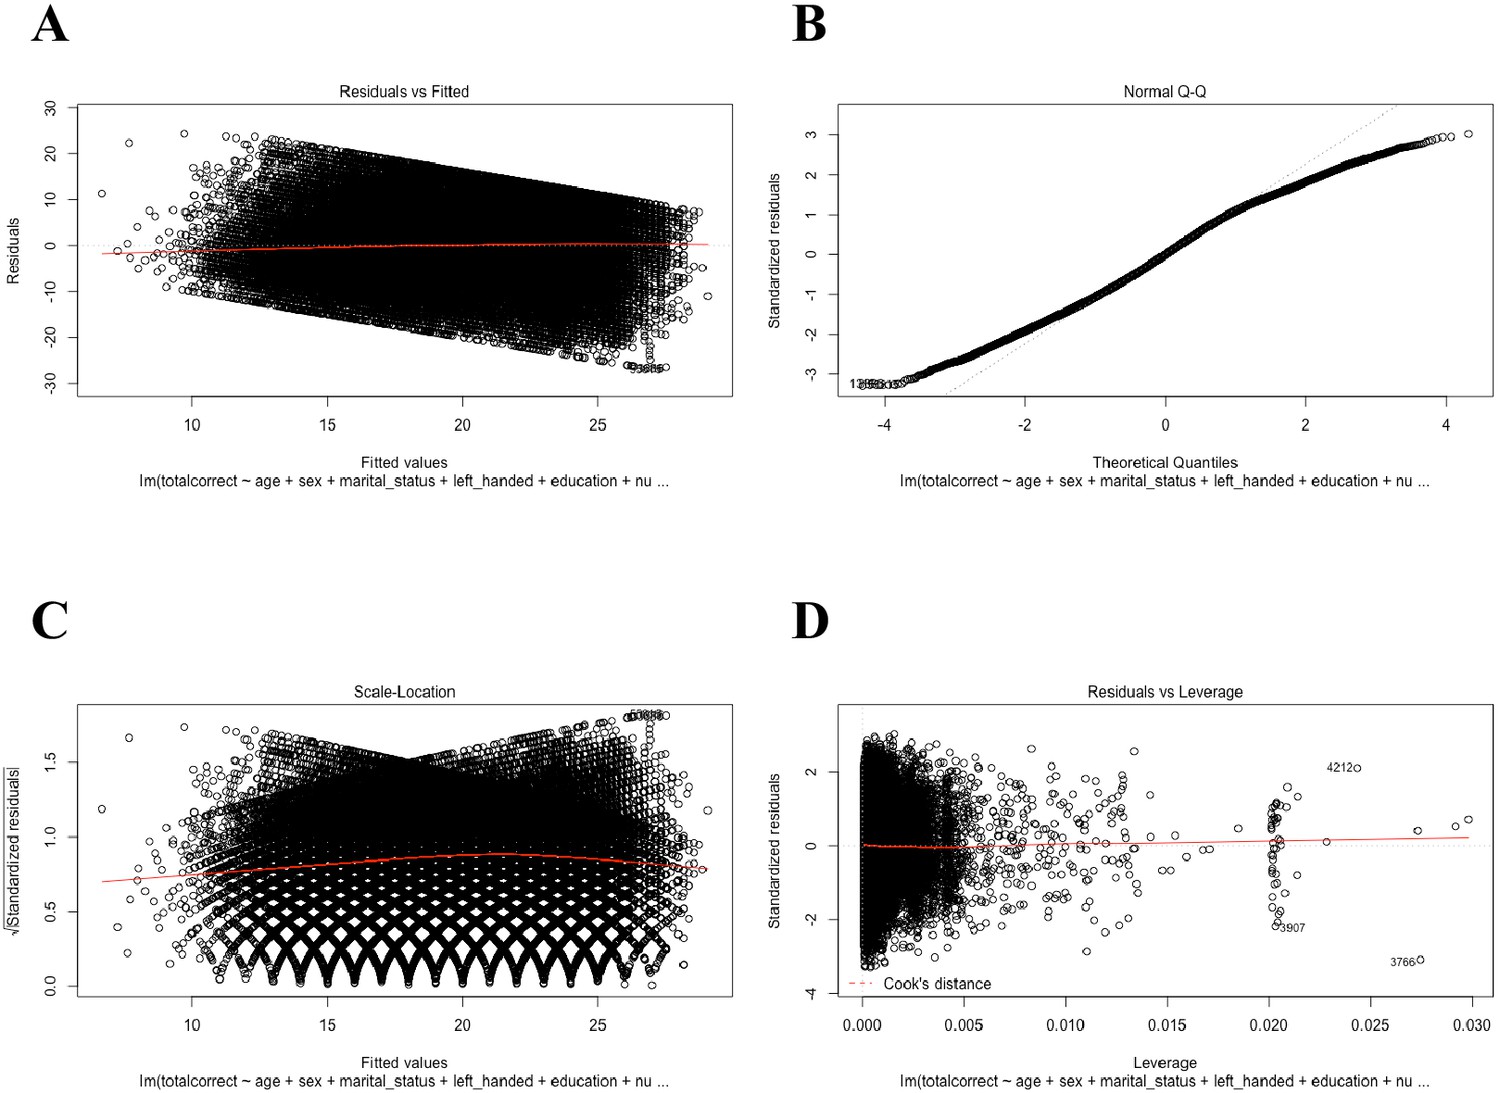
Regression diagnostic plots of the general linear model (GLM) including all participants (N=59,571).
(A) A plot of the residuals versus fitted values. This plot suggests that the assumptions of linearity, equality of variances, and no outliers are met. (B) A plot of quantiles of the data versus quantiles of a normal distribution. This plot suggests that there is a violation from normality in residuals and thus the error terms; however, this violation should not cause major problems because of the large number of participants in this study. (C) A plot of the square root of the standardized residuals versus the fitted values. Like plot A., this plot suggests that the variability of the residuals does not change much over the range of the dependent variable. (D) A plot of the residuals versus leverage. This plot suggests that there are no influential cases as all case fall within Cook’s distance (i.e., red dashed line not visible on the plot).
Figure 1—figure supplement 2
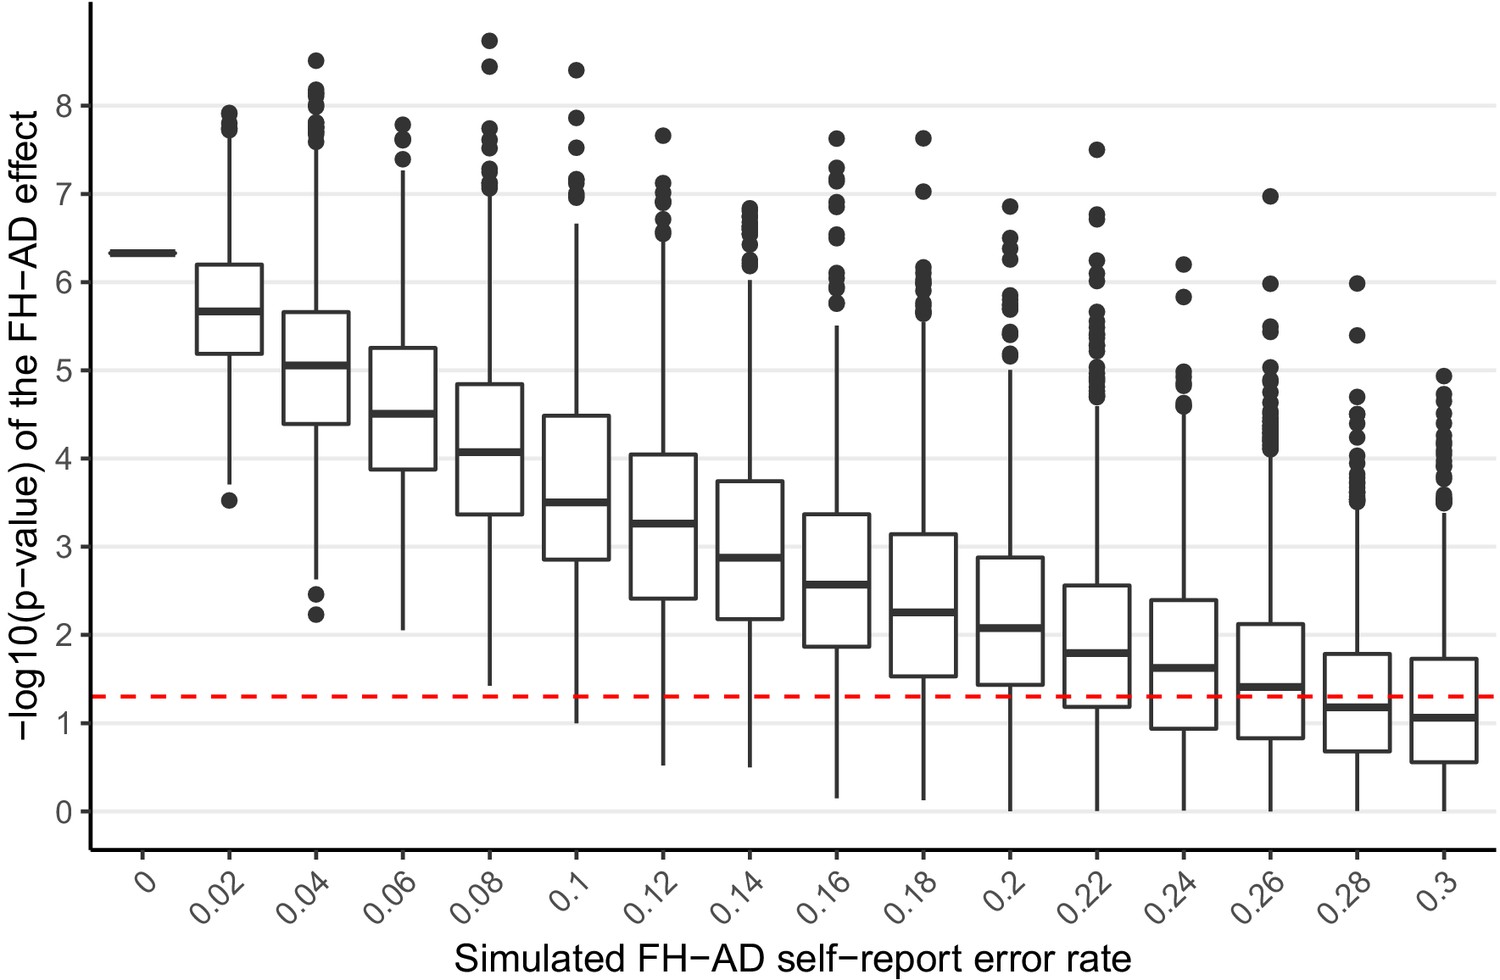
Simulated additional self-report error and the impact on the significance of the FH effect in MindCrowd.
The effect of error in self-reported FH-AD status was simulated by adding additional error to the MindCrowd cohort by re-assigning individual FH responses between 1-30%. and re-running the full statistical model. This was repeated 10,000 times for each error rate. Boxplots representing the distribution of p-values for the re-analysis under the new error model are illustrated. This demonstrates that even with 8% additional error added to the self-report FH question, we would still have identified a significant association with FH in all 10,000 cases. Even with 24% additional FH self-report error we would have still reported a significant association between FH and PAL over 50% of the time (better than by chance alone). Therefore, this simulation suggests that even with significant levels of additional error in FH self-report the association between FH and PAL performance would still have been noted by our study.
Figure 2
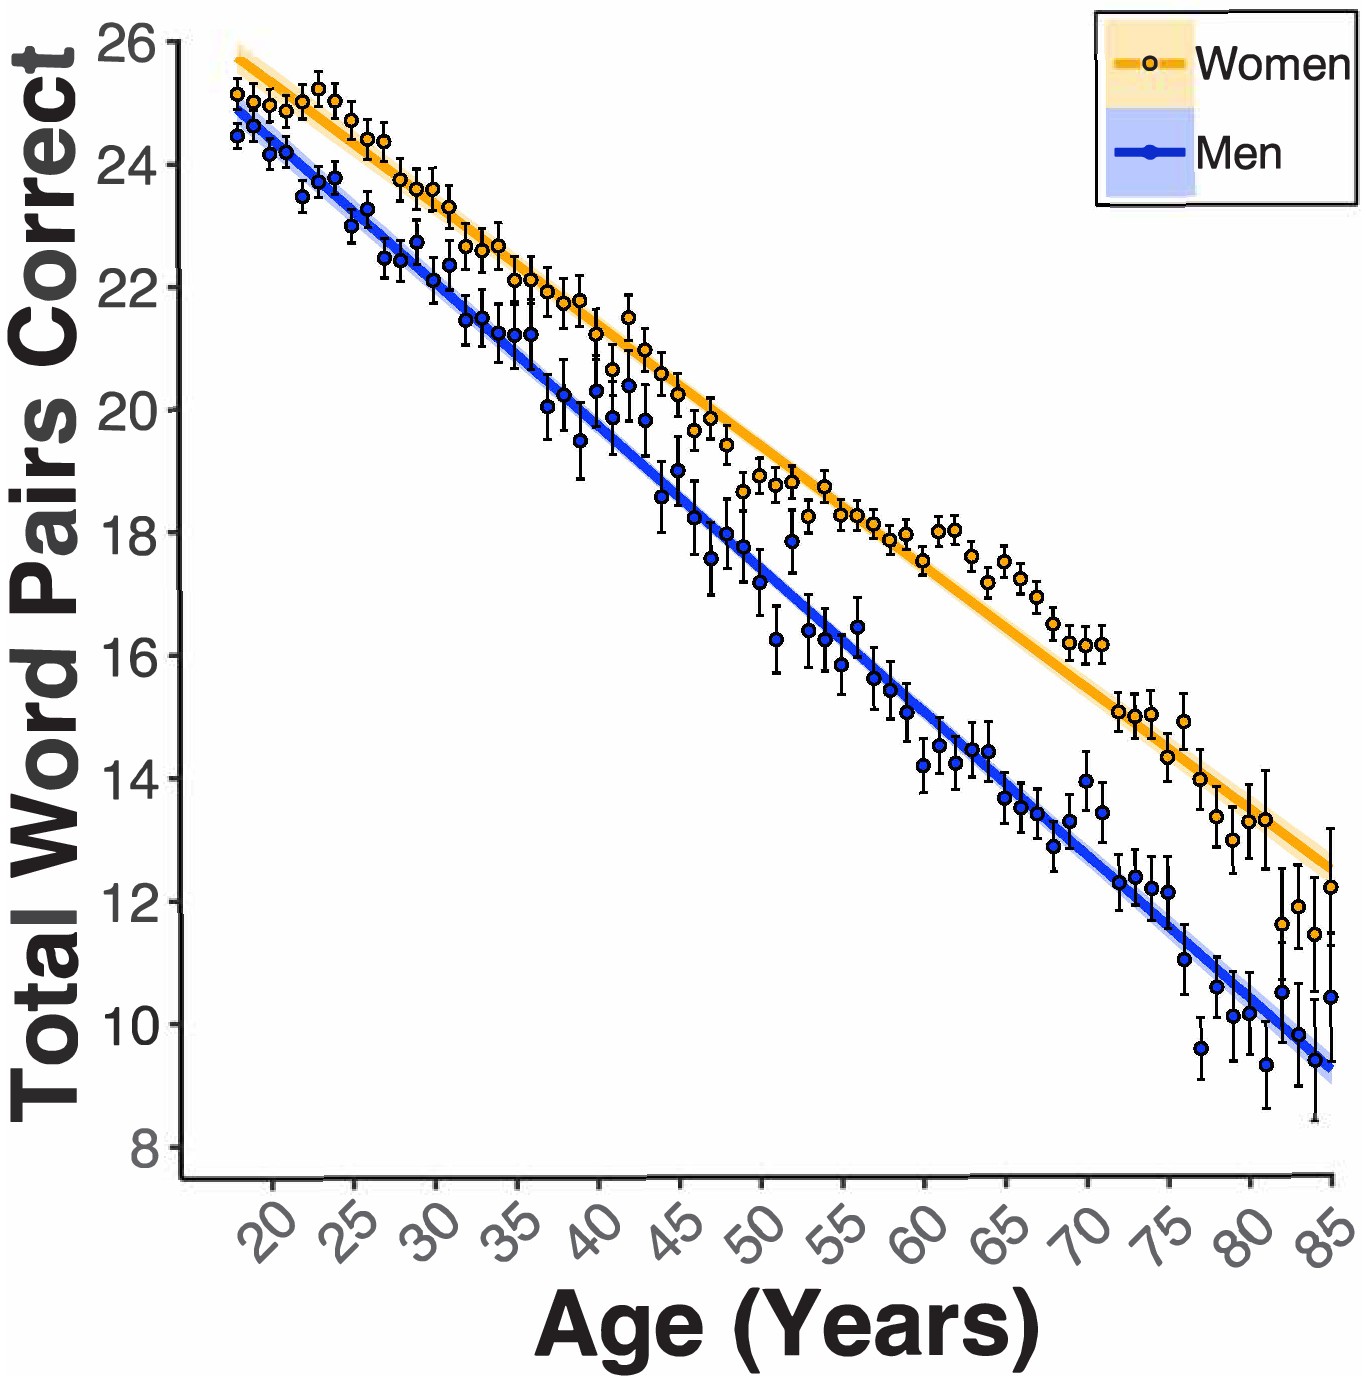
Females demonstrate enhanced paired-associates learning (PAL) performance across the aging spectrum, and this is further enlarged beginning in the 5th decade of life.
Linear regression fit (line fill ±95% confidence interval [CI], error bars ± standard error of the mean [SEM]) of the PAL total number of correct from 18 to 85 years old. Lines were split by Sex. Women performed better than men with an amplified disparity from 50 to 70 years old (BSex = −1.82, pSex <2e-16, women n = 40572, and men n = 24381).
Figure 3

Educational attainment is associated with PAL performance in a milestone-related dose response that is different between the sexes.
Linear regression fits (line fill ±95% CI, error bars ± SEM) of the PAL total number of correct from 18 to 85 years old. Lines were split by Educational Attainment level, and the figure was faceted by Sex. For women and men, there were heightened PAL scores per level of Educational Attainment (BEducation = 0.31, pEducation <2e-16, 6 years n = 282, 8 years n = 181, 10 years n = 1177, 12 years n = 5367, 14 years n = 19256, 16 years n = 22942, and 20 years n = 15752).
Figure 4

A first-degree relative FH of AD is associated with lower PAL performance at ages under 65.
(A) Linear regression fits (line fill ±95% CI, error bars ± SEM) of the PAL total number of correct from 18 to 85 years old. FH led to lower PAL performance before 65 years of age (BFH = −2.39, pFH = 3.47e-06, FH +n = 14739, and FH- n = 50011). (B) Linear regression fits of the PAL total number of correct from 18 to 85 years old. Lines split by Sex and FH status. FH led to lower PAL performance, an effect that was exacerbated in men (BSex*FH = −0.79, pSex*FH = 7.97e-06, FH +Women n=11119, FH- Women n = 29332, FH +Men n=3617, and FH- Men n = 20678). The inset figure displays PSM box and whisker plots, split by sex, across each decade of life. The black bar through each box and whisker plot represents the median ATT for FH. Men had worse PAL scores when compared to women at each decade of life except for the sixth (60 s: Women[ATT-0.50 ± SD0.18], Men[ATT0.09 ± SD−0.36], women n = 40572, and men n = 24381).
Figure 5
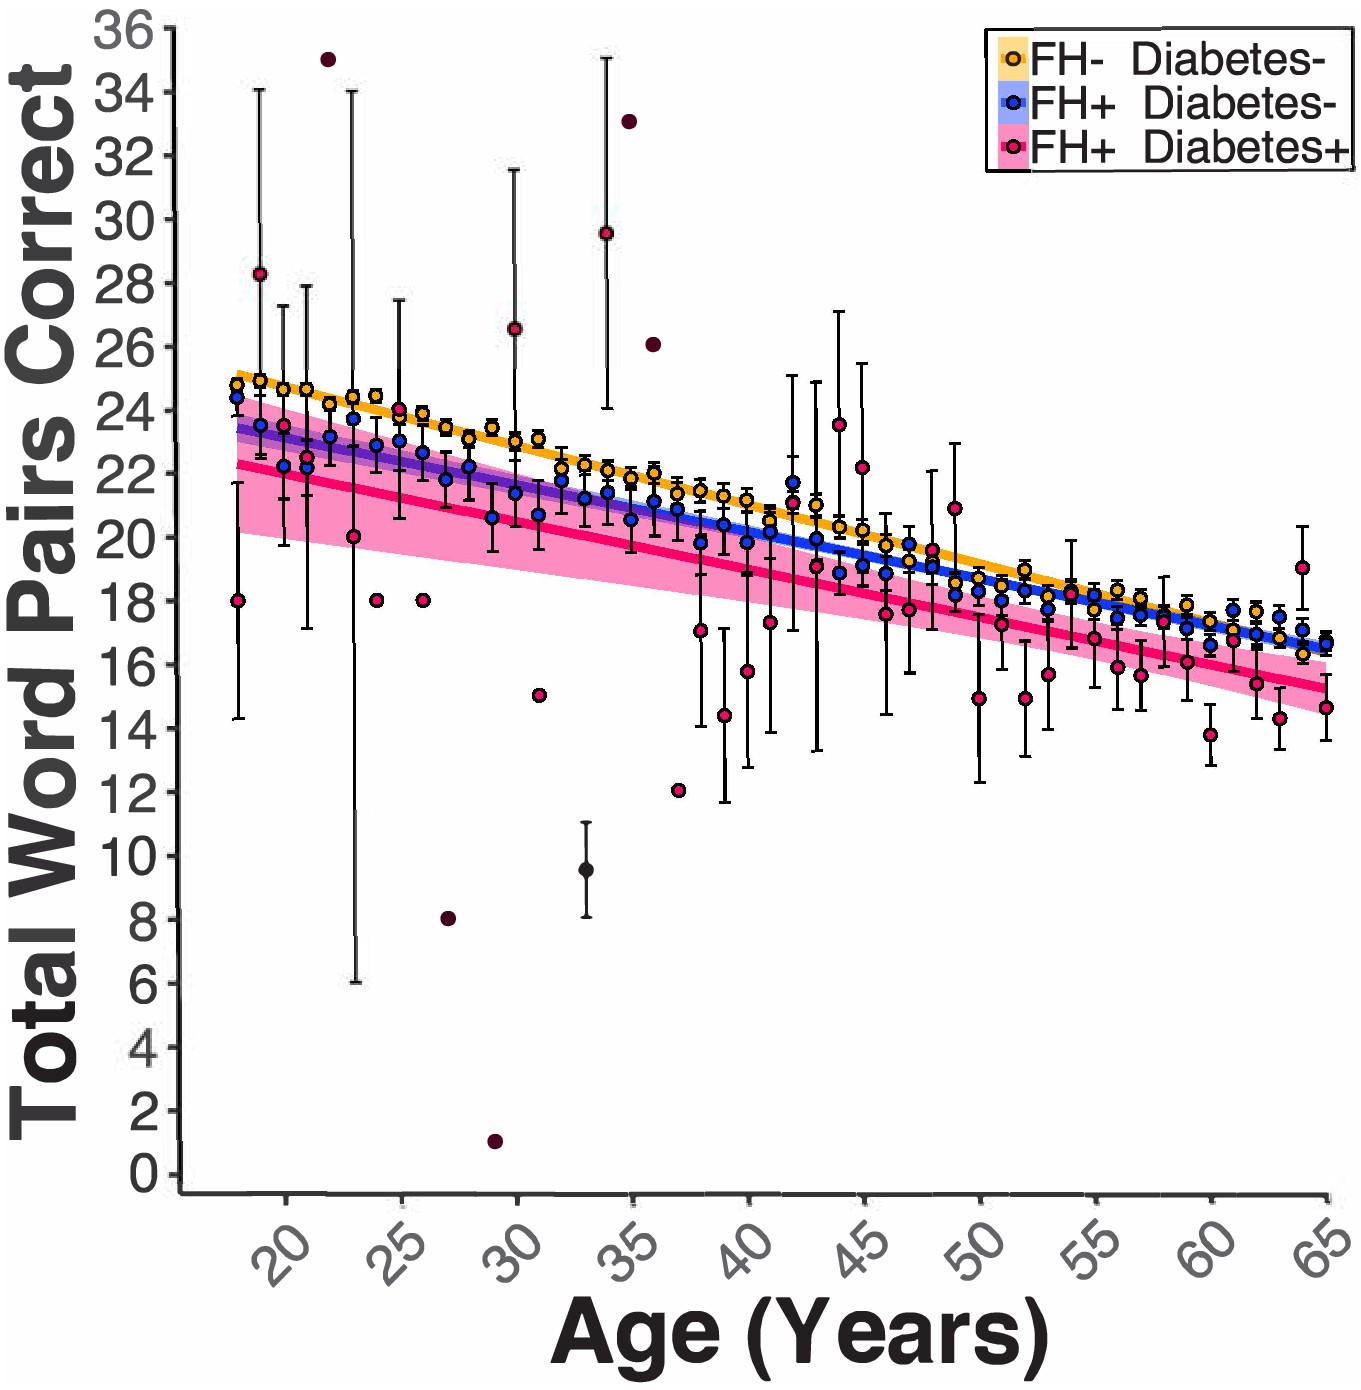
Diabetes modified the FH effect on PAL performance.
Linear regression fits (line fill ±95% CI, error bars ± SEM) of the PAL total number of correct in FH- Diabetes+, FH +Diabetes-, and FH +Diabetes + participants from 18 to 65 years old. Regardless of sex, diabetes in FH +participants led to lower PAL scores (BFH*Diabetes = −0.71, pFH*Diabetes = 0.04, AD- DI- n = 47970, AD- DI +n = 2041, AD +DI n=13841, and AD +DI + n=898).
Figure 6

Apolipoprotein E (APOE) ε4 alleles negatively influence PAL performance in the presence of FH.
(A) Linear regression fits (line fill ±95% CI, error bars ± SEM) of the PAL total number of correct from 18 to 65 years old. Lines were split by the Number of APOE ε4 Alleles. For women and men, there was a dose-dependent-like decrease in the PAL scores per each copy of the ε4 allele (Bε4Allele = −1.30, pε4Allele = 0.03, ε2/ε2 n = 2, ε2/ε3 n = 31, ε2/ε4 n = 46, ε3/ε3 n = 174, ε3/ε4 n = 382, and ε4/ε4 n = 35).
Author response image 1

Author response image 2

Graphs exploring the influence of additional self-report error on the FH-AD effect.
(A) Simulated additional self-report error and the impact on the significance of the FH effect in MindCrowd. The effect of error in self-reported FH-AD status was simulated by adding additional error to the MindCrowd cohort by re-assigning individual FH responses between 1-30%. and re-running the full statistical model. This was repeated 10,000 times for each error rate. Boxplots representing the distribution of p-values for the re-analysis under the new error model are illustrated. This demonstrates that even with 8% additional error added to the self-report FH question, we would still have identified a significant association with FH in all 10,000 cases. Even with 24% additional FH self-report error we would have still reported a significant association between FH and PAL over 50% of the time (better than by chance alone). Therefore, this suggests that even with significant levels of additional error in FH self-report the association between FH and PAL performance would still have been noted by our study. (B) Permutation testing of the FH effect on PAL.The p-value describing the FH effect on PAL in MindCrowd was permuted to determine the probability of a false positive under the null hypothesis. The vertical dashed red line indicates our reported t-statistic from the manuscript and the histogram of permuted t-statistics are indicated in black bars. After one million permutations of the FH data label, not a single t-statistic arising from a permutation of the data were observed to be more extreme than our reported t-statistic (permuted p-value = <1e-6). This suggests that the odds of our finding being observed due to chance is less than one in one million.
Author response image 3
Tables
Key resources table
| Reagent type (species) or resource | Designation | Source or reference | Identifiers | Additional information |
|---|---|---|---|---|
| Gene (Apolipoprotein E) | APOE | PMCID: PMC6106945 | HGNC:HGNC:613 | |
| Sequence-based reagent | APOE PCR Primers | Integrated DNA Technologies, Inc (IDT) | F 5'-ACA-GAA-TTG-GCC-CCG-GCC-TGG-TAC-3', R 5'-TAA-GCT-TGG-CAC-GGC-TGT-CCA-AGG-A-3' | 0.5 μL of each 50 μM Primer |
| Chemical compound, drug | FailSafe PCR Enzyme and 2X PreMix Buffers | Lucigen | FSP995J | |
| Chemical compound, drug | HHA1 | NEB | R0139S | 0.5 μL/20 μL of PCR product |
| Other | Whatman 903 Protein Saver Card | VWR | 05-715-121 | |
| Chemical compound, drug | Ultrapure Agarose | Thermo | 16500500 | 4% |
| Chemical compound, drug | GelStar Gel Stain | Lonza | 50535 | 7 μL/300 mL of gel mix |
| Chemical compound, drug | Ultra-Low Range DNA Ladder | Invitrogen | 10597012 | |
| Chemical compound, drug | Amplitaq Gold Fast Master Mix | Thermo | 4390941 | |
| Chemical compound, drug | Oragene Saliva Kit | DNAGenotek | OGR-500 | |
| Chemical compound, drug | Tris-Acetate-EDTA (TAE) 50 X (20L) | Fisher | BP1332-20 | |
| Software, algorithm | R | The R Foundation | Version 3.5.1 RRID:SCR_001905 | |
| Software, algorithm | R package, ggplot2 | Comprehensive R Archive Network (CRAN) | Version 3.1.1 RRID:SCR_014601 | |
| Software, algorithm | R package, emmeans | Comprehensive R Archive Network (CRAN) | Version 1.3.0 | |
| Software, algorithm | R package, Zelig | Comprehensive R Archive Network (CRAN) | Version 5.1.6 | |
| Software, algorithm | R package, MatchIt | Comprehensive R Archive Network (CRAN) | Version 3.0.2 |
Additional files
-
Source code 1
R-based statistical analysis and plotting script.
- https://doi.org/10.7554/eLife.46179.010
-
Supplementary file 1
Sample sizes.
Table displaying the sample size (n) for each evaluated demographic, health, and lifestyle factor.
- https://doi.org/10.7554/eLife.46179.011
-
Supplementary file 2
Questions each participant was asked and how it was coded in R.
Table displaying each question that a participant was asked on the MindCrowd website, whether the question was asked before or after the PAL test, the question number, and how each question was coded for analysis via R (version 3.5.1).
- https://doi.org/10.7554/eLife.46179.012
-
Transparent reporting form
- https://doi.org/10.7554/eLife.46179.013
Download links
A two-part list of links to download the article, or parts of the article, in various formats.
Downloads (link to download the article as PDF)
Open citations (links to open the citations from this article in various online reference manager services)
Cite this article (links to download the citations from this article in formats compatible with various reference manager tools)
Family history of Alzheimer’s disease alters cognition and is modified by medical and genetic factors
eLife 8:e46179.
https://doi.org/10.7554/eLife.46179


