Seasonal variation and etiologic inferences of childhood pneumonia and diarrhea mortality in India
- St. Michael’s Hospital and Dalla Lana School of Public Health, University of Toronto, Canada
- King George's Medical University, India
- Post Graduate Institute of Medical Education and Research, India
- Indian Council of Medical Research, India
- Johns Hopkins Bloomberg School of Public Health, United States
- Hospital for Sick Children and Dalla Lana School of Public Health, University of Toronto, Canada
Figures
Figure 1

National mortality rates of (A) pneumonia and (B) diarrhea by sex, poorer/richer state, and residence type among Indian children aged 1 month to 4 years between 2005 and 2013.
Each x-axis represents 2005–2013. We used a three-year moving average of the weighted proportion of deaths to calculate mortality rates (per 1000 live births). We adjusted death data to reflect 2015 data from the United Nations Population Division and Inter-agency Group for Child Mortality Estimation. Poorer states include the Empowerment Action Group-Assam states of Assam, Bihar, Chhattisgarh, Jharkhand, Madhya Pradesh, Odisha (Orissa before 2011), Rajasthan, Uttarakhand, and Uttar Pradesh. Richer states include all other states and union territories.
-
Figure 1—source data 1
National mortality rates and rate reductions of pneumonia and diarrhea by population subset.
1We adjusted death data to reflect 2015 data from the United Nations Population Division and Inter-agency Group for Child Mortality Estimation. 2We used a three-year moving average of the weighted proportion of deaths to calculate mortality rates. Mortality rates were per 1000 lives births at ages 1–11 months and 1–4 years and per 100,000 population for children at aged 5–14 years. 3We calculated rate reductions using the formula ARR = log(U5MRt2/U5MRt1) / (t1 – t2) as described by You et al. (2015). 4Poorer states include the Empowerment Action Group-Assam states of Assam, Bihar, Chhattisgarh, Jharkhand, Madhya Pradesh, Odisha (Orissa before 2011), Rajasthan, Uttarakhand, and Uttar Pradesh. Richer states include all other states and union territories.
- https://doi.org/10.7554/eLife.46202.005
Figure 2
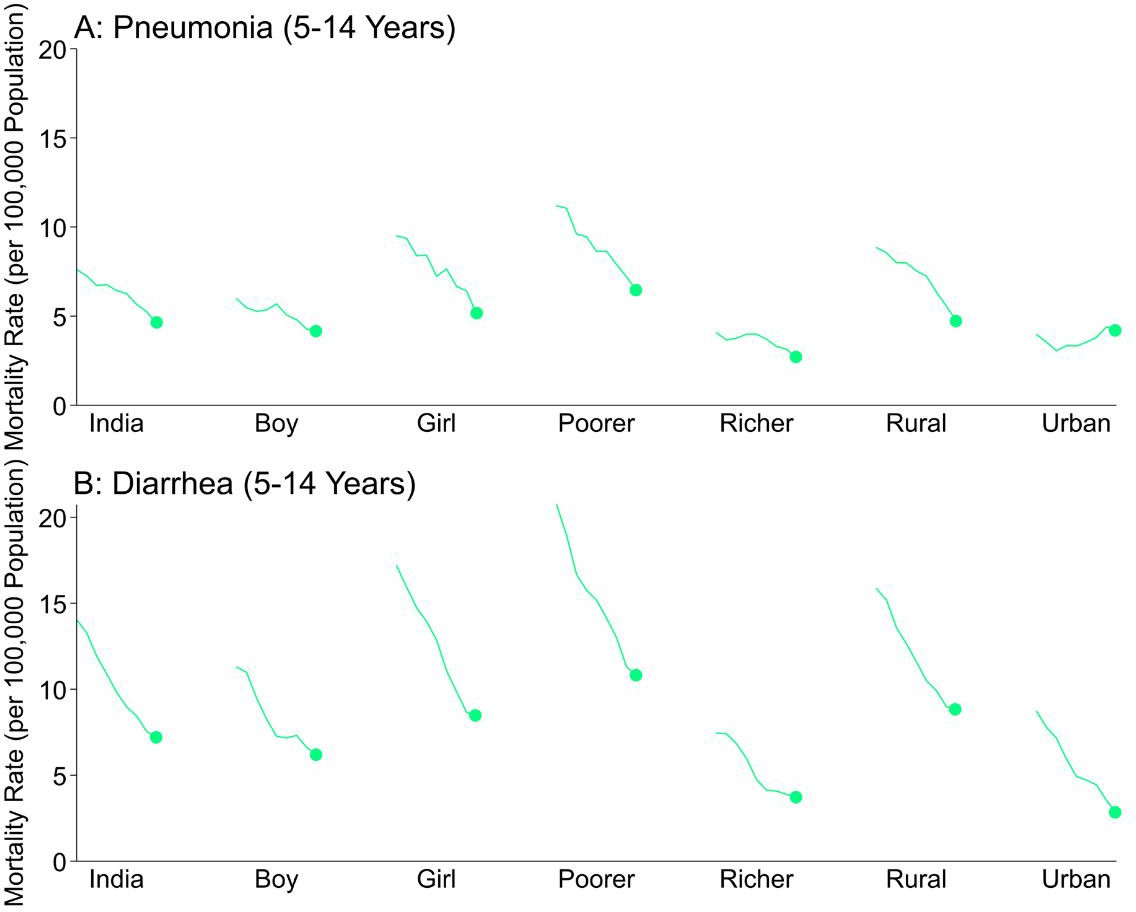
National mortality rates of (A) pneumonia and (B) diarrhea by sex, poorer/richer state, and residence type among Indian children aged 5 to 14 years between 2005 and 2013.
Each x-axis represents 2005–2013. We used a three-year moving average of the weighted proportion of deaths to calculate mortality rates (per 100,000 population). We adjusted death data to reflect 2015 data from the United Nations Population Division and Inter-agency Group for Child Mortality Estimation. Poorer states include the Empowerment Action Group-Assam states of Assam, Bihar, Chhattisgarh, Jharkhand, Madhya Pradesh, Odisha (Orissa before 2011), Rajasthan, Uttarakhand, and Uttar Pradesh. Richer states include all other states and union territories.
Figure 3 with 2 supplements
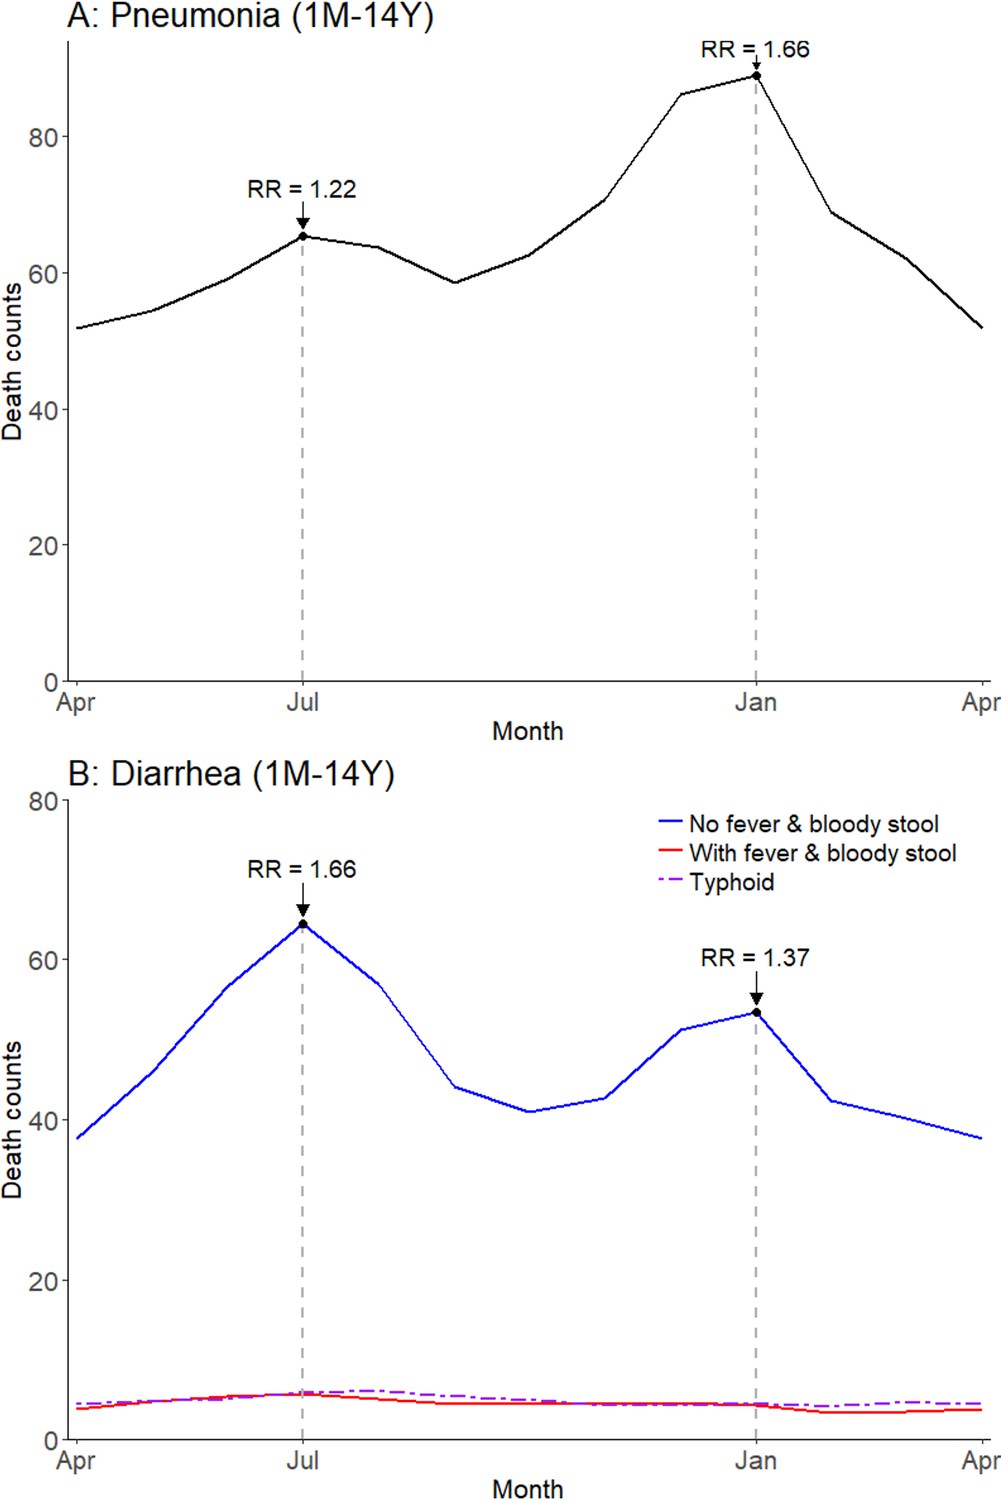
Average seasonal patterns of pneumonia (A) and diarrhea (B).
Diarrhea deaths are split into subsets of cases with/without both fever and bloody stool, as well as typhoid and paratyphoid fever deaths. We defined pneumonia deaths using ICD-10 codes A37, H65-H68, H70, H71, J00-J22, J32, J36, J85, J86, P23, or U04. We defined diarrhea deaths using ICD-10 codes A00, A02-A09, and distinguished further based on symptoms reported in the VA (deaths exhibiting both fever and bloody stool; deaths not exhibiting both fever and bloody stool). We defined typhoid and paratyphoid fever deaths using ICD-10 code A01. Each horizontal axis represents an average yearly span from April to April. We determined seasonal patterns using monthly counts of death and modeled using Poisson regression. Rate ratios (RR) are calculated within each disease and are compared to annual minimum mortality in the month of April.
-
Figure 3—source data 1
Monthly predicted values and rate ratios of the average annual pattern of pneumonia (total), diarrhea (by symptom profile; with fever and bloody stool, without fever and bloody stool), and typhoid/paratyphoid fever (total) mortality.
- https://doi.org/10.7554/eLife.46202.012
Figure 3—figure supplement 1
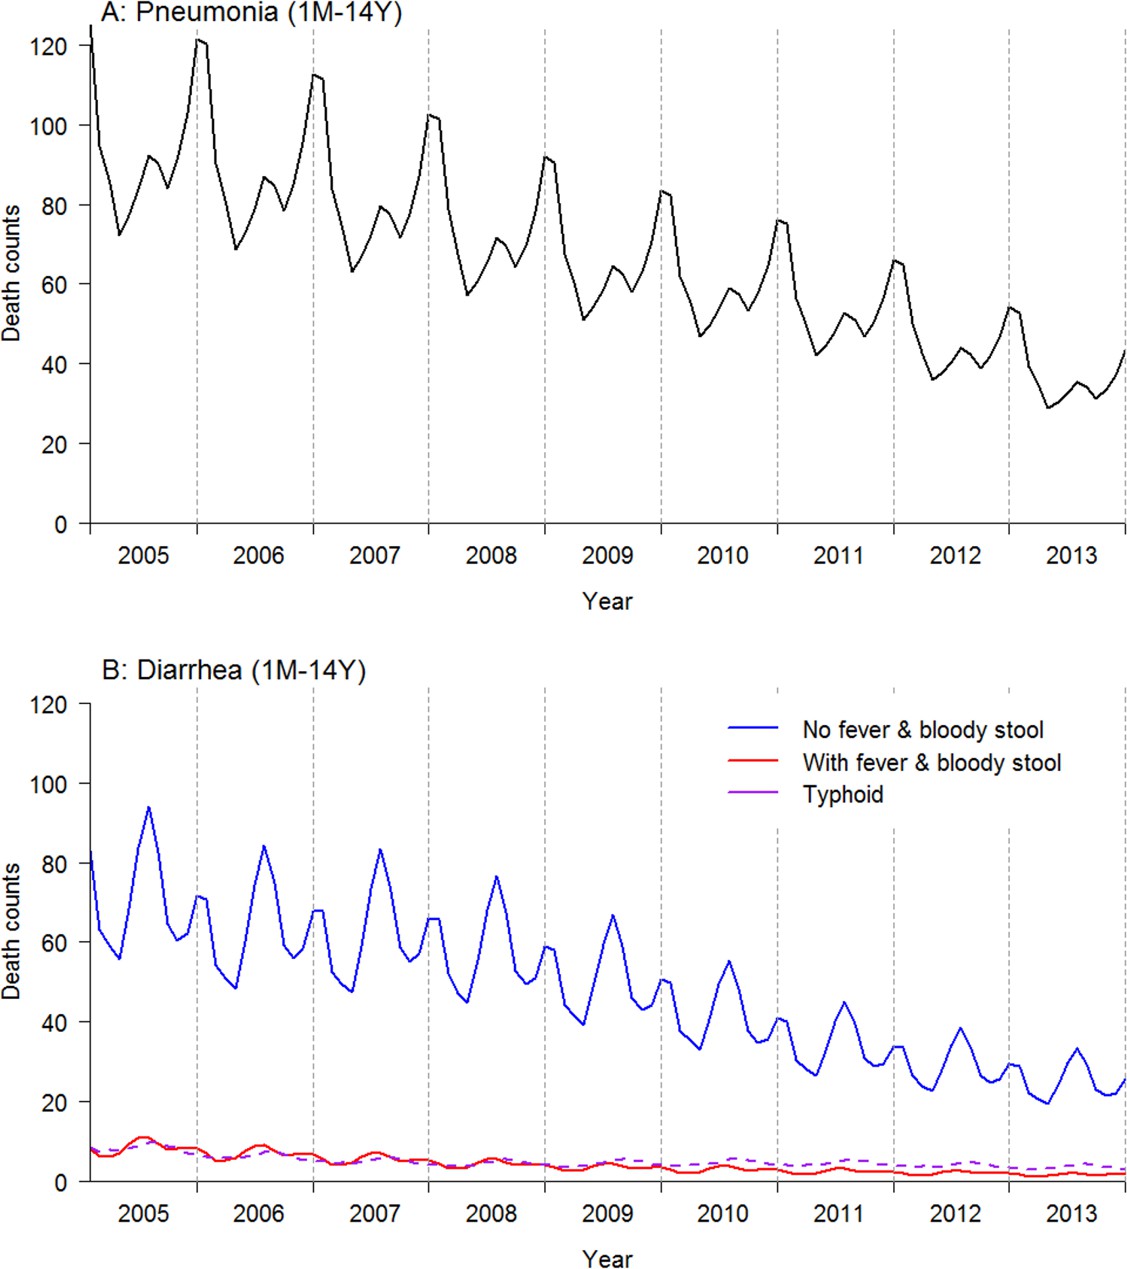
Time series model by pneumonia and diarrhea total.
Diarrhea deaths are split into subsets of cases with/without both fever and bloody stool, as well as typhoid and paratyphoid fever deaths. Pneumonia deaths are defined by ICD-10 codes A37, H65-H68, H70, H71, J00-J22, J32, J36, J85, J86, P23, or U04. Diarrhea deaths were defined by ICD-10 codes A00, A02-A09, and distinguished further based on symptoms reported in the verbal autopsy. Typhoid and paratyphoid fever deaths were defined by ICD-10 code A01. Each dashed vertical line designates December of each year. Data was modeled using a generalized additive model and Poisson regression, using monthly count of deaths from the Million Death Study. Each vertical dashed line designates December of each year.
-
Figure 3—figure supplement 1—source data 1
Predicted values for pneumonia (total), diarrhea (by symptom profile; with fever and bloody stool, without fever and bloody stool), and typhoid/paratyphoid fever (total) mortality time series models; 2005-2013.
- https://doi.org/10.7554/eLife.46202.009
Figure 3—figure supplement 2
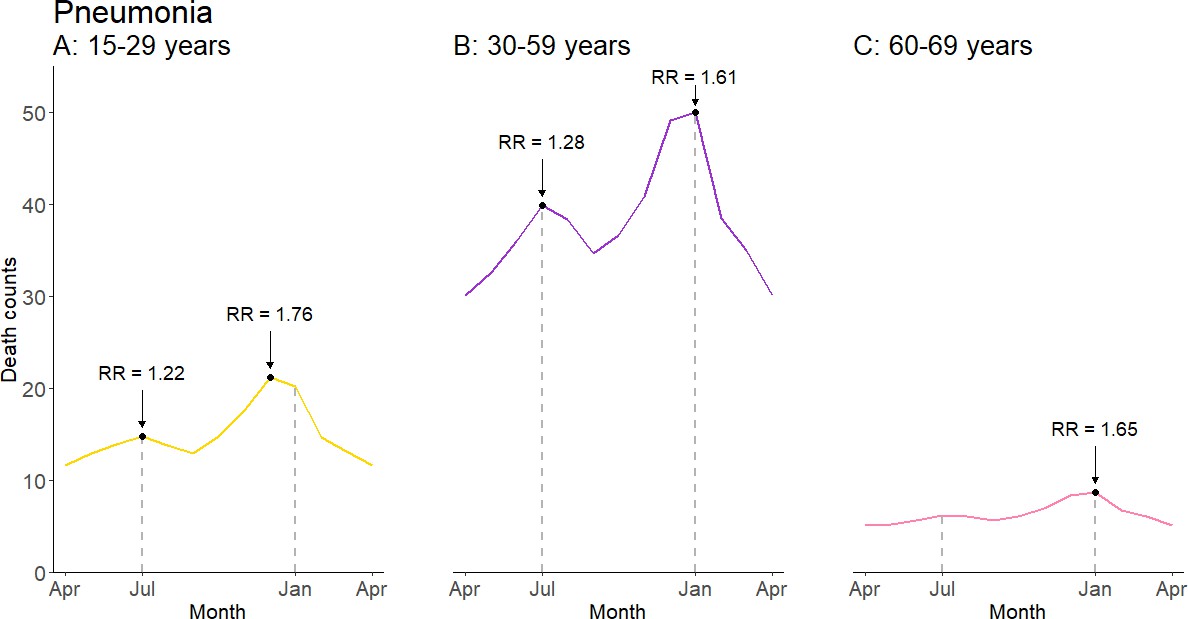
Average seasonal patterns of pneumonia deaths by adult age subset.
Each horizontal axis represents an average yearly span from April to April. We determined seasonal patterns using monthly counts of death and modeled using Poisson regression. Rate ratios (RR) were calculated within each disease and were compared to annual minimum mortality in the month of April.
-
Figure 3—figure supplement 2—source data 1
Monthly predicted values and rate ratios of the average annual pattern of pneumonia mortality, by adult age subset.
- https://doi.org/10.7554/eLife.46202.011
Figure 4 with 1 supplement
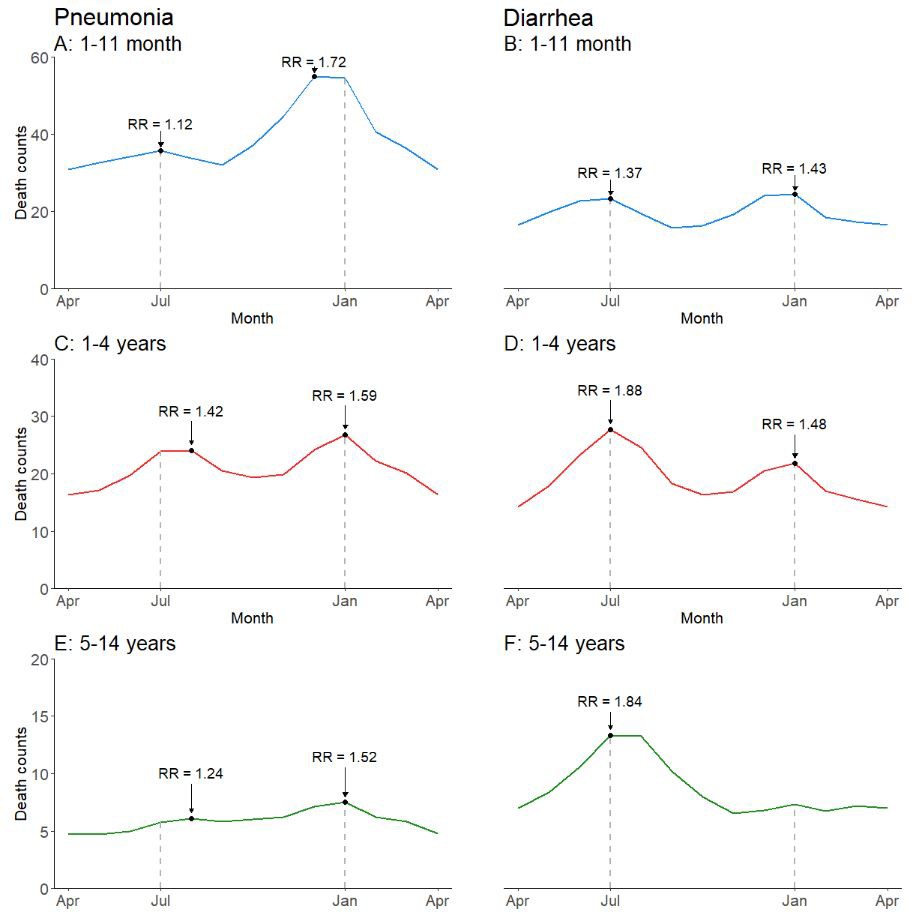
Average seasonal patterns of pneumonia (A, C, E) and diarrhea lacking fever and bloody stool (B, D, F) deaths by child age subset.
Counts of diarrhea with fever and bloody stool were too small to model. Each horizontal axis represents an average yearly span from April to April. We determined seasonal patterns using monthly counts of death and modeled using Poisson regression. Rate ratios (RR) were calculated within each disease and were compared to annual minimum mortality in the month of April.
-
Figure 4—source data 1
Monthly predicted values and rate ratios of the average annual pattern of pneumonia and diarrhea mortality, by child age subset.
- https://doi.org/10.7554/eLife.46202.016
Figure 4—figure supplement 1

Time series model for (A) pneumonia and (B) diarrhea, by age subset.
Diarrhea cases shown here are only those that did not exhibit fever and bloody stool. Data was modeled using a generalized additive model and Poisson regression, using monthly count of deaths from the Million Death Study. Each dashed vertical line designates December of each year.
-
Figure 4—figure supplement 1—source data 1
Predicted values for pneumonia and diarrhea mortality time series models by child age subset; 2005–2013.
- https://doi.org/10.7554/eLife.46202.015
Figure 5
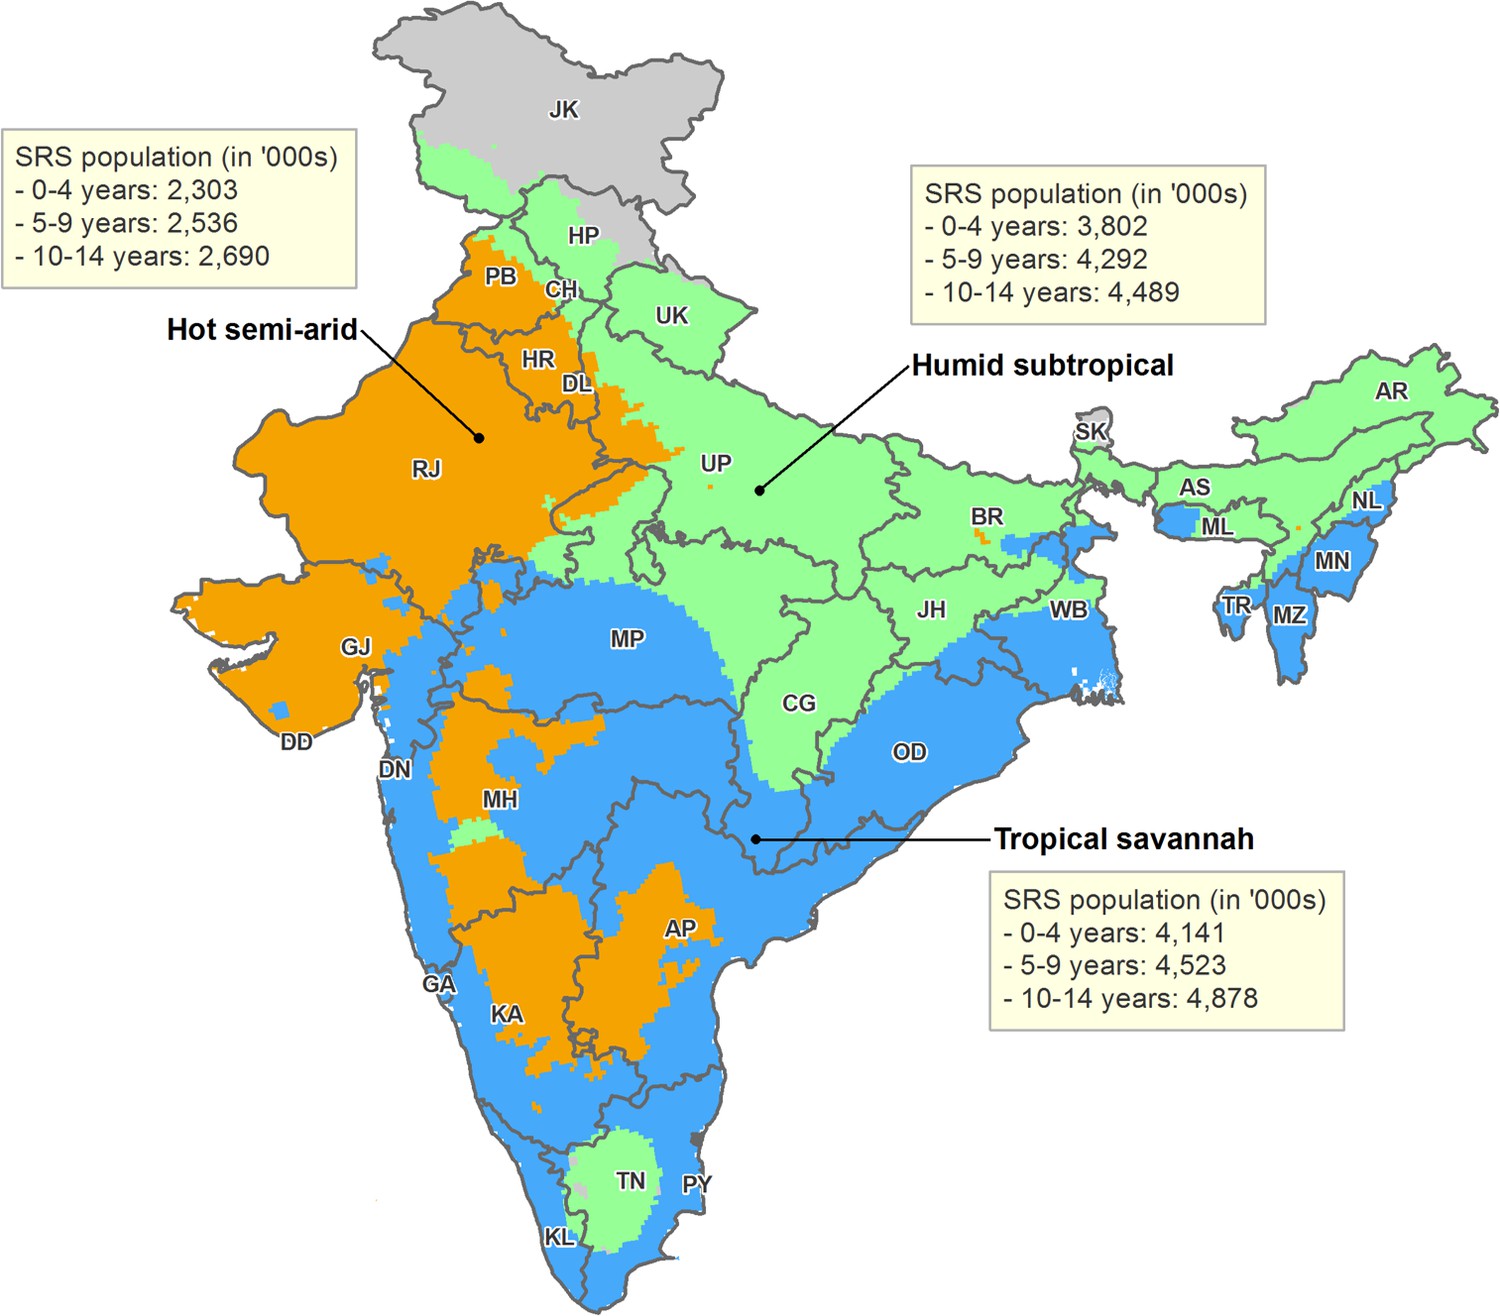
Map of India by state and Köppen-Geiger climate classification region.
Original climate region data was extracted from Kottek et al. (2006). The Köppen-Geiger map of India was created using ArcGIS 10.4. The three climate regions shown include hot semi-arid (Bsh; including hot desert or Bwh), humid subtropical (Cwa; including subtropical highland or Cwb), and tropical savannah (Aw; including tropical monsoon or Am). The hot desert, subtropical highland, and tropical monsoon regions are incorporated into similar, adjacent climate regions given insufficient sample size. Briefly, the hot semi-arid region exhibits large fluctuations in annual temperature, has little annual precipitation, and is geographically proximal to deserts; the tropical savannah region is characterized by distinct dry-wet seasonal variation; and the humid subtropical region is defined by hot, humid temperatures and consistent rainfall throughout the year. AN = Andaman and Nicobar Islands. AP = Andhra Pradesh. AR = Arunachal Pradesh. AS = Assam. BR = Bihar. CH = Chandigarh. CG = Chhattisgarh. DD = Daman and Diu. DN = Dadra and Nagar Haveli. DL = Delhi. GA = Goa. GJ = Gujarat. HP = Himachal Pradesh. HR = Haryana. JH = Jharkhand. JK = Jammu and Kashmir. KA = Karnataka. KL = Kerala. LD = Lakshadweep. MH = Maharashtra. ML = Meghalaya. MN = Manipur. MP = Madhya Pradesh. MZ = Mizoram. NL = Nagaland. OD = Odisha. PB = Punjab. PY = Puducherry. RJ = Rajasthan. SK = Sikkim. TN = Tamil Nadu. TR = Tripura. UP = Uttar Pradesh. UT = Uttarakhand. WB = West Bengal.
Figure 6 with 1 supplement
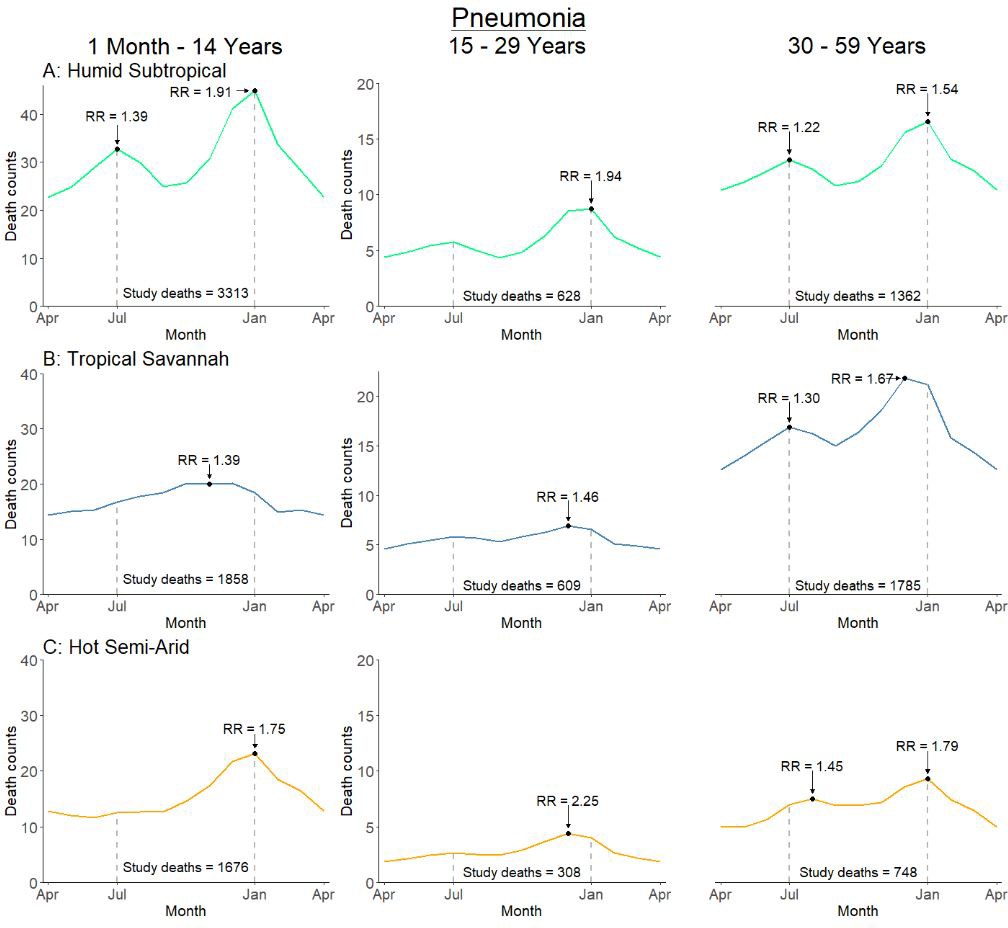
Average seasonal pattern of deaths from pneumonia by age group and Köppen-Geiger climate region.
Each horizontal axis represents an average yearly span from April to April. We determined seasonal patterns using monthly counts of death and modeled using Poisson regression. Rate ratios (RR) were calculated within each disease and were compared to annual minimum mortality in the month of April. Given three regions also had a smaller sample size on which to model, they were bundled into regions with similar climatic characteristics (tropical monsoon into tropical savannah, hot desert into hot semi-arid, and subtropical highland into humid subtropical).
-
Figure 6—source data 1
Monthly predicted values and rate ratios of the average annual pattern of pneumonia mortality, by age subset and climate region.
- https://doi.org/10.7554/eLife.46202.021
Figure 6—figure supplement 1
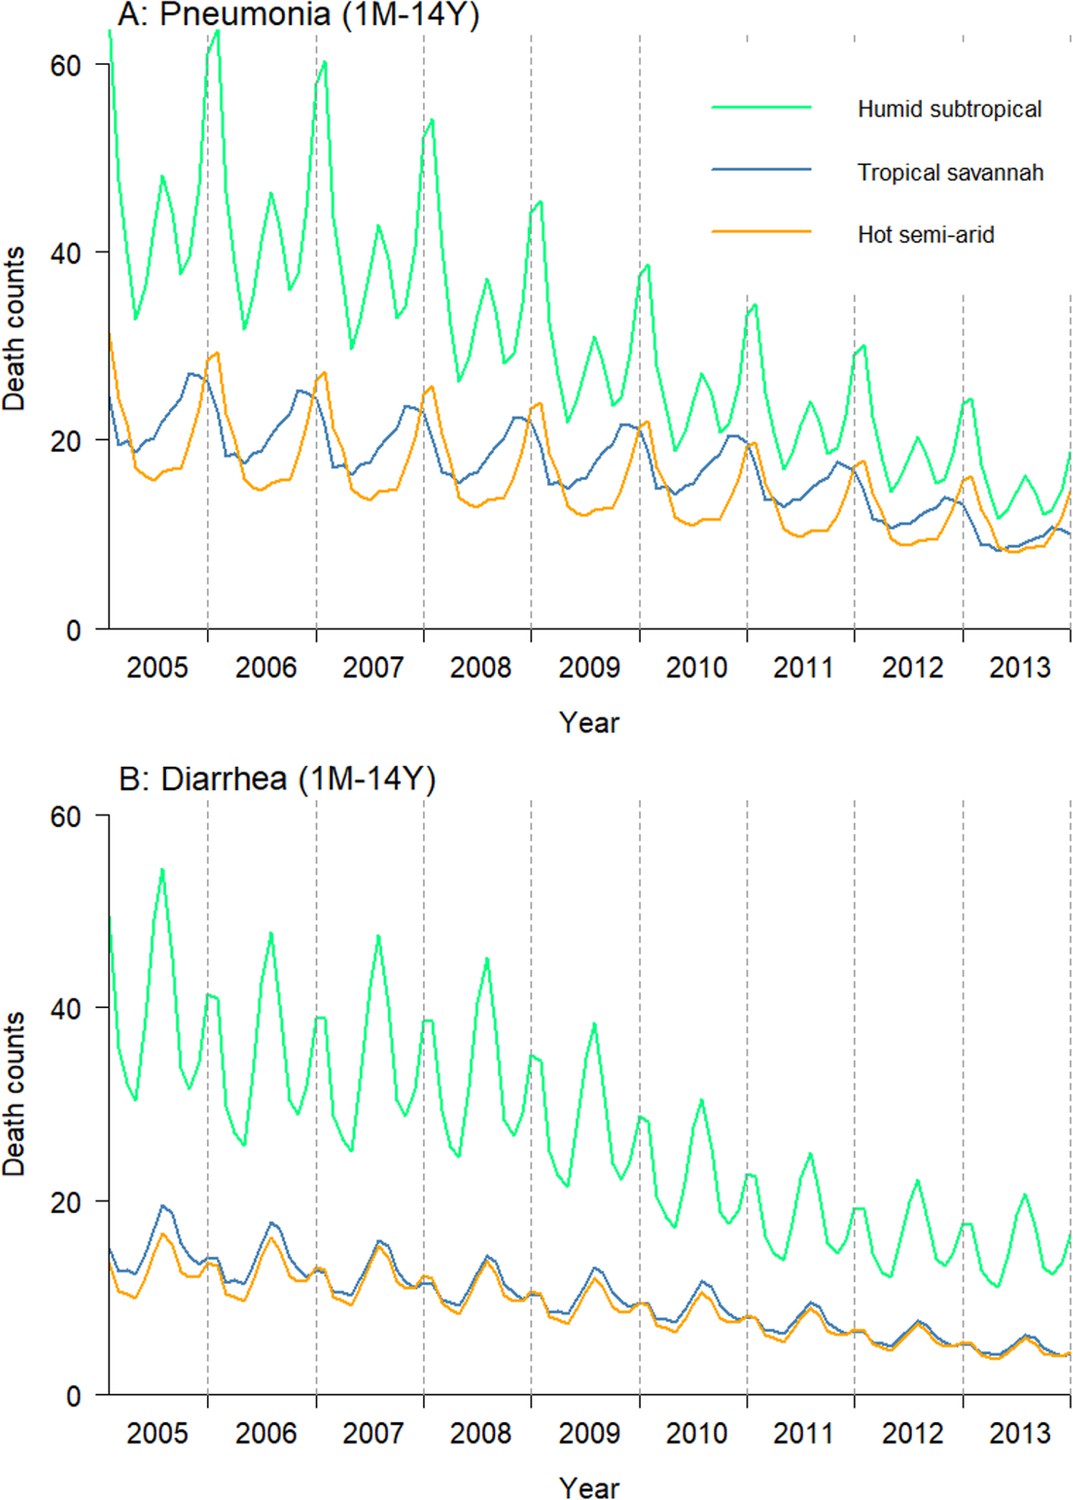
Time series model for (A) pneumonia and (B) diarrhea by Köppen-Geiger climate region.
Diarrhea cases shown here are only those that did not exhibit fever and bloody stool. Data was modeled using a generalized additive model and Poisson regression, using monthly count of deaths from the Million Death Study. Each checked horizontal line designates December of each year. Given three regions also had a smaller sample size on which to model, they were bundled into regions with similar climatic characteristics (tropical monsoon into tropical savannah, hot desert into hot semi-arid, and subtropical highland into humid subtropical). Each dashed vertical line designates December of each year.
-
Figure 6—figure supplement 1—source data 1
Predicted values for pneumonia and diarrhea mortality time series models by climate region; 2005–2013.
- https://doi.org/10.7554/eLife.46202.020
Figure 7
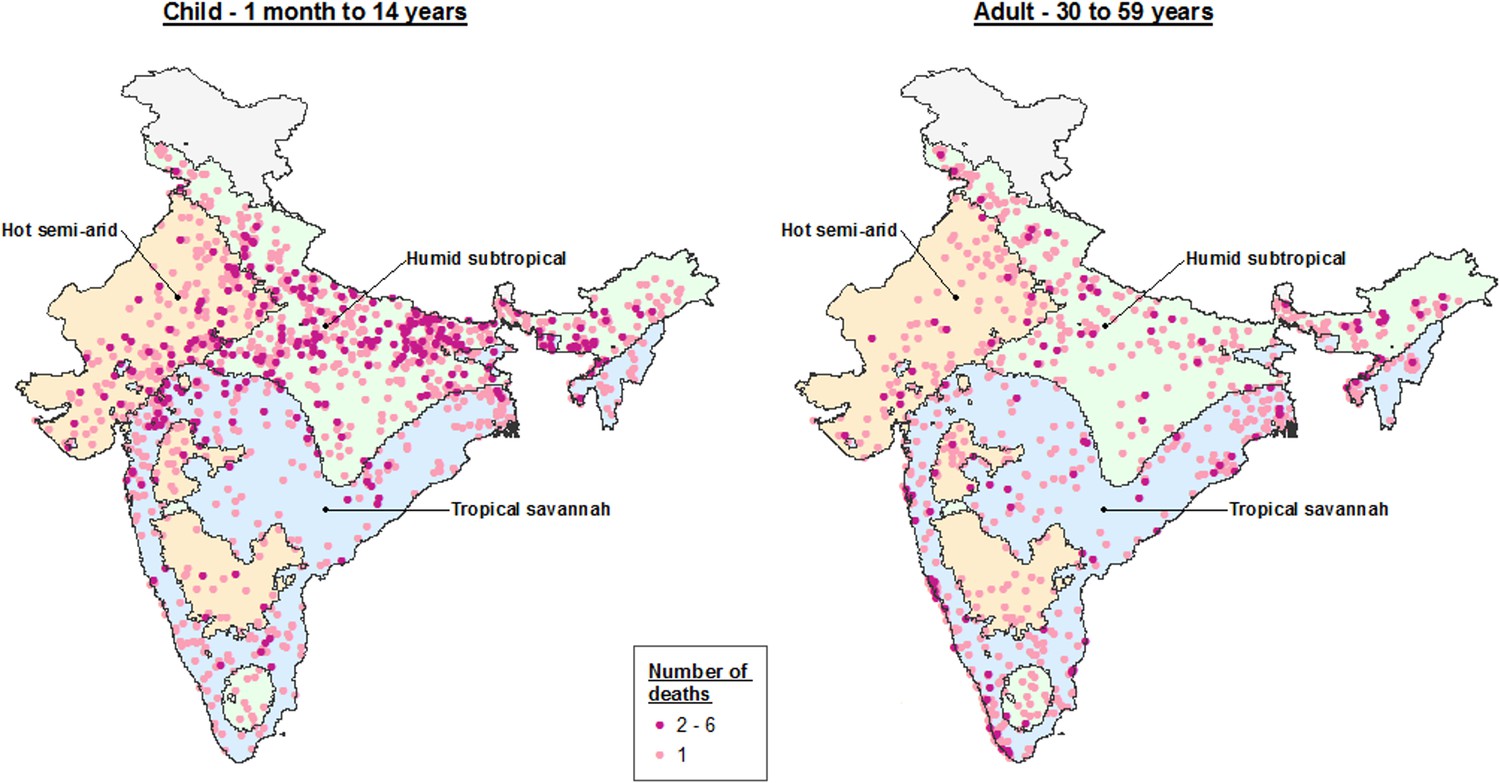
Dot map of child (1 month – 14 years) and adult (30–59 years) pneumonia deaths captured within the Million Death Study between June and August, by Köppen-Geiger climate region.
The three climate regions shown include hot semi-arid (Bsh; including hot desert or Bwh), humid subtropical (Cwa; including subtropical highland or Cwb), and tropical savannah (Aw; including tropical monsoon or Am). The hot desert, subtropical highland, and tropical monsoon regions are incorporated into similar, adjacent climate regions given insufficient sample size to describe separately.
Figure 8
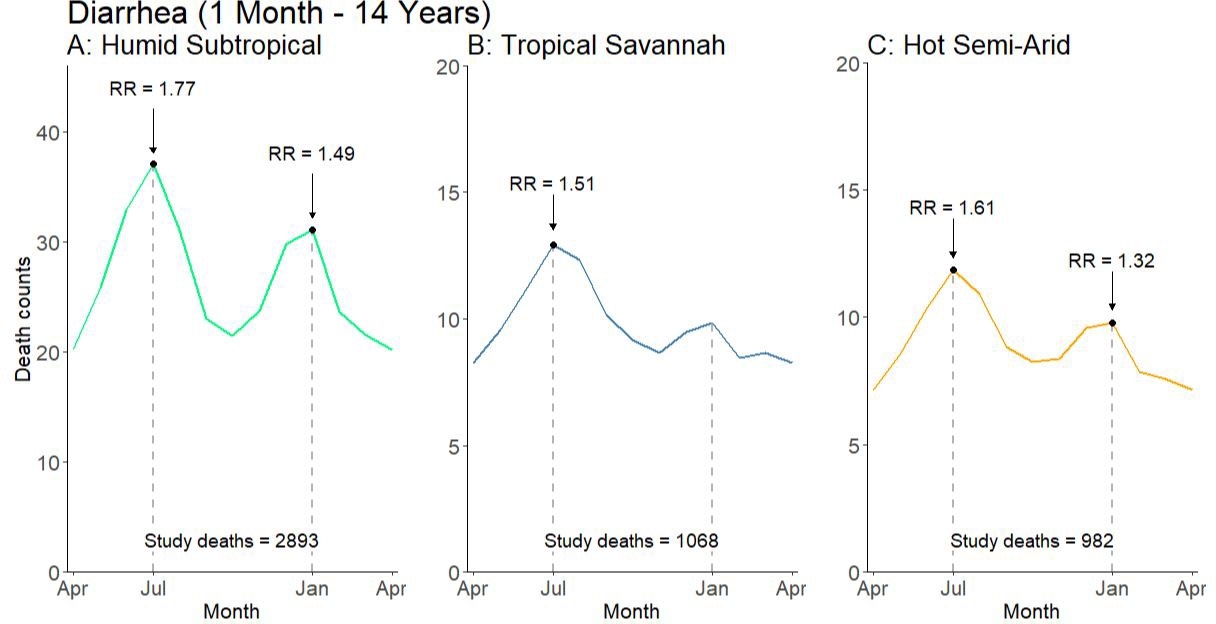
Average seasonal pattern of deaths from diarrhea lacking fever and bloody stool by Köppen-Geiger climate region among children at ages 1 month to 14 years.
Counts of diarrhea with fever and bloody stool were too small to model. Each horizontal axis represents an average yearly span from April to April. We determined seasonal patterns using monthly counts of death and modeled using Poisson regression. Rate ratios (RR) were calculated within each disease and were compared to annual minimum mortality in the month of April. Given three regions also had a smaller sample size on which to model, they were bundled into regions with similar climatic characteristics (tropical monsoon into tropical savannah, hot desert into hot semi-arid, and subtropical highland into humid subtropical).
-
Figure 8—source data 1
Monthly predicted values and rate ratios of the average annual pattern of child diarrhea mortality by climate region.
- https://doi.org/10.7554/eLife.46202.024
Tables
Table 1
Study numbers and weighted percentages of pneumonia and diarrhea deaths recorded in the Million Death Study between 2005 and 2013, among Indian children aged 1 month to 14 years.
https://doi.org/10.7554/eLife.46202.002| Pneumonia1 n (%3) | Diarrhea2 n (%3) | |
|---|---|---|
| Age | ||
| 1–11 Months | 4203 (57%) | 2291 (39%) |
| 1–4 Years | 2291 (34%) | 2297 (43%) |
| 5–14 Years | 640 (9%) | 1043 (18%) |
| Sex | ||
| Female | 3645 (52%) | 3064 (55%) |
| Male | 3489 (48%) | 2567 (45%) |
| Place of Death | ||
| Home | 5093 (75%) | 4201 (77%) |
| Health Facility | 1694 (20%) | 1112 (17%) |
| Other | 287 (4%) | 264 (5%) |
| Type of Residence | ||
| Rural | 6037 (84%) | 4766 (86%) |
| Urban | 1097 (16%) | 865 (14%) |
| Poorer States4 | 4352 (76%) | 3709 (81%) |
| Richer States4 | 2782 (24%) | 1922 (19%) |
| Symptoms | ||
| Fever | 5964 (84%) | 2842 (47%) |
| Cough | 4482 (63%) | 827 (13%) |
| Difficulty breathing | 5715 (81%) | 1876 (32%) |
| Fast breathing5 | 4229 (61%) | 1085 (19%) |
| Chest indrawing5 | 3623 (54%) | 728 (12%) |
| Wheezing5 | 3773 (56%) | 901 (16%) |
| Diarrhea (i.e. loose stools) | 1144 (17%) | 5122 (92%) |
| Blood in stool6 | 95 (1%) | 787 (13%) |
| Vomiting | 1913 (26%) | 3950 (71%) |
| Abdominal pain | 1102 (15%) | 2291 (43%) |
| Treatment | ||
| Antibiotics for breathing problems5 | 2946 (41%) | 722 (12%) |
| ORS/other fluids6 | 628 (9%) | 2963 (53%) |
| Both physicians agreed on initial assignment7 | 5431 (77%) | 4832 (86%) |
| Total deaths | 7134 | 5631 |
-
1We excluded 272 pneumonia deaths with a reported history of measles by the verbal autopsy respondent. 2We excluded 557 typhoid and paratyphoid fever deaths and 132 deaths with a reported history of measles by the verbal autopsy respondent. 3We calculated percentages usinga weighted proportion to account for differences in sampling probabilities. 4Poorer states include the Empowerment Action Group-Assam states of Assam, Bihar, Chhattisgarh, Jharkhand, Madhya Pradesh, Odisha (Orissa before 2011), Rajasthan, Uttarakhand, and Uttar Pradesh. Richer states include all other states and union territories. 5Only asked of those who reported difficulty breathing (n = 5715 pneumonia deaths, 1876 diarrhea deaths). 6Only asked of those who reported symptomatic diarrhea (i.e. loose stools; n = 1144 pneumonia deaths, 5122 diarrhea deaths). 7Physicians were blinded to each other’s diagnoses, and agreement is assessed prior to any adjudication or reconciliation of diagnoses.
Table 2
Study numbers and weighted percentages of pneumonia deaths recorded in the Million Death Study between 2005 and 2013, among Indian adults aged 15 to 69 years.
https://doi.org/10.7554/eLife.46202.003| Pneumonia1 n (%2) | |
|---|---|
| Age | |
| 15–29 Years | 1637 (27%) |
| 30–59 Years | 4155 (63%) |
| 60–69 Years | 695 (11%) |
| Sex | |
| Female | 3117 (48%) |
| Male | 3370 (52%) |
| Place of Death | |
| Home | 5339 (85%) |
| Health Facility | 935 (12%) |
| Other | 90 (1%) |
| Type of Residence | |
| Rural | 5082 (75%) |
| Urban | 1405 (25%) |
| Poorer States3 | 2497 (52%) |
| Richer States3 | 3990 (48%) |
| Both physicians agreed on initial assignment4 | 2517 (38%) |
| Total deaths | 6487 |
-
1We defined pneumonia deaths using ICD-10 codes A37, H65-H68, H70, H71, J00-J22, J32, J36, J85, J86, P23, or U04. 2We calculated percentages using a weighted proportion to account for differences in sampling probabilities. 3Poorer states include the Empowerment Action Group-Assam states of Assam, Bihar, Chhattisgarh, Jharkhand, Madhya Pradesh, Odisha (Orissa before 2011), Rajasthan, Uttarakhand, and Uttar Pradesh. Richer states include all other states and union territories. 4Physicians were blinded to each other’s diagnoses, and agreement is assessed prior to any adjudication or reconciliation of diagnoses.
Table 3
Estimated deaths due to microbiologic etiologies and other syndromes of pneumonia and diarrhea in 2015 among Indian children aged 1–59 months.
https://doi.org/10.7554/eLife.46202.025| Etiology | Source of estimation | Etiologic fraction (%) (uncertainty range) | Estimated deaths (uncertainty range) |
|---|---|---|---|
| Streptococcus pneumoniae1 | Meta-analysis (clinical trials) | 38 (27–39) | 40,600 (28,800–42,400) |
| Respiratory syncytial virus2 | Meta-analysis (prevalence surveys) | 19 (13–27) | 20,700 (13,600–29,000) |
| Influenza2,3 | Meta-analysis (prevalence surveys) | 12 (7–19) | 12,600 (7,200–20,600) |
| Haemophilus influenzae type b1 | Meta-analysis (clinical trials) | 7 (5–9) | 7200 (5,000–9,400) |
| Humid subtropical summer excess | Syndromic mortality estimate | 3 (no range) | 3500 (no range) |
| Pneumonia total4 | 108,000 | ||
| Rotavirus5 | Meta-analysis (prevalence surveys) | 30 (21–40) | 24,700 (17,200–32,800) |
| Diarrhea with fever and bloody stool | Syndromic mortality estimate | 8 (no range) | 6200 (no range) |
| Diarrhea total4 | 82,000 | ||
-
1The proportion of pneumonia cases due to Streptococcus pneumoniae (pneumococcal) and Haemophilus influenzae type b (Hib) were determined using efficacy results from pneumococcal conjugate vaccine and Hib vaccine clinical trials. Proportions were then multiplied by all-cause pneumonia deaths among children aged 1–59 months. 2The proportion of pneumonia cases due to RSV and influenza was determined through a literature search of laboratory testing and surveillance studies containing etiologic fractions. Etiologic fractions were then meta-analyzed by region, and then multiplied by region-specific all-cause pneumonia deaths. 3Influenza includes influenza A (seasonal and pandemic) and influenza B. 4All-cause pneumonia and diarrhea deaths were previously reported in Fadel et al. (2017). Etiologic fractions between pathogens are not additive and do not have a sum of 100. 5The proportion of diarrhea cases due to rotavirus was determined through a literature search of laboratory testing and surveillance studies containing etiologic fractions. Etiologic fractions were then meta-analyzed by region, and then multiplied by region-specific all-cause diarrhea deaths.
Table 4
Age-specific mortality rates and etiologic fractions of microbiologic etiologies and other syndromes of pneumonia and diarrhea in 2015 among Indian children aged 1–59 months.
https://doi.org/10.7554/eLife.46202.026| Region | Pneumonia mortality rate (per 1000 live births)1 | Etiologic fraction (%), (uncertainty range)2 | Diarrhea mortality rate (per 1000 live births)1 | Etiologic fraction (%), (uncertainty range)2 | |||||
|---|---|---|---|---|---|---|---|---|---|
| SPn3 | RSV4 | Influenza4 | Hib3 | Rotavirus4 | Diarrhea with fever and bloody stool3 | ||||
| Northeast | 9.50 | 40 (28–41) | 11 (8–15) | 6 (<1–17)4 | 7 (5–9) | 6.96 | 41 (33–49) | 12 | |
| Central | 5.36 | 38 (27–40) | 22 (15–30) | 16 (11–21) | 9 (6–12) | 3.80 | 22 (16–27) | 9 | |
| East | 4.40 | 41 (29–43) | 12 (5–20) | 6 (<1–17) | 4 (3–6) | 4.38 | 34 (19–52) | 5 | |
| North | 3.01 | 42 (30–44) | 25 (20–30) | 9 (3–18) | 3 (2–4) | 2.57 | 46 (37–56) | 8 | |
| West | 1.77 | 40 (29–43) | 18 (16–21) | 9 (6–14) | 6 (4–8) | 1.16 | 33 (25–41) | 7 | |
| South | 1.63 | 41 (29–43) | 35 (23–47) | 13 (10–17) | 5 (3–6) | 0.82 | 35 (30–41) | 4 | |
| India | 4.17 | 38 (27–39) | 19 (13–27) | 12 (7–19) | 7 (5–9) | 3.19 | 30 (21–40) | 8 | |
| EF Ratio (Highest: Lowest) | 1.11 | 3.18 | 2.67 | 3.00 | 2.09 | 3.00 | |||
| Pearson (vs. pneumonia) | −0.36 | −0.66 | 0.20 | 0.46 | Pearson (vs. diarrhea) | 0.12 | 0.73 | ||
-
11–59-month mortality rates were derived using estimates from Fadel et al. (2017). 2Etiologic fractions between pathogens are not additive and do not have a sum of 100. 3Etiologic fractions of Streptococcus pneumoniae (SPn), Haemophilus influenzae type b (Hib), and diarrhea with fever and bloody were calculated by dividing the estimated number of deaths by pathogen and administrative region by the total number of pneumonia or diarrhea deaths by administrative region. 4Etiologic fractions for respiratory syncytial virus (RSV), influenza, and rotavirus were determined with a meta-analysis of laboratory testing data by region. 5Given that no studies were identified describing influenza positivity in the Northeast region, the etiologic fraction for the East region (closest geographically) is substituted instead.
-
Table 4—source data 1
Regional meta-analysis of etiologic fractions for respiratory syncytial virus.
Studies reporting laboratory testing data were identified through a literature search of Ovid MEDLINE, Scopus, and Google Scholar. All studies described hospitalized children or children seeking care in emergency departments and reported data from 2005 onwards. Studies were meta-analyzed by administrative region using Stata’s metaprop package and visualized in RStudio. We weighted each study using the denominator of total number of laboratory tests in the respective study.
- https://doi.org/10.7554/eLife.46202.027
-
Table 4—source data 2
Regional meta-analysis of etiologic fractions for influenza.
Studies reporting laboratory testing data were identified through a literature search of Ovid MEDLINE, Scopus, and Google Scholar. All studies described hospitalized children or children seeking care in emergency departments and reported data from 2010 onwards. All studies included describe pandemic and seasonal influenza A and influenza B. Studies were meta-analyzed by administrative region using Stata’s metaprop package and visualized in RStudio. We weighted each study using the denominator of total number of laboratory tests in the respective study.
- https://doi.org/10.7554/eLife.46202.028
-
Table 4—source data 3
Regional meta-analysis of etiologic fractions for rotavirus.
Studies reporting laboratory testing data were identified through a literature search of Ovid MEDLINE, Scopus, and Google Scholar. All studies described hospitalized children or children seeking care in emergency departments and reported data from 2010 onwards. Studies were meta-analyzed by administrative region using Stata’s metaprop package and visualized in RStudio. We weighted each study using the denominator of total number of laboratory tests in the respective study.
- https://doi.org/10.7554/eLife.46202.029
Additional files
-
Source code 1
R code for pneumonia and diarrhea seasonality analyses.
- https://doi.org/10.7554/eLife.46202.030
-
Supplementary file 1
References for regional meta-analysis.
- https://cdn.elifesciences.org/articles/46202/elife-46202-supp1-v2.docx
-
Transparent reporting form
- https://doi.org/10.7554/eLife.46202.031
Download links
A two-part list of links to download the article, or parts of the article, in various formats.
Downloads (link to download the article as PDF)
Open citations (links to open the citations from this article in various online reference manager services)
Cite this article (links to download the citations from this article in formats compatible with various reference manager tools)
Seasonal variation and etiologic inferences of childhood pneumonia and diarrhea mortality in India
eLife 8:e46202.
https://doi.org/10.7554/eLife.46202


