Absolute quantification of cohesin, CTCF and their regulators in human cells
- Vienna Biocenter (VBC), Austria
- European Molecular Biology Laboratory (EMBL), Germany
- University of Oxford, United Kingdom
- Medical University of Vienna, Austria
Figures
Figure 1 with 4 supplements
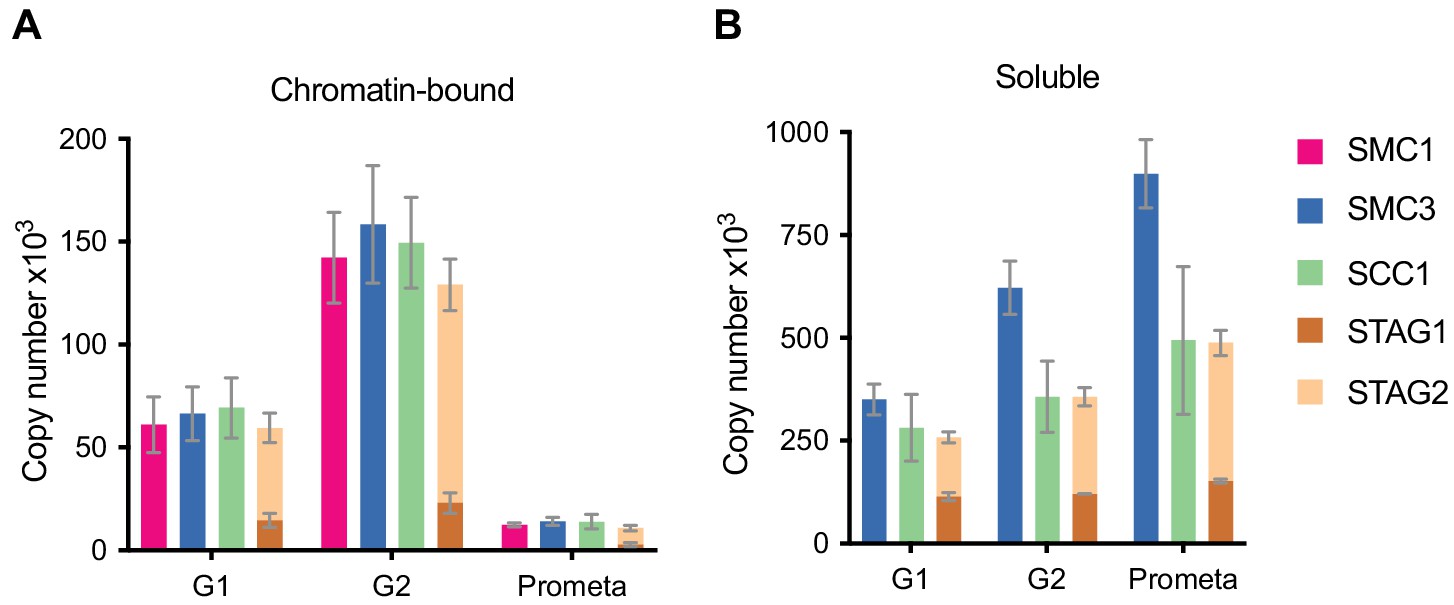
LC-MS quantification of cohesin subunit copy number.
Absolute quantification of cohesin subunits in (A) chromatin or (B) soluble extracts isolated from G1, G2 or prometaphase synchronised HeLa cells, adjusted for cell numbers to derive copy number per cell. Data are plotted as mean ± standard deviation from two biological replicates and two technical replicates. For absolute values and exceptions, see Table 1. For individual peptide counts, see Figure 1—figure supplement 2.
-
Figure 1—source data 1
The Microsoft Excel file lists all proteins identified by LC-MS in the SCC1 immunoprecipitations used to determine cohesin stoichiometry (Figure 1—figure supplements 3 and 4).
- https://doi.org/10.7554/eLife.46269.007
Figure 1—figure supplement 1
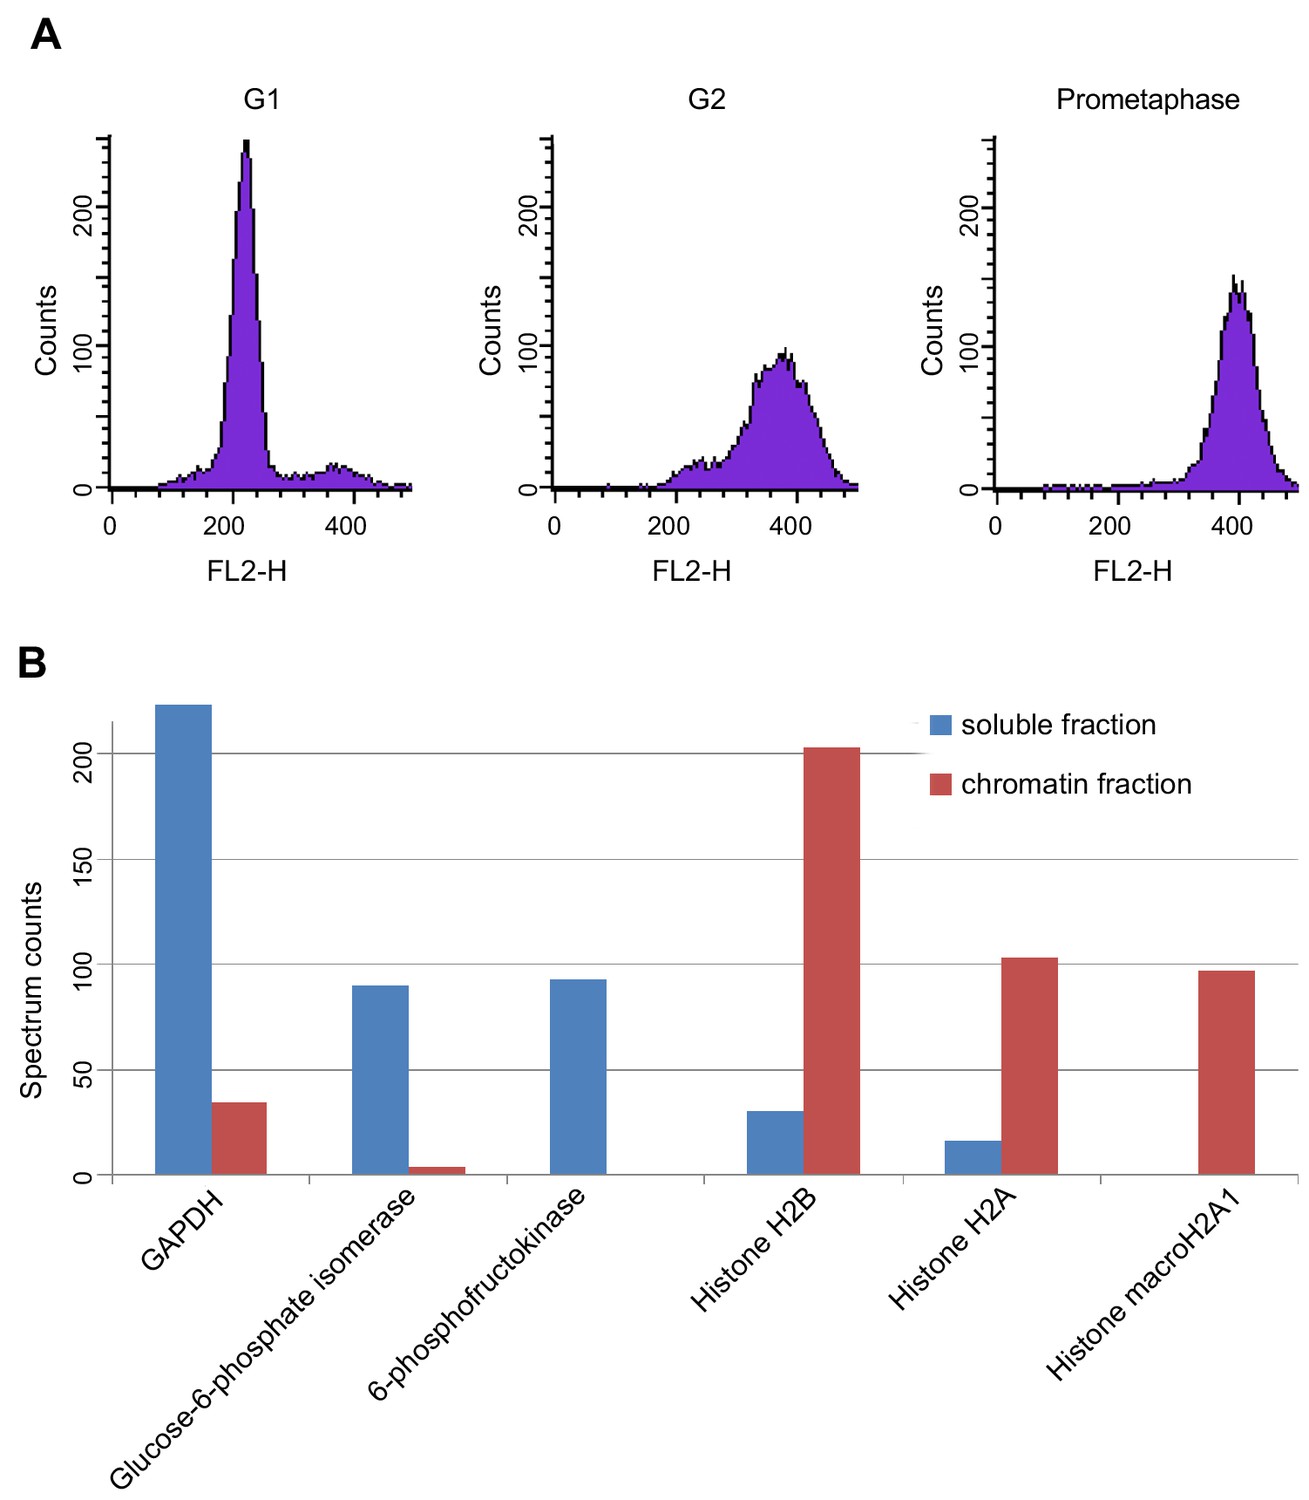
LC-MS cell synchronisation and fractionation efficiency.
(A) Fluorescence activated cell sorting (FACS) of propidium iodide-stained cells after cell synchronisation. The average synchrony (two biological replicates) of G1-, G2- and prometaphase-arrested cells were 95%, 85% and 92%, respectively. (B) Spectral counting in chromatin and soluble protein extracts. Glyceraldehyde-3-phosphate dehydrogenase (GAPDH), glucose-6-phosphate-isomerase and 6-phospho-frucotokinase (soluble protein markers) were largely depleted from chromatin extracts but were enriched 10- to 20-fold in soluble extracts. Histone H2B, H2A and macroH2A1 were strongly increased in chromatin extracts. For source data, see Figure 1—source data 1.
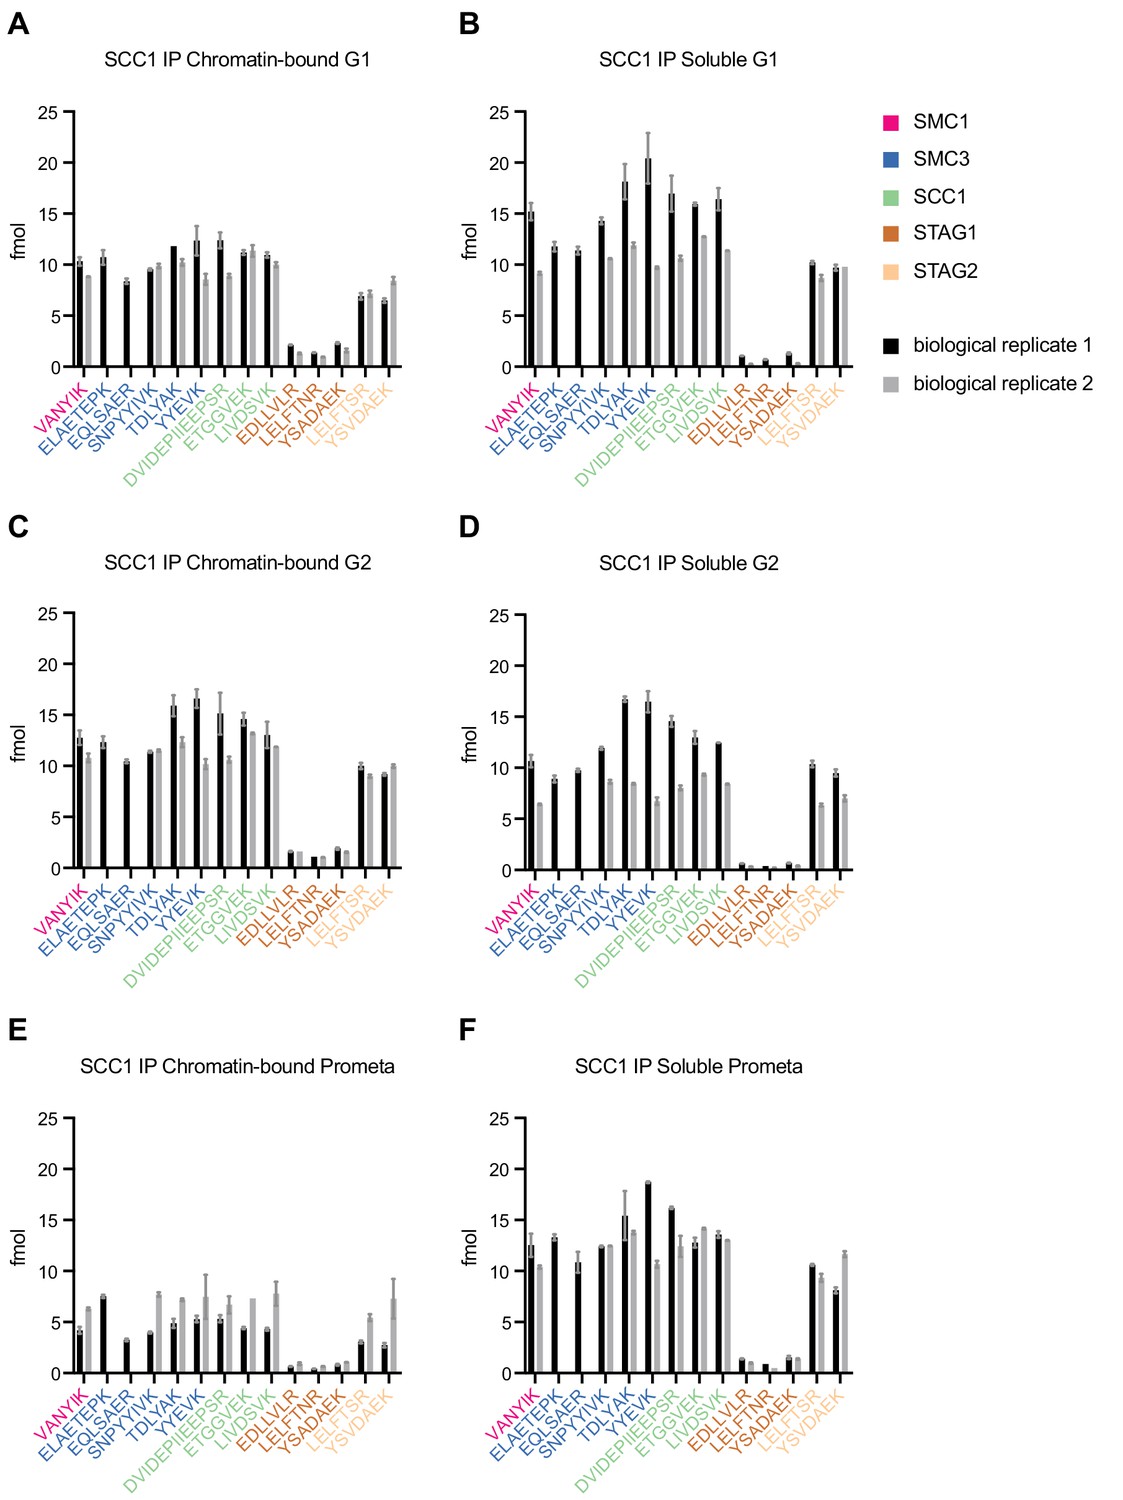
Figure 1—figure supplement 2
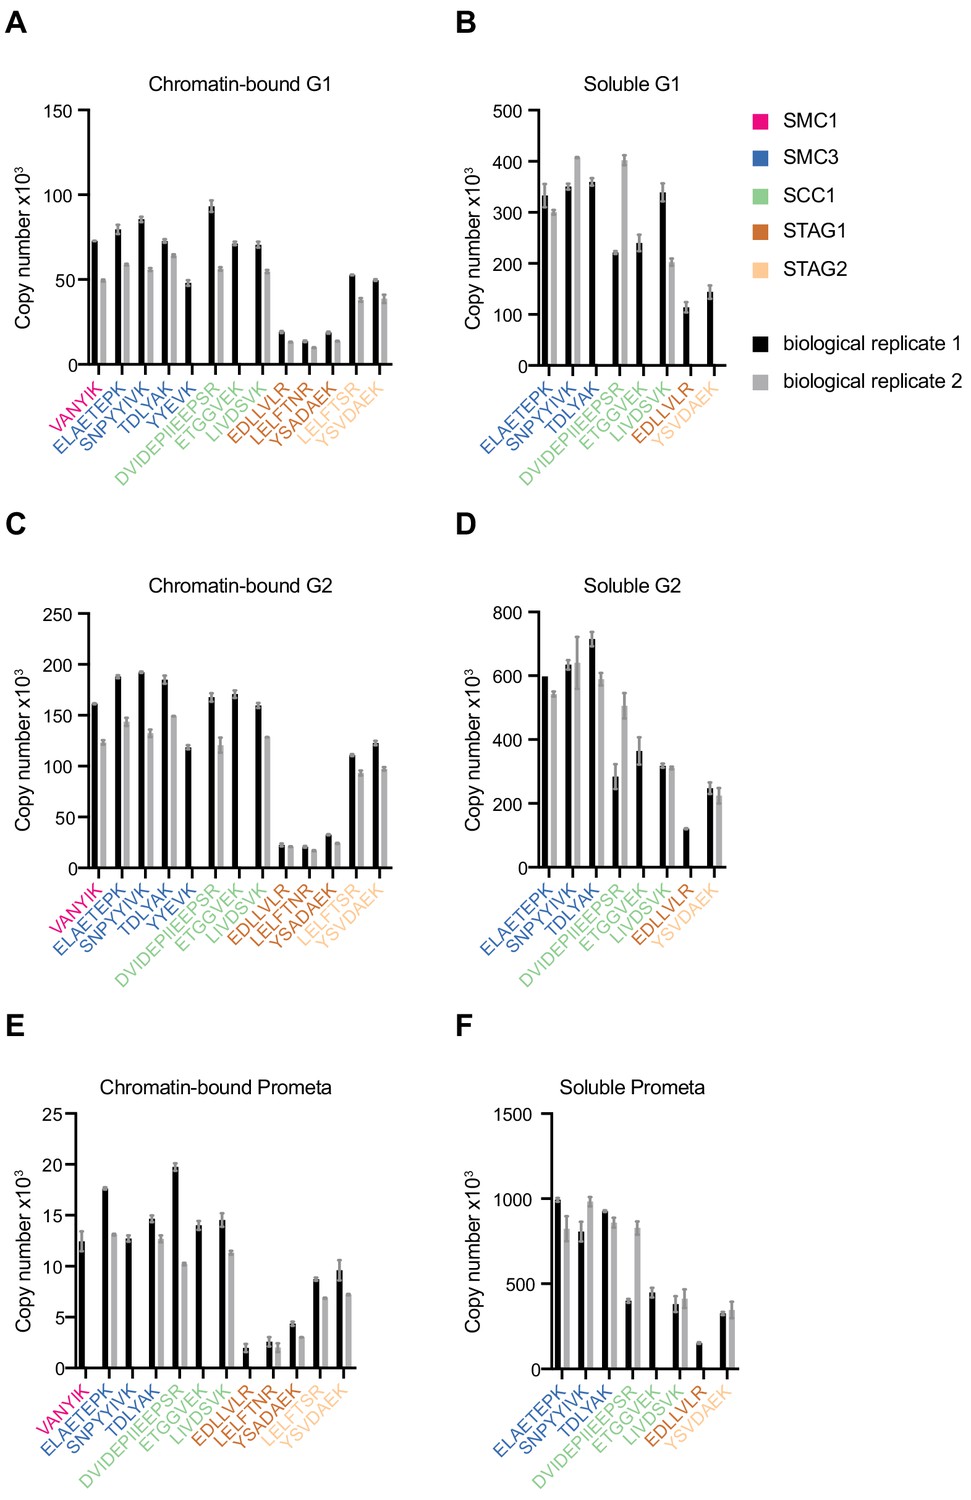
LC-MS quantification of cohesin subunit copy number.
Absolute quantification of individual SMC1, SMC3, SCC1, STAG1 and STAG2 peptides used to generate the mean cohesin subunit copy numbers shown in Figure 1 and Table 1. Data are plotted as mean ± standard deviation of two technical replicates. A single technical replicate was quantified for peptide ELAETEPK in G2 soluble extract.
Figure 1—figure supplement 3
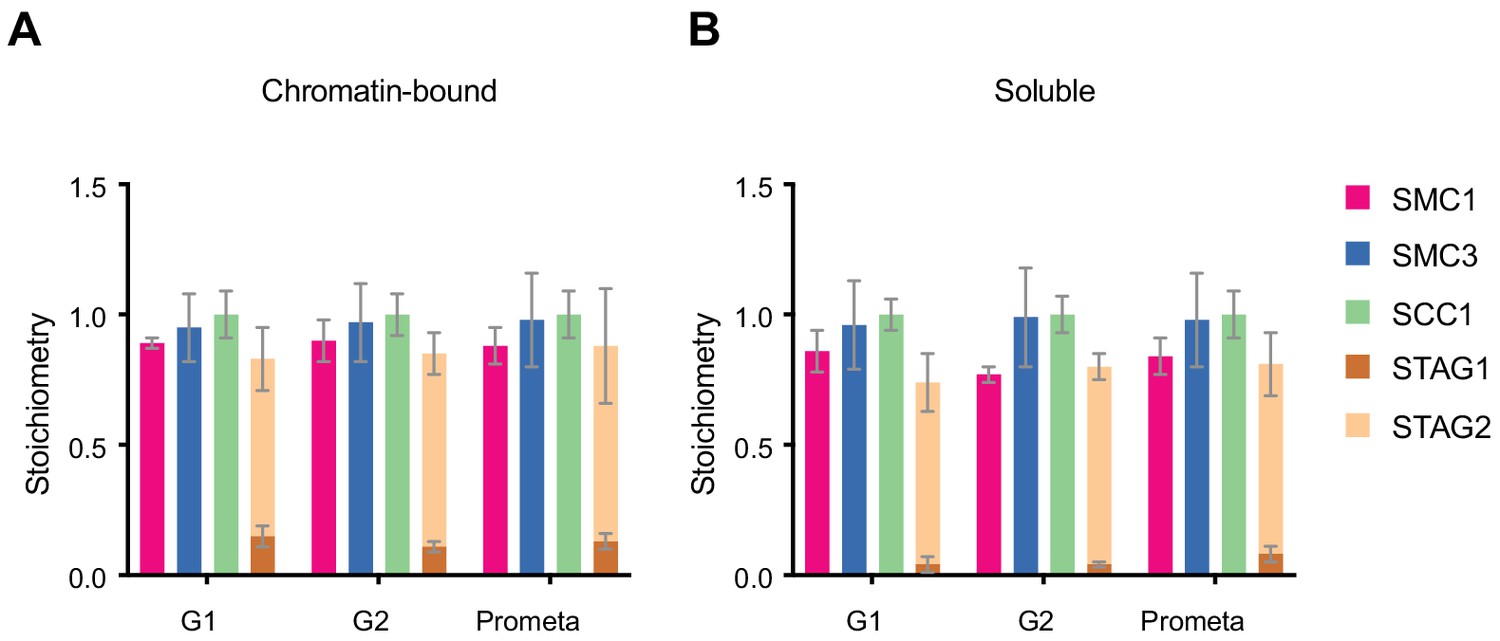
LC-MS quantification of cohesin subunit stoichiometry.
Quantification of cohesin subunits in SCC1 immunoprecipitates from (A) chromatin or (B) soluble extracts isolated from G1, G2 or prometaphase synchronised HeLa cells. Numbers are normalised relative to SCC1 abundance. Data are plotted as mean ± standard deviation of two biological replicates and two technical replicates. For absolute values and exceptions, see Appendix 1—table 2. For individual peptide counts, see Figure 1—figure supplement 4.
Figure 1—figure supplement 4
LC-MS quantification of cohesin subunit stoichiometry.
Absolute quantification of individual SMC1, SMC3, SCC1, STAG1 and STAG2 peptides used to generate the mean cohesin subunit ratios shown in Figure 1—figure supplement 3. Data are mean ± standard deviation of two technical replicates. A single technical replicate was quantified in one of the two biological replicates for peptides TDLYAK (G1 chromatin), YSVDAEK (G1 soluble), LELFTNR (G2 chromatin and soluble) and ETGGVEK (prometaphase chromatin). A single technical replicate was quantified in both of the biological replicates for peptide LELFTNR (prometaphase soluble).
Figure 2 with 1 supplement
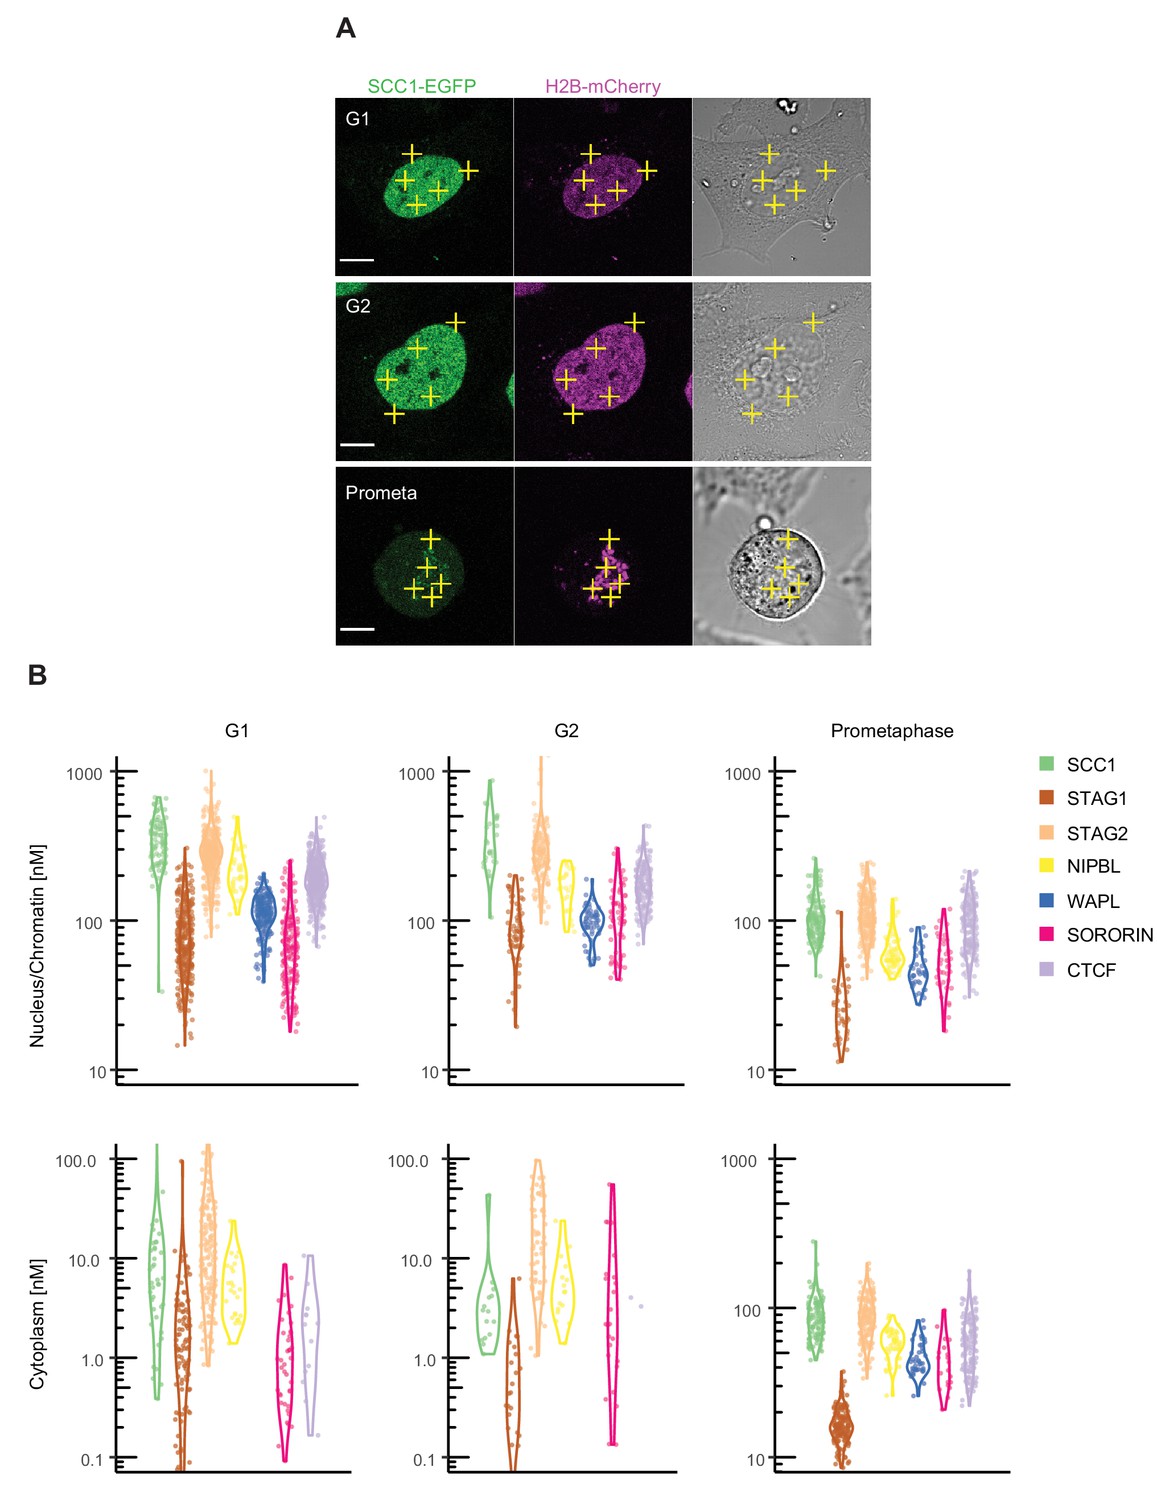
Fluorescence correlation spectroscopy of cohesin subunits and regulators.
FCS measurements to estimate the concentration of endogenously GFP-tagged proteins in the nucleus/chromatin and cytoplasm of G1, G2 and prometaphase cells. (A) FCS measurements were taken at different positions (three in the nucleus/chromatin, two in the cytoplasm) in cells in G1 (top), G2 (middle) or prometaphase (bottom), whereby photon counts were recorded for 30 s at each position. Example images for SCC1-EGFP H2B-mCherry in the GFP (left), DNA (middle) and transmission channels are shown. Scale bar: 10 µm. (B) Probability density violin plots of the GFP-based protein concentrations determined from each FCS measurement (dots) after data fitting and quality control. Note that the EGFP-sororin cell line displayed a mitotic defect, raising the possibility that EGFP-sororin may be hypomorphic. Data were derived from 2 to 4 experiments per condition, 16–254 cells, and 80–1270 FCS measurements. Data associated with this figure are included in Figure 2—source data 1.
-
Figure 2—source data 1
The zip file contains the data used to generate Figure 2 and Table 2, Appendix 1—tables 5 and 6.
- https://doi.org/10.7554/eLife.46269.011
Figure 2—figure supplement 1
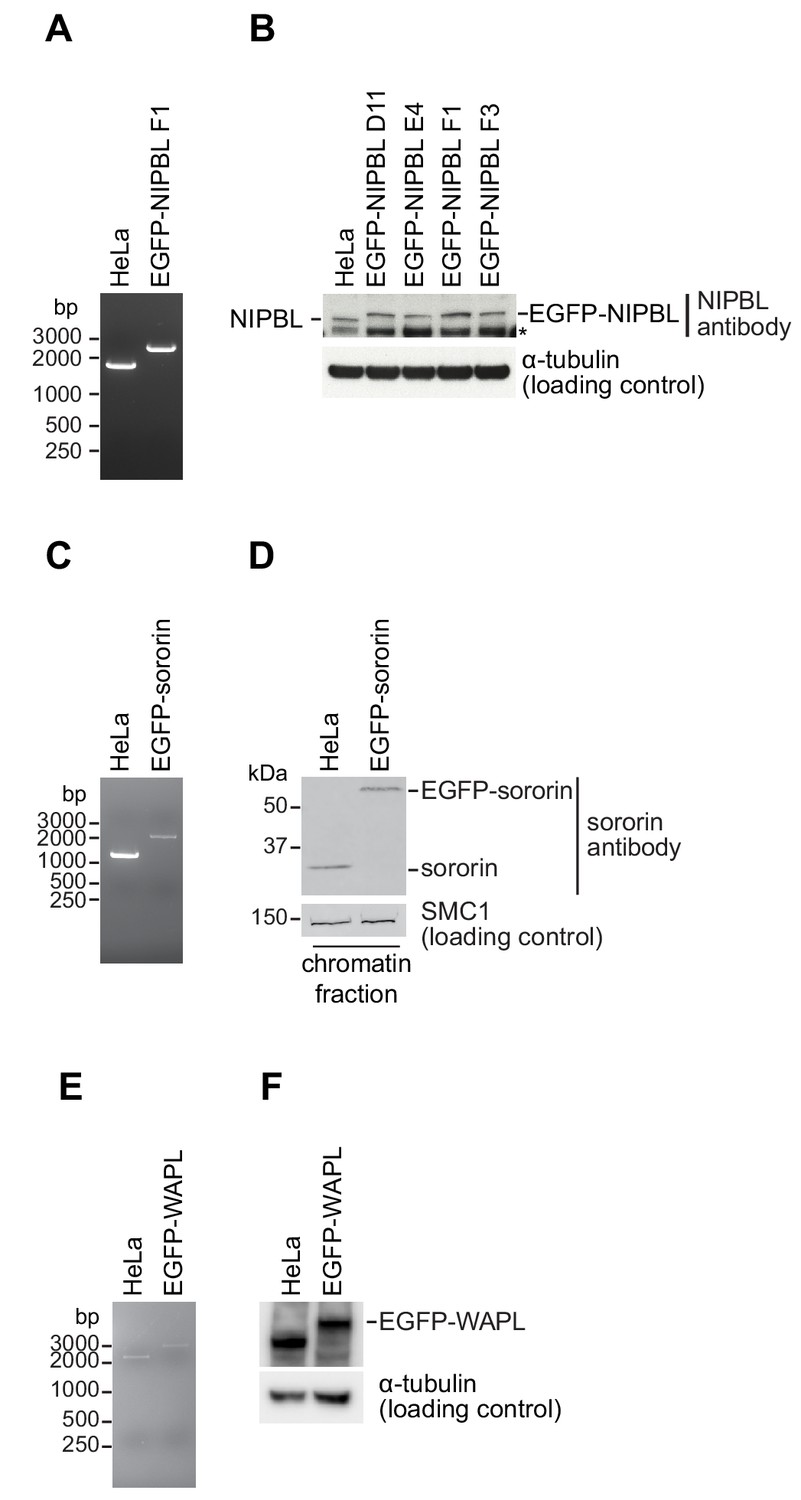
Cell line characterisation.
(A, C, E) PCR genotype analysis of parental and homozygous EGFP tagged HeLa cells used in this study. PCR primers annealed external to the homology arm that was used to insert EGFP in each cell line; a single larger PCR product in the tagged cell line relative to the parental cell line was consistent with homozygosity. (B) Immunoblotting analysis of whole-cell extracts from parental HeLa cells and four homozygously tagged EGFP-NIPBL HeLa cell lines. Clone F1 was used for all experiments. α-tubulin was used as a loading control. Asterisk denotes non-specific signal. (D) Immunoblotting analysis of chromatin extracts from parental HeLa cells and EGFP-sororin tagged HeLa cells. SMC1 was used as a loading control. Note that the EGFP-sororin cell line displayed a mitotic defect, raising the possibility that EGFP-sororin may be hypomorphic. (F) Immunoblotting analysis of whole-cell extracts from parental HeLa cells and EGFP-WAPL tagged HeLa cell line. α-tubulin was used as a loading control. Characterisation of the EGFP-STAG1, STAG1-EGFP and STAG2-EGFP cell lines will be published elsewhere. Characterisation of the SCC1-mEGFP and CTCF-EGFP cell lines was previously published (Davidson et al., 2016; Wutz et al., 2017).
Figure 3 with 1 supplement
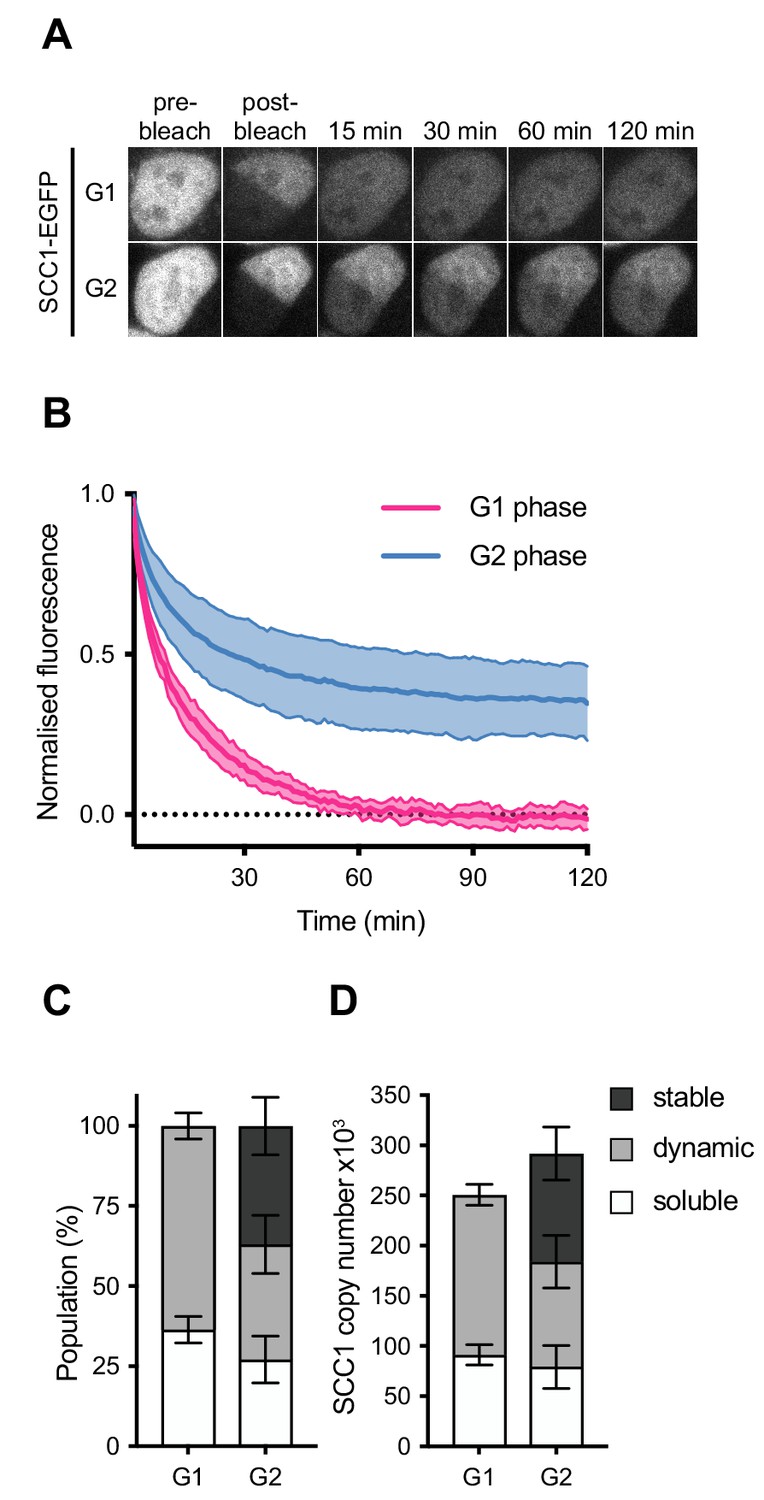
Dynamics and distribution of nuclear SCC1-mEGFP in G1 and G2 phase.
(A) Images of inverse fluorescence recovery after photobleaching (iFRAP) in SCC1-mEGFP cells in G1 and G2 phase (Figure 3—figure supplement 1A). Half of the nuclear SCC1-mEGFP fluorescent signal was photobleached and the mean fluorescence in the bleached and unbleached regions was monitored by time-lapse microscopy. (B) The difference in fluorescence signals between the bleached and unbleached regions was normalised to the first post bleach image and plotted (mean ± S.D., n = 19 per condition). (C) SCC1-mEGFP distribution in the nucleus in G1 and G2 phase. Dynamic and stable populations were estimated using curve fittings from Figure 3—figure supplement 1B,C. Soluble populations were estimated by measuring the reduction in signal intensity in the unbleached area after bleaching (Figure 3—figure supplement 1G). (D) FCS/FRAP estimates of soluble, dynamic and stable nuclear SCC1-mEGFP copy number (see Table 3 for exact values).
Figure 3—figure supplement 1
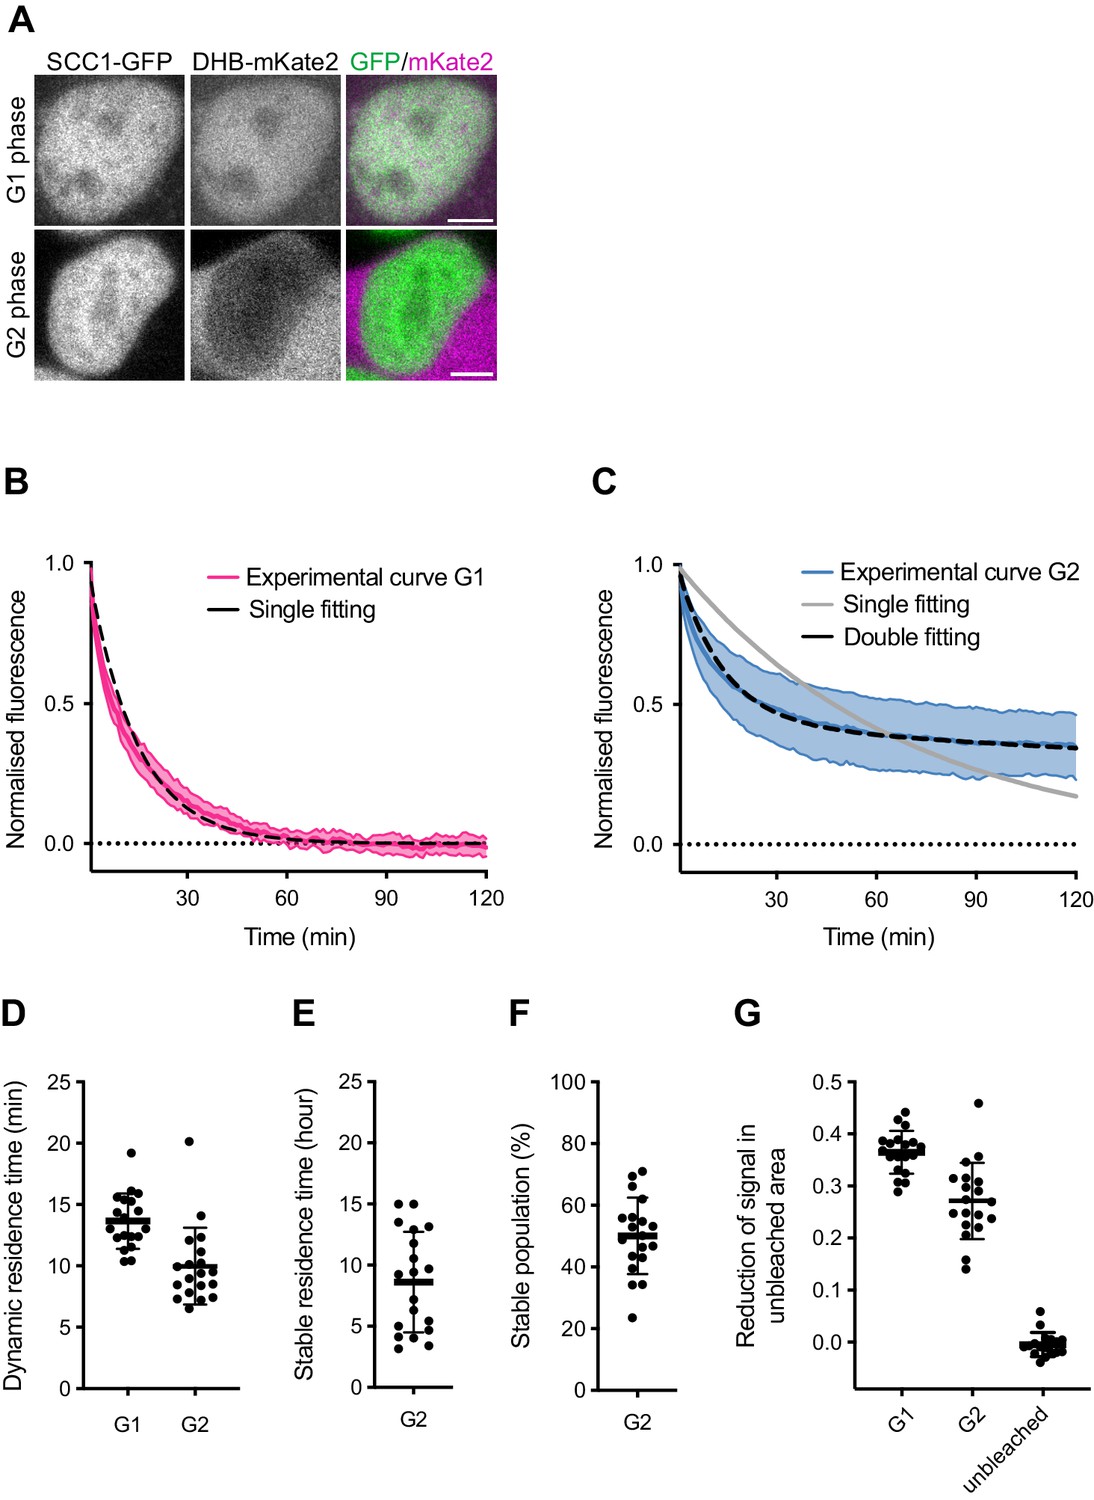
Dynamics and distribution of nuclear SCC1-mEGFP in G1 and G2 phase.
(A) Images of SCC1-mEGFP cells in G1 and G2 phase, as distinguished by nuclear (G1) and cytoplasmic (G2) distribution of DHB-mKate2. Scale bar: 10 μm. (B) Curve fitting to experimental iFRAP curves obtained from G1 phase using a single exponential function (dashed black line). (C) Curve fitting to experimental iFRAP curves obtained from G2 phase by a single exponential function (dashed cyan line) and double exponential functions (dashed black line). (D) Residence times of dynamically bound SCC1-mEGFP in G1 and G2 were measured from individual curves by a single exponential function in (B) and by double exponential functions in (C), respectively, and plotted (mean ± S.D.). (E) Residence time of stably-bound SCC1-mEGFP measured from individual curves by double exponential functions in (C) and plotted (mean ± S.D.). Dots indicate individual cells. (F) Population of stably-bound SCC1-mEGFP expressed as a percentage of total chromatin-bound SCC1-mEGFP, measured from individual curves by double exponential functions in (C) and plotted (mean ± S.D.). Dots indicate individual cells. (G) Reduction of fluorescent signals in unbleached area after photobleaching was quantified and plotted (mean ± S.D.). ‘unbleached’ shows the reduction in nuclear fluorescent signal in cells not subjected to iFRAP within the same experiment. Dots indicate individual cells.
Figure 4
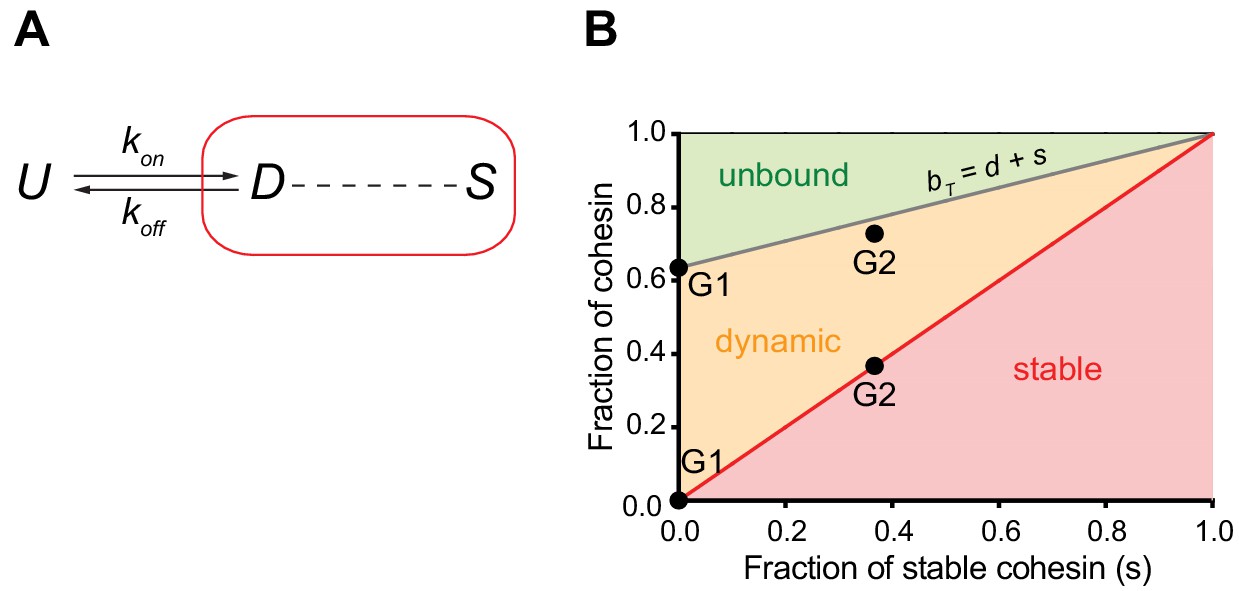
Mathematical model of cohesin chromatin binding in G1 and G2 phase.
(A) Model describing transitions between unbound (U), dynamic (D) and stable (S) forms of nuclear cohesin. The ‘k’s refer to the first order rate constants (with a dimension of time−1) of individual transitions. (B) Equilibrium distribution of the unbound and dynamic forms of cohesin as a function of the stable fraction. The grey line represents the fraction of nuclear cohesin that is chromatin-bound (BT). The red line represents the fraction of nuclear cohesin that is stably chromatin-bound (S). The black dots represent the experimentally observed values of BT and S in G1 and G2.
Figure 5
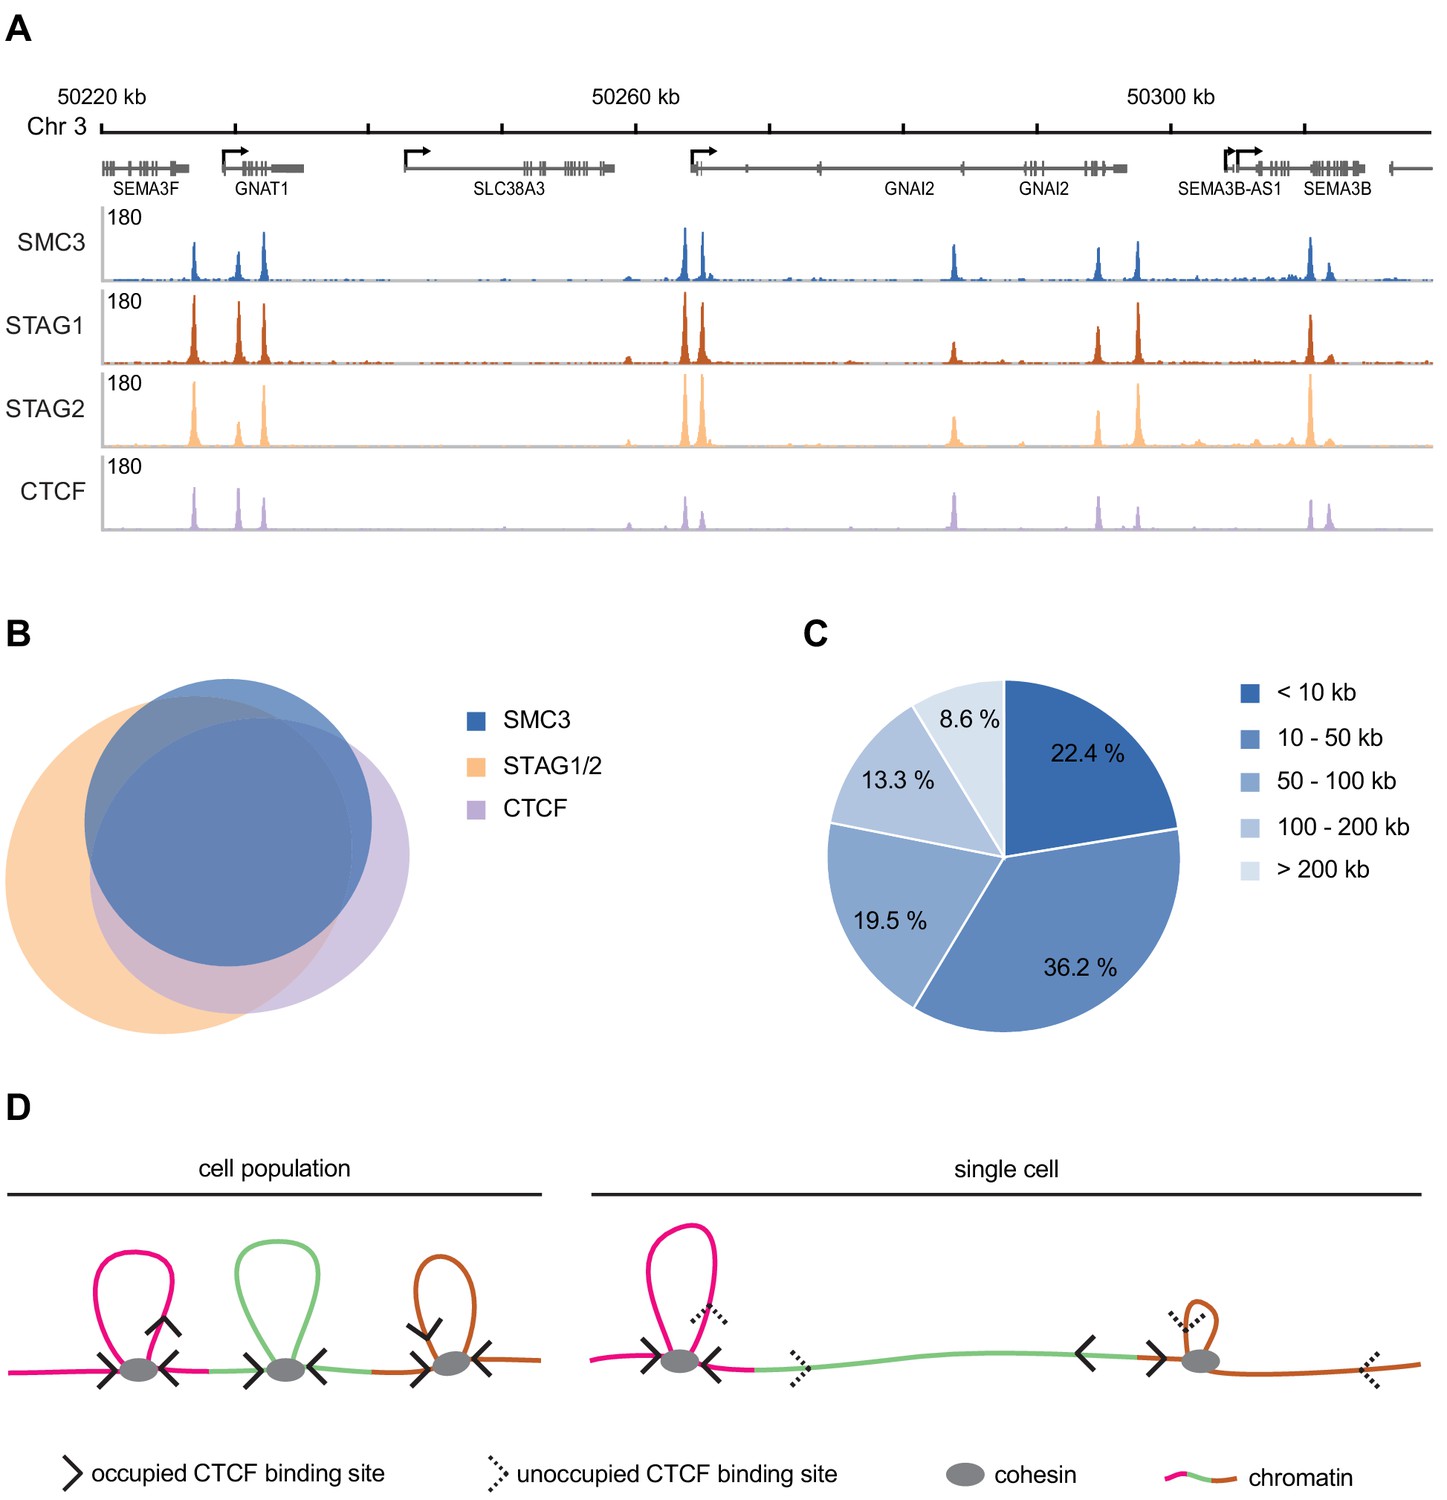
Genomic distribution of SMC3, STAG1, STAG2 and CTCF in G1 phase.
(A) Enrichment profiles of SMC3, STAG1, STAG2 and CTCF along an exemplary 100 kb region of chromosome 3, illustrating typical distribution and co-localisation of sequencing read pileups. Genes within this region are depicted above. SMC3 and CTCF were immunoprecipitated from HeLa Kyoto using anti-SMC3 and anti-CTCF antibodies, respectively. EGFP-STAG1 and STAG2-EGFP were immunoprecipitated from the respective genome-edited cell lines using anti-GFP antibodies. (B) Area-proportional threefold eulerAPE Venn diagram (www.eulerdiagrams.org/eulerAPE/) illustrating genome-wide co-localisation between SMC3, CTCF, and the combined set of STAG1 and STAG2 coordinates. (C) Pie chart depicting categories of pairwise genomic distances between SMC3 enrichment sites. (D) Schematic comparing the occupancy of cohesin and CTCF across a cell population and within a single cell. Incomplete occupation of cohesin and CTCF binding sites can explain why chromatin loops are not uniform and how cohesin can ‘skip’ past CTCF binding sites.
Tables
Table 1
LC-MS quantification of cohesin subunit copy number.
Absolute quantification of cohesin subunits in chromatin or soluble extracts isolated from G1, G2 or prometaphase synchronised HeLa cells, adjusted for cell number. Data are tabulated as [mean - s.d., mean + s.d.] of two biological replicates and two technical replicates (s.d. = standard deviation). Values in bold or italics derive from quantification of one peptide or two peptides, respectively. Underlined values derive from quantification of a single biological replicate. For individual peptide counts, see Figure 1—figure supplement 2.
| G1 | G2 | Prometaphase | ||||
|---|---|---|---|---|---|---|
| Protein | Chromatin-bound | Soluble | Chromatin-bound | Soluble | Chromatin-bound | Soluble |
| SMC1 | 61125 [47609, 74640] | - | 142290 [120274, 164306] | - | 12461 [11497, 13425] | - |
| SMC3 | 66430 [53421, 79440] | 350228 [312360, 388095] | 158478 [129846, 187111] | 622117 [557712, 686522] | 14165 [12173, 16158] | 899510 [816643, 982376] |
| SCC1 | 69275 [54577, 83972] | 281140 [199837, 362444] | 149500 [127373, 171627] | 356850 [270483, 443217] | 13973 [10478, 17468] | 494155 [314240, 674070] |
| STAG1 | 14718 [11295, 18140] | 114355 [104557, 124152] | 23017 [17947, 28087] | 120960 [119860, 122061] | 2797 [1842, 3752] | 152033 [147488, 156577] |
| STAG2 | 44812 [37745, 51879] | 144160 [131233, 157086] | 106106 [93591, 118621] | 235980 [213879, 258081] | 8112 [6863, 9361] | 336062 [305203, 366922] |
Table 2
FCS quantification of copy number of cohesin subunits and regulators.
Absolute copy number of cohesin subunits and regulators obtained from FCS protein concentration measurements in the nucleus/chromatin and cytoplasmic compartment of cells (Figure 2—source data 1). Copy numbers were calculated by multiplying the protein concentrations by the cell cycle-specific volume of the respective cellular compartment and Avagadro’s constant as described in Materials and Methods. Missing or italicised numbers indicate that the number of successful FCS measurements was not sufficient to estimate the protein concentration. Note that the EGFP-sororin cell line displayed a mitotic defect, raising the possibility that EGFP-sororin may be hypomorphic. Data are tabulated as the median. The 68% interval of the distribution is listed in brackets.
| G1 | G2 | Prometaphase | ||||
|---|---|---|---|---|---|---|
| Protein | nucleus/chromatin | cytoplasm | nucleus/chromatin | cytoplasm | nucleus/chromatin | cytoplasm |
| SCC1 | 250755 [160752; 387511] | 10690 [2426; 28277] | 291939 [228902; 547040] | 6279 [2917; 9460] | 52195 [35147; 72881] | 203259 [138338; 303046] |
| STAG1 | 50062 [26338; 95212] | 1738 [419; 6726] | 90712 [59923; 152640] | 1048 [359; 3369] | 10714 [6958; 16682] | 34860 [26096; 50824] |
| STAG2 | 221261 [158694; 291715] | 18168 [5571; 59386] | 281503 [202964; 384802] | 29080 [9410; 92086] | 67163 [46974; 105183] | 249048 [183810; 360561] |
| NIPBL | 146764 [107180; 202180] | 7314 [3462; 13262] | 162915 [101109; 218244] | 10537 [4819; 18812] | 32357 [22248; 44222] | 135313 [114223; 172737] |
| WAPL | 91114 [68317; 115878] | - | 100084 [70256; 125633] | - | 20196 [13253; 30023] | 88677 [68173; 141144] |
| SORORIN | 44396 [21054; 84541] | 1216 [363; 3551] | 104939 [40639; 163976] | 4580 [832; 27180] | 25099 [16846; 38736] | 103462 [61909; 139749] |
| CTCF | 181157 [131295; 259610] | 3671 [1192; 6294] | 206494 [157309; 284756] | 9708 [9256; 10160] | 51898 [32725; 80216] | 143505 [87355; 243766] |
Table 3
FCS/iFRAP estimates of soluble, dynamic and stable nuclear SCC1-mEGFP copy number.
Copy numbers were calculated by multiplying the median nuclear FCS copy number measurements (Table 2) by the average and s.d. population fractions as determined by iFRAP (Figure 3C).
| Copy number | ||
|---|---|---|
| G1 | G2 | |
| soluble | 91318 ± 10277 | 79239 ± 21371 |
| dynamic | 159437 ± 10277 | 104952 ± 26360 |
| stable | 0 | 107748 ± 26360 |
| total | 250755 | 291939 |
Key resources table
| Reagent type (species) or resource | Designation | Source or reference | Identifiers | Additional information |
|---|---|---|---|---|
| Cell line (H. sapiens) | HK CRISPR SCC1-mEGFP + H2B-mCherry | parental genome-edited cell line from Davidson et al. (2016) | ||
| Cell line (H. sapiens) | HK CRISPR EGFP-STAG1 | this paper | See Materials and methods subsection ‘Generation of EGFP-tagged NIPBL and STAG1 HeLa Kyoto cell lines’ | |
| Cell line (H. sapiens) | HK CRISPR STAG1-EGFP H8 + H2B-mCherry | parental genome-edited cell line from Cai et al. (2018) | ||
| Cell line (H. sapiens) | HK CRISPR STAG2-EGFP F2 + H2B-mCherry | parental genome-edited cell line from Cai et al. (2018) | ||
| Cell line (H. sapiens) | HK CRISPR EGFP-NIPBL F1 + H2B-mCherry | this paper | See Figure 2—figure supplement 1 and Materials and methods subsection ‘Generation of EGFP-tagged NIPBL and STAG1 HeLa Kyoto cell lines’ | |
| Cell line (H. sapiens) | HK CRISPR EGFP-WAPL H3 + H2B-mCherry | parental genome-edited cell line from Ladurner et al. (2016); Cai et al. (2018) | See Figure 2—figure supplement 1 | |
| Cell line (H. sapiens) | HK CRISPR EGFP-SORORIND3 + H2B-mCherry | parental genome-edited cell line from Ladurner et al. (2016) | See Figure 2—figure supplement 1 | |
| Cell line (H. sapiens) | HK CRISPR CTCF-EGFP F2 | Wutz et al. (2017); Cai et al. (2018) | ||
| Cell line (H. sapiens) | HK H2B-mCherry | Neumann et al. (2010) | ||
| Antibody | Rabbit polyclonal Anti-SMC3 | Peters laboratory | Antibody ID:k727 | ChIP, Figure 5 |
| Antibody | Rabbit polyclonal Anti-CTCF | Merck | Cat #:07–729 RRID:AB_441965 | ChIP, Figure 5 |
| Antibody | Rabbit polyclonal Anti-WAPL | Peters laboratory | Antibody ID:A1017 | Western blotting (1:1000), Figure 2—figure supplement 1 |
| Antibody | Rabbit polyclonal Anti-sororin | Peters laboratory | Antibody ID:A953 | Western blotting (1:1000), Figure 2—figure supplement 1 |
| Antibody | Rat polyclonal Anti-NIPBL | Absea | Cat #:010702F01 | Western blotting (1:1000), Figure 2—figure supplement 1 |
| Antibody | Mouse monoclonal Anti-tubulin | Sigma | Cat #:T-5168 RRID:AB_477579 | Western blotting (1:50000), Figure 2—figure supplement 1 |
| Antibody | Rabbit polyclonal Anti-GFP | Abcam | Cat #:ab290 RRID:AB_303395 | ChIP, Figure 5 |
Appendix 1—table 1
Peptide list.
Isotopically labelled reference peptides used to quantify cohesin subunit abundance and stoichiometry in HeLa cells. Note that SMC3 peptide ELAETEPK was replaced with peptide EQLSAER in one of the two SCC1 immunoprecipitation experiments.
| Protein | Peptide sequence |
|---|---|
| SMC1 | VANYIK |
| SMC3 | ELAETEPK |
| SMC3 | EQLSAER |
| SMC3 | SNPYYIVK |
| SMC3 | TDLYAK |
| SMC3 | YYEVK |
| SCC1 | DVIDEPIIEEPSR |
| SCC1 | ETGGVEK |
| SCC1 | LIVDSVK |
| STAG1 | EDLLVLR |
| STAG1 | LELFTNR |
| STAG1 | YSADAEK |
| STAG2 | LELFTSR |
| STAG2 | YSVDAEK |
Appendix 1—table 2
LC-MS quantification of cohesin complex stoichiometry.
Quantification of cohesin subunits in SCC1 immunoprecipitates from chromatin or soluble extracts isolated from G1, G2 or prometaphase synchronised HeLa cells. Numbers are normalised relative to SCC1 abundance. Data are tabulated as mean [mean – s.d., mean + s.d.] from two biological replicates and two technical replicates. For individual peptide counts, see Figure 1—figure supplement 4.
| G1 | G2 | Prometaphase | ||||
|---|---|---|---|---|---|---|
| Protein | chromatin-bound | Soluble | chromatin-bound | Soluble | chromatin-bound | Soluble |
| SMC1 | 0.89 [0.87, 0.91] | 0.86 [0.78, 0.94] | 0.9 [0.82, 0.98] | 0.77 [0.74, 0.8] | 0.88 [0.81, 0.95] | 0.84 [0.77, 0.91] |
| SMC3 | 0.95 [0.82, 1.08] | 0.96 [0.79, 1.13] | 0.97 [0.82, 1.12] | 0.99 [0.8, 1.18] | 0.98 [0.8, 1.16] | 0.98 [0.8, 1.16] |
| SCC1 | 1 [0.91, 1.09] | 1 [0.94, 1.06] | 1 [0.92, 1.08] | 1 [0.93, 1.07] | 1 [0.91, 1.09] | 1 [0.91, 1.09] |
| STAG1 | 0.15 [0.11, 0.19] | 0.04 [0.01, 0.07] | 0.11 [0.09, 0.13] | 0.04 [0.03, 0.05] | 0.13 [0.1, 0.16] | 0.08 [0.05, 0.11] |
| STAG2 | 0.68 [0.56, 0.8] | 0.7 [0.59, 0.81] | 0.74 [0.66, 0.82] | 0.76 [0.71, 0.81] | 0.75 [0.53, 0.97] | 0.73 [0.61, 0.85] |
Appendix 1—table 3
Protein concentration of cohesin subunits and regulators as measured by FCS.
Concentration of proteins in nM obtained from FCS measurements in the nucleus/chromatin (identified by the H2B-mCherry or SiR-DNA signal) and cytoplasmic compartment of cells. In G1 and G2 phase the protein concentrations in the cytoplasm were close to or below the detection limit, leading to >70% failed quality control (Figure 2—source data 1). Missing or italicised numbers indicate that the number of successful FCS measurements was not sufficient to estimate the protein concentration. Note that the EGFP-sororin cell line displayed a mitotic defect, raising the possibility that EGFP-sororin may be hypomorphic. Data are tabulated as the median; the 68% interval of the distribution is listed in brackets.
| G1 | G2 | Prometaphase | ||||
|---|---|---|---|---|---|---|
| Protein | nucleus/chromatin | cytoplasm | nucleus/chromatin | cytoplasm | nucleus/chromatin | cytoplasm |
| SCC1 | 332.00 [235.46; 464.19] | 5.65 [1.56; 14.57] | 290.03 [232.68; 494.03] | 2.92 [1.52; 4.73] | 98.55 [75.46; 135.37] | 83.40 [61.79; 109.13] |
| STAG1 | 70.53 [41.61; 128.47] | 1.32 [0.28; 3.79] | 85.12 [65.32; 141.73] | 0.45 [0.17; 1.53] | 24.15 [16.23; 35.94] | 15.95 [12.90; 21.11] |
| STAG2 | 282.54 [204.85; 375.89] | 11.58 [3.48; 37.06] | 281.55 [201.39; 372.99] | 14.14 [4.65; 44.77] | 105.42 [76.14; 149.19] | 85.54 [60.34; 116.91] |
| NIPBL | 196.95 [158.06; 300.70] | 4.74 [2.40; 9.11] | 166.18 [115.84; 223.47] | 4.58 [2.53; 9.64] | 56.83 [48.74; 75.62] | 59.53 [45.93; 69.90] |
| WAPL | 114.27 [86.52; 143.70] | - | 98.07 [80.84; 116.29] | - | 43.85 [35.51; 64.59] | 43.71 [37.76; 61.59] |
| SORORIN | 64.92 [35.49; 103.77] | 0.90 [0.30; 2.38] | 110.83 [53.43; 178.44] | 2.17 [0.44; 13.05] | 50.60 [35.37; 78.17] | 40.76 [29.19; 61.15] |
| CTCF | 187.65 [143.48; 247.89] | 2.16 [0.55; 3.36] | 166.60 [121.77; 226.64] | 3.65 [3.40; 3.91] | 93.18 [60.86; 136.82] | 57.51 [34.12; 85.08] |
Appendix 1—table 4
Ratio of counts per molecule of EGFP-tagged proteins and monomeric mEGFP.
Distributions were estimated by bootstrapping the experimental measurements (100,000 repetitions with replacement). Data are tabulated as the median; the 68% interval of the distribution is listed in brackets.
| G1 | G2 | Prometaphase | ||||
|---|---|---|---|---|---|---|
| Protein | nucleus/chromatin | cytoplasm | nucleus/chromatin | cytoplasm | nucleus/chromatin | cytoplasm |
| SCC1 | 0.79 [0.58, 1.20] | 0.79 [0.58, 1.19] | 0.85 [0.60, 1.31] | 0.85 [0.60, 1.31] | 0.85 [0.63, 1.10] | 0.85 [0.63, 1.10] |
| STAG1 | 0.66 [0.39, 0.92] | 0.66 [0.39, 0.93] | 0.61 [0.19, 0.90] | 0.61 [0.19, 0.90] | 1.09 [0.81, 1.30] | 1.09 [0.80, 1.30] |
| STAG2 | 0.92 [0.60, 1.19] | 0.92 [0.60, 1.18] | 0.94 [0.56, 1.19] | 0.94 [0.56, 1.19] | 1.07 [0.75, 1.31] | 1.07 [0.75, 1.31] |
| NIPBL | 1.01 [0.74, 1.57] | 1.01 [0.74, 1.57] | 0.96 [0.72, 1.28] | 0.96 [0.72, 1.28] | 0.91 [0.65, 1.28] | 0.90 [0.65, 1.27] |
| WAPL | 1.15 [0.90, 1.51] | 1.15 [0.90, 1.51] | 1.21 [0.99, 1.57] | 1.21 [0.99, 1.57] | 0.87 [0.66, 1.06] | 0.87 [0.66, 1.06] |
| SORORIN | 1.14 [0.83, 1.62] | 1.14 [0.83, 1.61] | 1.07 [0.75, 1.67] | 1.07 [0.75, 1.67] | 0.67 [0.44, 0.88] | 0.67 [0.44, 0.89] |
| CTCF | 0.87 [0.69, 1.08] | 0.87 [0.69, 1.08] | 0.74 [0.57, 0.96] | 0.74 [0.57, 0.96] | 0.85 [0.65, 1.03] | 0.85 [0.65, 1.03] |
Appendix 1—table 5
Ratio of total protein copy number as estimated by FCS and LC-MS.
Distributions were estimated by bootstrapping the experimental measurements (100,000 repetitions with replacement). Data are tabulated as the median; the 68% interval of the distribution is listed in brackets.
| G1 | G2 | Prometaphase | |
|---|---|---|---|
| Protein | Ratio FCS:LC-MS | Ratio FCS:LC-MS | Ratio FCS:LC-MS |
| SCC1 | 1.26 [0.79, 2.07] | 1.49 [0.89, 2.20] | 1.80 [1.21, 2.87] |
| STAG1 | 2.36 [1.25, 4.33] | 1.53 [0.93, 2.33] | 3.29 [2.37, 4.24] |
| STAG2 | 0.76 [0.55, 1.04] | 1.04 [0.76, 1.45] | 1.04 [0.77, 1.37] |
Appendix 1—table 6
Number of peaks called following SMC3, STAG1, STAG2 and CTCF ChIP-Seq in G1 phase.
Peaks called using MACS peak caller version 1.4.2 with a p-value threshold of 1e-10.
| Protein | Number of ChIP-seq peaks |
|---|---|
| SMC3 | 36713 |
| STAG1 | 35068 |
| STAG2 | 47063 |
| CTCF | 41502 |
Appendix 1—table 7
Counts of solitary and co-localising peaks called following SMC3, STAG1, STAG2 and CTCF ChIP-Seq in G1 phase.
SMC3, CTCF, and the combined set of STAG1 and STAG2 Chip-seq peaks identified in G1 HeLa cells. All subsets are shown.
| Overlap | Number of ChIP-seq peaks |
|---|---|
| SMC3 alone | 1895 |
| STAG1/2 alone | 13718 |
| CTCF alone | 5842 |
| SMC3 + STAG1/2 | 4234 |
| SMC3 + CTCF | 2286 |
| STAG1/2 + CTCF | 5402 |
| SMC3 + STAG1/2 + CTCF | 27725 |
Additional files
-
Transparent reporting form
- https://doi.org/10.7554/eLife.46269.018
Download links
A two-part list of links to download the article, or parts of the article, in various formats.
Downloads (link to download the article as PDF)
Open citations (links to open the citations from this article in various online reference manager services)
Cite this article (links to download the citations from this article in formats compatible with various reference manager tools)
Absolute quantification of cohesin, CTCF and their regulators in human cells
eLife 8:e46269.
https://doi.org/10.7554/eLife.46269


