Auto-regulation of Rab5 GEF activity in Rabex5 by allosteric structural changes, catalytic core dynamics and ubiquitin binding
- Max Planck Institute of Molecular Cell Biology and Genetics, Germany
- German Center for Neurodegenerative Diseases, Germany
- Heidelberg University, Germany
- Heidelberg University Biochemistry Centre (BZH), Germany
- Technical University Dresden, Germany
- Max Planck Institute for Developmental Biology, Germany
- Max Planck Institute for Biophysical Chemistry, Germany
- University of Göttingen, Germany
- University of Tübingen, Germany
Figures
Figure 1 with 2 supplements
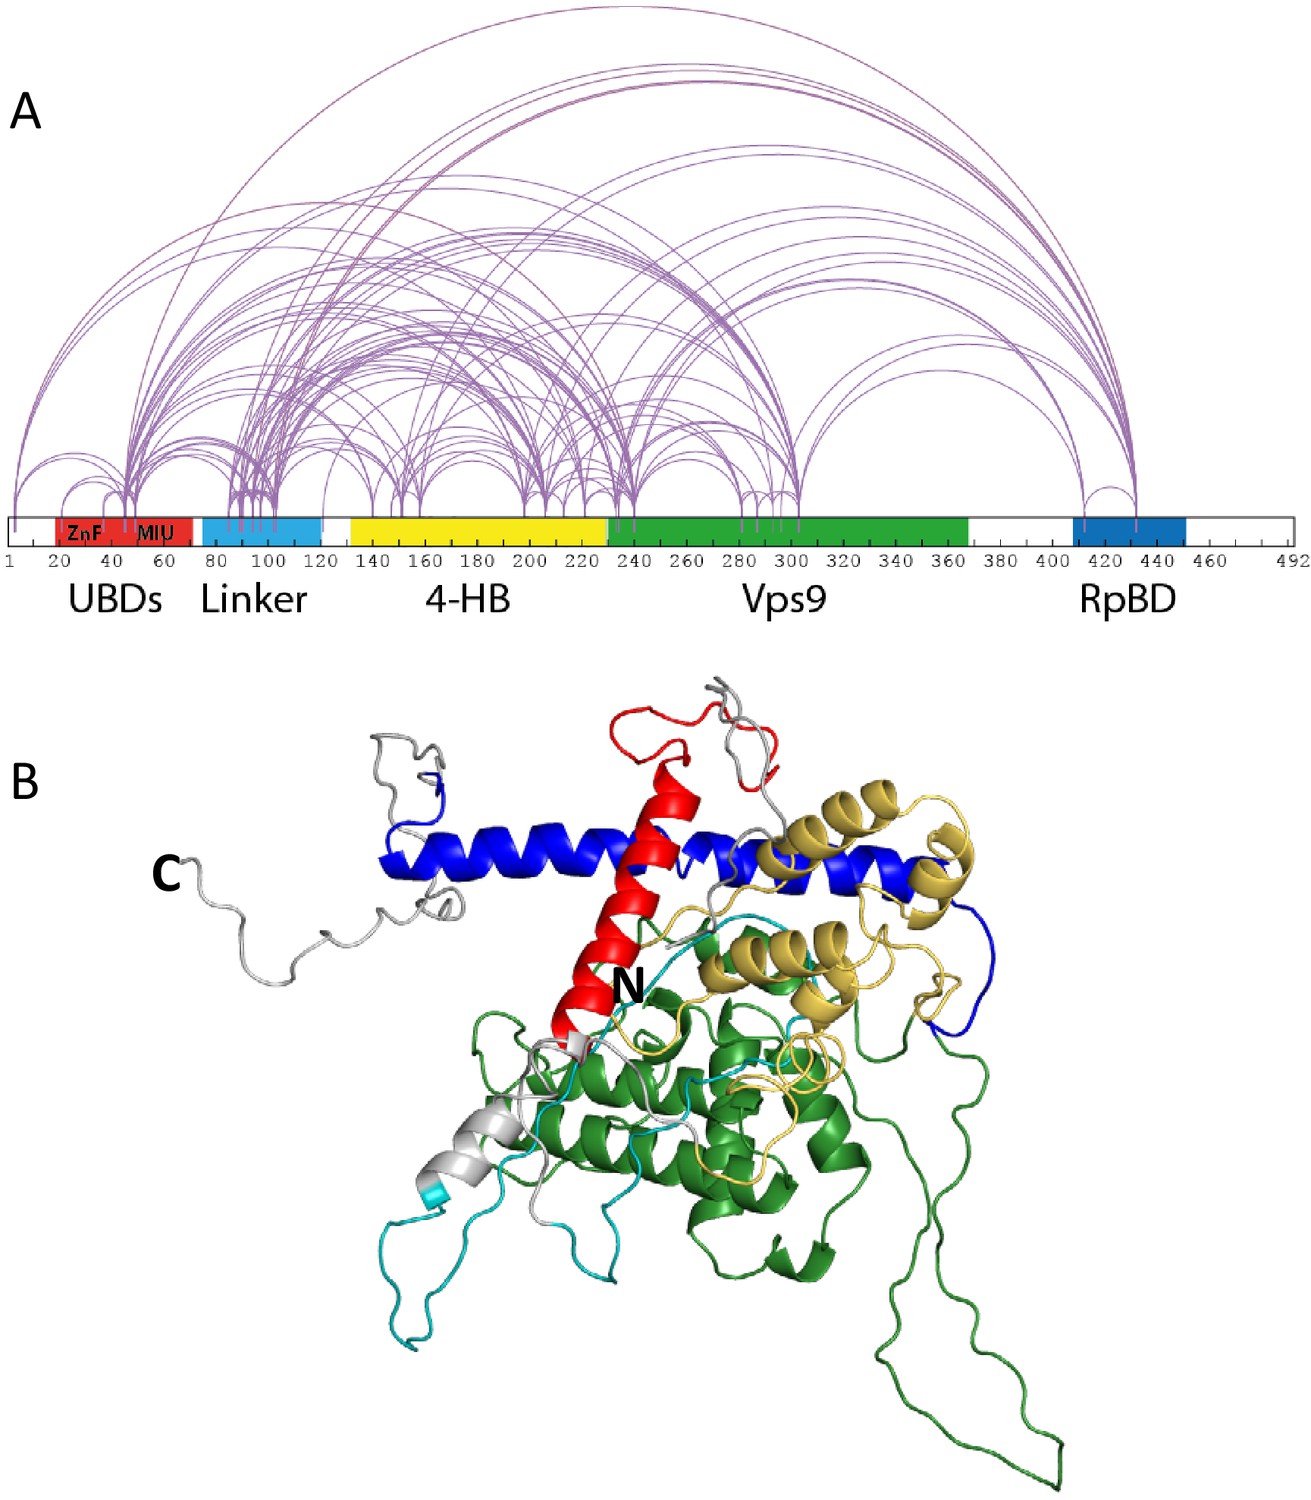
Rabex5 cross-linking-MS data and structural model.
(A) The cross-linking-MS data are shown for apo Rabex5 and illustrated in Xwalk (Kahraman et al., 2011). Ubiquitin binding domains (both ZnF and MIU together in red), Linker (teal), 4-helical bundle (gold), Vps9 domain (green), and rabpatin5 binding domain (blue). (B) A structural model of apo Rabex5 is pseudo-colored as illustrated above. This model is one of the possible arrangements and was chosen because it was in best agreement with the cross-linking-MS and HDX-MS data.
Figure 1—figure supplement 1
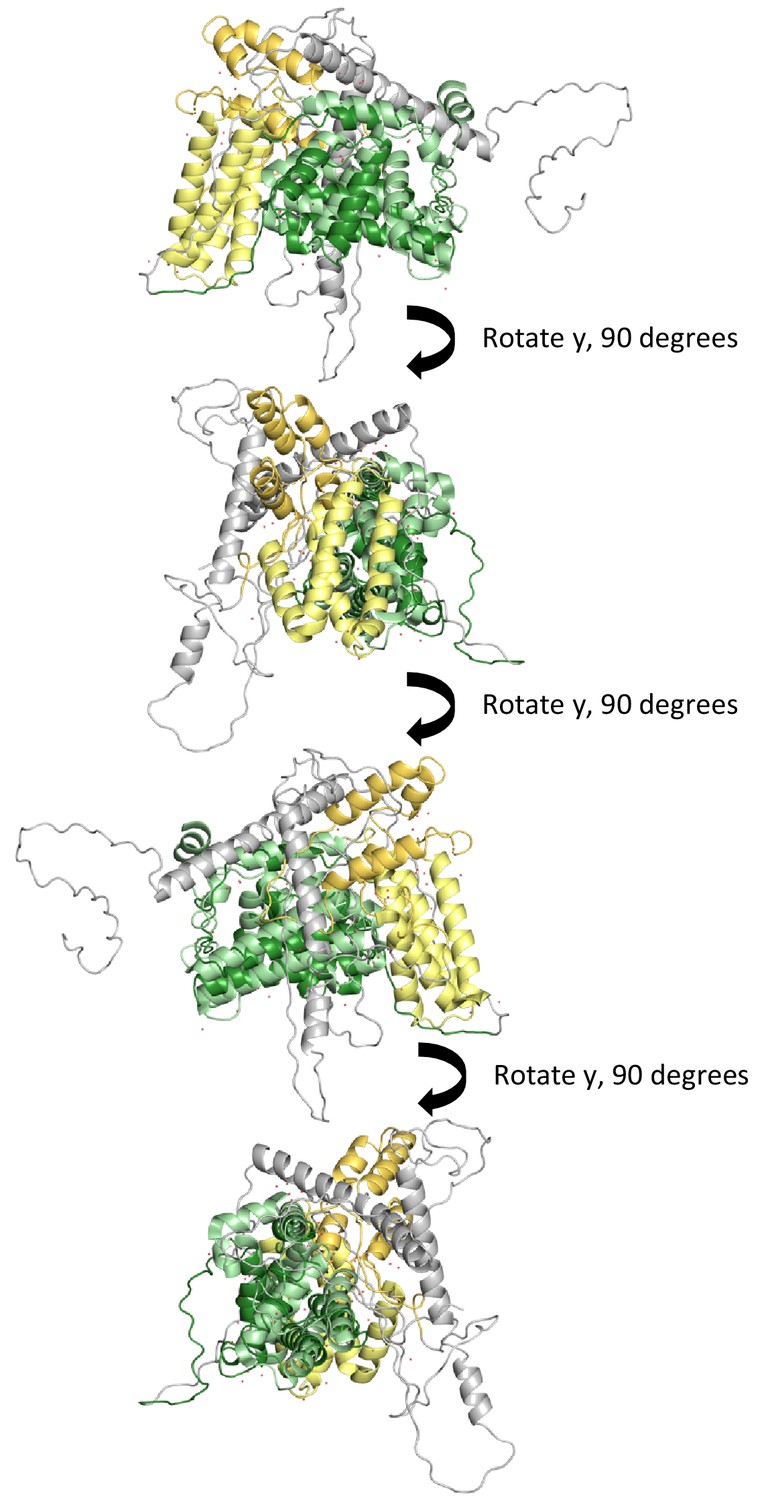
Alignment and superimposition of our model with 1TXU.
Our best model was aligned and superimposed with the coordinates from 1TXU to illustrate relative positions between the 4-HB and Vps9 domain. Please keep in mind that the model we use for illustration is one of many possible models created herein. As with all static pictures, it does not capture the true ensemble of conformations.
Figure 1—figure supplement 2
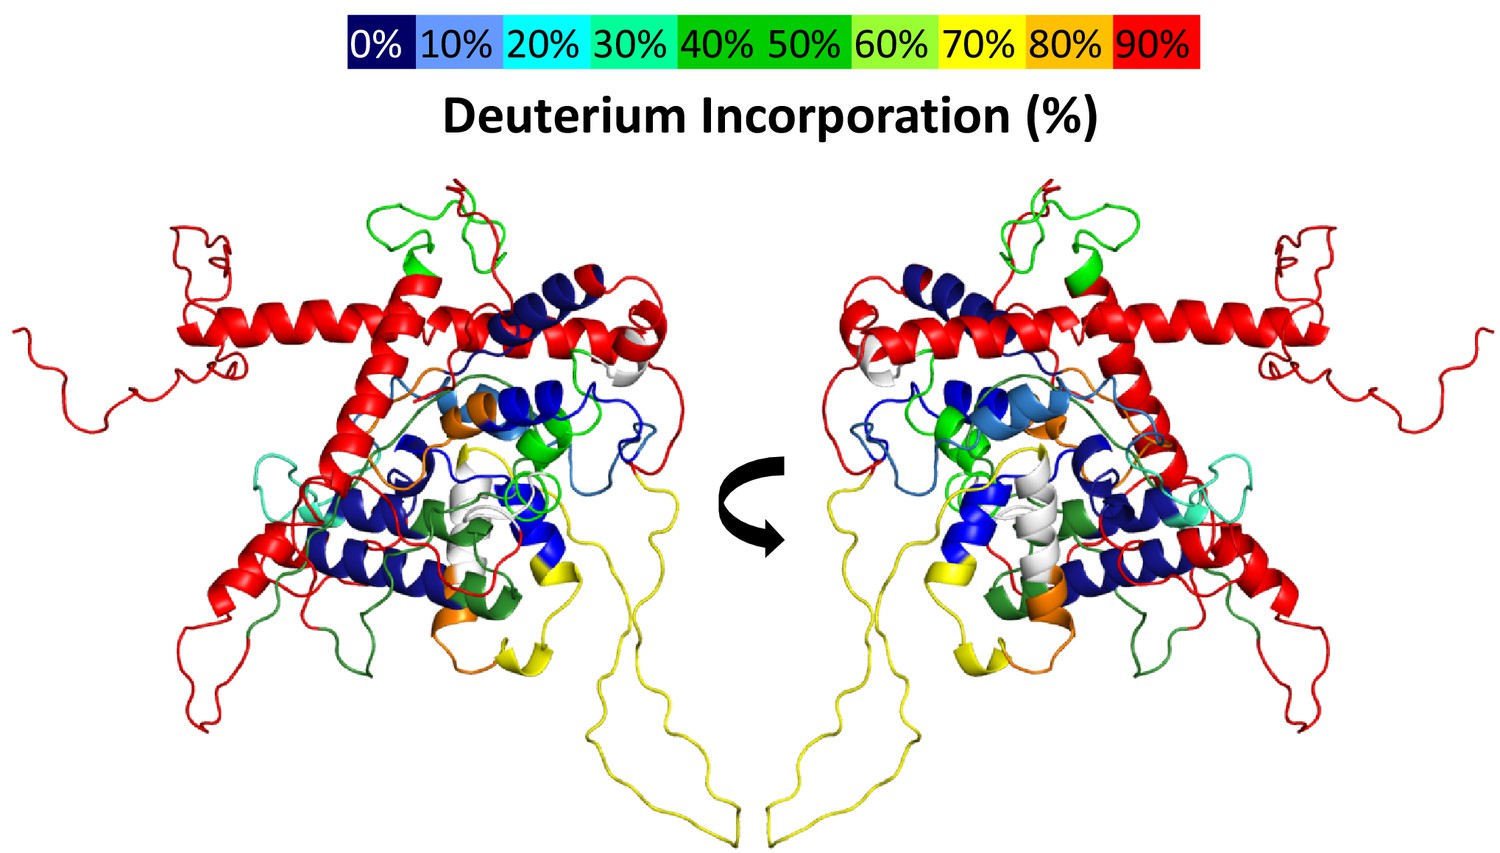
Deuterium uptake in Rabex5.
The results of 10 s deuterium uptake are shown for WT apo Rabex5, using the indicated color scheme. The region in white has no peptide coverage.
Figure 2
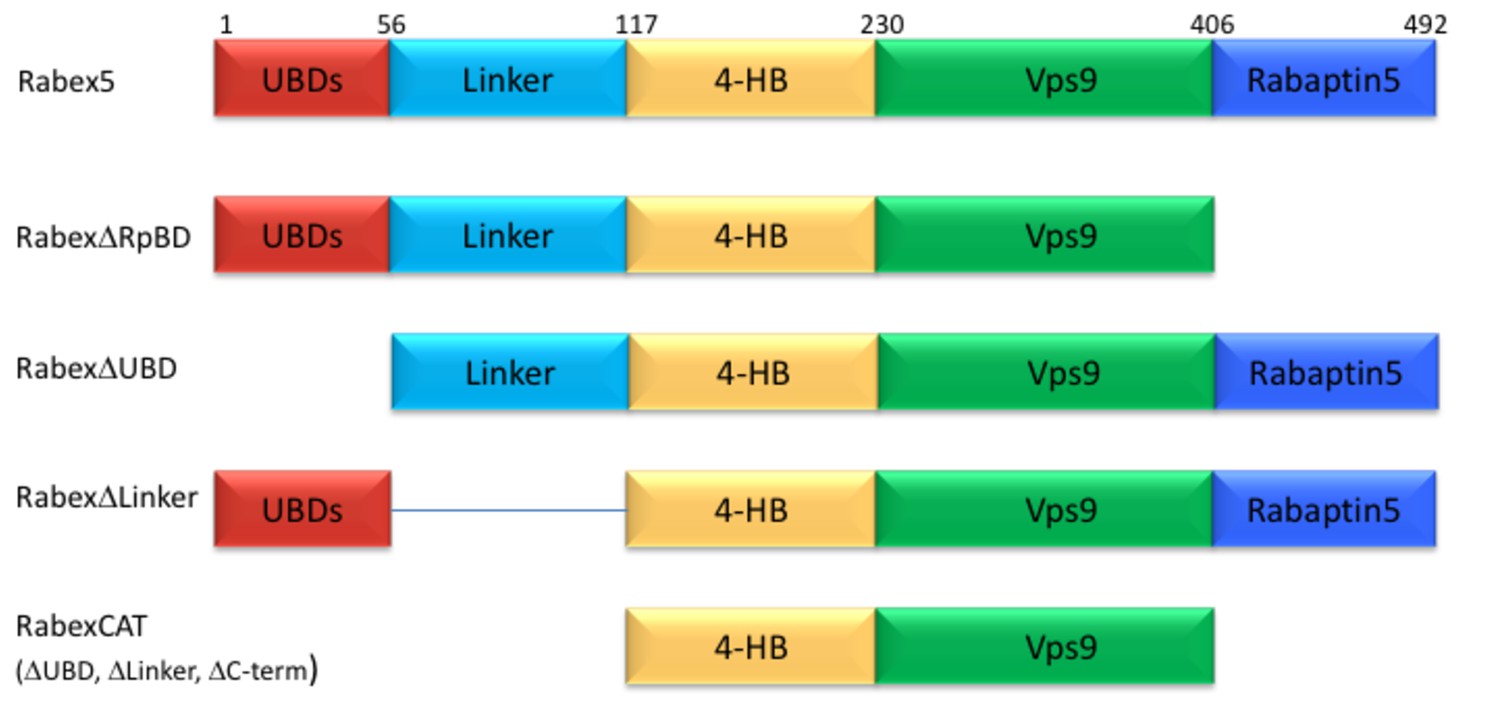
Domain deletion mutants.
A series of domain deletion mutants were created as indicated. Rabex5 amino acid numbering is shown for comparison.
Figure 3 with 1 supplement
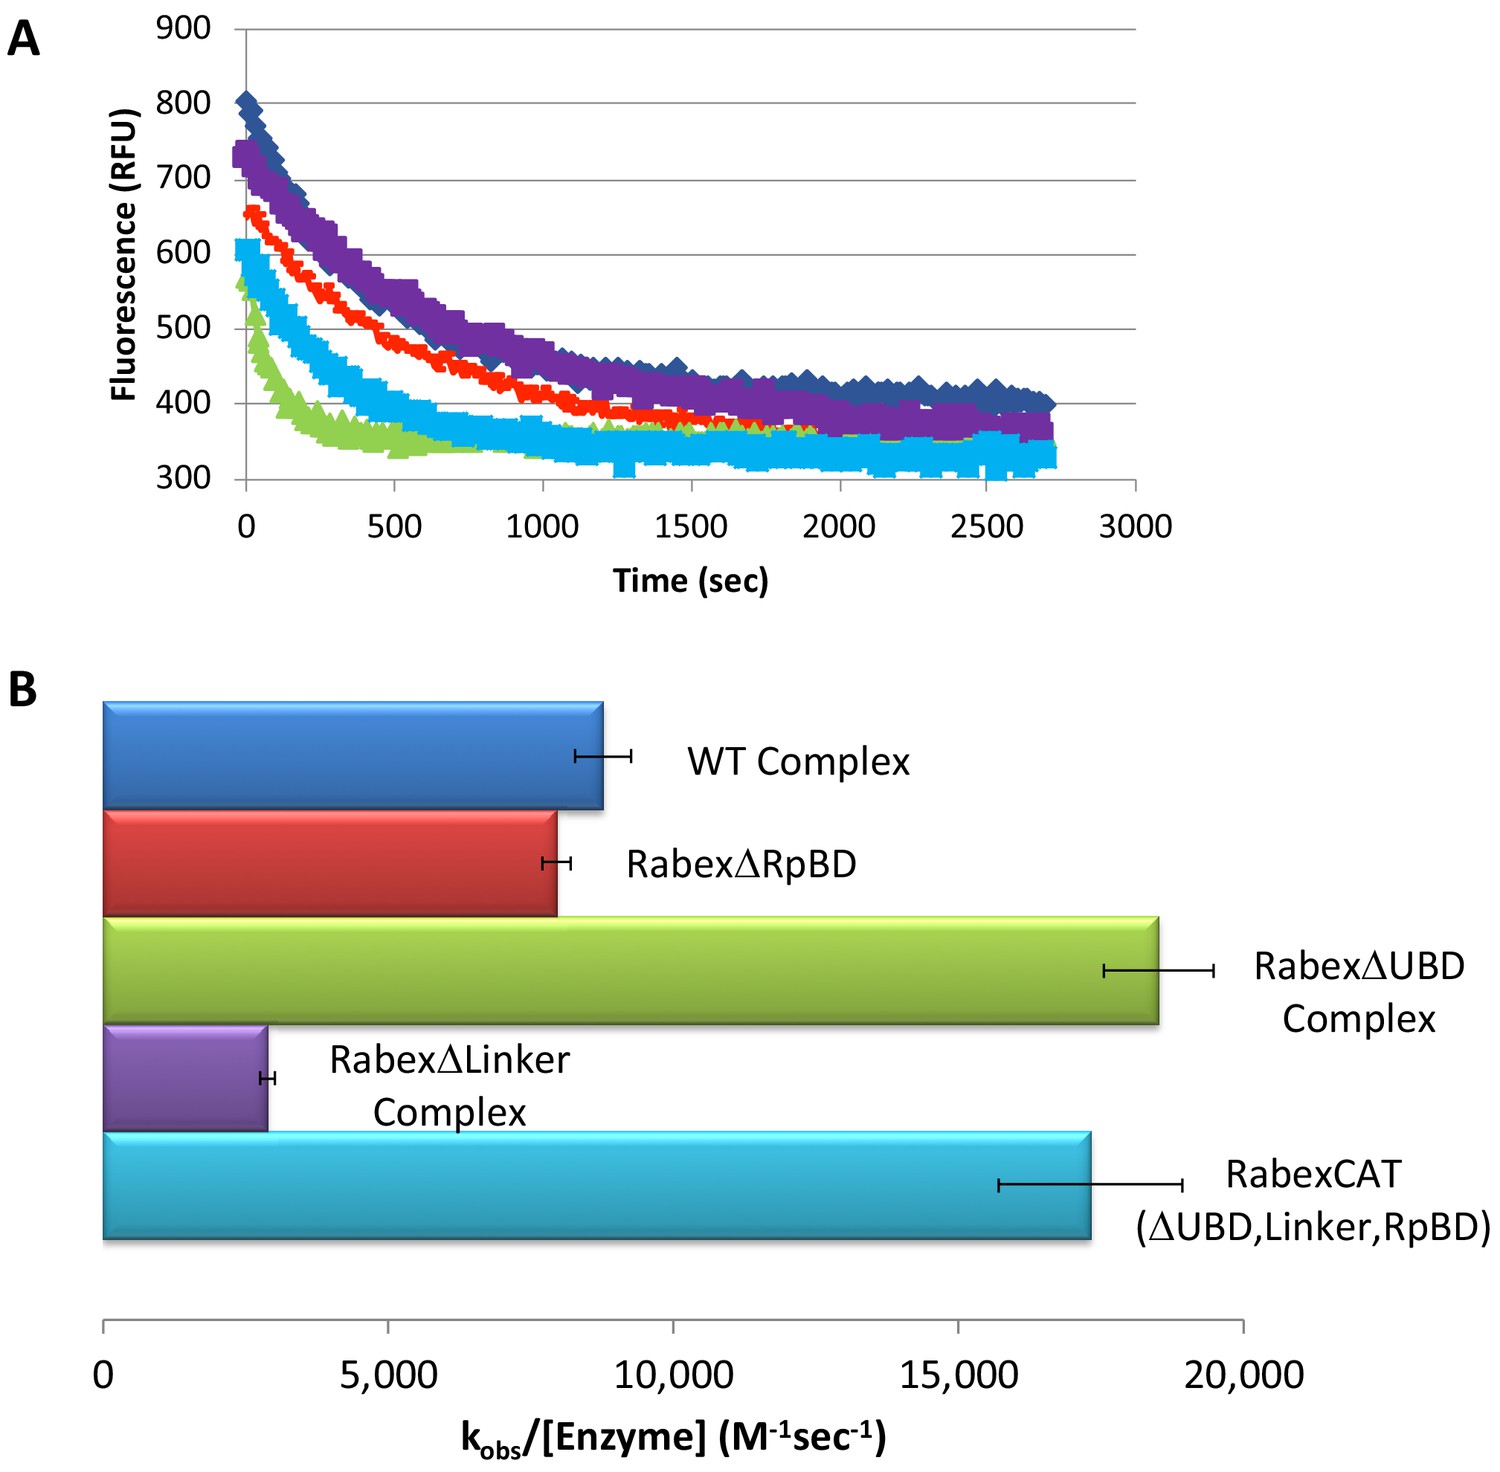
Rabex5 nucleotide exchange kinetics.
Nucleotide exchange kinetics are shown for wild-type Rabex5:Rabaptin5 complex as well as the domain deletion mutants, all in complex with full-length Rabaptin5 (where applicable). (A) A single replicate data trace is shown. WT complex (blue diamonds), RabexΔRpBD (orange dashes), RabexΔUBD complex (green triangles), RabexΔLinker (purple squares), RabexCAT (blue squares). All enzymes were used at 0.5 μM with the exception of RabexCAT, which was used at 0.25 μM. (B) A compilation of nucleotide exchange kinetics data is shown. Averages were calculated from three individual experiments containing three replicates.
-
Figure 3—source data 1
Source data for Rabex mutant nucleotide exchange.
- https://doi.org/10.7554/eLife.46302.008
-
Figure 3—source data 2
Source data for Rabex mutant nucleotide exchange.
- https://doi.org/10.7554/eLife.46302.009
Figure 3—figure supplement 1
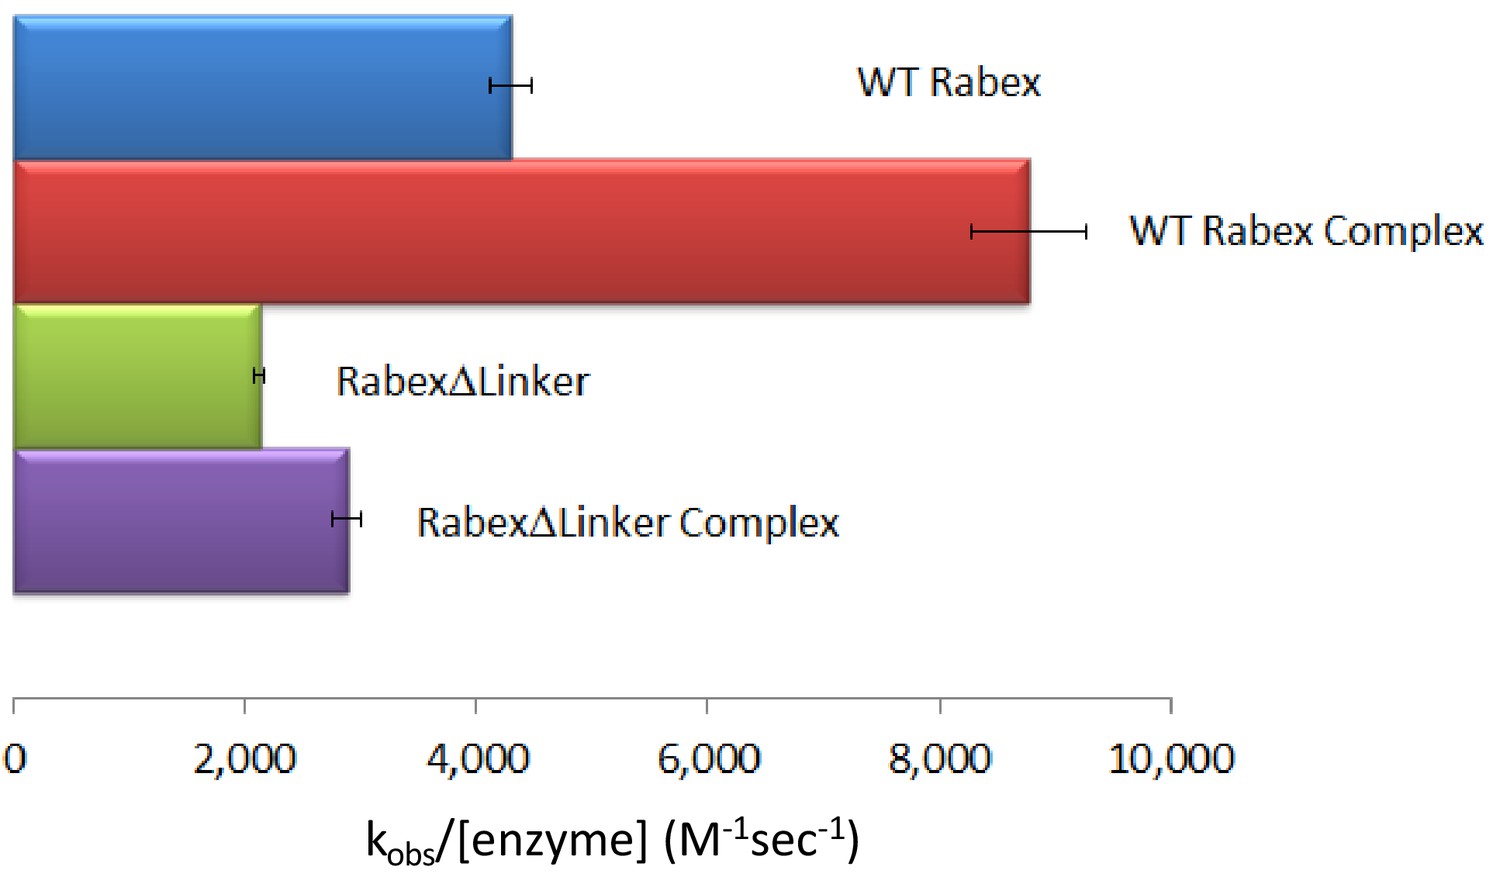
Nucleotide exchange kinetics.
Nucleotide exchange kinetics are shown for wild-type Rabex5:Rabaptin5 complex as well as the domain deletion mutants, all in complex with full-length Rabaptin5 (where applicable).
Figure 4 with 5 supplements
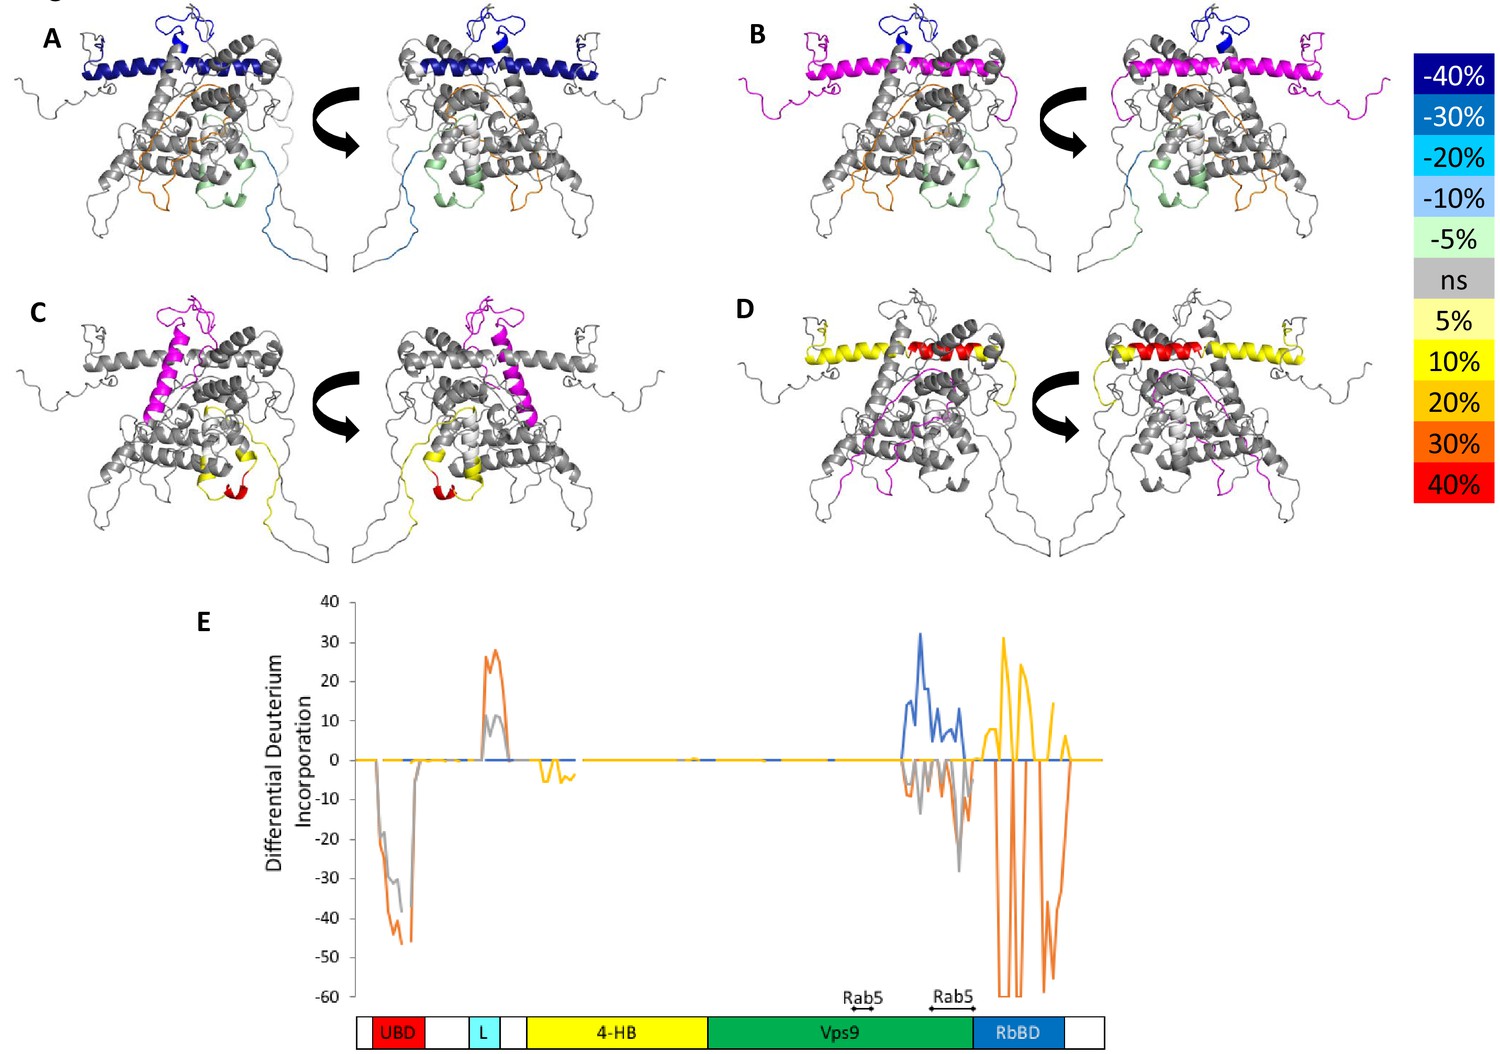
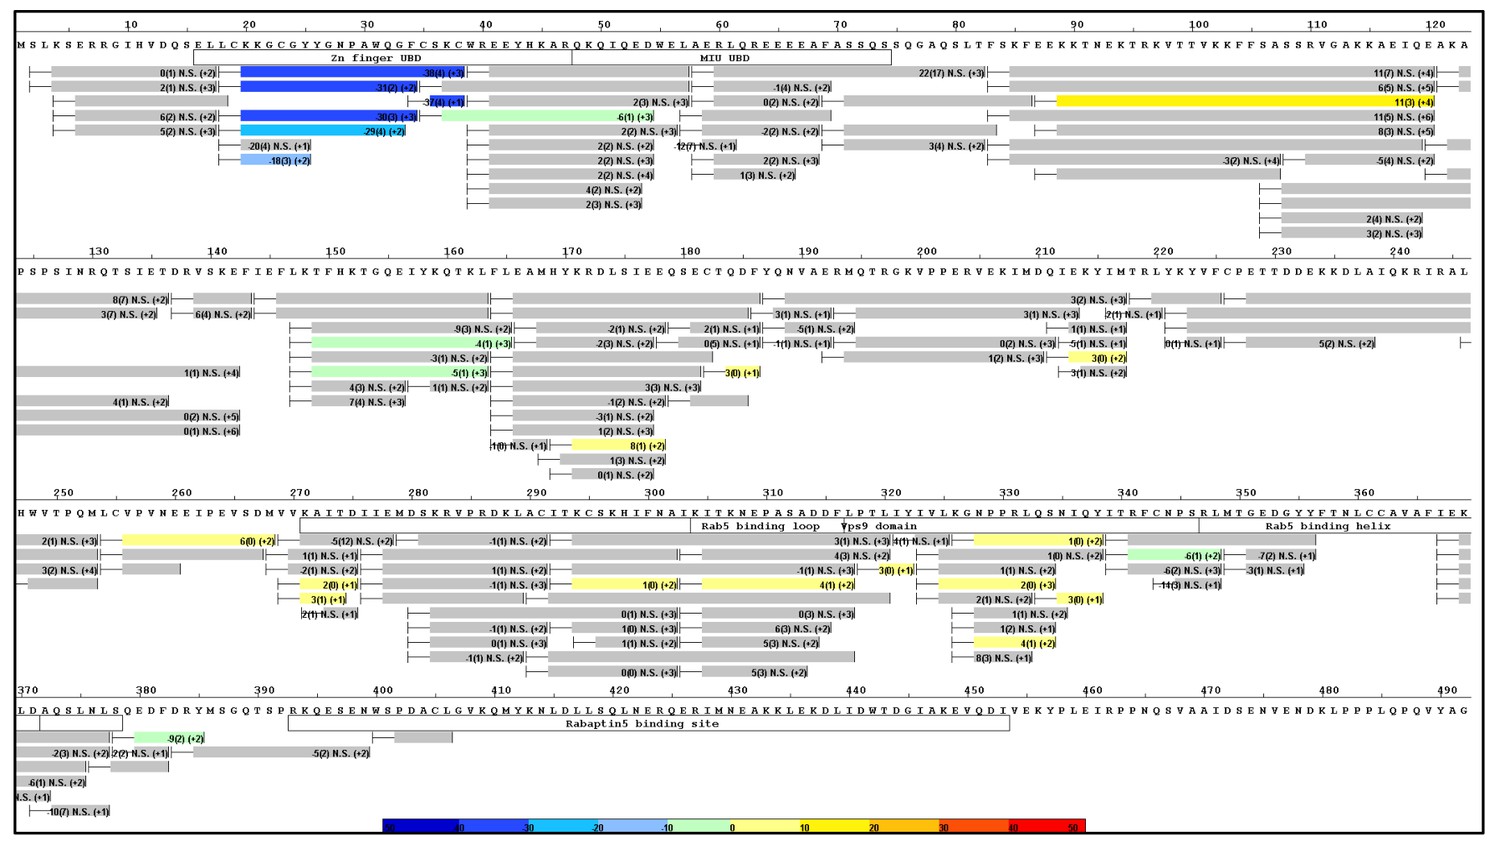
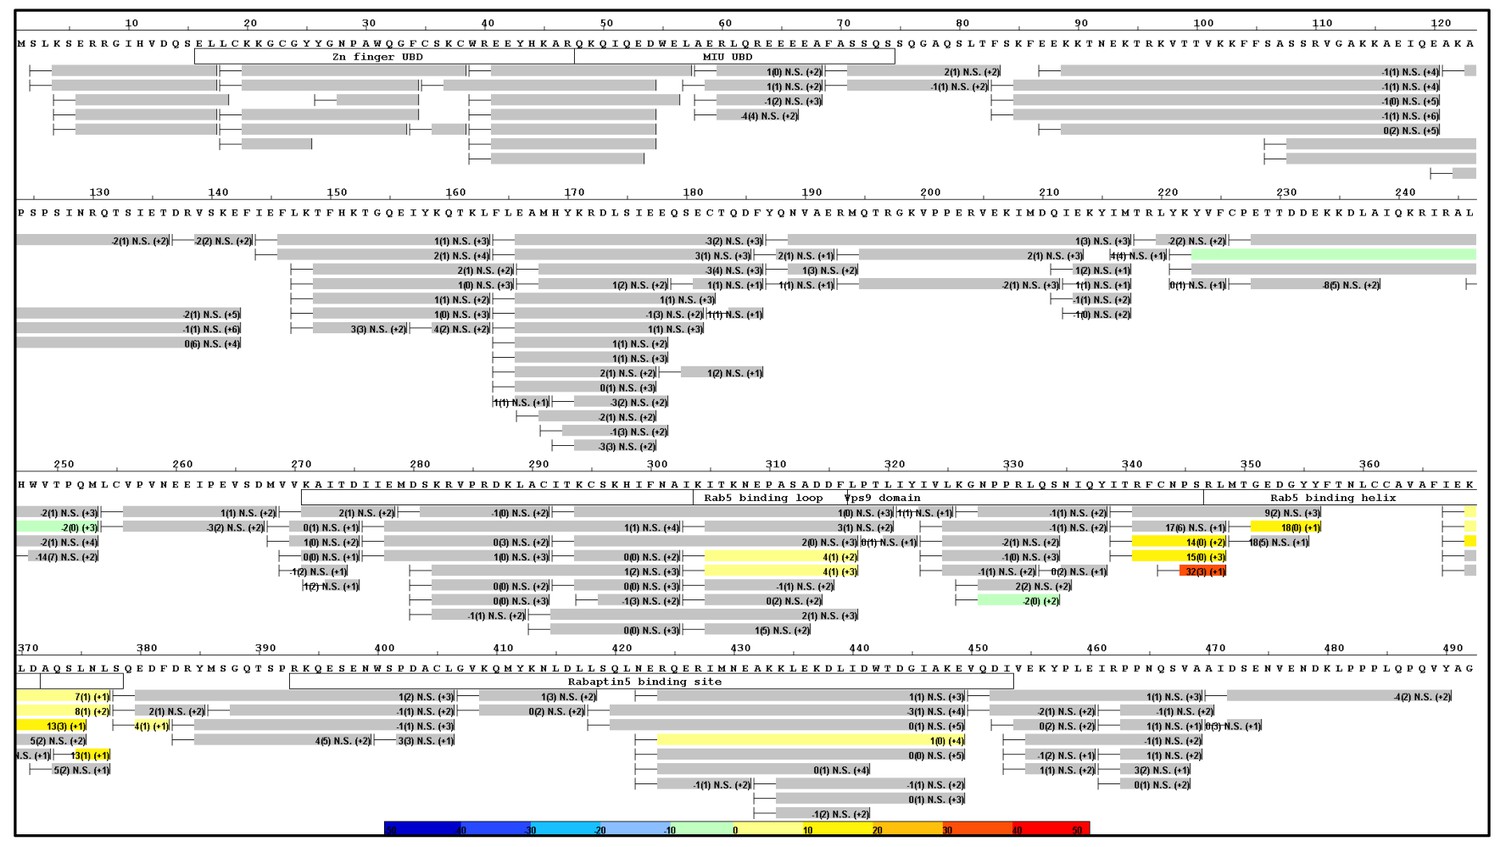
HDX-MS data.
This figure shows differential uptake of deuterium. In each case, the coloring scheme is as follows: no statistically different uptake (gray), regions missing peptide coverage(white), regions deleted in mutants (magenta), regions stabilized or protected from deuterium exchange (cool colors, as shown in the figure), and regions showing enhanced exchange correlating with enhanced dynamics (warm colors, as shown in the figure). (A) WT Rabex5 vs Rabex5:Rabaptin5 Complex, (B) WT Rabex5 vs RabexΔRpBD, (C) WT Rabex5:Rabaptin5 Complex vs RabexΔUBD:Rabaptin5 Complex, (D) WT Rabex5:Rabaptin5 Complex vs RabexΔLinker:Rabaptin5 Complex. Panel E shows another view of the differential deuterium uptake experiments. The data from panel A (orange), panel B (gray), panel C (blue), panel D (gold). This view highlights in which domain the differences in deuterium uptake can be found as it might not be readily apparent in the model views. The Rab5 binding sites within the Vps9 domain are highlighted.
-
Figure 4—source data 1
HDX-MS differential uptake values.
- https://doi.org/10.7554/eLife.46302.016
Figure 4—figure supplement 1
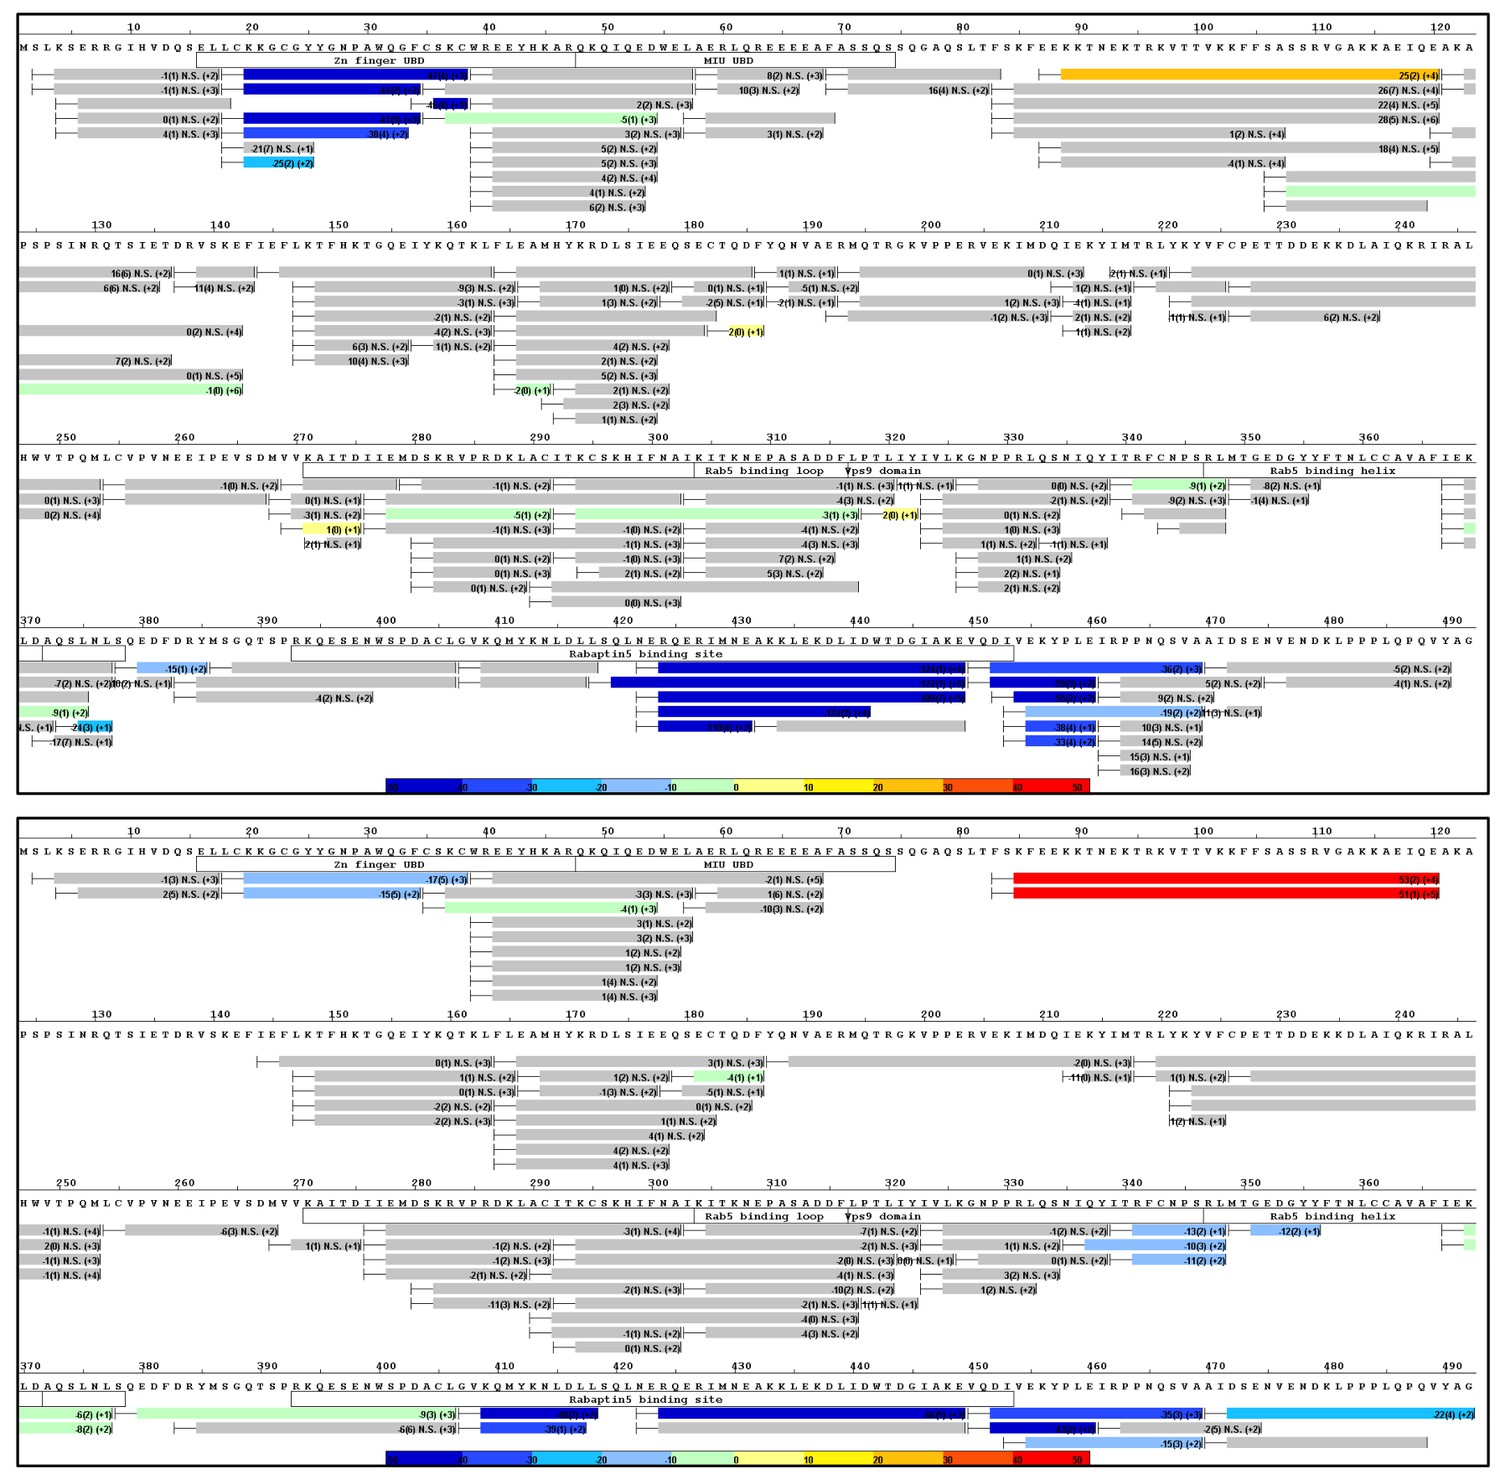
Raw HDX-MS data.
The results of individual experiments used for Figure 4a.
Figure 4—figure supplement 2
Raw HDX-MS data.
The results of individual experiments used for Figure 4b.
Figure 4—figure supplement 3
Raw HDX-MS Data.
The results of individual experiments used for Figure 4c.
Figure 4—figure supplement 4
Raw HDX-MS data.
The results of individual experiments used for Figure 4d.
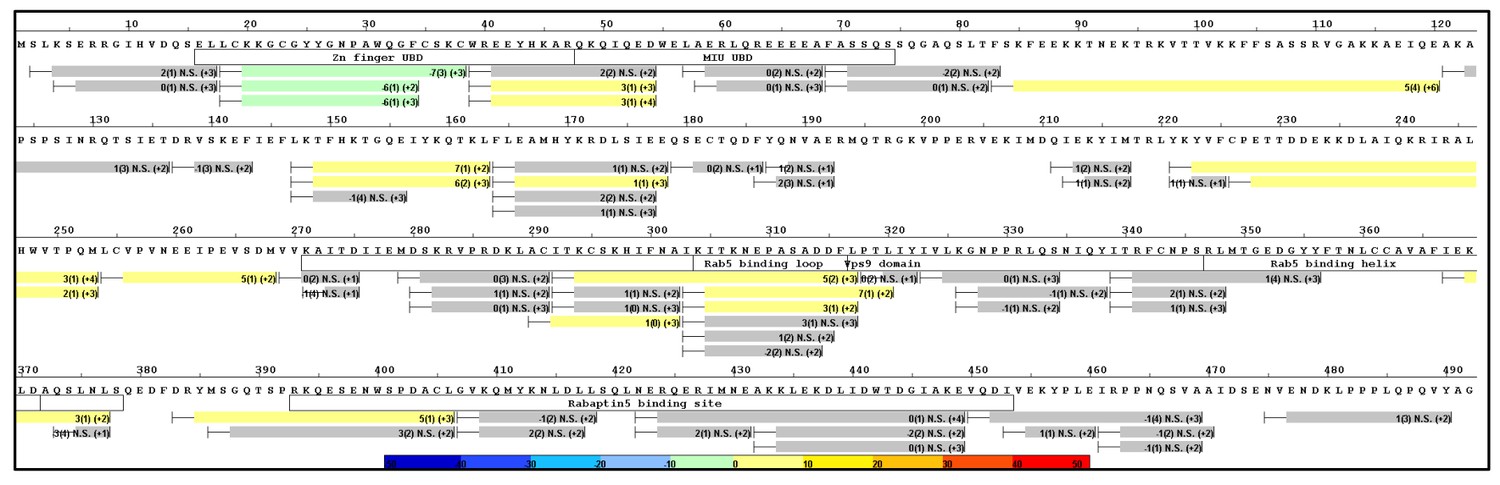
Figure 4—figure supplement 5

HDX-MS data.
This figure shows differential uptake of deuterium for WT Rabex5 vs Rabex132-394, displayed on pdb:1txu. The coloring scheme is as follows: no statistically different uptake (gray), regions missing peptide coverage(white), and regions showing increased dynamics or enhanced exchange (yellow). Nearly the entire domain is destabilized compared with full-length Rabex5 (yellow).
Figure 5
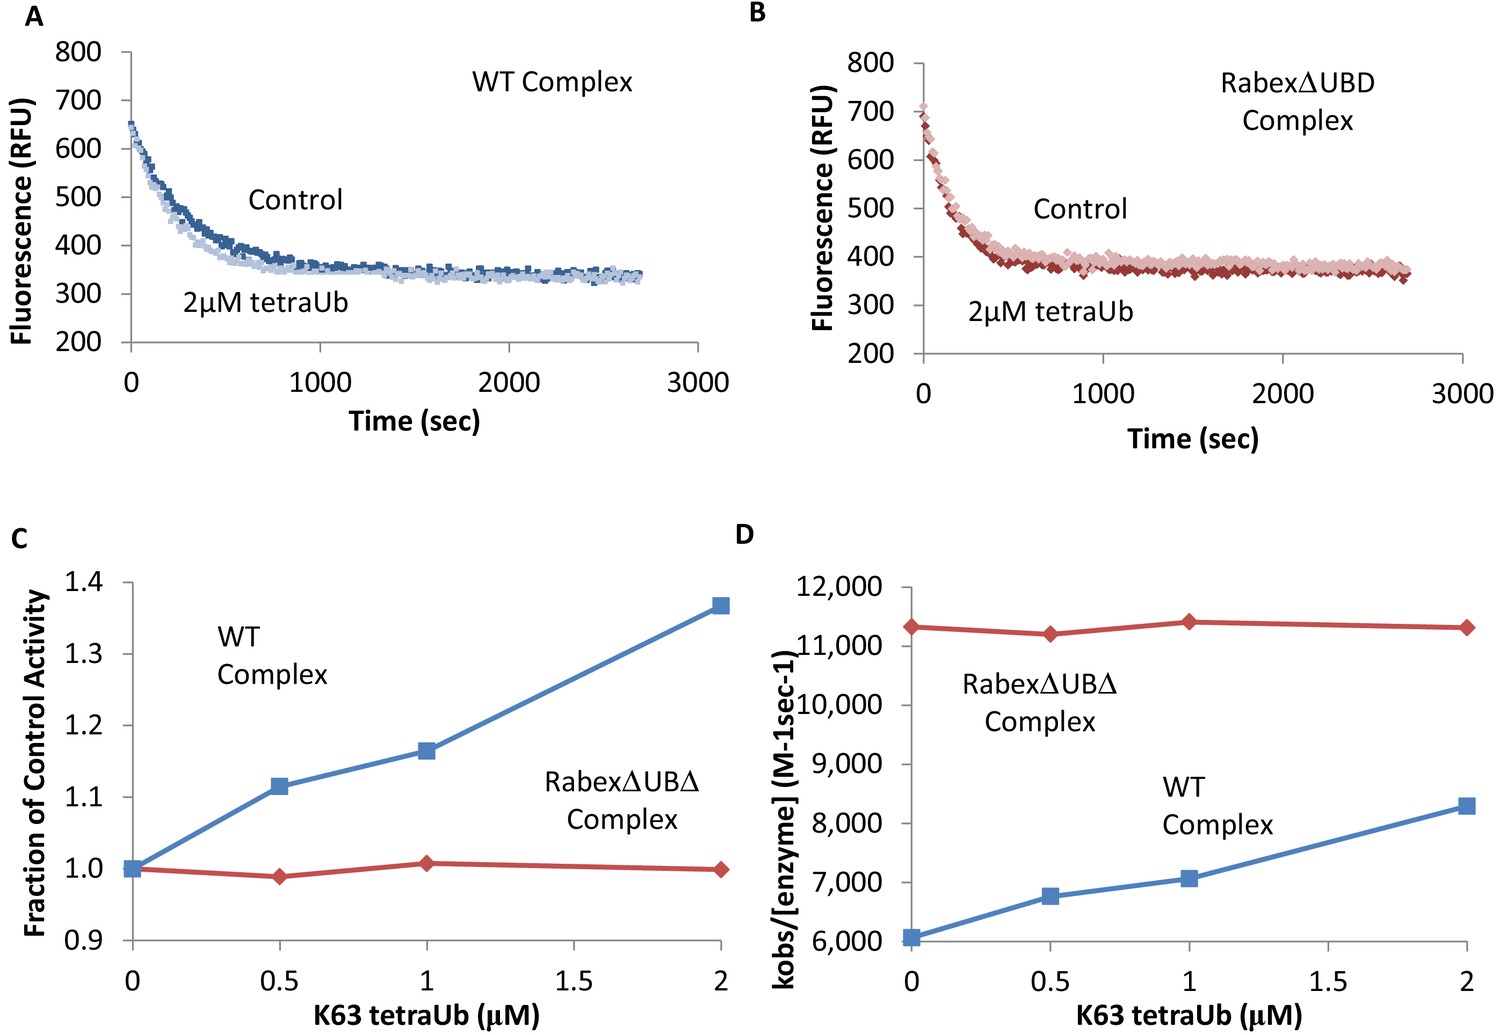
Effects of TetraUb on nucleotide exchange.
Nucleotide exchange kinetics in the absence or presence of Lys63 linked tetra ubiquitin. Panel (A) shows an example data trace for WT Rabex5:Rabaptin5 complex alone (dark blue) and plus tetraUb (light blue). Panel (B) shows an example data trace for RabexΔUb:Rabaptin5 complex alone (dark rust) and plus tetraUb (light rust). Panels (C) and (D) show the average of 2 experiments each containing three replicates for WT Rabex5:Rabaptin5 complex (blue squares) and RabexΔUb:Rabaptin5 complex (rust diamonds) with varying concentrations of tetraUb.
-
Figure 5—source data 1
Nucleotide exchange kinetics +/- Ubiquitin.
- https://doi.org/10.7554/eLife.46302.018
Figure 6 with 1 supplement
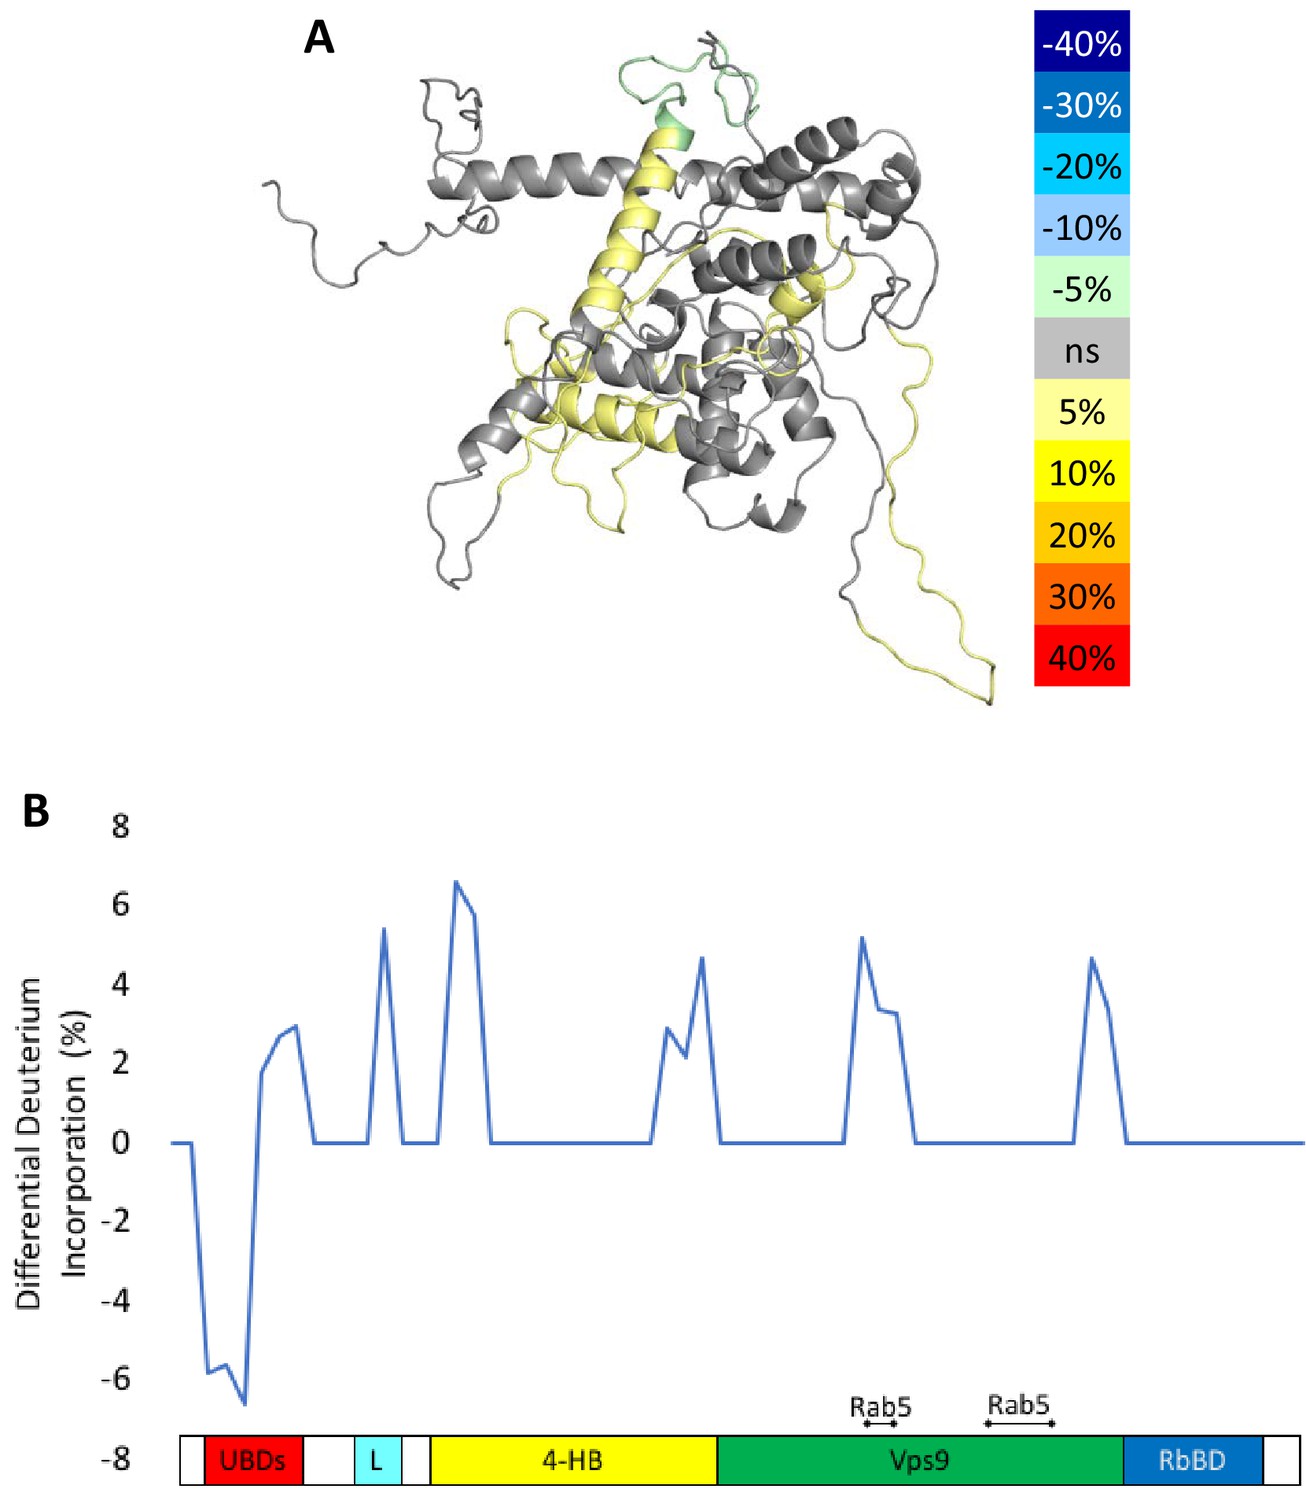
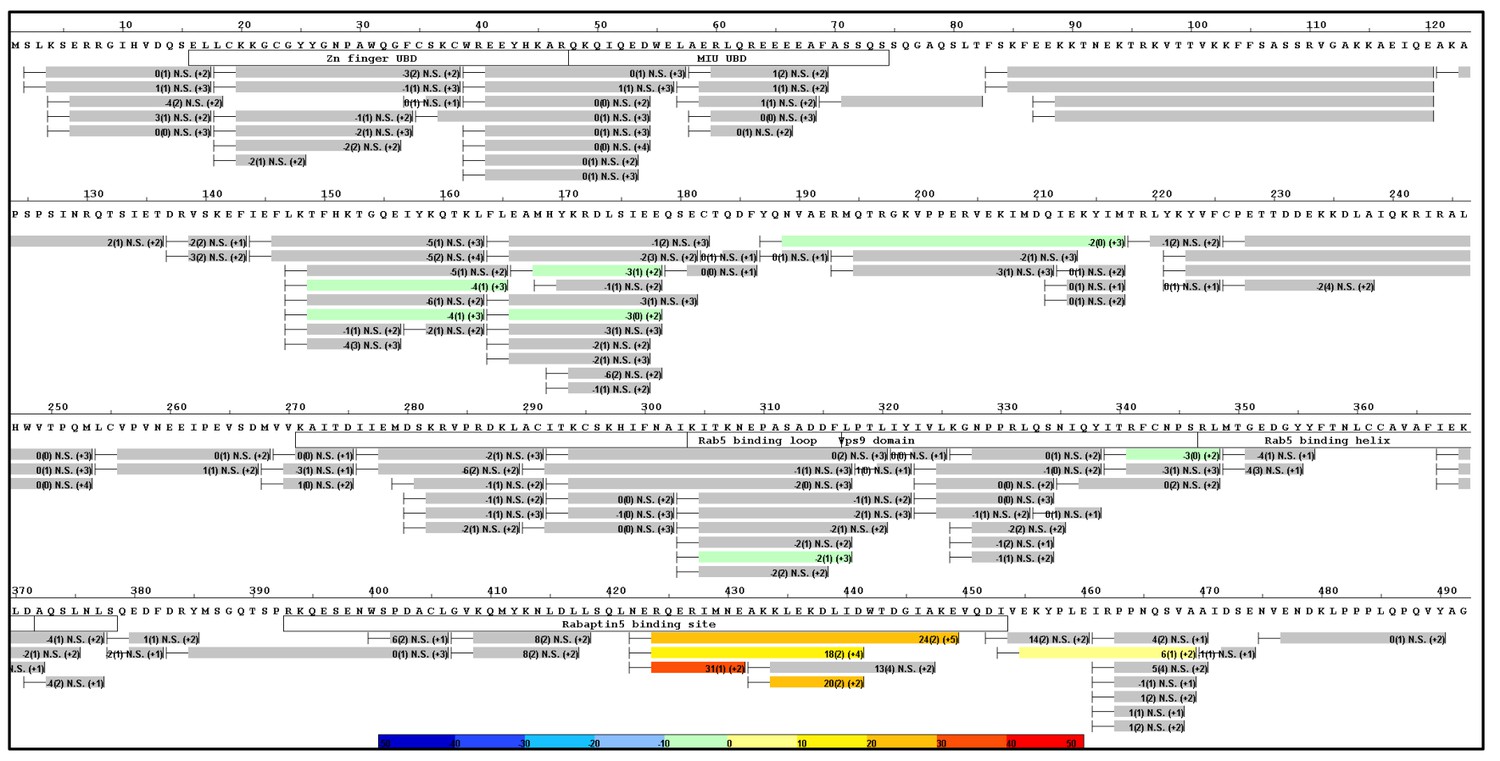
HDX-MS results during nucleotide exchange.
The differential uptake of deuterium occurring during the nucleotide exchange reaction are illustrated using our structural model (A). In each case, the coloring scheme is as follows: no statistically different uptake (gray), regions missing peptide coverage(white), regions protected from exchange (pale green), and regions showing enhanced exchange (yellow). Panel E shows another view of the differential deuterium uptake experiments which domain the differences in deuterium uptake can be found, as it might not be readily apparent in the model view.
-
Figure 6—source data 1
HDX-MS differential uptake values.
- https://doi.org/10.7554/eLife.46302.021
Figure 6—figure supplement 1
Raw HDX-MS data.
The results of individual experiments used for Figure 6.
Figure 7

Peptide profiles during nucleotide exchange.
Total ion current and centroid spectra for a peptide corresponding to Rabex5 (83-120) in the presence (B and D) or absence of GTPγS (A and C) after 60 s (A and B) or 300 s (C and D) of deuterium uptake. Note the disappearance of signal at 60 s upon addition of GTPγS and partial recovery at 300 s.
Figure 8 with 1 supplement
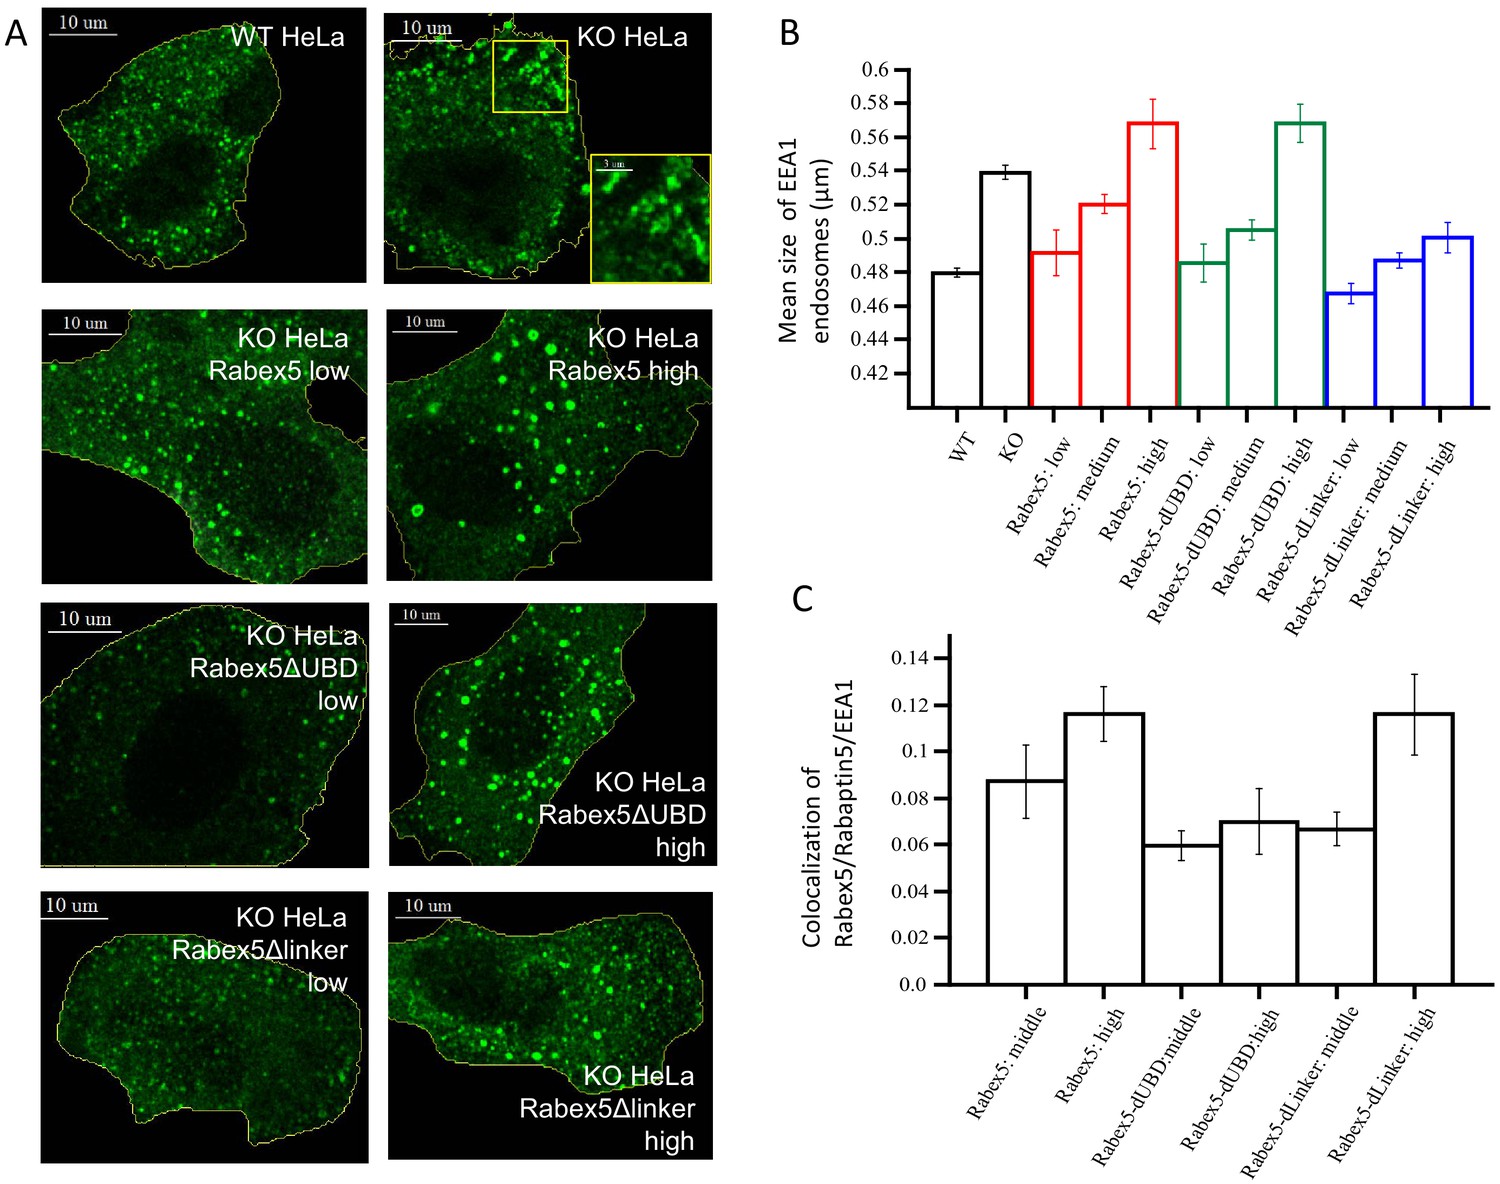
Rabex5 knock-out and rescue in HeLa cells.
Confocal microscopy images of WT and Rabex5 knock-out KO HeLa cells stained with EEA1 antibodies are shown in comparison with Rabex5 KO cells expressing Rabex5, Rabex5DUBD and Rabex5DLinker (A). Images highlight cells expressing low and high levels of Rabex5 protein (not shown to better display the EEA1 endosomal pattern) and thus are masked to hide cells with other expression levels. The mean size of EEA1 positive endosomes (B) is shown for WT, Rabex5 KO cells and cells expressing the Rabex5 proteins. The colocalization of Rabex5 and EEA1 (C) is quantified to illustrate the amount of Rabex5 on the endosome and how that varies with expression level.
Figure 8—figure supplement 1
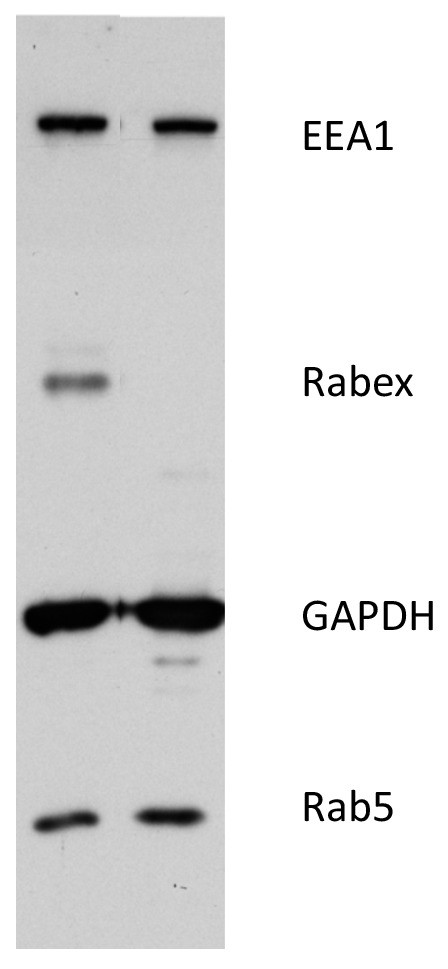
Western blot of WT and Rabex5 knockout HeLa.
https://doi.org/10.7554/eLife.46302.024Additional files
-
Supplementary file 1
The results of the last round of modeling are shown comparing the top scoring clusters from each condition with the cross-linking-MS data.
- https://doi.org/10.7554/eLife.46302.025
-
Supplementary file 2
Key resources table.
- https://doi.org/10.7554/eLife.46302.026
Download links
A two-part list of links to download the article, or parts of the article, in various formats.
Downloads (link to download the article as PDF)
Open citations (links to open the citations from this article in various online reference manager services)
Cite this article (links to download the citations from this article in formats compatible with various reference manager tools)
Auto-regulation of Rab5 GEF activity in Rabex5 by allosteric structural changes, catalytic core dynamics and ubiquitin binding
eLife 8:e46302.
https://doi.org/10.7554/eLife.46302


