Imaging of glucose metabolism by 13C-MRI distinguishes pancreatic cancer subtypes in mice
- NCI, NIH, United States
- Urologic Oncology Branch, Center for Cancer Research, NCI, NIH, United States
- Hokkaido University, Japan
- JST, PREST, Japan
- NIH, United States
- University of Kentucky, United States
- GE HealthCare, United States
- Technical University of Denmark, Denmark
Figures
Figure 1 with 3 supplements
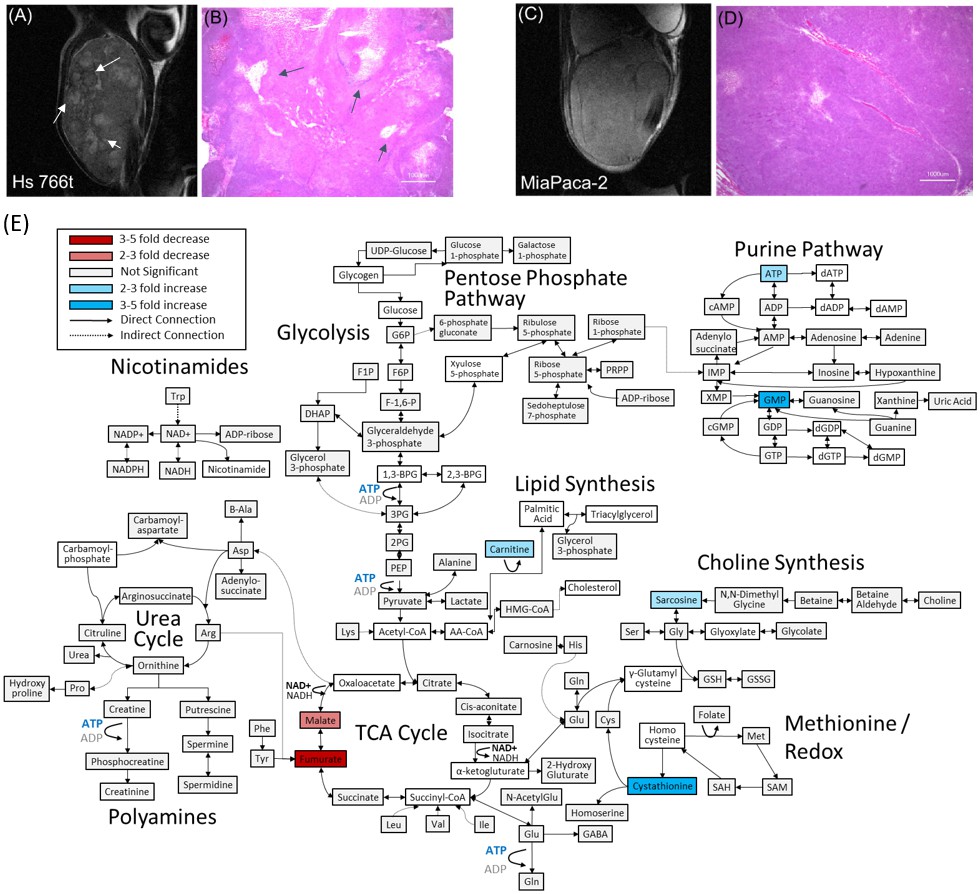
Distinct anatomical microstructure differences exist between Hs 766T and MIA Paca-2 xenografts while CE-MS shows only subtle metabolic differences.
(A and C) T2 weighted anatomical RARE images of (A) Hs 766T and (C) MIA Paca-2 PDAC xenografts implanted on the left leg. Focal necrosis is evident in the Hs 766T tumor, but not in the MIA Paca-2 one. (B and D) H and E staining of biopsies from (B) Hs 766T and (D) MIA Paca-2 tumors. Cell rupture is present in the Hs 766T biopsy. (E) Metabolite differences of MIA Paca-2 and Hs 766T PDAC leg xenografts as analyzed by CE/MS. White boxes indicate metabolites not detected. Gray boxes indicate a statistically insignificant difference between cell lines (two-sided t-test, corrected for multiple comparisons by the two-stage linear step-up procedure of Holm et al with a confidence level of 5%). Blue and red boxes indicate statistically significant increases or decreases with respect to MIA Paca-2.
Figure 1—figure supplement 1
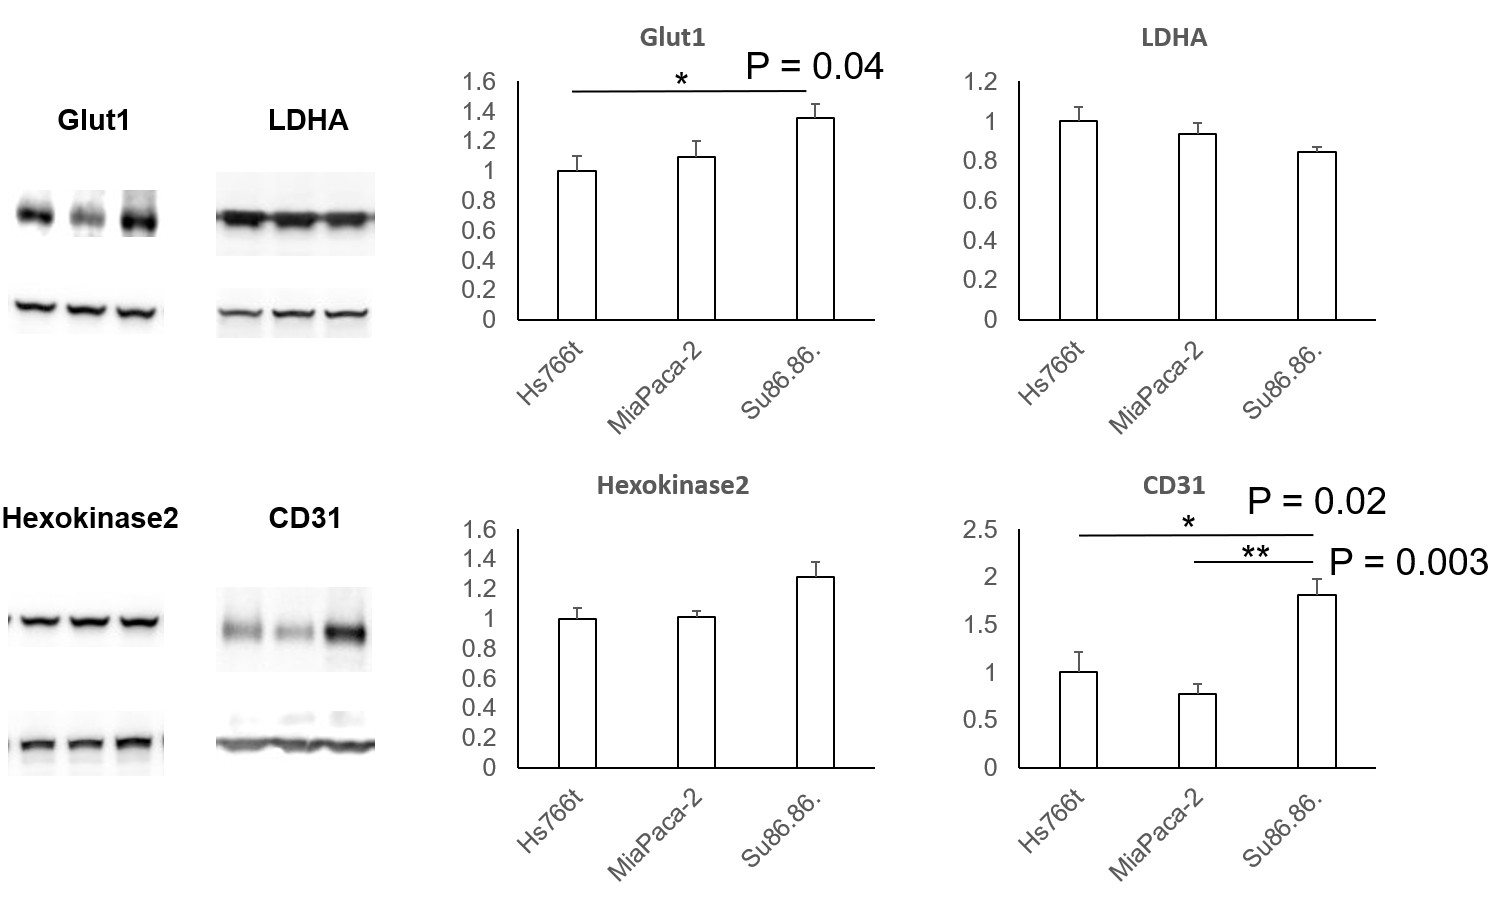
Protein expression levels from immunoblotting of tumor extracts of key proteins associated with metabolism.
Su86.86 forms a distinct subtype with statistically significant differences of the glucose transporter one and the angiogenic factor CD31. Error bars represent standard deviation (n = 4).
Figure 1—figure supplement 2
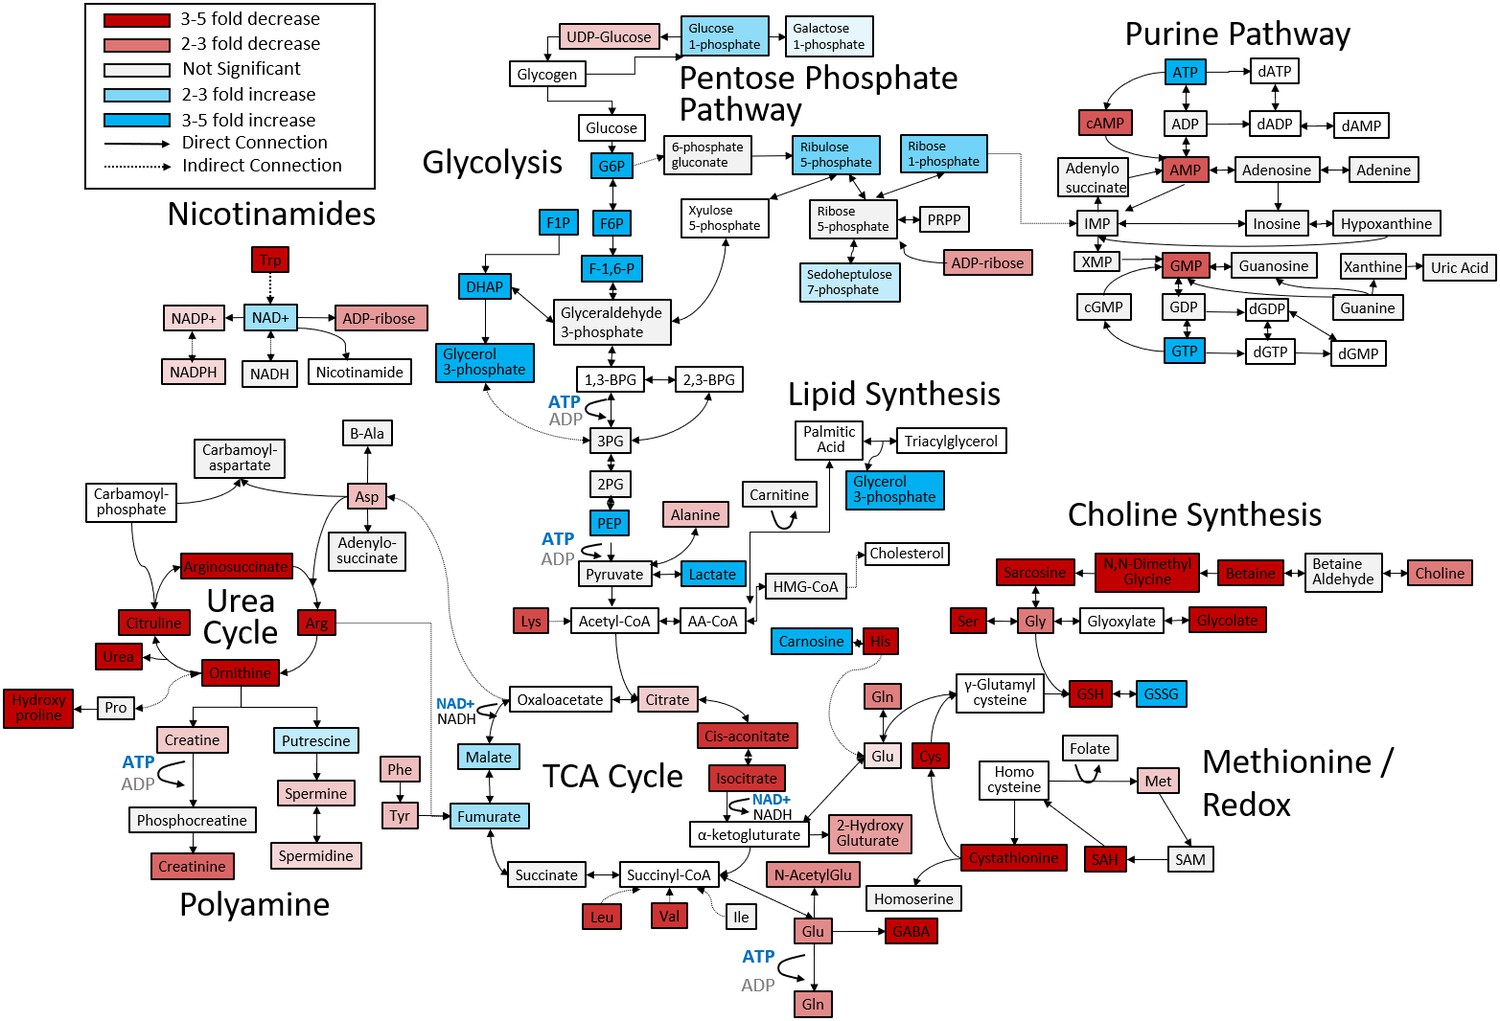
Metabolite differences between normal tissue and the MIA Paca-2 PDAC leg xenografts as analyzed by CE/MS.
White boxes indicate metabolites not detected. Gray boxes indicate a statistically insignificant difference between cell lines (two-sided t-test, corrected for multiple comparisons by the two-stage linear step-up procedure of Holm et al with a confidence level of 5%; Holm, 1979; Seaman et al., 1991). Blue and red boxes indicate statistically significant increases or decreases in xenografts versus normal tissue.
Figure 1—figure supplement 3

Metabolic differences within glycolysis between normal tissue and MIA Paca-2 and Hs 766T PDAC leg xenografts in terms of absolute concentrations (nmol/g tumor wet weight).
Differences between normal tissue and cancerous can be seen throughout. Hs 766T and MIA Paca-2 diverge after the pentose phosphate shunt at glyceraldehyde-3-phosphate.
Figure 2
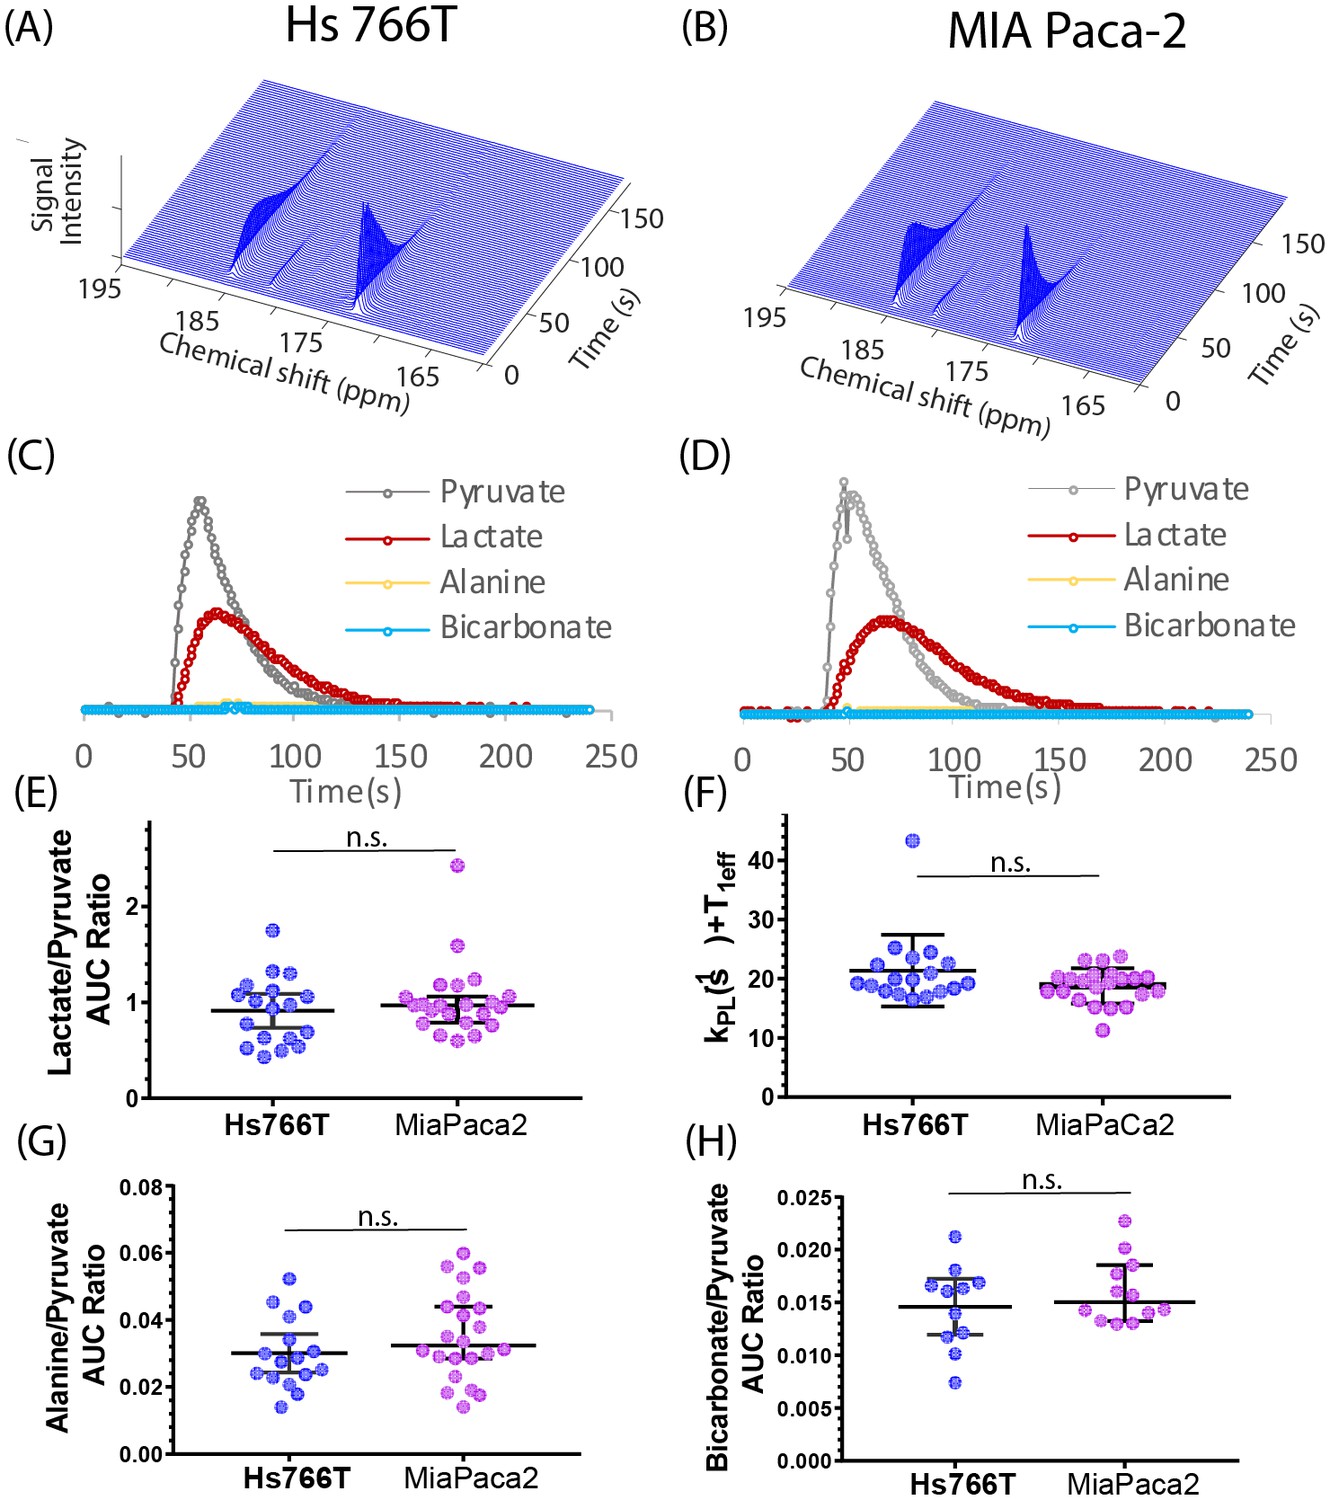
Pyruvate metabolism is similar in Hs 766T and MIA Paca-2 Xenografts.
(A and B) Representative signal after injecting 300 µL of 98 mM hyperpolarized [1-13C] pyruvate into the tail vein of a mouse of a nude mouse with either a (A) Hs 766T or (B) MiaPaCa2 leg xenograft. Signal loss is due to a combination of the loss of hyperpolarization and conversion of pyruvate to other metabolites. Corresponding kinetic traces of the pyruvate, lactate, alanine and bicarbonate signals metabolites for (C) Hs 766T and (D) MiaPaCa2 xenografts. (E) Ratio of the integrated lactate and pyruvate for Hs 766T (n = 18) and MiaPaca2 (n = 22) mice. The ratio is equal to the net lactate to pyruvate conversion rate in the absence of lactate efflux or back conversion. (F) Decay rate of the pyruvate signal, equivalent to the sum of the net lactate to pyruvate conversion rate and the effective relaxation rate (T1eff, assumed to be the same between cell lines). (G and H) Ratio of the integrated alanine (G) or bicarbonate (H) to pyruvate. No statistically significant difference between cell lines was detected for any measure (Mann-Whitney rank test). Error bars represent 95% confidence intervals.
Figure 3 with 1 supplement
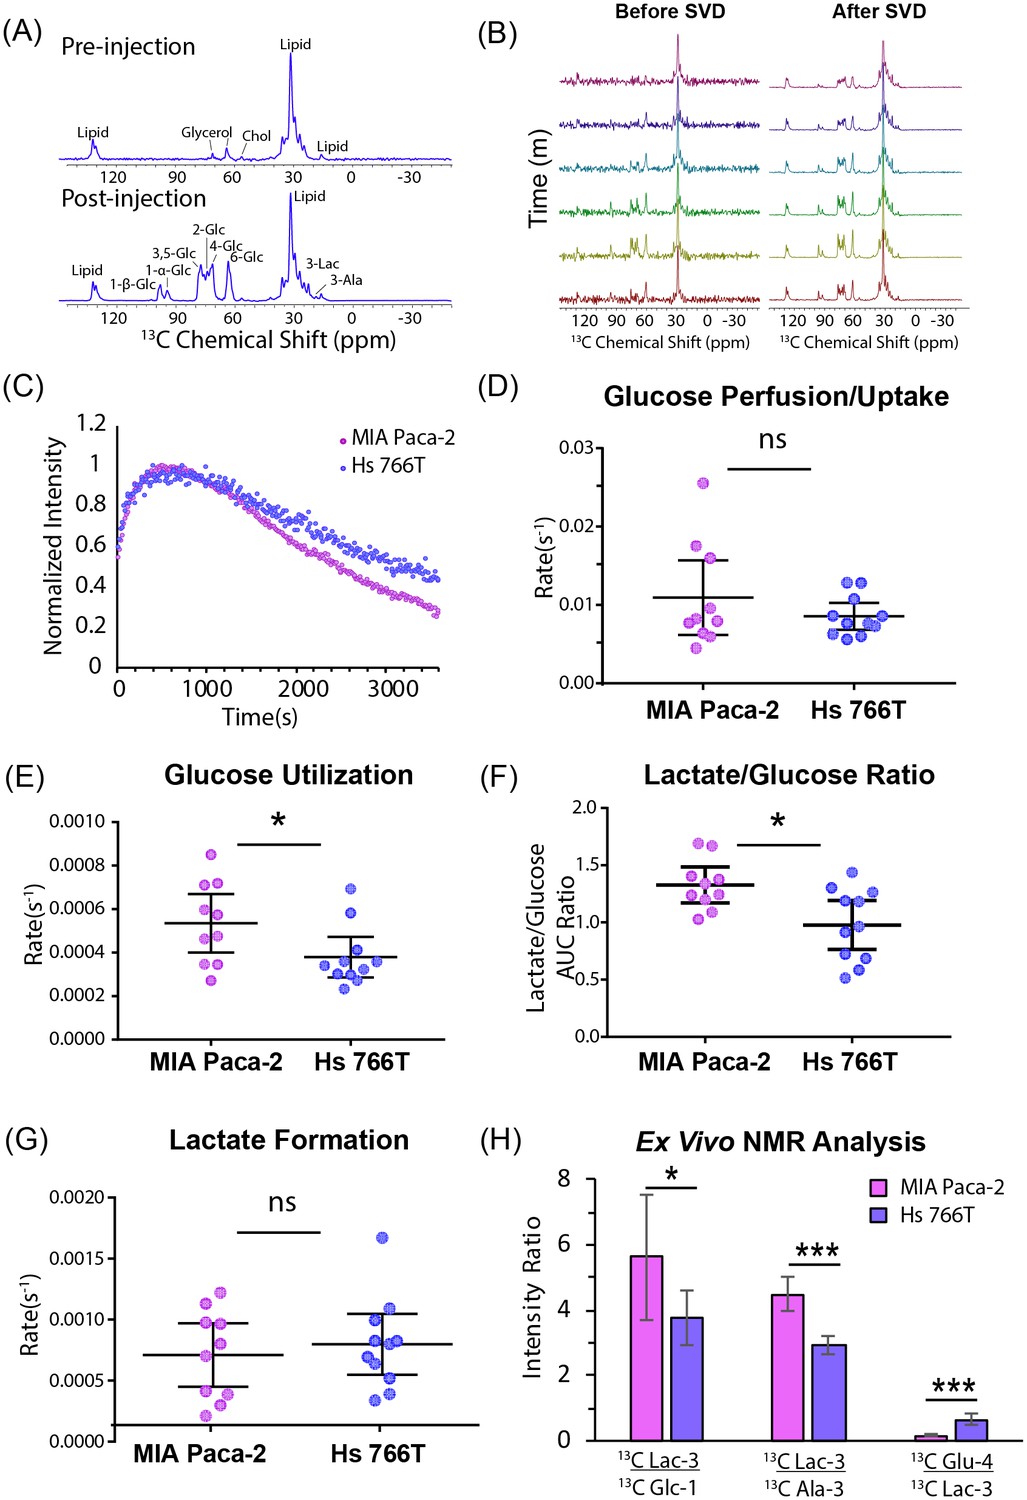
Glucose metabolism differentiates Hs 766T and MiaPaca2 xenografts.
(A) Representative signal before and 1 hr after injecting 50 mg of [U-13C] glucose into the tail vein of a mouse of a nude mouse with a MIA Paca-2 leg xenograft. The largest signal at 32 ppm is due to endogenous lipids, while glucose peaks can be seen in region from 60 to 100 ppm and lactate and alanine peaks can be detected at 22.8 ppm and 18.9 ppm, respectively. (B) Representative signals before and after rank reduction by SVD to reduce noise. No hyperpolarization is used in this experiment; the time dependence of the signal is due to metabolic interconversion. Spectra were acquired every 16 s (16 averages per scan). (C) Representative kinetic traces for the glucose signal at 98 ppm for Hs 766T (n = 10) and MIA Paca-2 (n = 11) xenografts. (D–F) Whether expressed as directly as rate obtained from curve-fitting (E) or as a ratio (F), a statistically significant difference in the rate of glucose metabolism can be seen between the Hs 766T or MIA Paca-2 PANC subtypes (Mann Whitney rank test, p=0.05 and 0.03 respectively). No statistically significant difference could be seen in the rate of glucose uptake (D) or lactate production (G). (H) Ex vivo NMR analysis of glucose and glucose-derived metabolites in the polar extract of the tumor xenografts (n = 5 for each group). Error bars in all cases represent 95% confidence intervals.
Figure 3—figure supplement 1
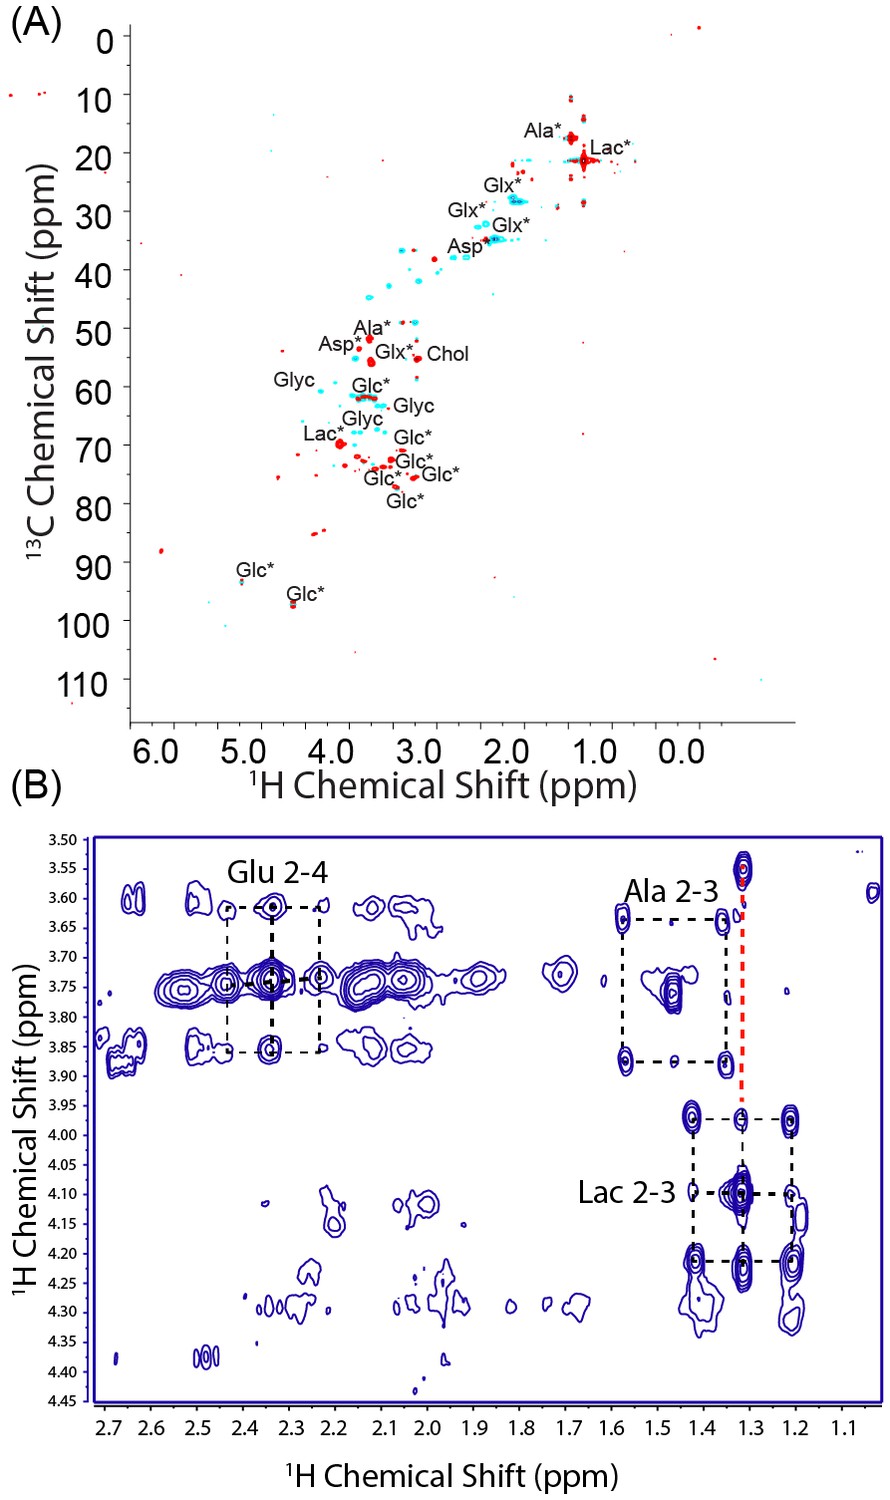
Ex vivo NMR analysis of Hs766T and MIA Paca-2 xenografts.
(A) Representative multiplicity edited HSQC from the polar fraction of a Hs 766T xenograft. The sign of the peak is reflective of the proton connectivity of the carbon: positive peaks (red) arise from functional groups with an odd number of hydrogens such as methine (CH) and methyl (CH3) groups, while signals with negative peaks (blue) arise from carbons with an even number of hydrogens such as quaternary (C) and methylene (CH2) groups. Major resonances are assigned as follows Glc*=glucose, Lac*=lactate, Ala*=alanine, Asp*=aspartic acid, Glx*=glutamate/glutamine, Glyc = glycerol containing, Chol = choline containing. Peaks originating from the 13C glucose bolus are identified by the presence of 13C coupling and marked with an *. (B) 13C satellites for the primary downstream metabolites lactate, alanine, and glutamate. The vertical and horizontal lines represent 13C12C and 12C13C coupling, respectively, and indicate metabolic scrambling from unlabeled precursors. The dashed red vertical line shows a crosspeak of Thr that overlaps with lactate in the 1D proton spectrum.
Figure 4

CSI imaging of a Hs 766T mouse leg xenograft after a 50 mg [U-13C] glucose injection in a volume of 300 microliters of PBS.
An 8 × 8 image of the tumor bearing mouse leg was acquired by chemical shift imaging every 48 s for 60 min. The final image was zero-filled to 16 × 16. Each is voxel 0.15 cm x 0.15 cm x 1.6 cm in size. (A) The glucose region of the spectra at 12 min overlaid on the anatomical image. (B) Same image after tensor factorization. (C and D) Rate map of (C) glucose and (D) lactate metabolism calculated from the image series (E and F). Signal from the voxel indicated by the white dashed line (E) before and (F) after tensor factorization. (G) Contour maps created from the peak maximums of the glucose and lactate signals at the time points indicated.
Figure 5
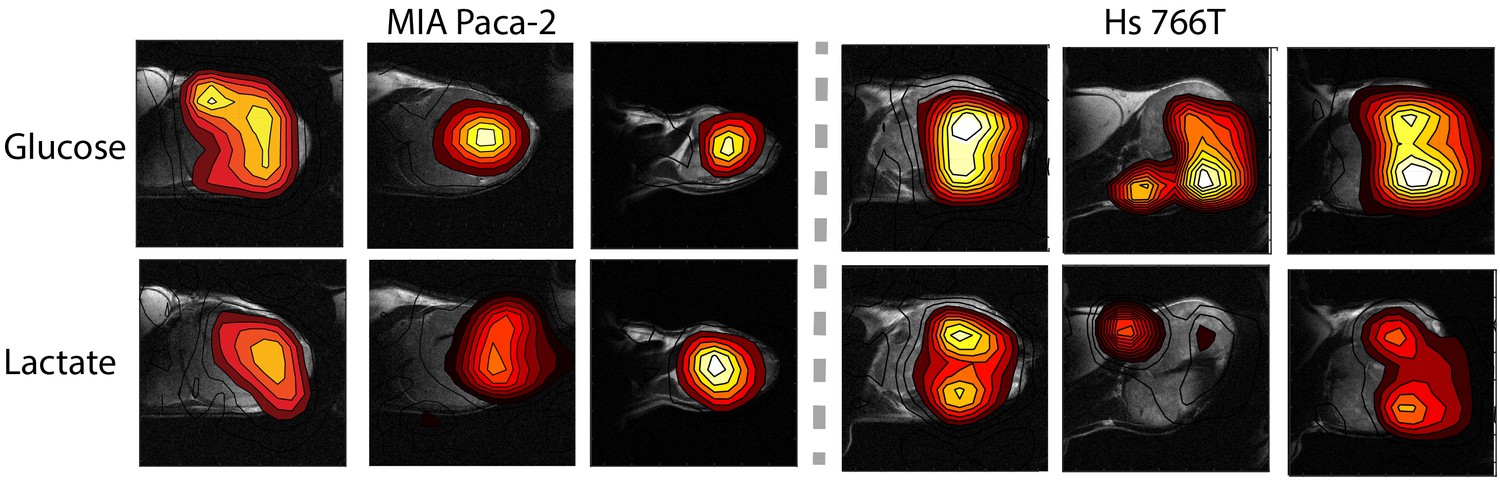
Contour maps created from time averages of the peak maxia of the glucose and lactate signals for three representative MIA Paca-2 (left) and Hs 766T (right) tumors.
https://doi.org/10.7554/eLife.46312.010Additional files
-
Transparent reporting form
- https://doi.org/10.7554/eLife.46312.011
Download links
A two-part list of links to download the article, or parts of the article, in various formats.
Downloads (link to download the article as PDF)
Open citations (links to open the citations from this article in various online reference manager services)
Cite this article (links to download the citations from this article in formats compatible with various reference manager tools)
Imaging of glucose metabolism by 13C-MRI distinguishes pancreatic cancer subtypes in mice
eLife 8:e46312.
https://doi.org/10.7554/eLife.46312


