Combinations of Spok genes create multiple meiotic drivers in Podospora
- Uppsala University, Sweden
- University of Bordeaux, France
- Wageningen University, Netherlands
Figures
Box 1—figure 1
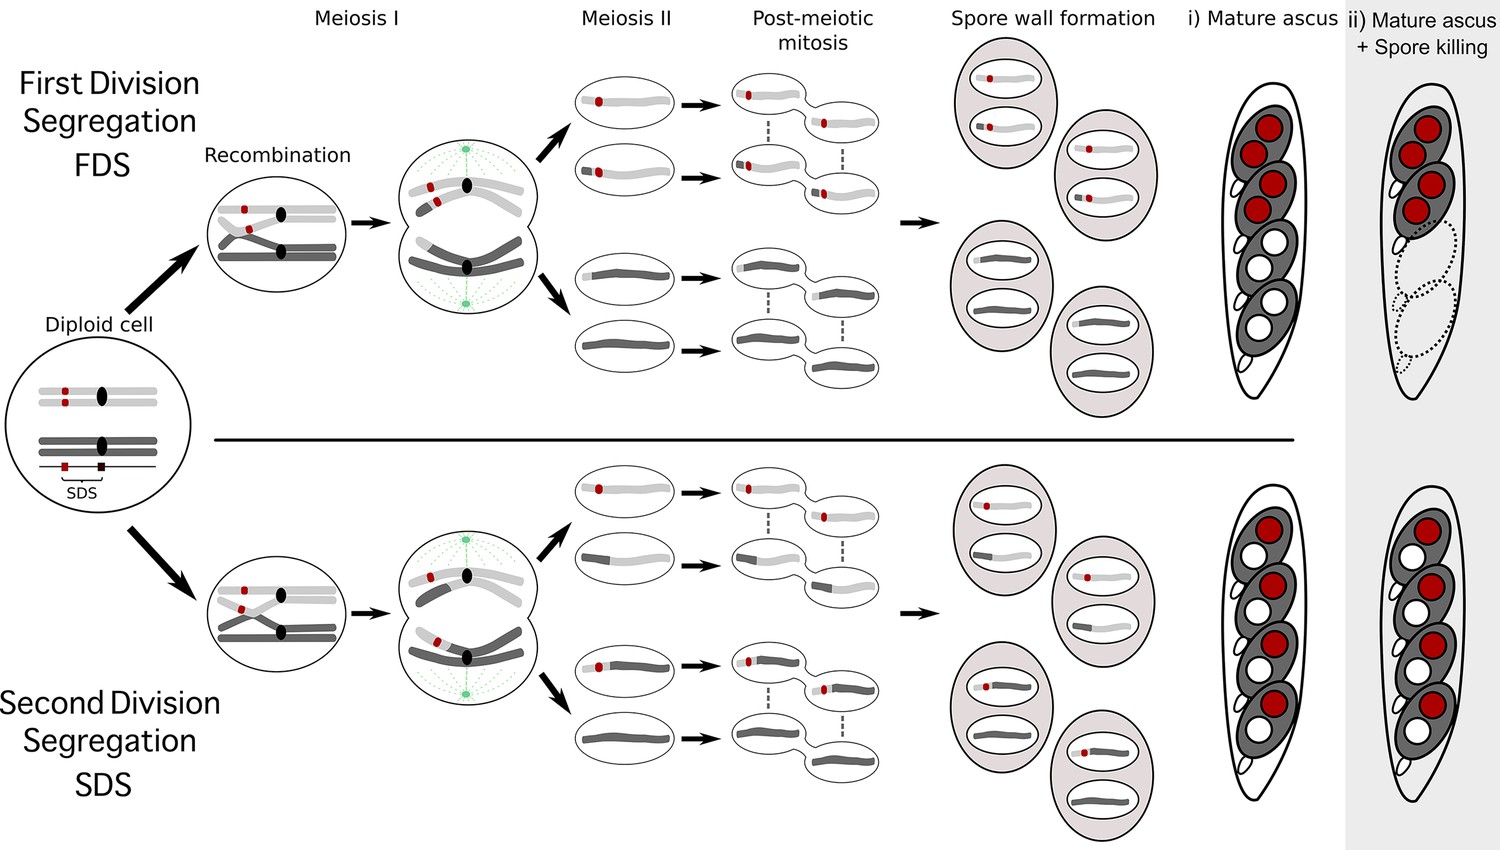
Schematic representation of meiotic segregation in Podospora anserina.
https://doi.org/10.7554/eLife.46454.003
Figure 1 with 1 supplement
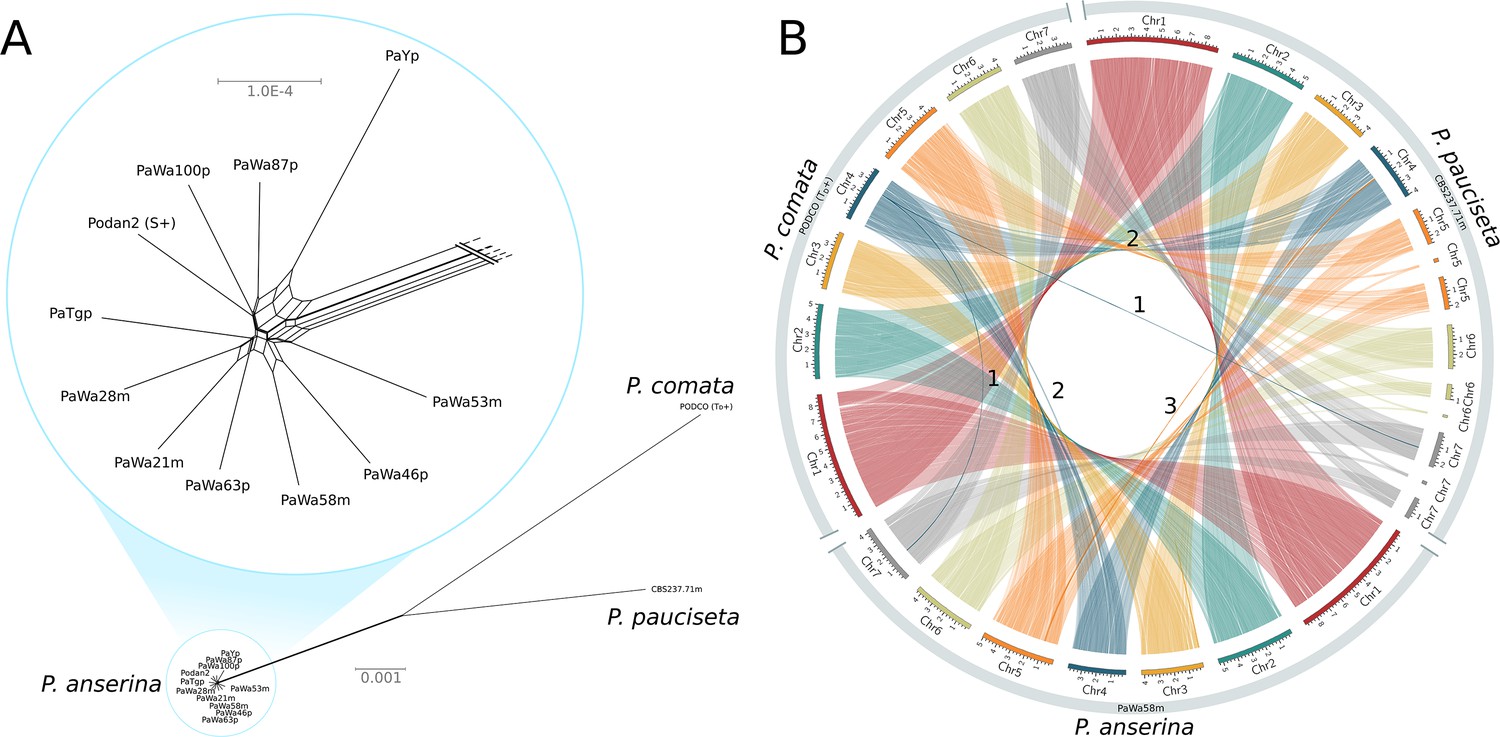
Relationship and synteny of Podospora strains.
(A) An unrooted NeighborNet split network based on 1000 orthologous genes of the strains representing the three Podospora species shows that the species are distinct from each other but still closely related. A close-up of the cluster of P. anserina strains reveals a reticulated relationship and very low genetic diversity (average genic distance of 99.97%). (B) A Circos plot of NUCmer alignments (larger than 13 kb) between the reference genome of P. comata, the new genome of P. pauciseta, and a representative strain of P. anserina. Chromosomes 5, 6, and 7 of P. pauciseta are not fully assembled, in particular around regions matching the location of the centromere in the P. anserina linkage map (not shown). Regardless, the alignment of the assembled region shows highly conserved large-scale synteny between the taxa, with the exception of three large translocation events marked with numbers. Numbers 1 and 2 are potential mis-assemblies in the P. comata reference genome, whereas the translocation number 3 between P. pauciseta and P. anserina corresponds to the Spok block. See Figure 1—figure supplement 1 for an equivalent Circos plot of inversions.
Figure 1—figure supplement 1
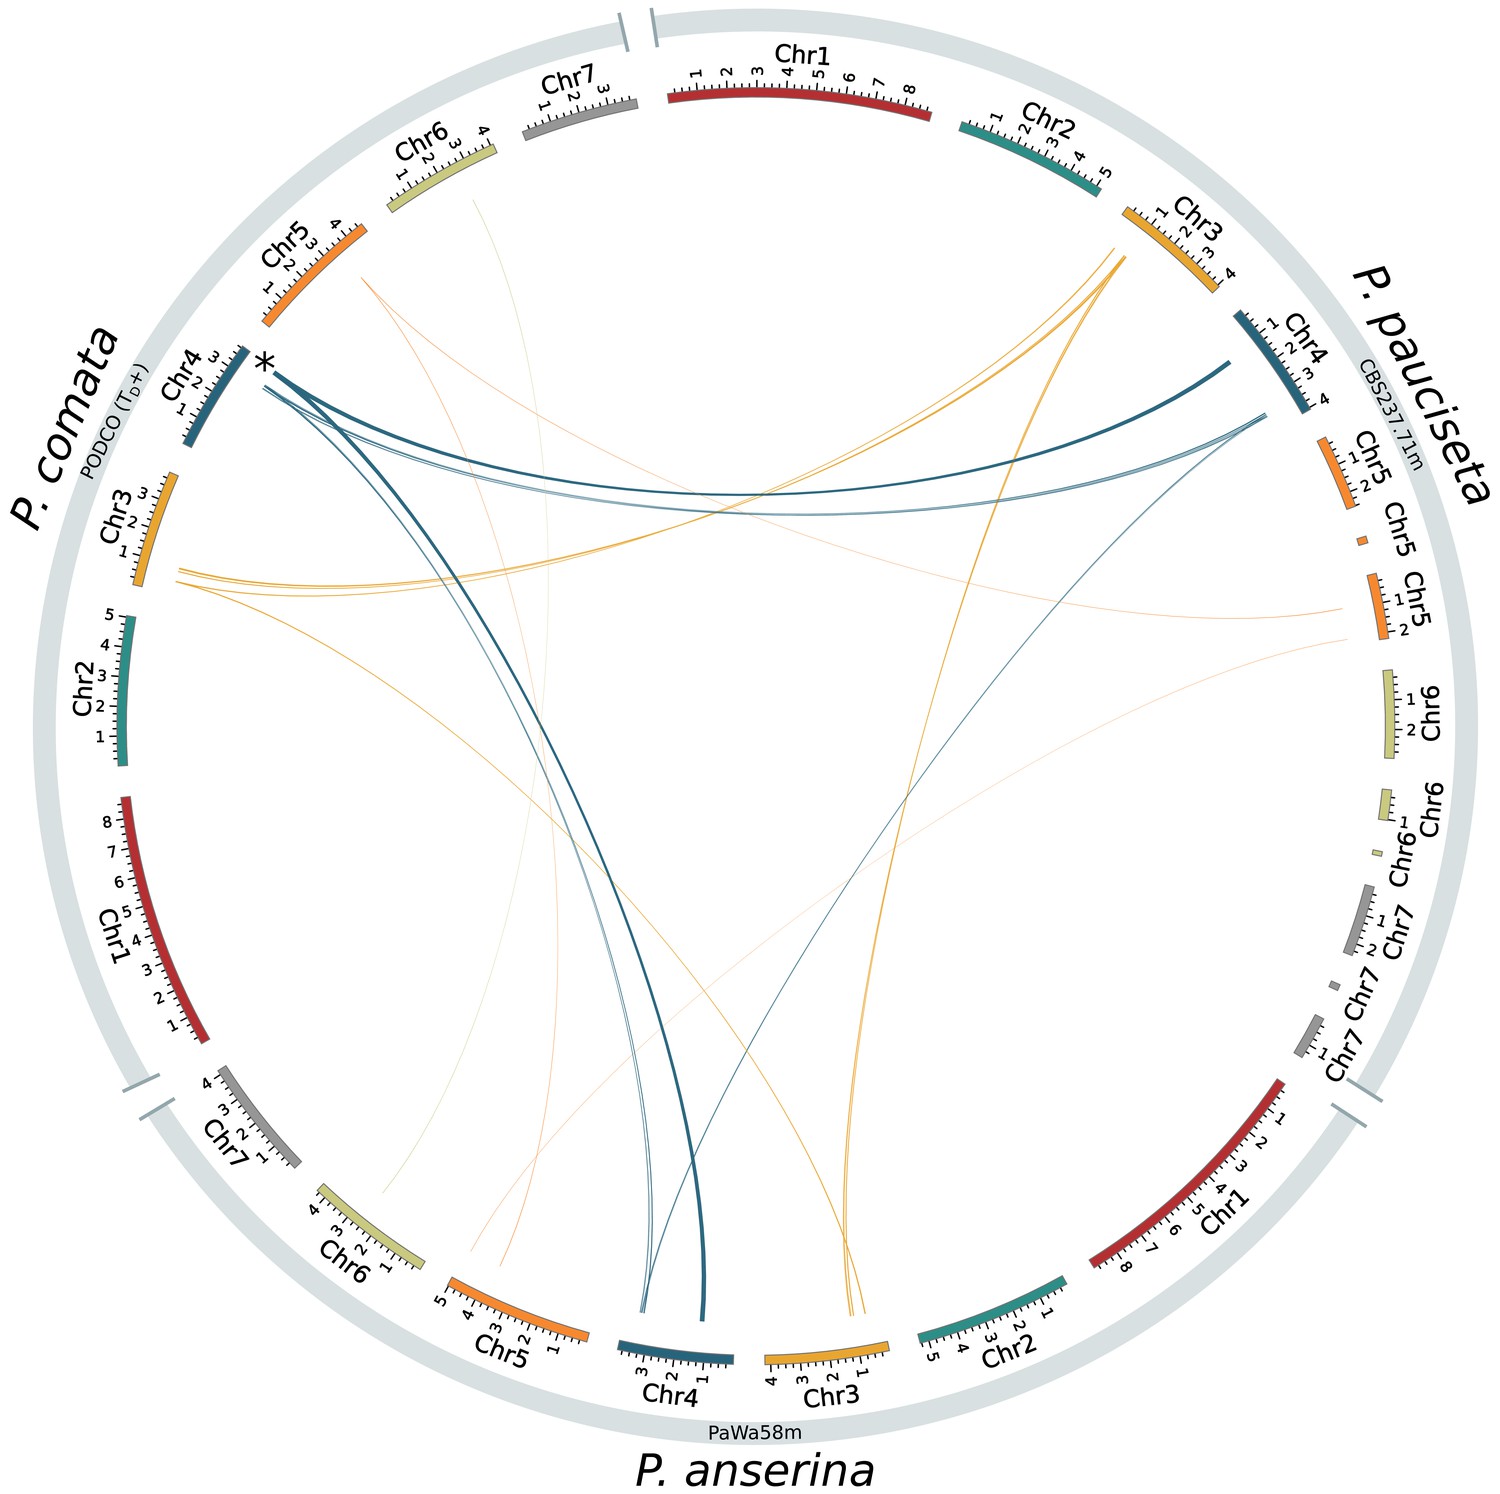
Circos plot showing only inversions (larger than 13 kb) between the reference genome of P. comata, the new genome of P. pauciseta, and a representative strain of P. anserina.
The asterisk in chromosome 4 of P. comata corresponds to translocation number 2 in Figure 1 and might be a misassembly. Line thickness is proportional to alignment length.
Figure 2 with 2 supplements
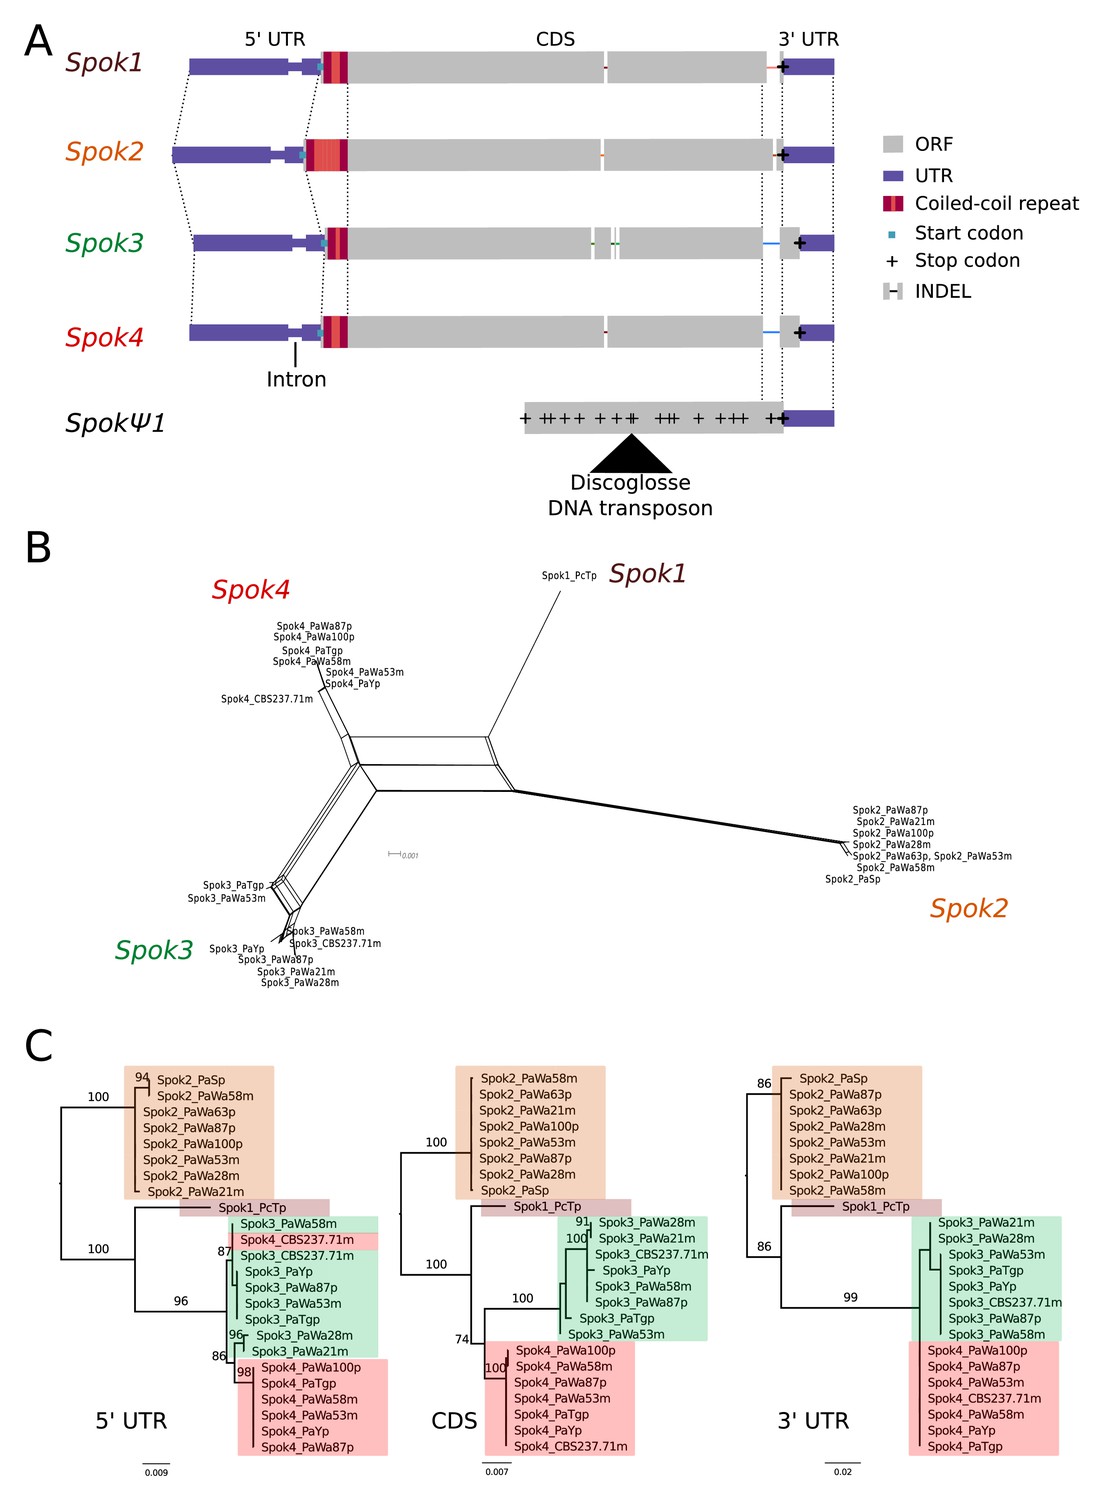
Relationships among the Spok homologs.
(A) Schematic representation of the main features of the Spok genes. All homologs share an intron within the 5' UTR. At the start of the coding region (CDS) there is a repeat region, in which the number of repeats varies among the homologs. The central portion of the CDS has a number of indels, which appear to be independent deletions in each of Spok2, Spok3, and Spok4. There is a frameshift mutation at the 3' end of the CDS that shifts the stop codon of Spok3 and Spok4 into what is the 3' UTR of Spok1 and Spok2. The pseudogenized Spok gene (SpokΨ1) contains none of the aforementioned central indels and appears to share the stop codon of Spok1 and Spok2. However, there are numerous mutations that result in stop codons within the CDS as well as a full DNA transposon (discoglosse) insertion. No homologous sequence of the 5' end of SpokΨ1 is present. (B) A NeighborNet split network of all active Spok genes from all strains sequenced in this study. The four homologs cluster together well, but there are a number of reticulations, which presumably are the result of gene conversion events. (C) Maximum likelihood trees based on three separate regions of the Spok genes: the 5' UTR, the CDS, and the 3' UTR (starting from the stop codon of Spok3 and Spok4). The trees are rooted arbitrarily using Spok2. Branches are drawn proportional to the scale bar (substitutions per site), with bootstrap support values higher than 70 shown above.
Figure 2—figure supplement 1
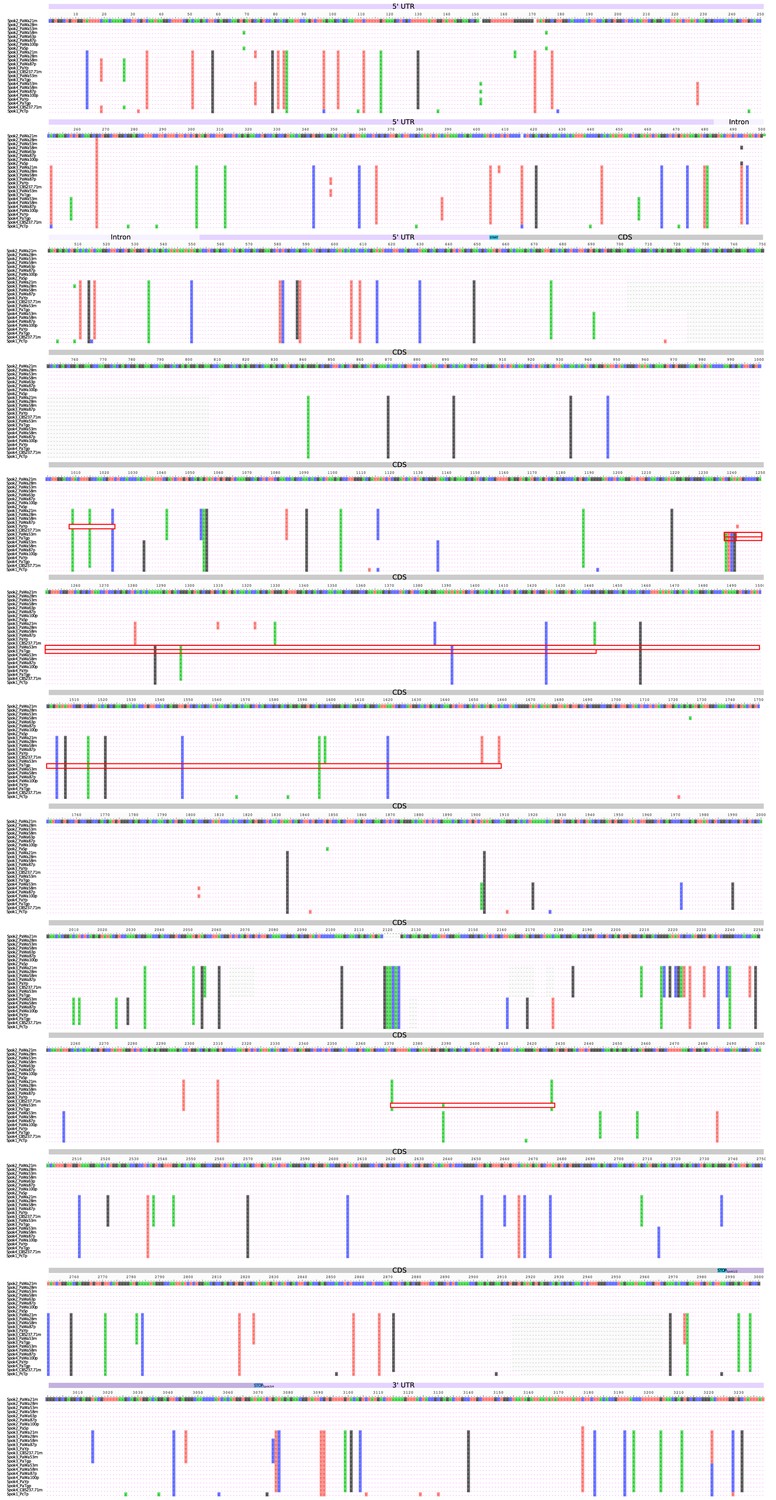
Nucleotide alignment of the Spok homologs from the strains sequenced with long-read technologies.
The alignment includes the UTRs and intron. Start and stop codons are marked above the alignment track and the regions of putative gene conversion are encased in red boxes.
Figure 2—figure supplement 2
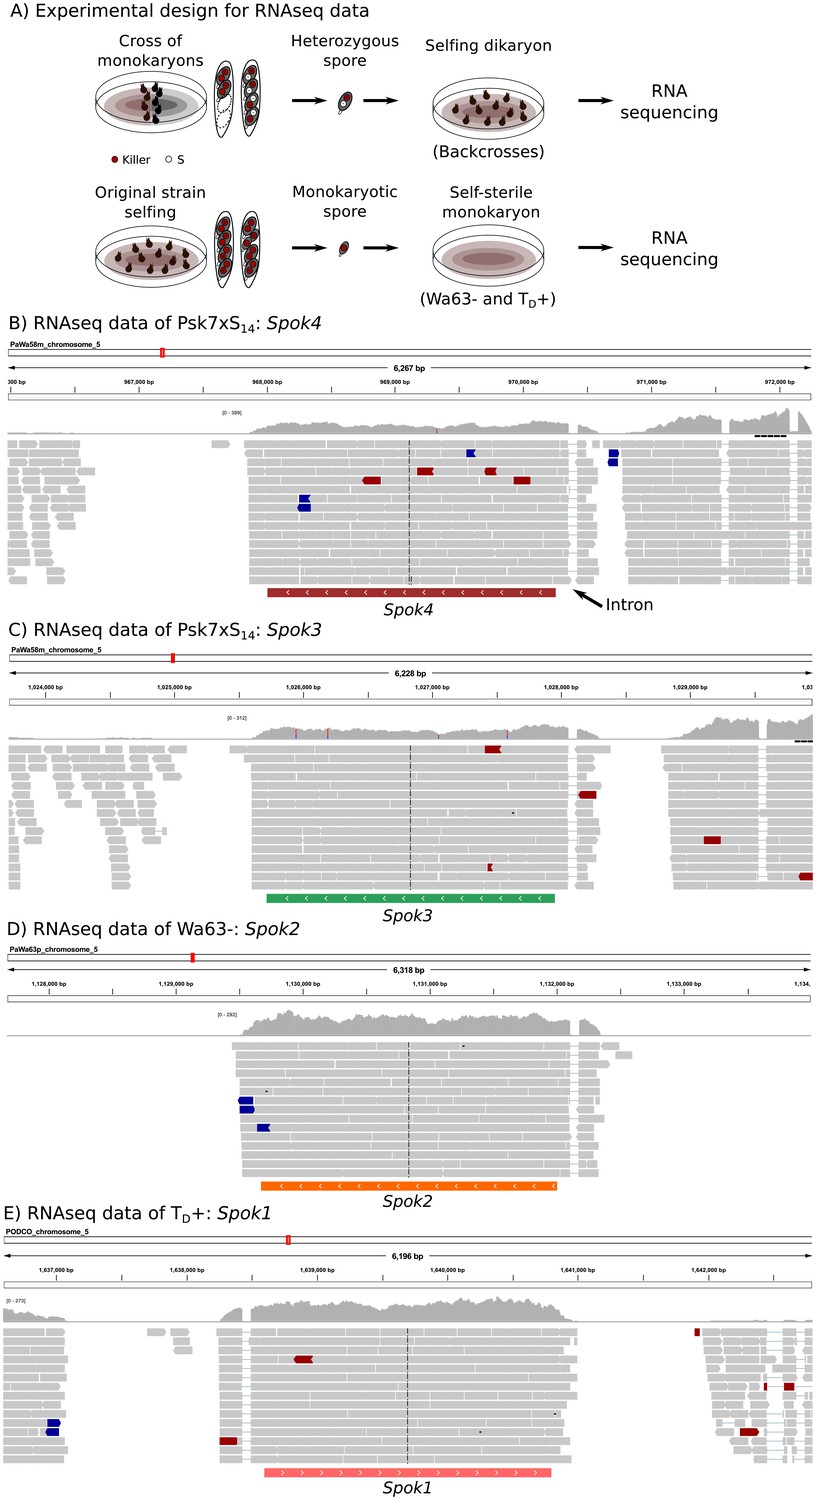
The expression of Spok genes based on RNAseq data.
In order to ensure the expression of the killer elements, we extracted RNA from an isolated self-killing heterozygote spore, produced by mating the monokaryotic Psk S14 backcrosses to a monokaryon S of opposite mating type (top of (A)). RNAseq of monokaryotic (self-sterile) spores was also obtained (bottom of (A)). The RNAseq data of one self-killing culture (Psk7xS14 vs S) mapped to Wa58– (Psk-7) illustrates the expression of both Spok4 (B) and Spok3 (C). The expression of Spok2 (D) and Spok1 (E) in vegetative cells can be appreciated in the RNAseq data of Wa63– and TD+, respectively. In all cases, the predicted single exon of each Spok gene is shown below the reads, which in turn reveals an intron in the 5'UTR. Read colors follow the defaults in the genome browser IGV, with gray reads having typical expected insert size, and blue and red reads having slightly too small or too large insert sizes, respectively. The distributions above the reads correspond to the depth of coverage. Some sites appear to be polymorphic (blue and red bars in the depth distributions) due to low frequency mismapping of reads from other Spok homologs.
Figure 3
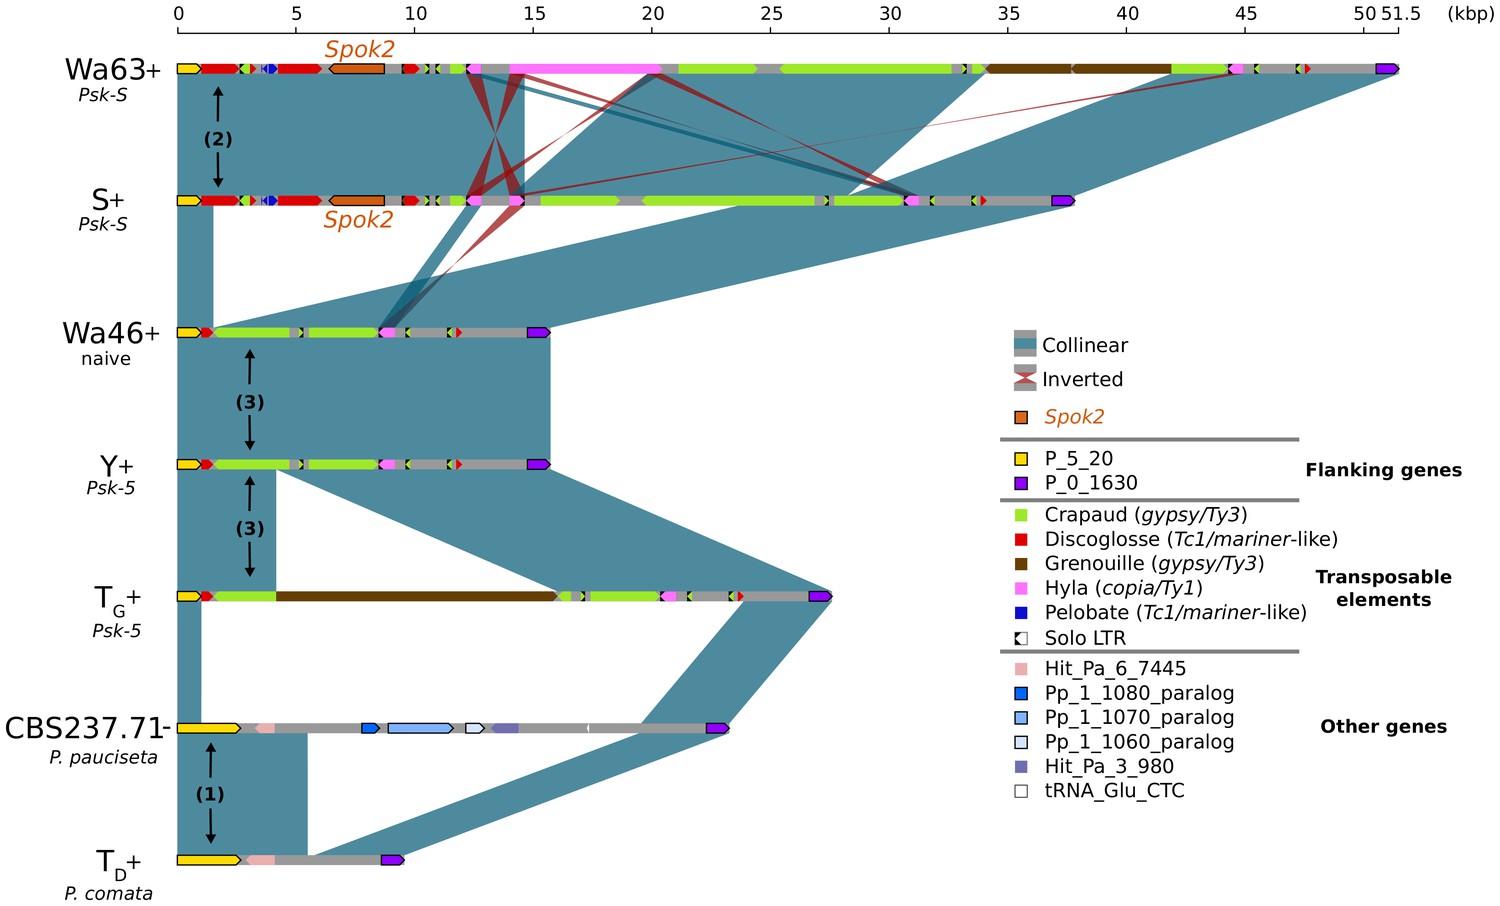
Alignment of the Spok2 locus in selected strains.
The plot displays pairwise comparisons of Spok2 haplotypes with blue segments connecting syntenic regions of homology and red segments showing inversions. The haplotypes are defined by the flanking genes P_5_20 and P_0_1630 located on chromosome 5 of the three sampled species. Every strain has a haplotype of different size, mainly owing to differences in their transposable element (TE) content. Within P. anserina, the TE variation across all sequenced strains occurs downstream of Spok2, as exemplified by strains Wa63 and S. The strains Wa46, Y and TG all lack Spok2 and share break points. See main text for a hypothesis of events (numbered). Notice that P_5_20 stands for the genes Pa_5_20 and PODCO_500020 in the reference annotation of P. anserina and P. comata, respectively, while P_0_1630 stands for Pa_0_1630 and PODCO_001630. As a note, P. pauciseta has a duplication of three genes in tandem from chromosome 1 (Pa_1_1080–60) between the flanking genes. Hit_Pa_X_XXX genes stand for significant BLAST hits to genes of Podan2. TE nomenclature follows Espagne et al. (2008).
-
Figure 3—source data 1
Annotation file for TEs surrounding Spok2.
- https://doi.org/10.7554/eLife.46454.013
Figure 4 with 5 supplements
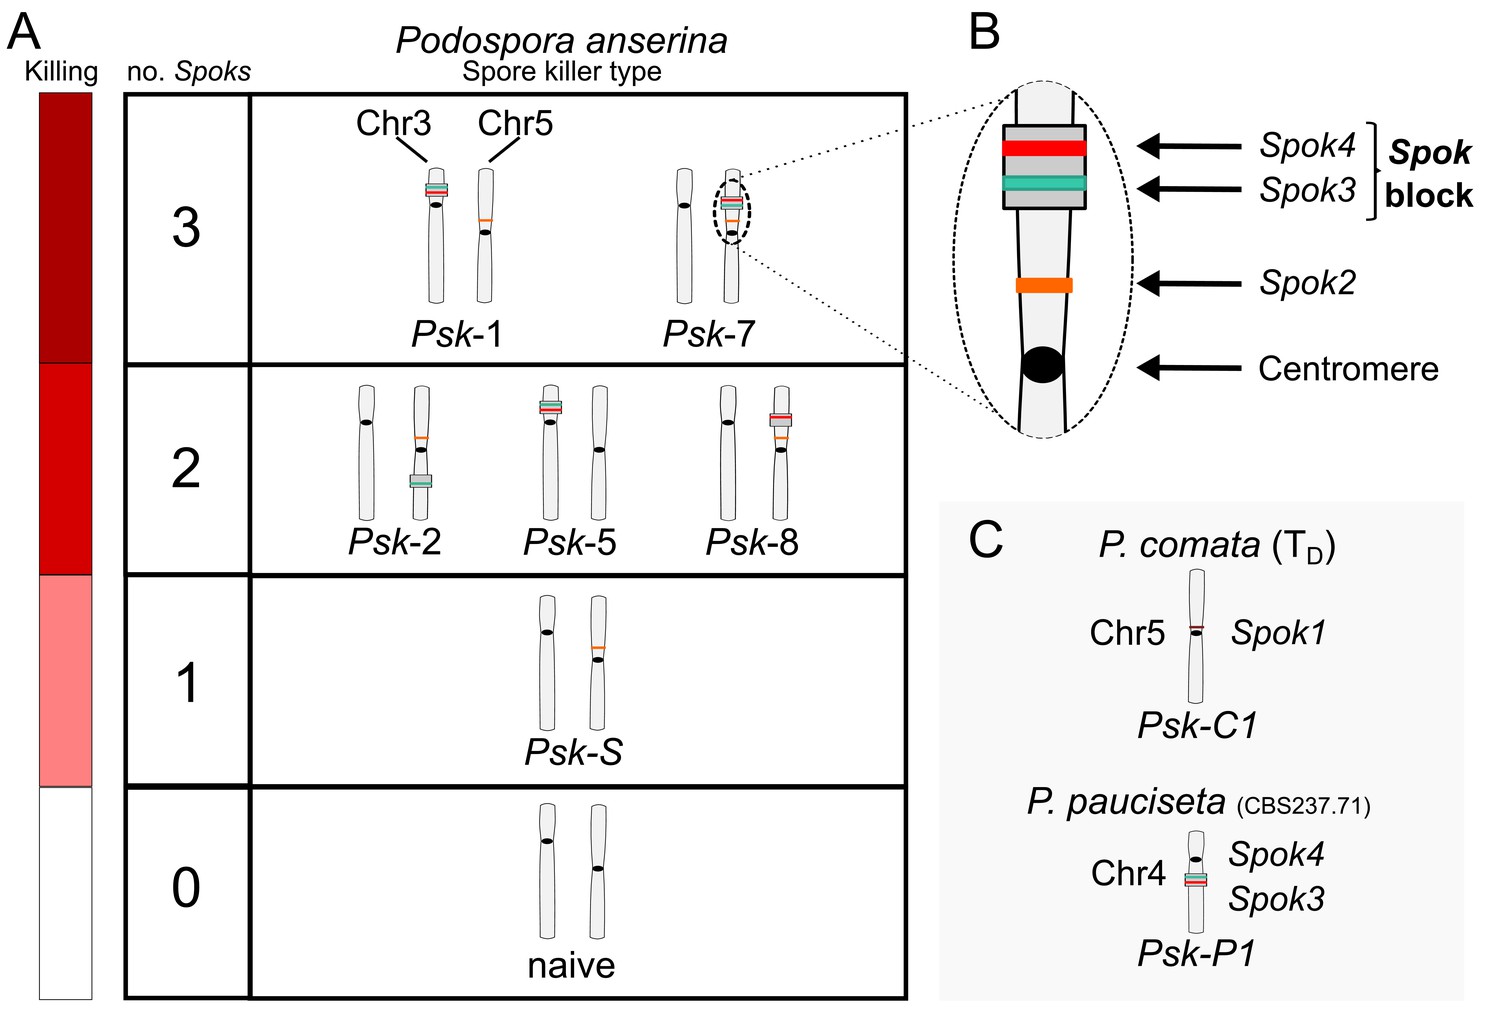
Interactions among the various Psk types and the occurrence of Spok genes.
(A) The boxes represent hierarchical levels that increase in killing dominance from bottom to top, which correlate with the number of Spok genes that a strain possesses. Strains with three Spok genes induce the spore-killing of strains with only two Spok genes and show mutual resistance to each other. Strains with two Spok genes show mutual killing among themselves due to the different Spok genes and kill strains with only Spok2. Strains with one Spok kill strains with no Spok genes (naïve strains). The chromosome diagrams depict the presence of the Spok genes and their location in the genome for the sequenced strains. (B) A zoomed-in look at Chromosome 5 of a Psk-7 strain, demonstrating that Spok3 and Spok4 are present in the Spok block and that Spok2 is present at the standard location. (C) The closely related species P. comata and P. pauciseta also possess Spok genes, but at different locations. The Spok genes in P. pauciseta are present in a smaller Spok block, whereas Spok1 is found on its own and exclusively in P. comata.
-
Figure 4—source data 1
Table showing which type of data was used to infer pairwise interactions amongst all Psks.
See Figure 4—source data 2 for killing percentages and Figure 4—source data 3 for backcross data.
- https://doi.org/10.7554/eLife.46454.020
-
Figure 4—source data 2
Table with killing percentages for all crosses tested between strains.
Values reported are FDS percentages with the total number of asci counted in parentheses.
- https://doi.org/10.7554/eLife.46454.021
-
Figure 4—source data 3
Table with observations of killing to determine pairwise interactions of the Psks.
Observations of spore killing or no spore killing are indicated for backcrosses to parental strains and from selfing. Empty cells indicate infertile crosses.
- https://doi.org/10.7554/eLife.46454.022
Figure 4—figure supplement 1
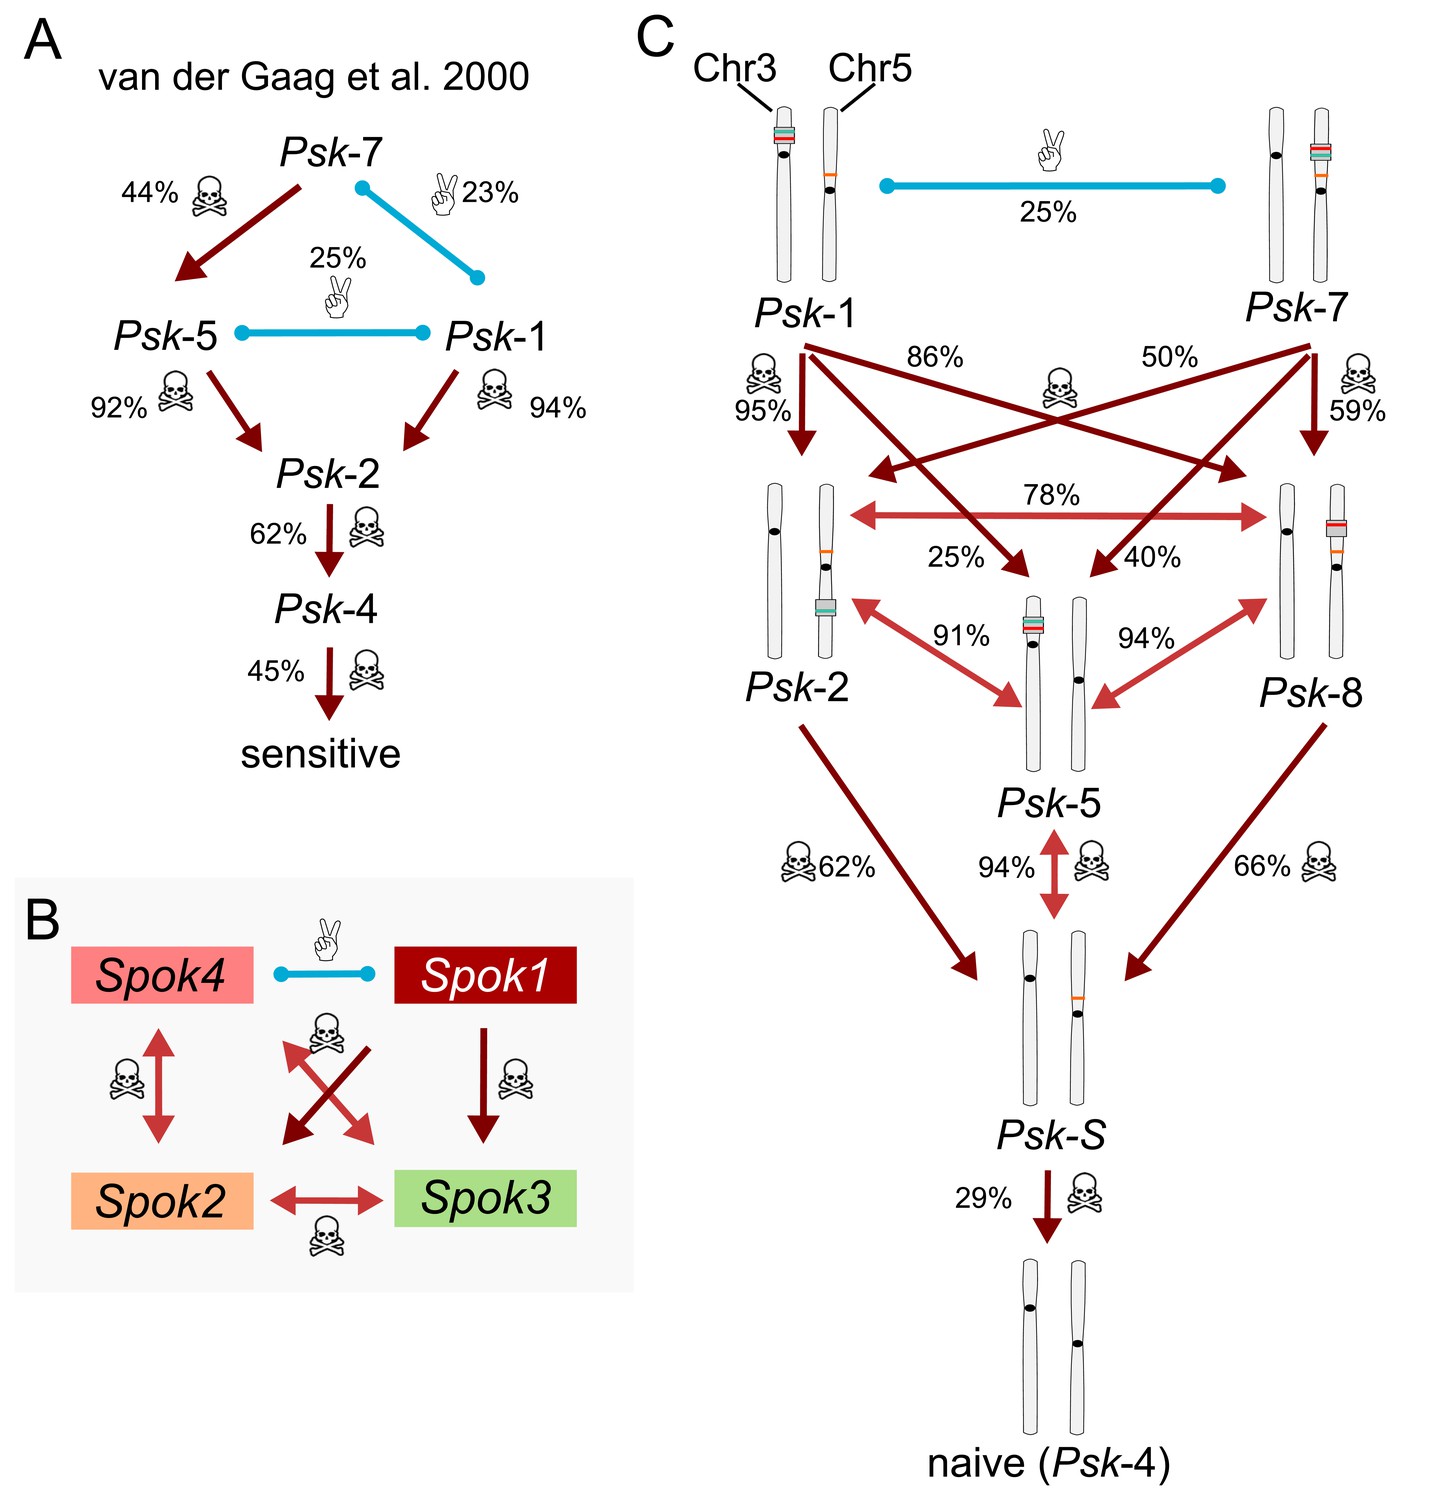
Killing hierarchies among Podospora spore killers.
Light-red arrows with double heads indicate mutual killing, whereas dark-red arrows imply dominance. Blue lines indicate mutual resistance. Killing percentages between different Psks are indicated next to the interactions. (A) Simplified killing hierarchy of the P. anserina spore-killer types described in van der Gaag et al. (2000). Killer capacity goes from maximum at the top to null at the bottom. For example, according to van der Gaag et al. (2000), Psk-7 is mutually resistant with Psk-1 (23% killing due to independent segregation), and it is dominant over Psk-5 and all the other killer types. Notice that in the original work, the sensitive strains where in fact carriers of the Spok2 gene, which is nearly cryptic because of its high frequency in the population. The killer types Psk-6 and Psk-3 are ignored (see main text). (B) Dominance relationships between the known active Spok genes, regardless of chromosomal location. (C) Updated killing hierarchy between the Psk types, with killing percentages based on our own crosses. The chromosomal diagrams make the connection between the content and distribution of the Spok genes and the Psk type.
Figure 4—figure supplement 2
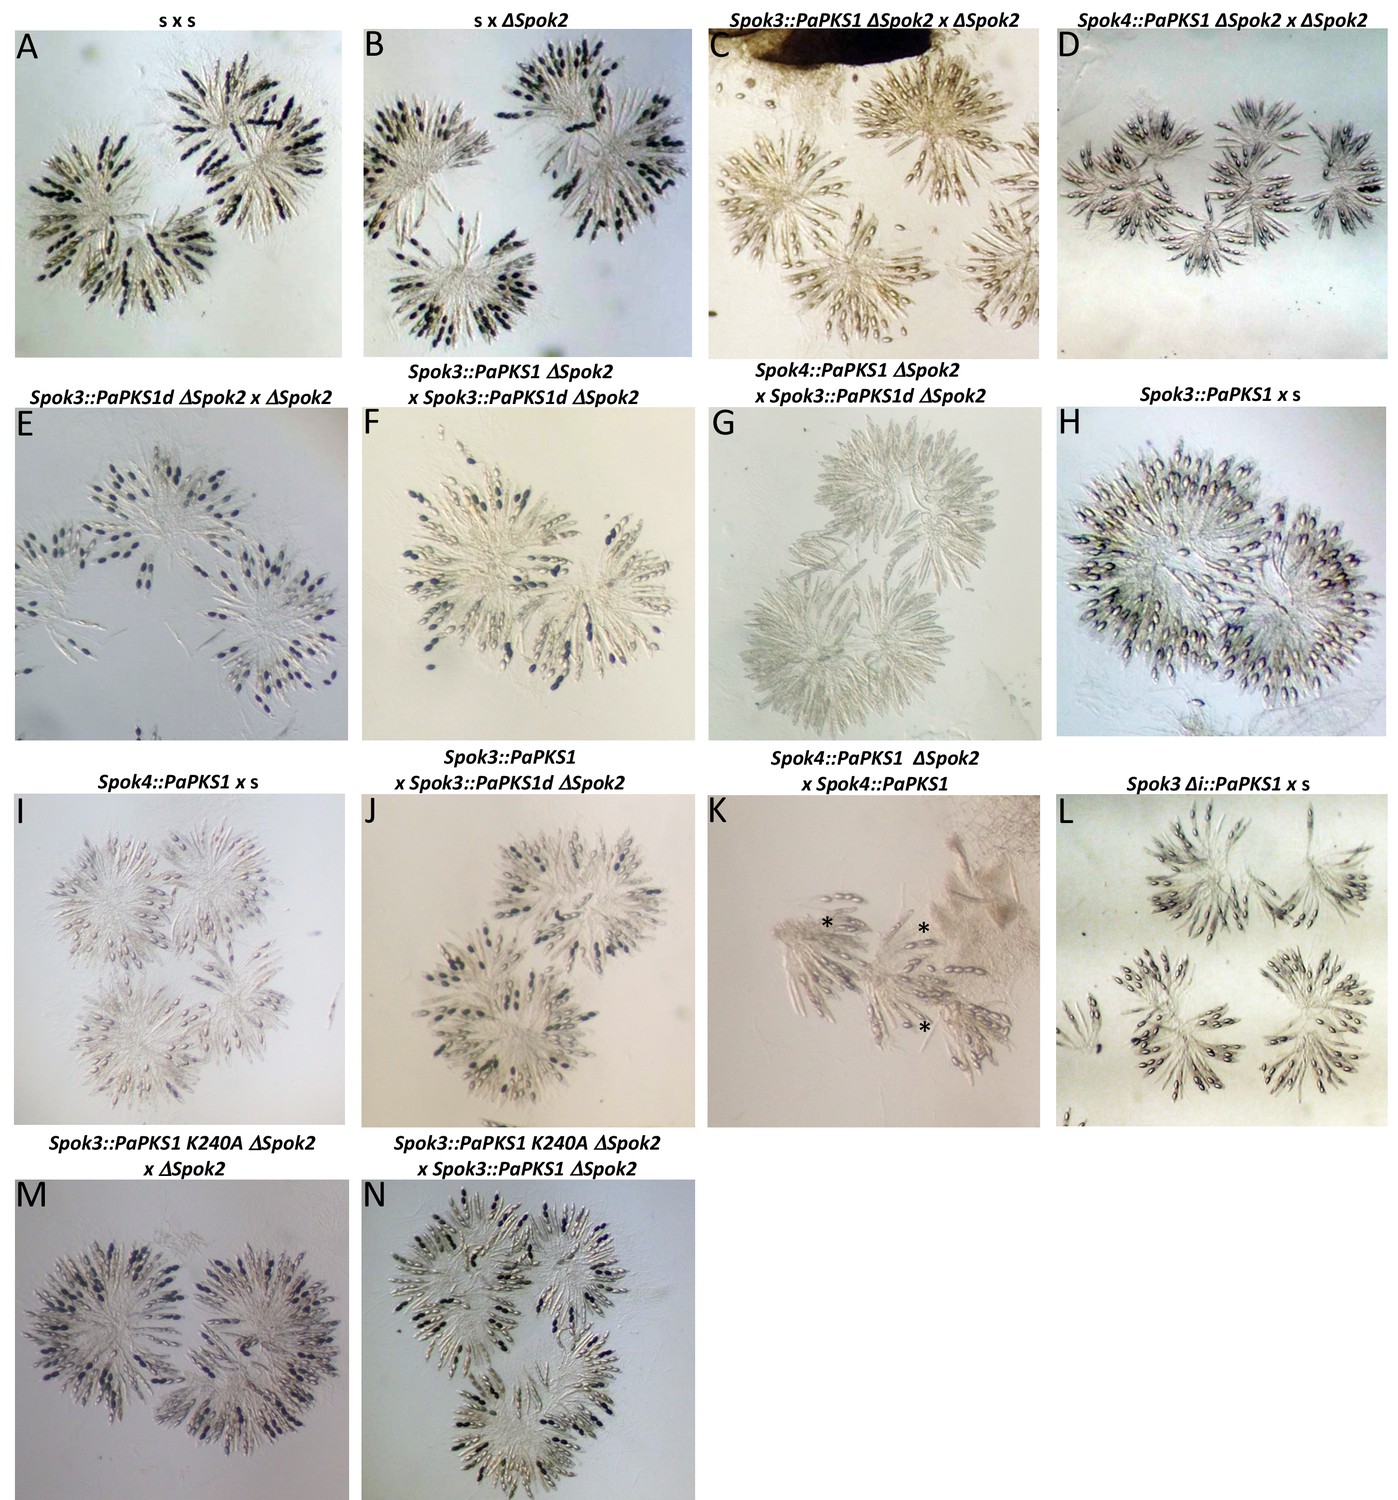
Genetic manipulations of Spok genes in the s strain background.
For each cross, the Spok-genotype of the parents is given above the image of the rosettes. The s x s control cross yields four-spored asci (A) and the s x ΔSpok2 cross about 40% two-spored asci (B). The Spok3::PaPKS1 ΔSpok2 x ΔSpok2 and Spok4::PaPKS1 ΔSpok2 x ΔSpok2 crosses yield two-spored asci with two white spores (C, D). The Spok3::PaPKS1d ΔSpok2 x ΔSpok2 shows two-spored asci with two black spores and the Spok3::PaPKS1 ΔSpok2 x Spok3::PaPKS1d ΔSpok2 cross shows four-spored asci with two white and two black spores, as expected if the integration of Spok3 downstream of the PaPKS1 locus was successful (E, F). The Spok4::PaPKS1 ΔSpok2 x Spok3::PaPKS1d ΔSpok2 cross is barren with close to 100% empty asci (G). Crosses of Spok3::PaPKS1 x s and Spok4::PaPKS1 x s both result in two-spored asci with two white spores (H, I). The Spok3::PaPKS1 x Spok3::PaPKS1 ΔSpok2 yields both four-spored asci with two black and two white spores and two-spored asci with black spores, as expected if Spok2 is inducing spore killing in this cross (J). The Spok4::PaPKS1 ΔSpok2 x Spok4::PaPKS1 cross is of poor quality because of the homozygous deletion of PaPKS1 but shows the presence of some two-spored asci (marked with *), suggesting that Spok2 killing occurs. The Spok3i::PaPKS1 x s (L) is identical to the Spok3::PaPKS1 x s (H), suggesting no role for the intron in the spore-killing action. The Spok3 K204A was inserted at the PaPKS1 locus and the resulting strain was crossed either with a ΔSpok2 strain (M) or a Spok3::PaPKS1d (N). In both cases, four-spored asci with two white and two black spores are produced, indicating that the mutant allele has lost its spore-killing function but retains resistance to Spok3 killing.
Figure 4—figure supplement 3
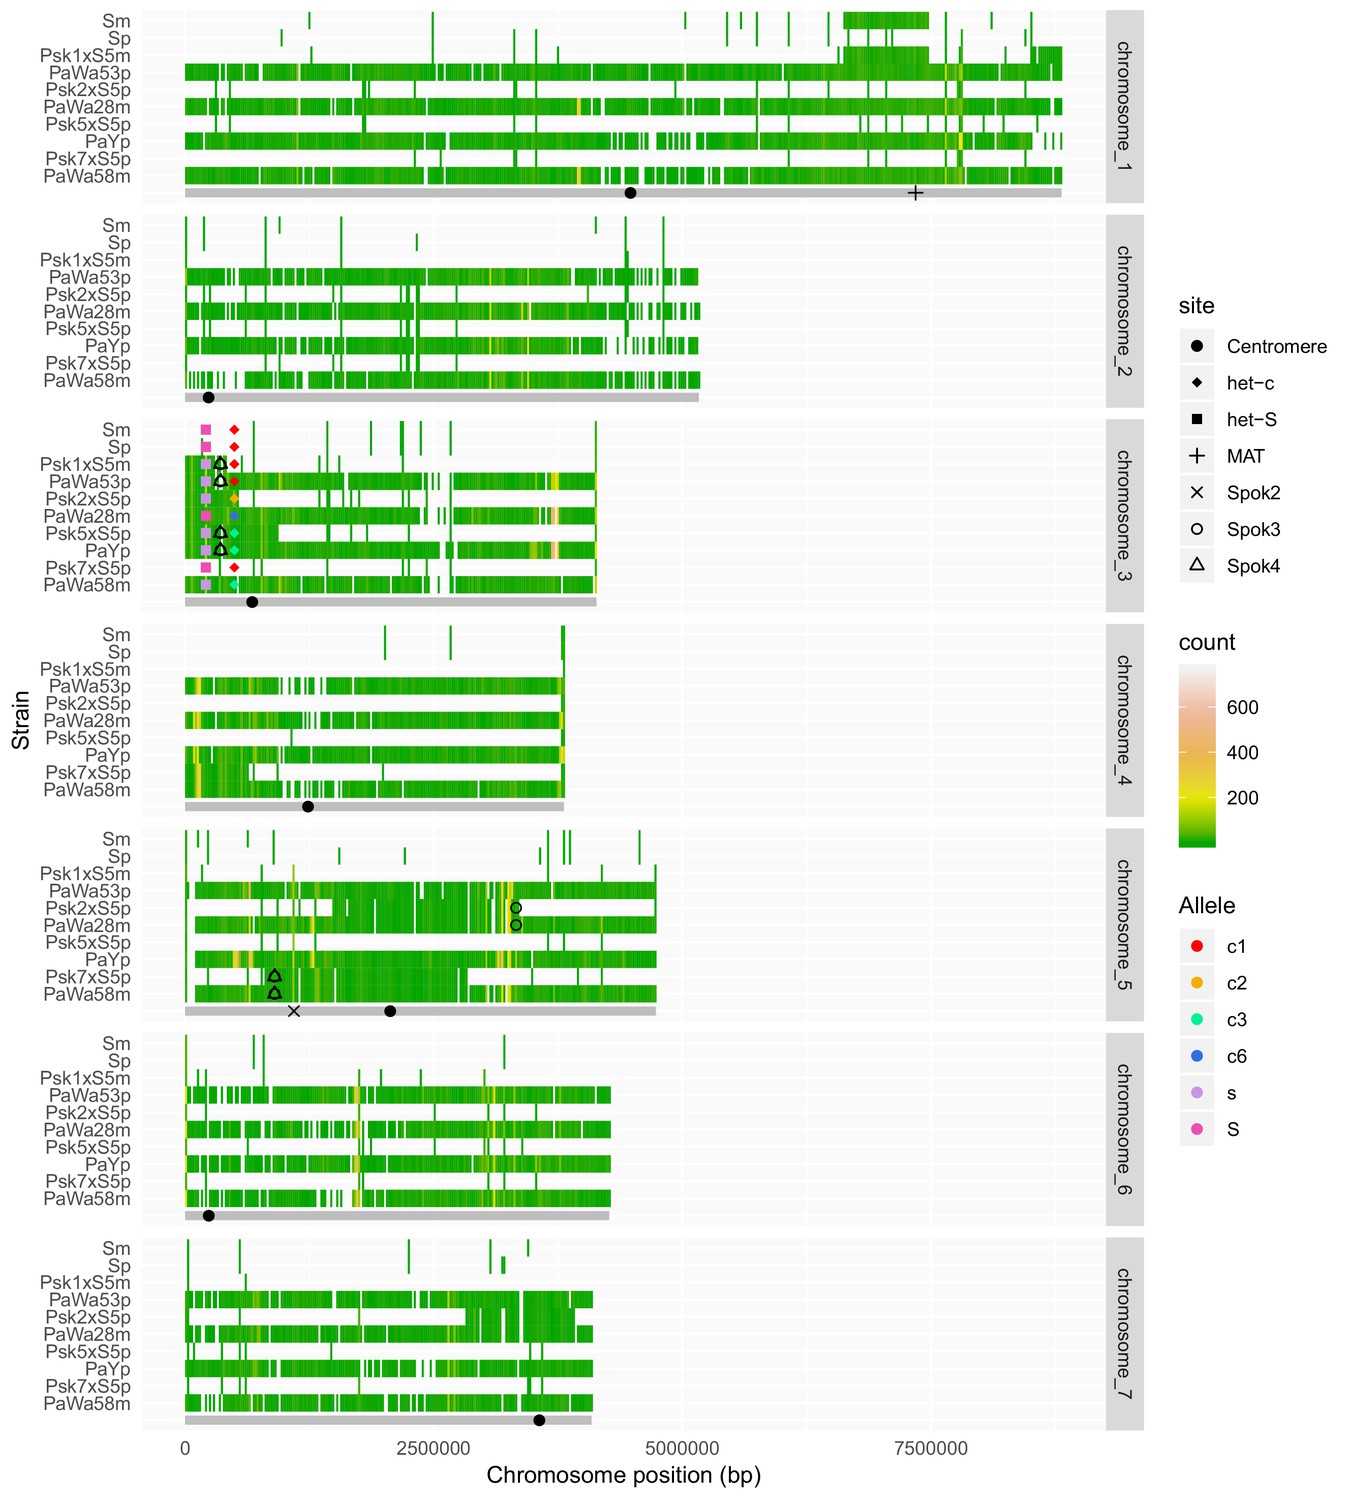
Chromosomal segments remaining in the genomes after backcrossing of spore-killer strains into the S background, along with the parental strains.
Chromosomes were divided in 20-Kbp bins and colored on the basis of the count of SNPs called against the reference (Podan2). Bins that are identical to the reference (no SNPs) are not colored. Below each chromosomal panel, a cartoon in gray shows the length of the chromosome and the position of fixed genomic features that are present in all strains, including the centromere, the mating type (MAT) and Spok2. The centromere positions were approximated on the basis of the genetic map of P. anserina (Silar, 2013) and a large drop in GC content (not shown). When present, the positions of Spok3 and Spok4 were marked on the basis of the insertion point of the Spok block in the long-read assemblies. Known het genes are marked and alleles of het-s and het-c are indicated in different colors. The allele nomenclature of het-c follows Bastiaans et al. (2014).
Figure 4—figure supplement 4
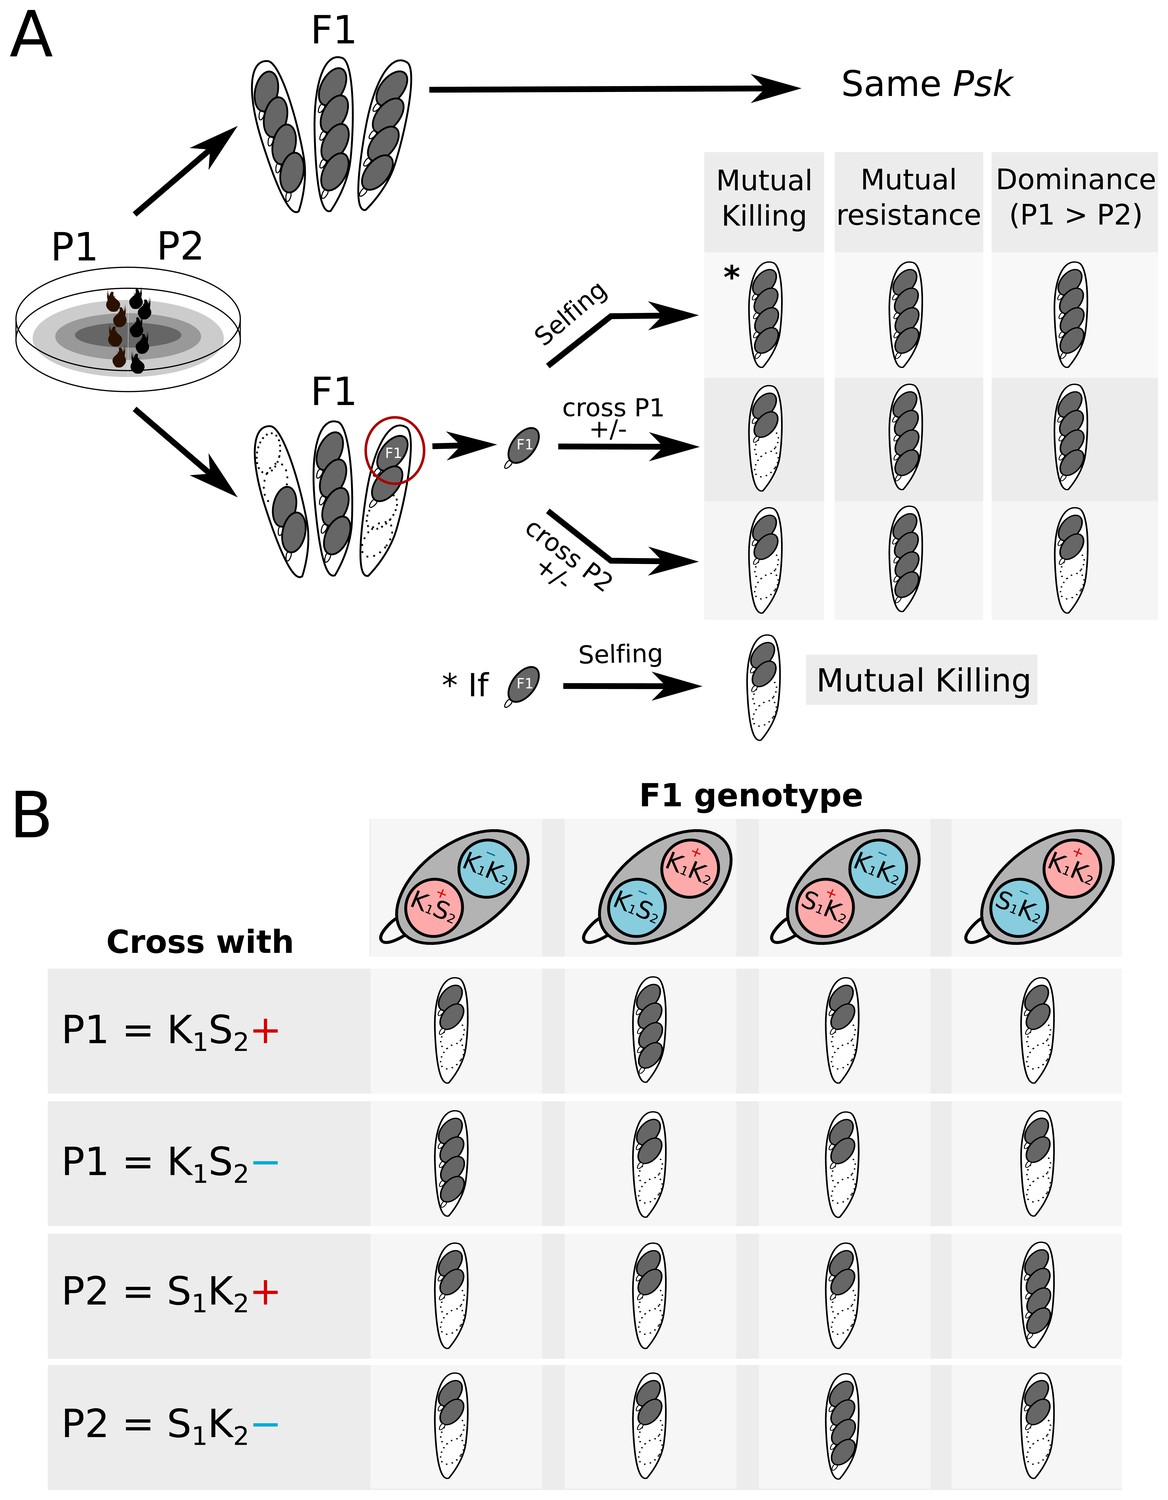
Crossing design to determine killing interactions between strains.
(A) When two parents (P1 and P2) are crossed, no killing is observed if they are of the same Psk (or both naïve). If killing is observed, the interaction can be determined by selecting a spore from a two-spored ascus to generate an F1 progeny for crossing tests. By observing whether spore killing occurs in the test crosses, the interaction between P1 and P2 can be described as either mutual killing, mutual resistance, or dominance. (B) Selfing of F1 progeny from a two-spored ascus can also result in killing. If the killing loci are present at the same locus, all four spores should die. If the loci are unlinked, then the progeny may be one of four possible genotypes. K1 and K2 represent the killing loci of P1 and P2, respectively. S1 and S2 represent the ‘sensitive’ locus of P1 and P2, respectively. The killing loci can also segregate independently from the mat loci (+ in red and – in blue).
Figure 4—figure supplement 5
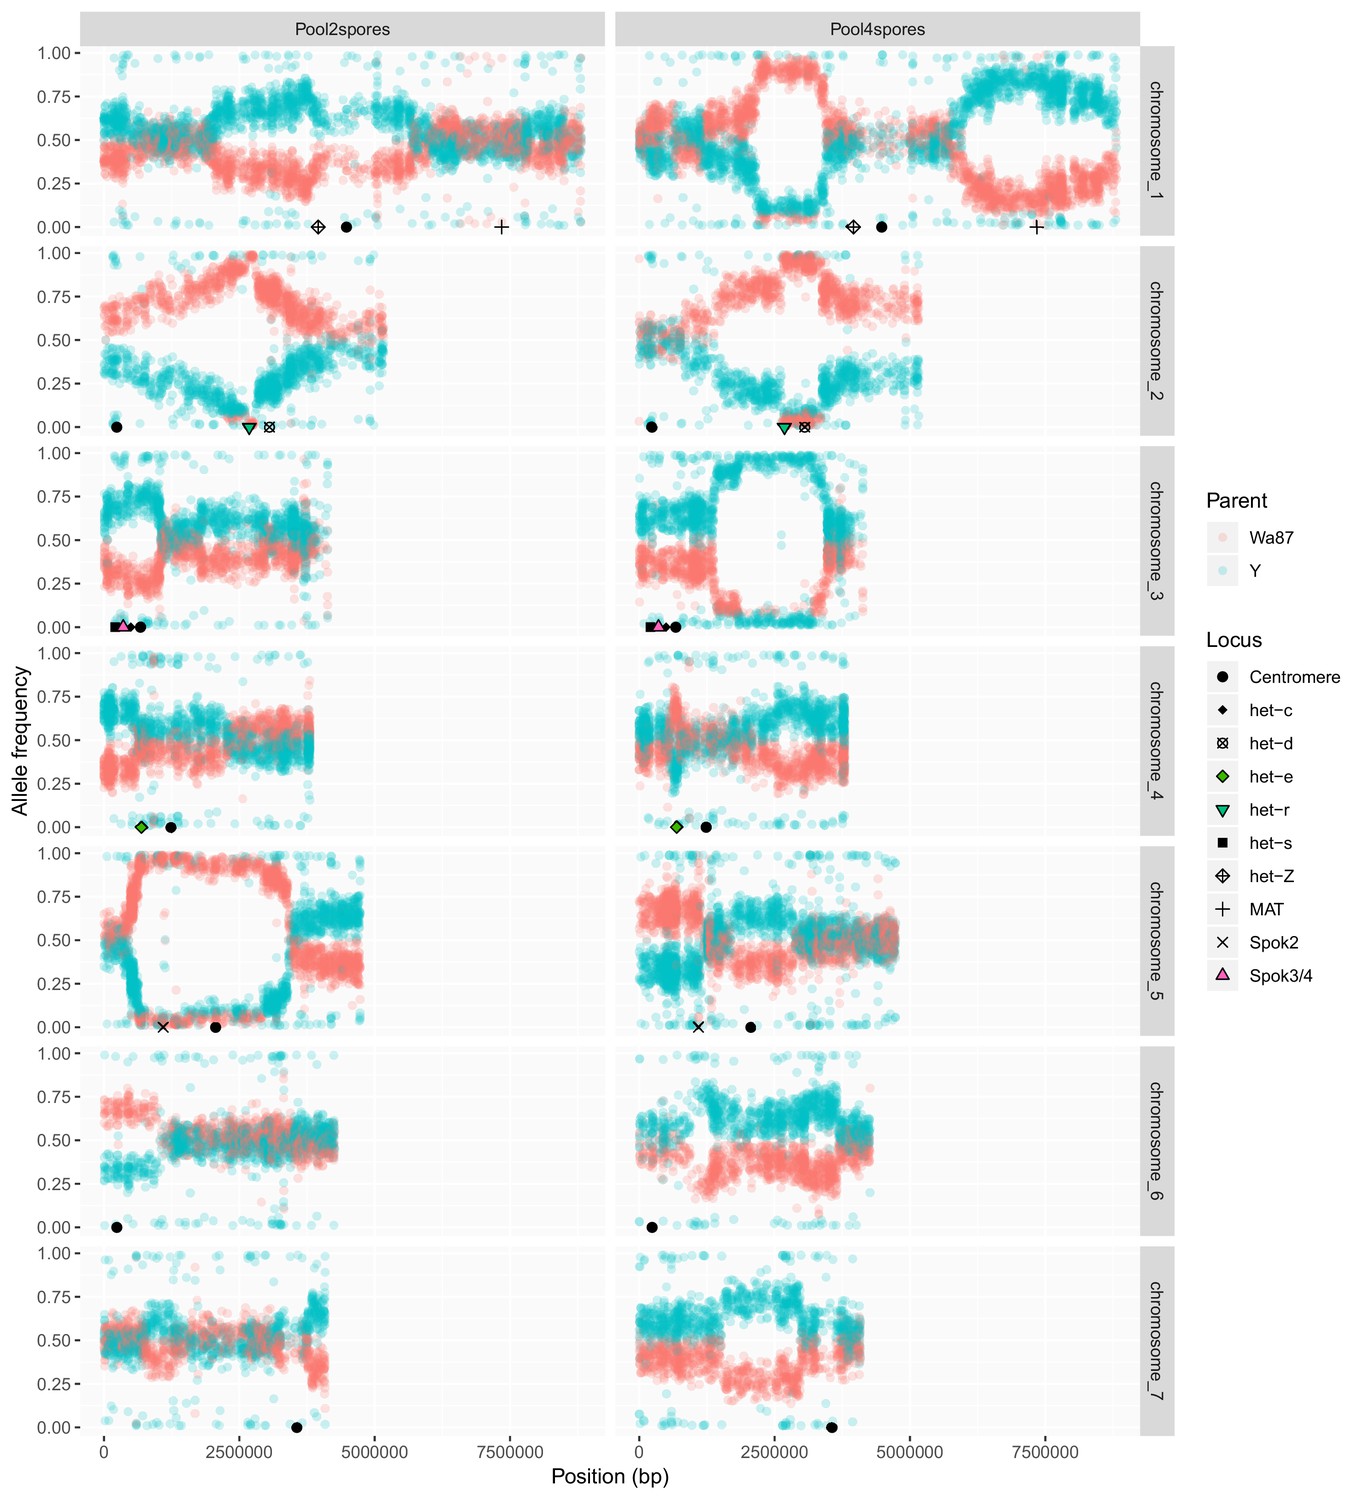
Plot comparing pooled sequencing data from the progeny of two-spored asci (left, n = 21) and the progeny of four-spored asci (right, n = 63) from a cross of Psk-1 (Wa87+) and Psk-5 (Y–).
The Y-axis shows the frequency of each parental allele in the pooled samples, Wa87 (red) and Y (teal). In the two-spored sample, the region encompassing Spok2 on Chromosome 5 is only represented by Wa87 alleles. This is the only region in the two-spored pool with a complete skew and linkage to the centromere, as expected for a spore killing locus. Other skews from 50:50 ratios may be due to het genes, which can result in the death of nuclei when incompatible alleles are present in the same mycelium. Known het genes are marked. Skews specific to the four-spore asci might be the result of sibling competition effects during germination, which are imposed by the experimental design in the four-spore asci (having two genotypes) but not in the two-spore asci (only one genotype).
Figure 5 with 3 supplements
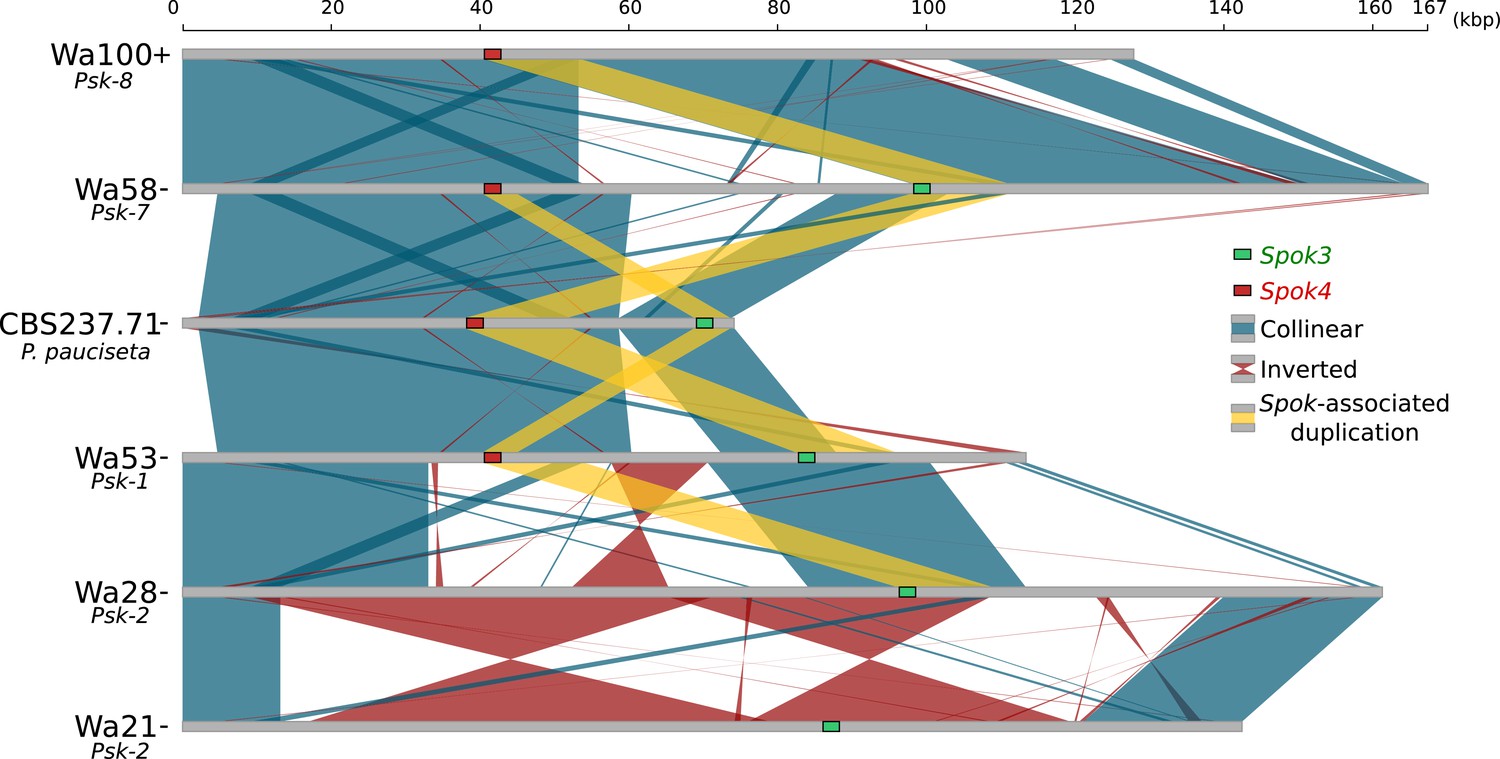
Alignment of the Spok blocks from different strains.
Gray bars represent the block sequences, blue vertical lines connect collinear regions between blocks, while red lines indicate inverted regions. The yellow lines show the region that is duplicated within the block surrounding Spok3 (green) and Spok4 (red).
Figure 5—figure supplement 1
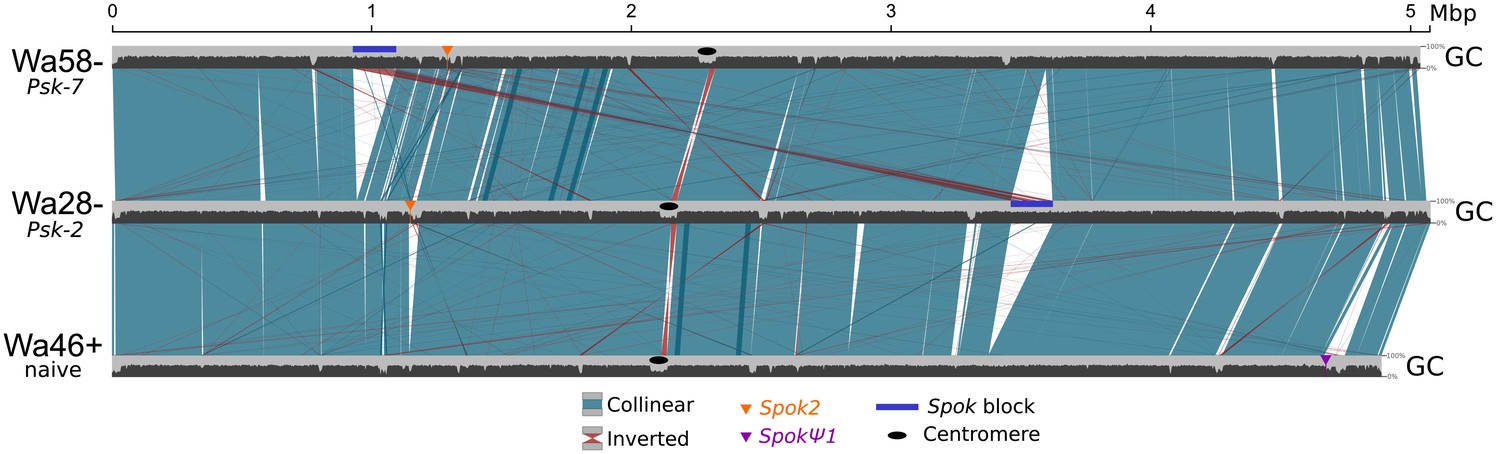
Alignment of chromosome 5 for three representative P. anserina strains (without size filtering).
Plotted on top of the chromosomal coordinates (light gray), the GC% distribution (window sizes of 4 kb and steps of 2 kb) can be seen. As a result of the process known as repeat-induced point mutation, TEs typically have very low GC% content in Podospora (Graïa et al., 2001; Hamann et al., 2000). Hence, alignment lines of non-syntenic regions that co-locate with sharp decreases of GC% can be interpreted as TEs. Overall, the largest difference between strains is the presence or absence of the Spok block (dark blue box). On the other hand, the Spok2 and SpokΨ1 genes are notoriously associated with clusters of TEs. Colors follow Figure 5 of the main text.
Figure 5—figure supplement 2
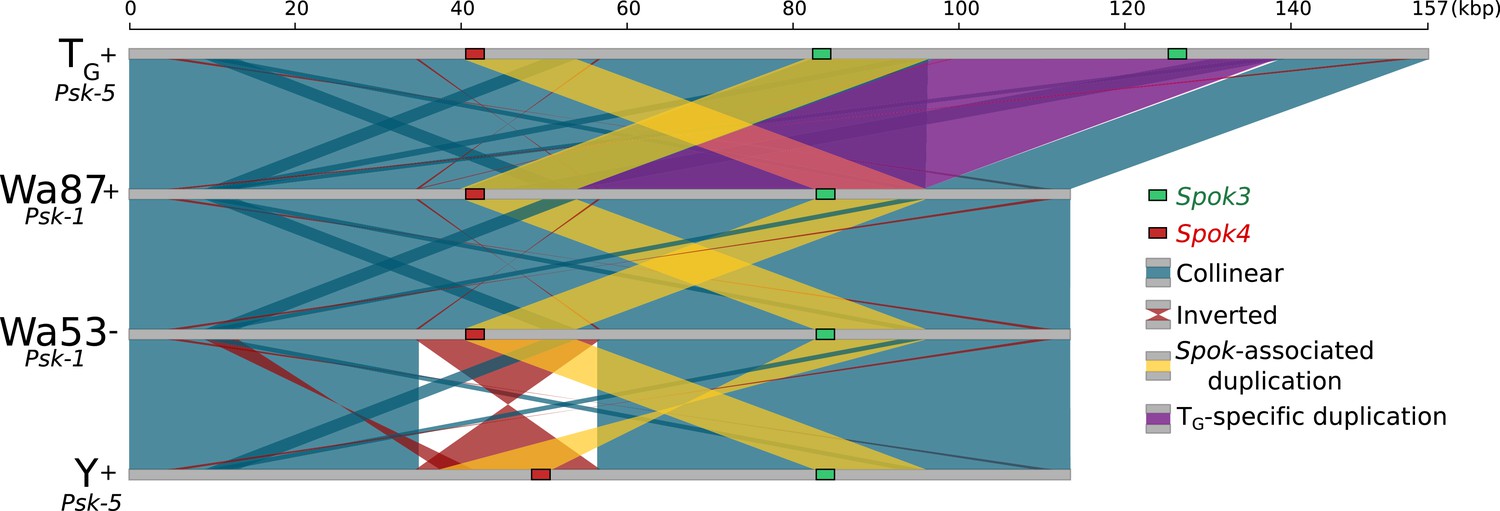
Alignment of the Spok block from the Psk-1 and Psk-5 strains shows high overall collinearity.
Colors are the same as those in Figure 5, except that the purple block highlights a large duplicate region that is unique to the TG strain.
Figure 5—figure supplement 3
Dot plot comparing the Wa87– Spok block (between and excluding genes Pa_3_945 and Pa_3_950) to the region containing SpokΨ1 in Wa87– (Pa_5_10570 and Pa_5_10565).
Red lines indicate collinear regions, whereas blue lines indicate inverted regions. The alignment was produced with NUCmer using the options –b 2000 c 20 p –maxmatch. Excluding the Spok homologs, there is little similarity between the two regions.
Figure 6 with 2 supplements

Functional annotation of the SPOK protein.
(A) (Top) A predicted domain diagram of the SPOK protein displays the N-terminal coiled-coil region (in magenta), the N-terminal domain of unknown function (in lilac), the two unstructured regions (in pink), the PD-(D/E)XK nuclease domain (in green), the cysteine cluster region (in orange) and the kinase domain (in red) with coordinates based on the alignment of all SPOK homologs. The positions of key residues and conserved motifs are indicated with the same color code. The mutations labels that are marked in bold correspond to the SPOK3 coordinates, except for the mutations on the SPOK2 of strain A. (Bottom) A plot of the pairwise nucleotide distances between all alleles of a given Spok indicates which regions of the protein are conserved or divergent, and where the polymorphisms within a single Spok gene are located. The predicted unstructured regions generally show greater divergence. (B) HMM profile derived from an alignment of 282 SPOK3 homologs from Ascomycota showing conserved residues. The domains identified in (A) are shown with the same color code, and key motifs and residues are underlined. The profile was generated with Web logo v3. (C) Comparison of the HHM profiles in the catalytic loop and DFG-motif region in eukaryotic protein kinases and Kdo kinase (an ELK) with the same region in Spok homologs. The sequence below corresponds to the SPOK3 sequence.
-
Figure 6—source data 1
Transformation efficiency of Spok3 manipulations.
- https://doi.org/10.7554/eLife.46454.030
Figure 6—figure supplement 1
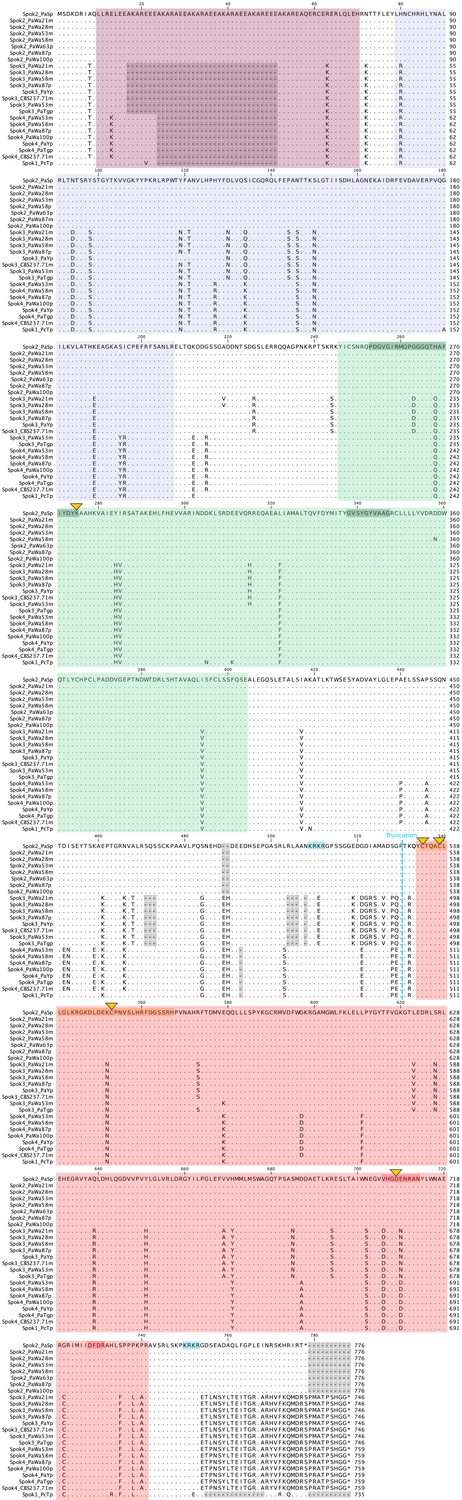
Amino-acid alignment of the SPOK proteins from strains sequenced with long-read technologies.
The N-terminus after the stop codon in Spok2 and Spok1 is not aligned because of a frame-shift mutation (see the nucleotide alignment). Domains and conserved motifs from Figure 6 are indicated in matching colors. The point mutations that have been investigated in this study are marked with yellow triangles. The C-terminus truncation of SPOK3 is marked with a blue dashed line, whereas the two putative nuclear localization signals (NLS) are shaded in blue at the top of the alignment. Note that the Spok3(1–490) construct also has a putative NLS.
Figure 6—figure supplement 2
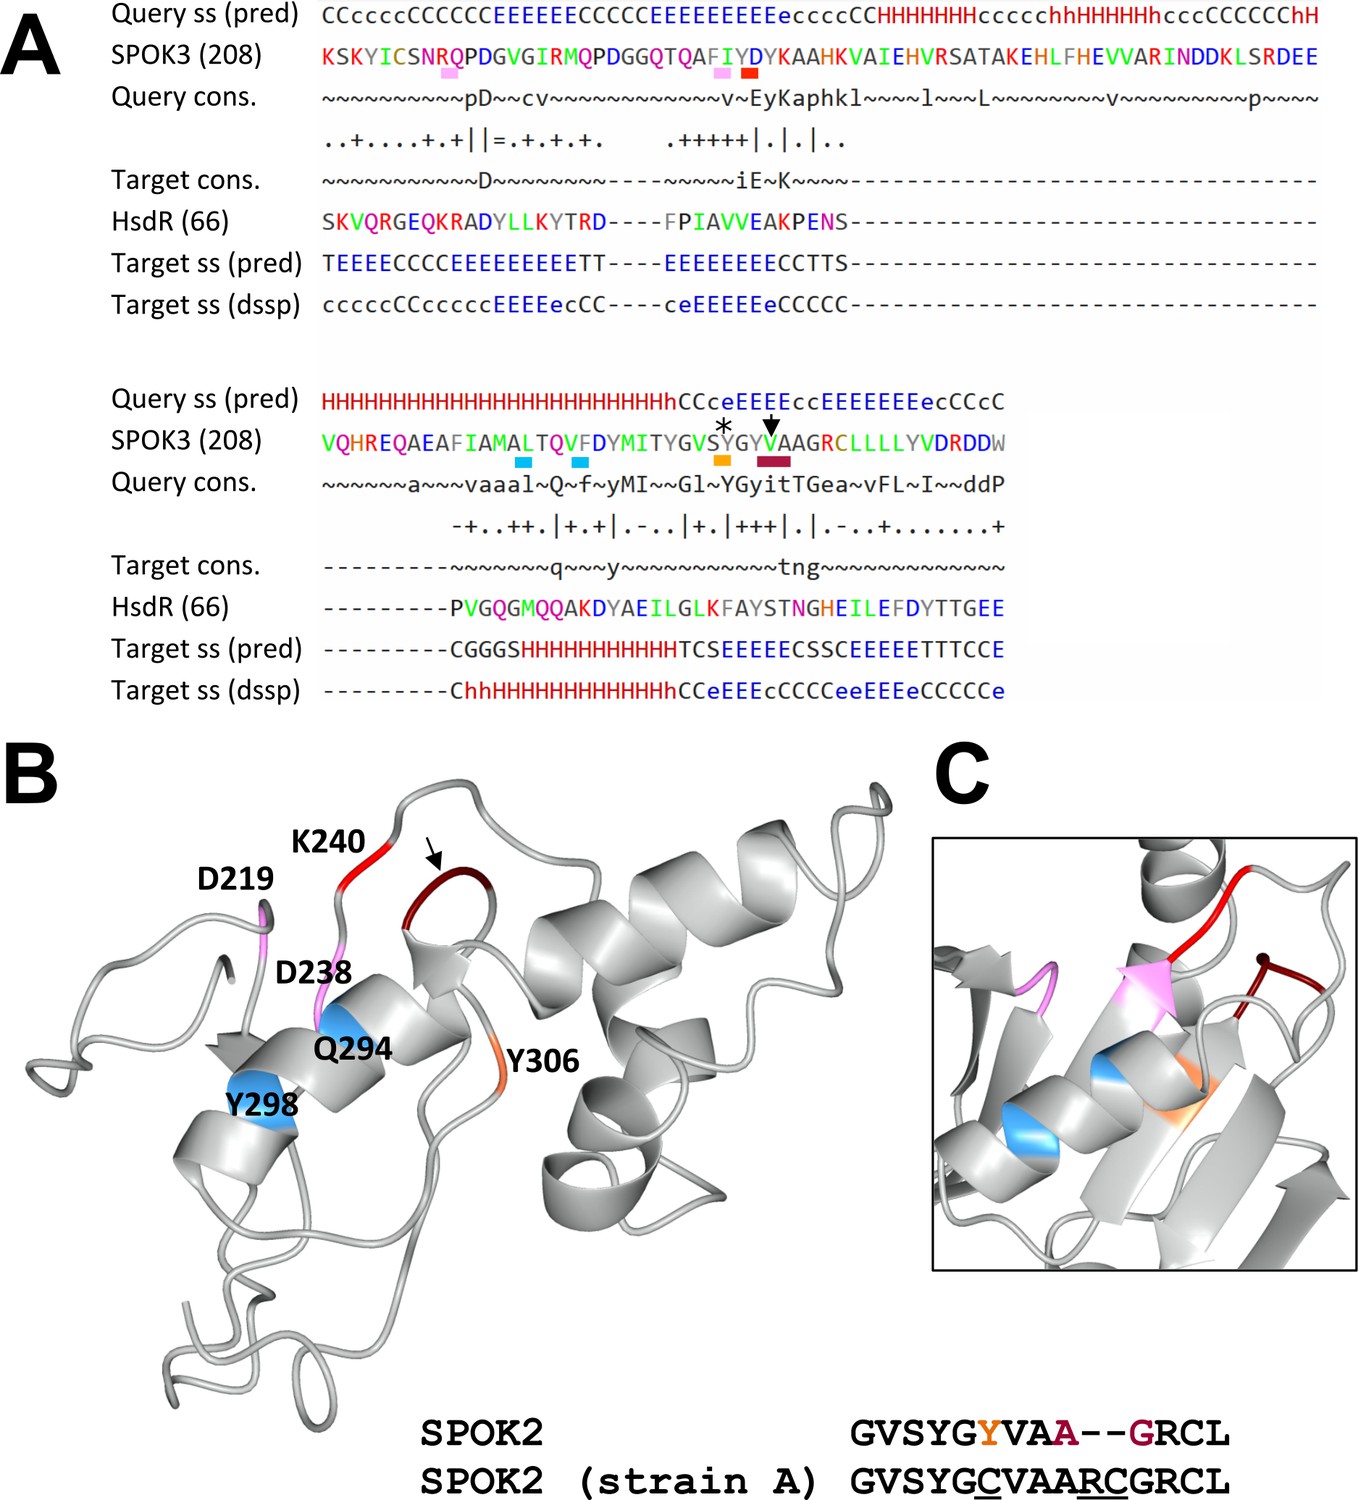
Predicted nuclease domain of SPOK proteins.
(A) The alignment of SPOK3 domain 2 and the nuclease domain of the HsdR restriction enzyme from Vibrio vulnificus generated by HHPred. The figure gives the secondary structure prediction for the query and target, labeled ss (pred), as well as a consensus sequence for the query and target, labeled cons. as the actual secondary structure of the target in dssp code. The catalytic core residues of the PD-(D/E)XK are underlined as well as the QXXXY motif, which is important for nuclease activity. In addition, the positions that are mutated in the SPOK2 in strain A are shown: the star marks the position of a point-mutated residue, and the arrow points to the position of the two-amino-acid insertion in that strain. (B) A structural model of domain 2 of SPOK3 based on a contact map generated with RaptorX. Positions of the catalytic core residues are shown using the same color code as in (A). The positions that are mutated in strain A are shown with the same color code as in (A). A short alignment of the wt SPOK2 and the mutated SPOK2 sequence as found in strain A is shown. (C) The structure of the HsdR nuclease domain (pdb 3H1T) in which the homologous positions have been highlighted according to the alignment given in (A). Note the close spatial proximity of the catalytic lysine and the site of the two-amino-acid insertion in strain A in both cases.
Figure 7
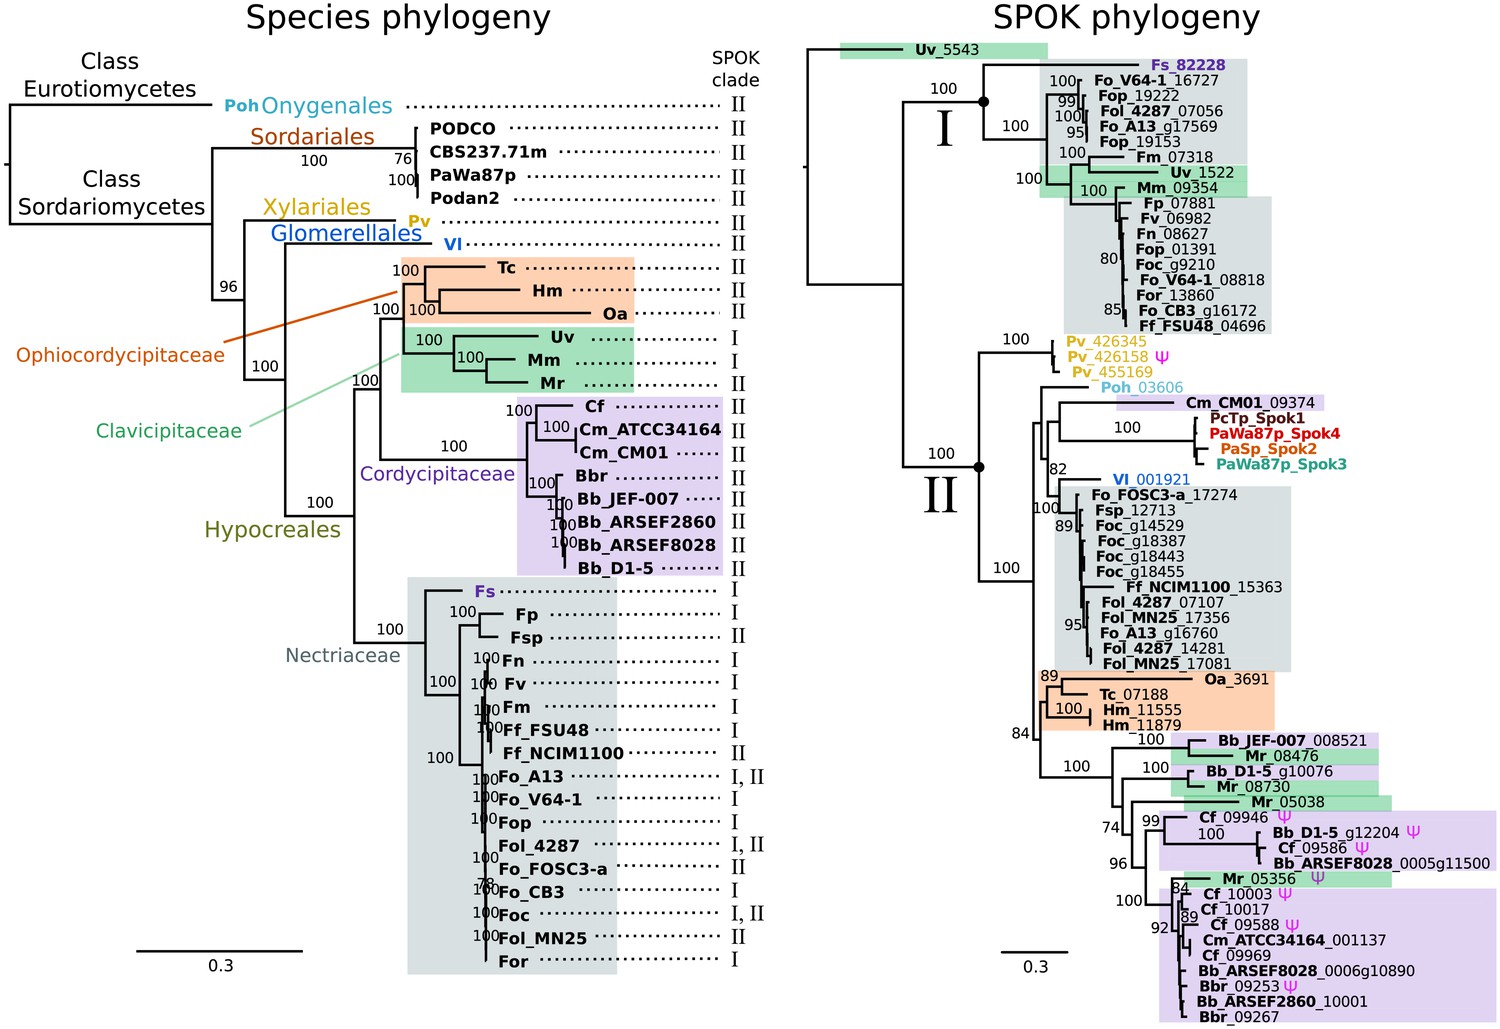
The phylogeny of Podospora SPOKs and closely related homologs do not follow the species tree.
(Left) A maximum likelihood phylogeny of the fungal isolates that harbor Spok homologs that are closely related to those of Podospora recovered the groupings that are expected on the basis of fungal taxonomic classification (colored boxes and tip labels). The tree was produced using the aligned protein sequence of 288 single-copy orthologs. (Right) A maximum likelihood phylogeny of the SPOK proteins themselves with colors matching the taxonomy in the tree to the left. Two main clades can be distinguished (I and II), and their presence is mapped to each genome in the species phylogeny. Putative pseudogenes are marked with a Ψ symbol. The Fs_82228 protein (in dark purple text) has been demonstrated to exhibit some spore-killing characteristics in a P. anserina strain. Rooting of the species tree was based on the split between Classes, whereas the SPOK phylogeny was rooted on the basis of the broader alignment generated for the protein-domain predictions. Bootstrap support values higher than 70 are shown above branches, which are proportional to the scale bar (substitutions per site). SPOK tip labels follow the convention of fungal isolate code (bold) and locus name (see Figure 7—source data 1 for full species names and genomes).
-
Figure 7—source data 1
Table showing species names and genome labels for codes used in Figure 7.
- https://doi.org/10.7554/eLife.46454.032
Figure 8
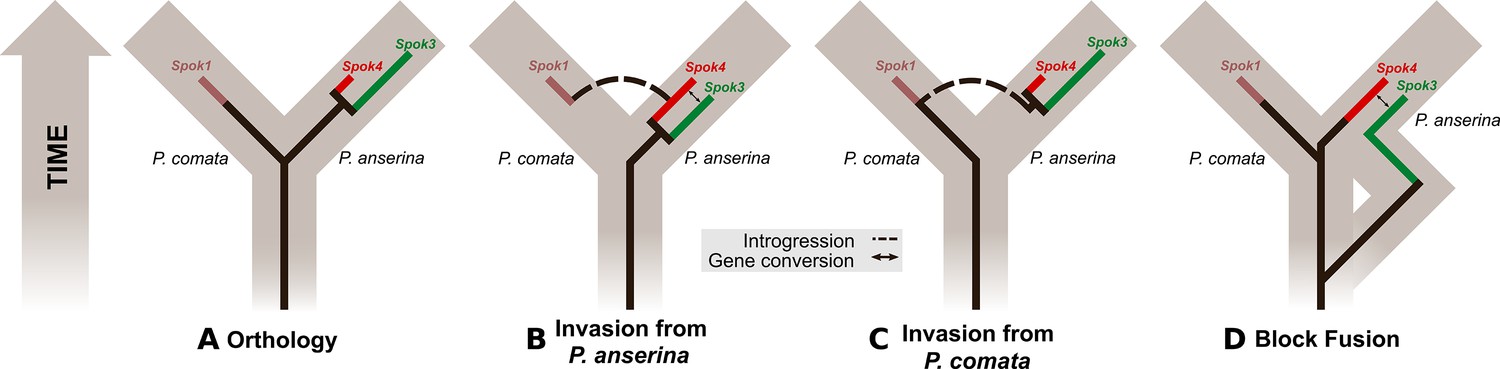
Evolutionary models of Spok diversification.
See main text for a description of the models. The models assume that an ancestral Spok homolog was present in the ancestor of both P. anserina and P. comata. The Spok diversification is traced by the inner lines. Spok2 is not included because its genomic location and sequence provide little clue as to its evolutionary history with respect to the other Spok homologs. Brown boxes represent divergence among the lineages, eventually forming P. comata and P. anserina. P. pauciseta is excluded for simplicity as in all cases it would need to obtain Spok3, Spok4 and the Spok block prior to diverging from P. anserina, and then have no divergence since the species split, or the Spok block would have to be transferred between the species.
Appendix 1—figure 1
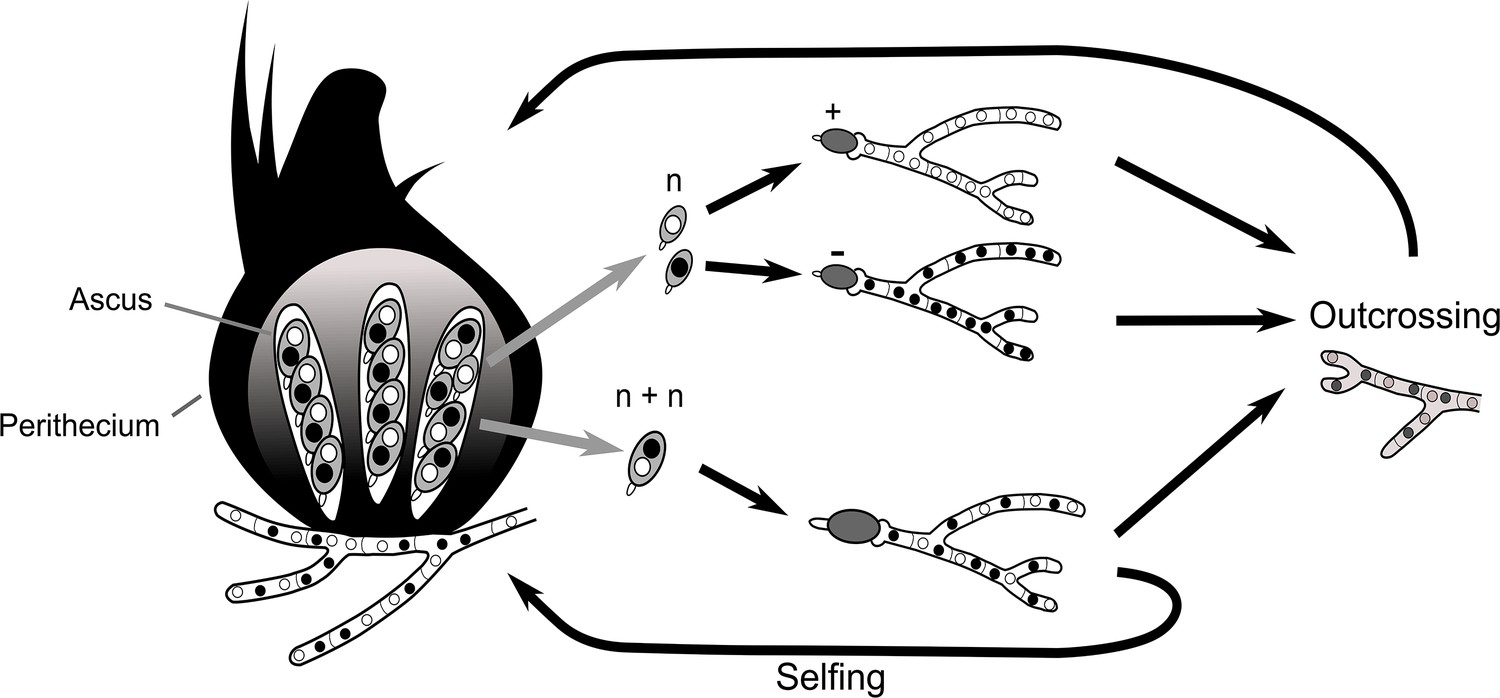
Simplified life cycle of P. anserina with explanation for isolating monokaryotic spores.
https://doi.org/10.7554/eLife.46454.040
Appendix 2—figure 1

Barrage tests of the S14 strains.
Strains Wa126, Wa76, Wa52, and Wa125 are wild isolates of P. anserina in the Wageningen collection. The thick white lines of mycelia demonstrate a barrage, which is indicative of heterokaryotic incompatibility in fungi. No barrages are seen among the S14 strains.
Appendix 2—figure 2
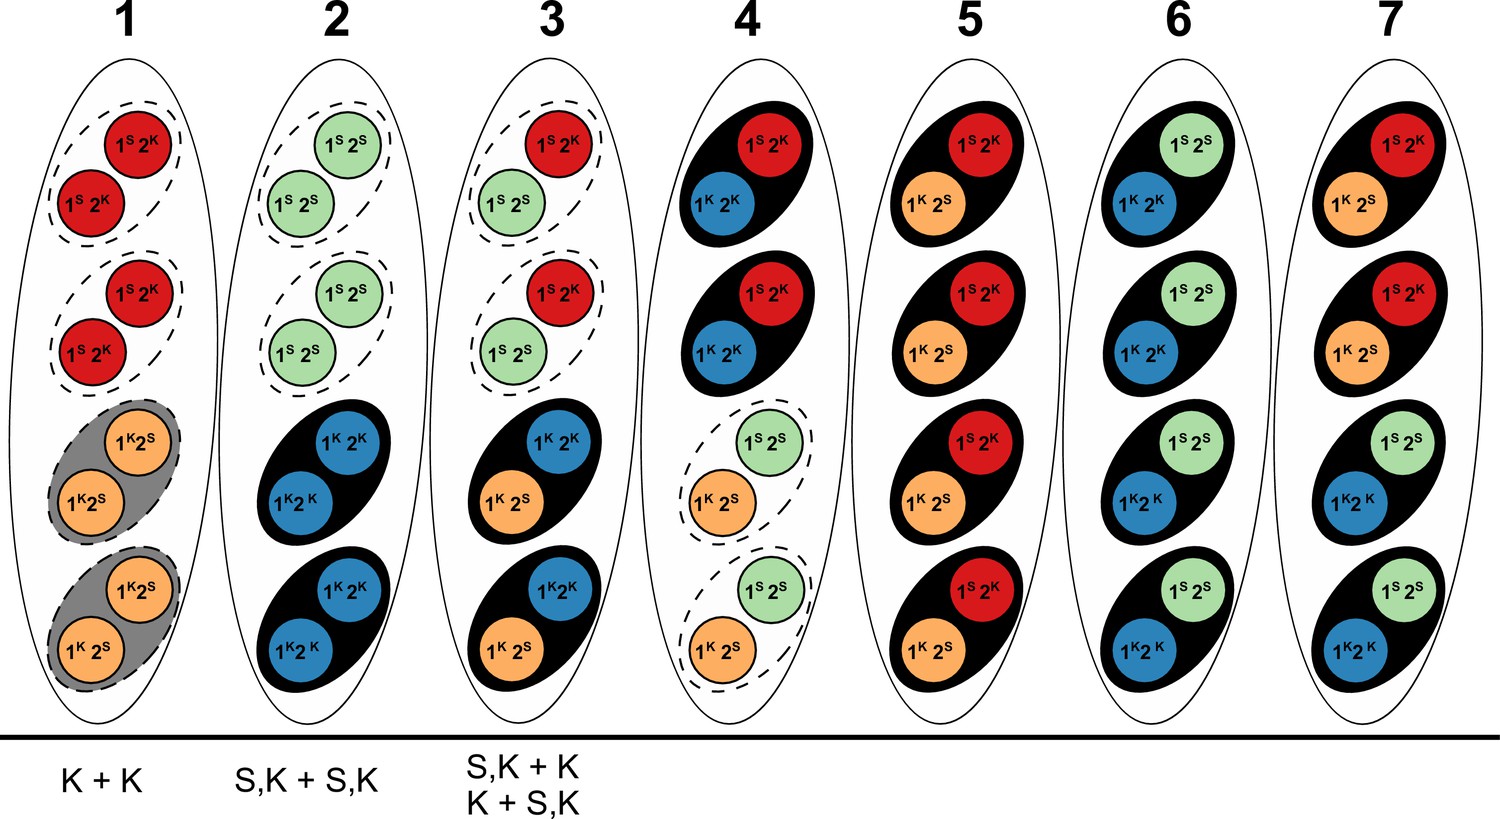
Explanation of results from a (presumably) Psk-5 vs Psk-S cross in Hamann and Osiewacz (2004) with information about Spok genes as described in the text.
The seven asci represent the possible genotype combinations of a cross between a Psk-5 strain and a Psk-S, as illustrated in Turner and Perkins (1991). Black ovals represent the ascospores, dashed ovals represent killed spores, and colored circles represent the individual nuclei, with each color corresponding to a given genotype. Genotypes are annotated as in Turner and Perkins (1991), wherein locus 1 corresponds to a killer locus with 90% FDS, the Psk-5 Spok block, and locus 2 represents a killer locus with 40% FDS, Spok2. Red nuclei represent the Psk-S parental genotype with Spok2, orange nuclei represent the Psk-5 parental genotype with Spok3 and Spok4, green nuclei represent the recombinant genotype with no Spok genes, and blue nuclei represent the recombinant genotype with Spok2, Spok3, and Spok4. Note that Spok3 and Spok4 are linked and do not segregate independently. Given its Spok content, the ascus type 1 should experience mutual killing, resulting in the abortion of all spores. Ascus types 2 to 4 should contain only two surviving spores, whereas ascus types 5 to 7 should have all spores surviving. Below, the asci are our interpretations of the annotations from Hamann and Osiewacz (2004). In their study, these authors isolated F1 spores from four-spore asci, genotyped them on the basis of crosses to the parental strains, and found no spore-killing after selfing in a few cases. In their terminology, K + K strains would correspond to a strain with the Psk-5 (grey spore) parental genotype of ascus type 1. This type of ascus should produce empty asci, so the fact that they are observed from four-spored asci suggests that when mutual killing occurs, the four spores may still develop. However, as no S + S strains (i.e. spores with two red nuclei in the type ascus 1) were reported, we can infer that only the Psk-5 type (grey spore) may be viable. S,K + S,K strains are not indicative of a recombinant killer locus as suggested in the original work, but represent strains with all three Spok genes as produced in ascus type 2. The FDS frequencies reported suggest that the isolated strains are indicative of the blue nuclear genotype and not the green nuclear genotype. Hence, the spores containing only green nuclei might not be viable either. The S,K + K and K + S,K strains are indistinguishable from each other and are indicative of the surviving spores of a type 3 ascus. These strains should exhibit spore killing when selfed because of the distribution of Spok2. However, cases in which spore killing was not observed in their study could be explained by incomplete penetrance of Spok2. In all cases, these strains should not have been isolated from four-spored asci, indicating that either methodological issues occurred or that spore killing may still produce four-spored asci, but where the spores which should be absent are instead inviable.
Tables
Table 1
List of all strains used in this study.
https://doi.org/10.7554/eLife.46454.005| Sample | Site of origin | Spore killer* | Sequenced | Technology | Mycelium | Spok genes† | Spok block location‡ | Flanking genes§ |
|---|---|---|---|---|---|---|---|---|
| Natural isolates¶ | ||||||||
| Wa21– | Wageningen | Psk-2 (Psk-3) | DNA | PacBio | Monokaryon | Spok2, Spok3 | 5R: 3325285 | Pa_5_7950 – Pa_5_7960 |
| HiSeq 2500 | ||||||||
| Wa28– | Wageningen | Psk-2 | DNA | PacBio | Monokaryon | Spok2, Spok3 | 5R: 3325285 | Pa_5_7950 – Pa_5_7960 |
| HiSeq 2500 | ||||||||
| Wa46+ | Wageningen | Naïve (Psk-4) | DNA | PacBio | Monokaryon | SpokΨ1 | – | – |
| HiSeq 2500 | ||||||||
| Wa53– | Wageningen | Psk-1 | DNA | PacBio | Monokaryon | Spok2, Spok3, Spok4 | 3L: 358693 | Pa_3_945 – Pa_3_950 |
| HiSeq 2500 | ||||||||
| Wa58– | Wageningen | Psk-7 | DNA | PacBio | Monokaryon | Spok2, Spok3, Spok4 | 5L: 896822 | Pa_5_490 – Pa_5_470 |
| HiSeq 2500 | ||||||||
| Wa63+ | Wageningen | Psk-S | DNA | PacBio | Monokaryon | Spok2 | – | – |
| HiSeq 2500 | ||||||||
| Wa63– | Wageningen | Psk-S | RNA | HiSeq 2500 | Monokaryon | Spok2 | – | – |
| Wa87+ | Wageningen | Psk-1 | DNA | PacBio | Monokaryon | Spok2, Spok3, Spok4, SpokΨ1 | 3L: 358693 | Pa_3_945 – Pa_3_950 |
| HiSeq 2500 | ||||||||
| Y+ | France | Psk-5 | DNA | MinION | Monokaryon | Spok3, Spok4 | 3L: 358693 | Pa_3_945 – Pa_3_950 |
| HiSeq 2500 | ||||||||
| Wa100+ | Wageningen | Psk-8 | DNA | PacBio | Monokaryon | Spok2, Spok4, SpokΨ1 | 5L: 896822 | Pa_5_490 – Pa_5_470 |
| HiSeq 2500 | ||||||||
| TG+ | France | Psk-5 (sk-1) | DNA | MinION | Monokaryon | Spok3, Spok3, Spok4 | 3L: 358693 | Pa_3_945 – Pa_3_950 |
| DNA | HiSeq X | |||||||
| CBS237.71– | Israel | Psk-P1 | DNA | MinION | Monokaryon | Spok2, Spok3 | 4R: 1674812 | Pa_4_3420 – Pa_4_3410 |
| DNA | HiSeq X | |||||||
| TD+ | ? | Psk-C1 | DNA | HiSeq X | Monokaryon | Spok1 | – | – |
| RNA | HiSeq 2500 | |||||||
| S+ | France | Psk-S | DNA | HiSeq X | Monokaryon | Spok2 | – | – |
| S– | France | Psk-S | DNA | HiSeq X | Monokaryon | Spok2 | – | – |
| Wa47 | Wageningen | naïve (Psk-6) | – | – | – | Not sequenced | – | – |
| Z | France | Psk-7 | – | – | – | Not sequenced | – | – |
| s | France | Psk-S | – | – | – | Not sequenced | – | – |
| Us5 | Germany | Psk-S | – | – | – | Not sequenced | – | – |
| Backcrosses to S†† | ||||||||
| Psk1xS5- (Wa53) | Psk-1 | DNA | HiSeq 2500 | Monokaryon | Spok2, Spok3, Spok4 | 3L: 358693 | Pa_3_945 – Pa_3_950 | |
| Psk2xS5+ (Wa28) | Psk-2 | DNA | HiSeq 2500 | Monokaryon | Spok2, Spok3 | 5R: 3325285 | Pa_5_7950 – Pa_5_7960 | |
| Psk5xS5+ (Y) | Psk-1 (Psk-5) | DNA | HiSeq 2500 | Monokaryon | Spok2, Spok3, Spok4 | 3L: 358693 | Pa_3_945 – Pa_3_950 | |
| Psk7xS5+ (Wa58) | Psk-7 | DNA | HiSeq 2500 | Monokaryon | Spok2, Spok3, Spok4 | 5L: 896822 | Pa_5_490 – Pa_5_470 | |
| Psk1xS14-vsS | Psk-1 | RNA | HiSeq 2500 | Selfing dikaryon | Spok2, Spok3, Spok4 | Like parental | Like parental | |
| Psk2xS14-vsS | Psk-2 | RNA | HiSeq 2500 | Selfing dikaryon | Spok2, Spok3 | Like parental | Like parental | |
| Psk5xS14-vsS | Psk-1 | RNA | HiSeq 2500 | Selfing dikaryon | Spok2, Spok3, Spok4 | Like parental | Like parental | |
| Psk7xS14-vsS | Psk-7 | RNA | HiSeq 2500 | Selfing dikaryon | Spok2, Spok3,+ Spok4 | Like parental | Like parental |
-
*The spore killer type of each strain is given as reported by van der Gaag et al. (2000) when our phenotyping agrees, and in parenthesis when it does not. The S14 strains were phenotyped by us.
†The S14 Spoks were inferred from RNAseq mapping.
-
‡The chromosome number and the arm (R for right, and L for left) describing the position of the Spok block are given, along with the coordinates in the Podan2 chromosome.
§ As the exact insertion point is always intergenic, we also provide the flanking genes. The gene nomenclature follows Espagne et al. (2008), where Pa stands for Podospora anserina, the number between underscores is the chromosome and the last number is the gene code.
-
Note that strain s and strain S are different natural isolates.
††Parentheses denote parental spore killer strains.
-
‘Like parental’ denotes that the location of the Spok block in the S14 backcrosses was not inferred from sequencing data, however it should correspond to the location in the S5 backcrosses.
'–', Not applicable.
Table 2
Pairwise statistics between SPOK homologs.
The dN/dS ratios, averaged across the coding region, are shown below the diagonal; pairwise amino acid changes are shown above.
| SPOK4 | SPOK3 | SPOK2 | SPOK1 | |
|---|---|---|---|---|
| SPOK4 | x | 41 | 53 | 19 |
| SPOK3 | 0.8404081 | x | 54 | 51 |
| SPOK2 | 0.9731409 | 0.9771488 | x | 40 |
| SPOK1 | 0.6593501 | 0.7833958 | 0.7851462 | x |
Additional files
-
Supplementary file 1
Statistics from PacBio and Nanopore assemblies.
- https://doi.org/10.7554/eLife.46454.034
-
Supplementary file 2
Statistics from SPAdes assemblies.
As a proxy of completeness, the coverage of the Podan2 reference genome is given, as is the mean depth of coverage to Podan2 as reported by Qualimap. n, number of scaffolds; n500, number of scaffolds larger than 500 bp; min, size of smaller scaffold; max, size of largest scaffold; sum_n:500, sum of the length of all scaffolds larger than 500 bp; sum, size of the assembly.
- https://doi.org/10.7554/eLife.46454.035
-
Supplementary file 3
Spok gene content of genetically modified strains.
- https://doi.org/10.7554/eLife.46454.036
-
Supplementary file 4
Primers used in this study.
- https://doi.org/10.7554/eLife.46454.037
-
Transparent reporting form
- https://doi.org/10.7554/eLife.46454.038
Download links
A two-part list of links to download the article, or parts of the article, in various formats.
Downloads (link to download the article as PDF)
Open citations (links to open the citations from this article in various online reference manager services)
Cite this article (links to download the citations from this article in formats compatible with various reference manager tools)
Combinations of Spok genes create multiple meiotic drivers in Podospora
eLife 8:e46454.
https://doi.org/10.7554/eLife.46454


