Molecular and anatomical organization of the dorsal raphe nucleus
- Howard Hughes Medical Institute, Harvard Medical School, United States
- Harvard Medical School, United States
Figures
Figure 1 with 2 supplements
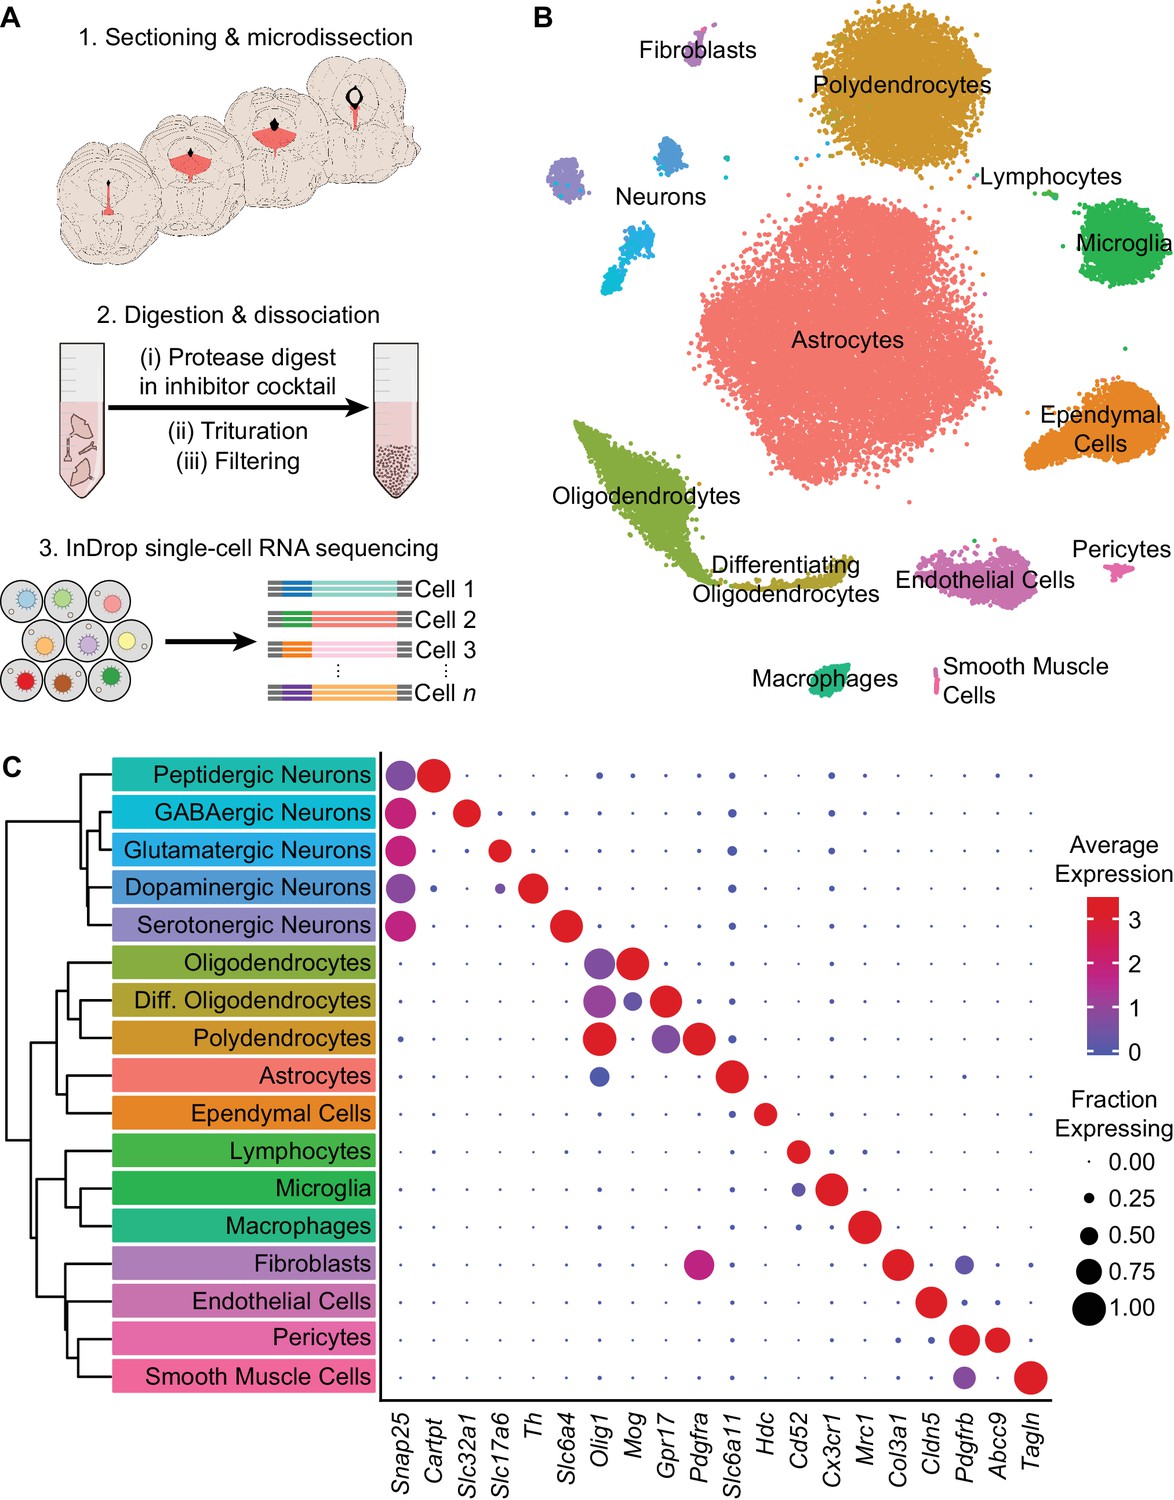
High-throughput single cell transcriptomic profiling of the DRN.
(A) Schematic for scRNA-seq using the inDrop platform. (1) Tissue containing the DRN and surrounding regions was microdissected from acute coronal brain slices prepared from adult C57BL/6J mice. (2) Tissue chunks were digested in a cocktail of proteases and inhibitors of neuronal spiking, transcription, and translation. Digestion was followed by trituration and filtration to obtain a cell suspension. (3) Single cells were encapsulated using a droplet-based microfluidic device for cell barcoding and RNA capture. (B) t-SNE plot of the processed dataset containing 39,411 cells from eight animals. Cells are color-coded according to the cluster labels shown in (C). (C) Left: Dendrogram with cell class labels corresponding to clusters shown in (B). Right: Dot plot displaying expression of example genes used to identify each major cell class. The color of each dot (blue to red) indicates the average expression of each gene whereas the dot size indicates the fraction of cells expressing the gene. Additional genes used for identifying cell classes/types are listed in Supplementary file 1.
Figure 1—figure supplement 1
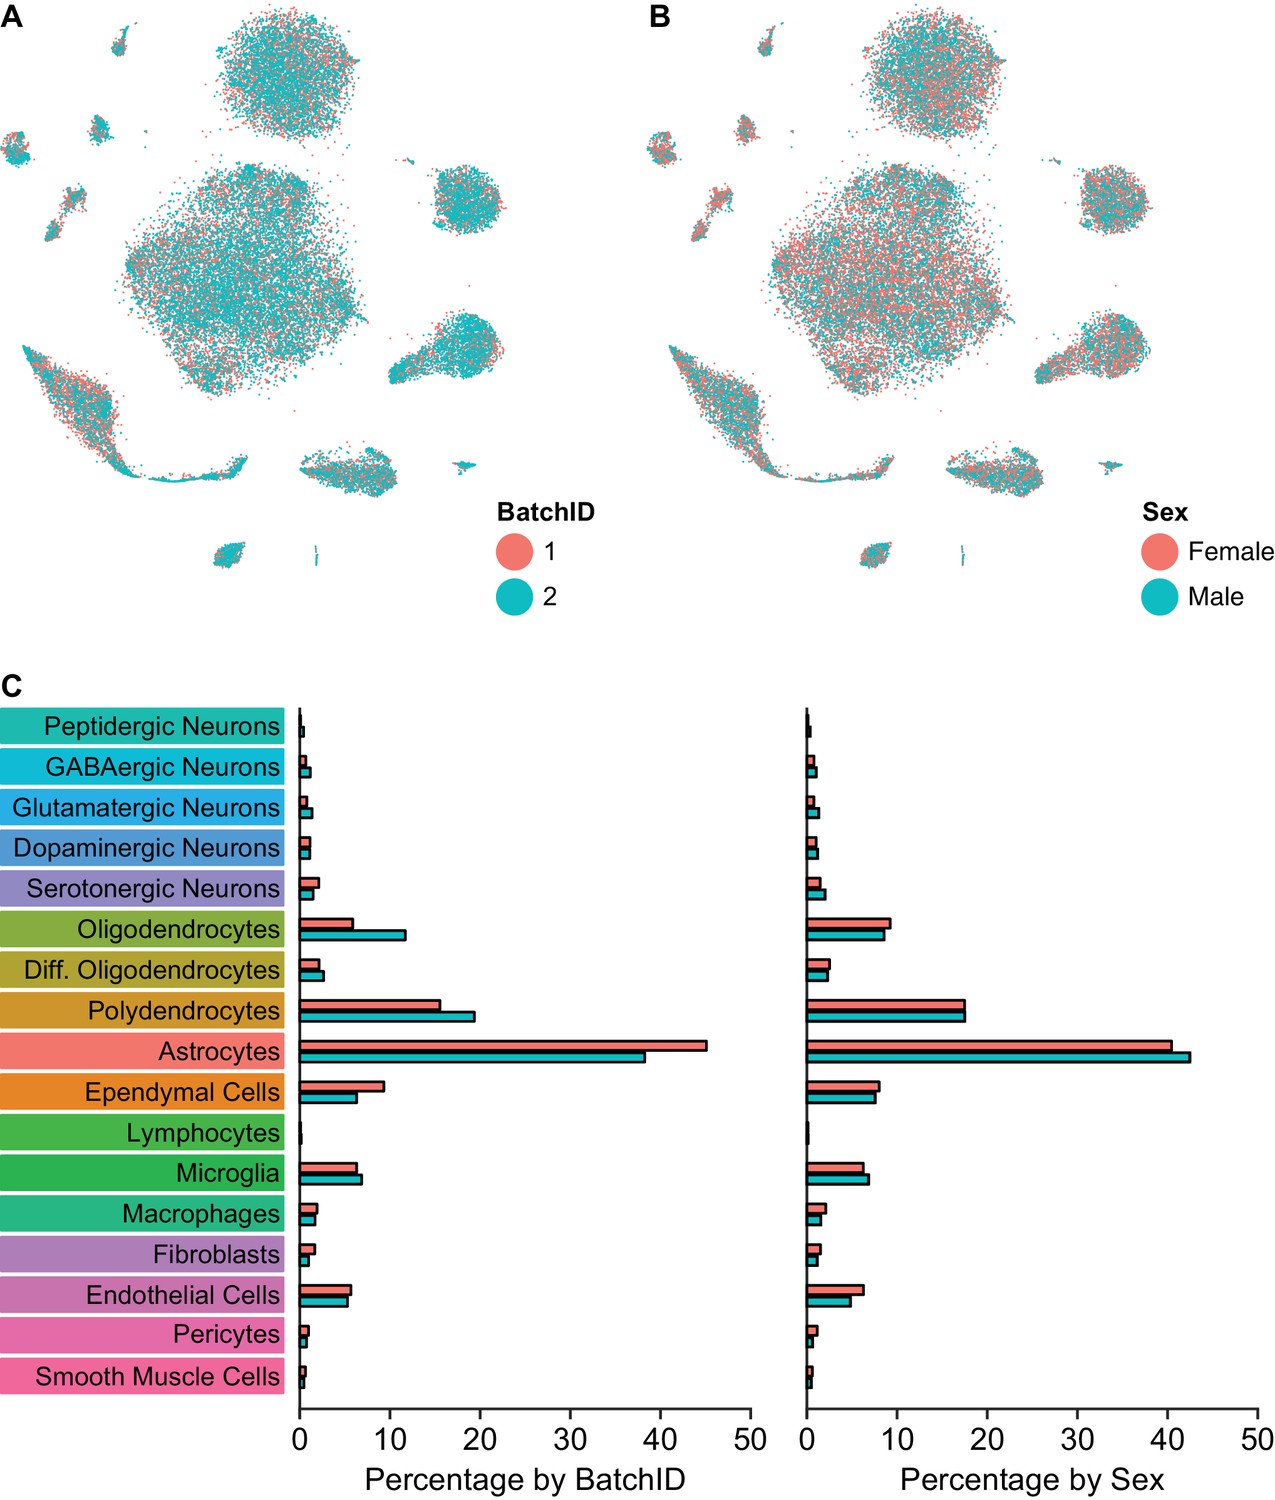
Comparison of cell type composition across sample batches and sex.
(A) t-SNE plot of the dataset with cells color-coded by experiment batch. All clusters contain cells from both batches. (B) t-SNE plot of the dataset with cells color-coded by the sex of the mouse from which the sample was acquired. (C) Bar plots showing the percentage of cells in each batch (left) or sex (right) that are categorized into each of the 17 major cell types.
Figure 1—figure supplement 2
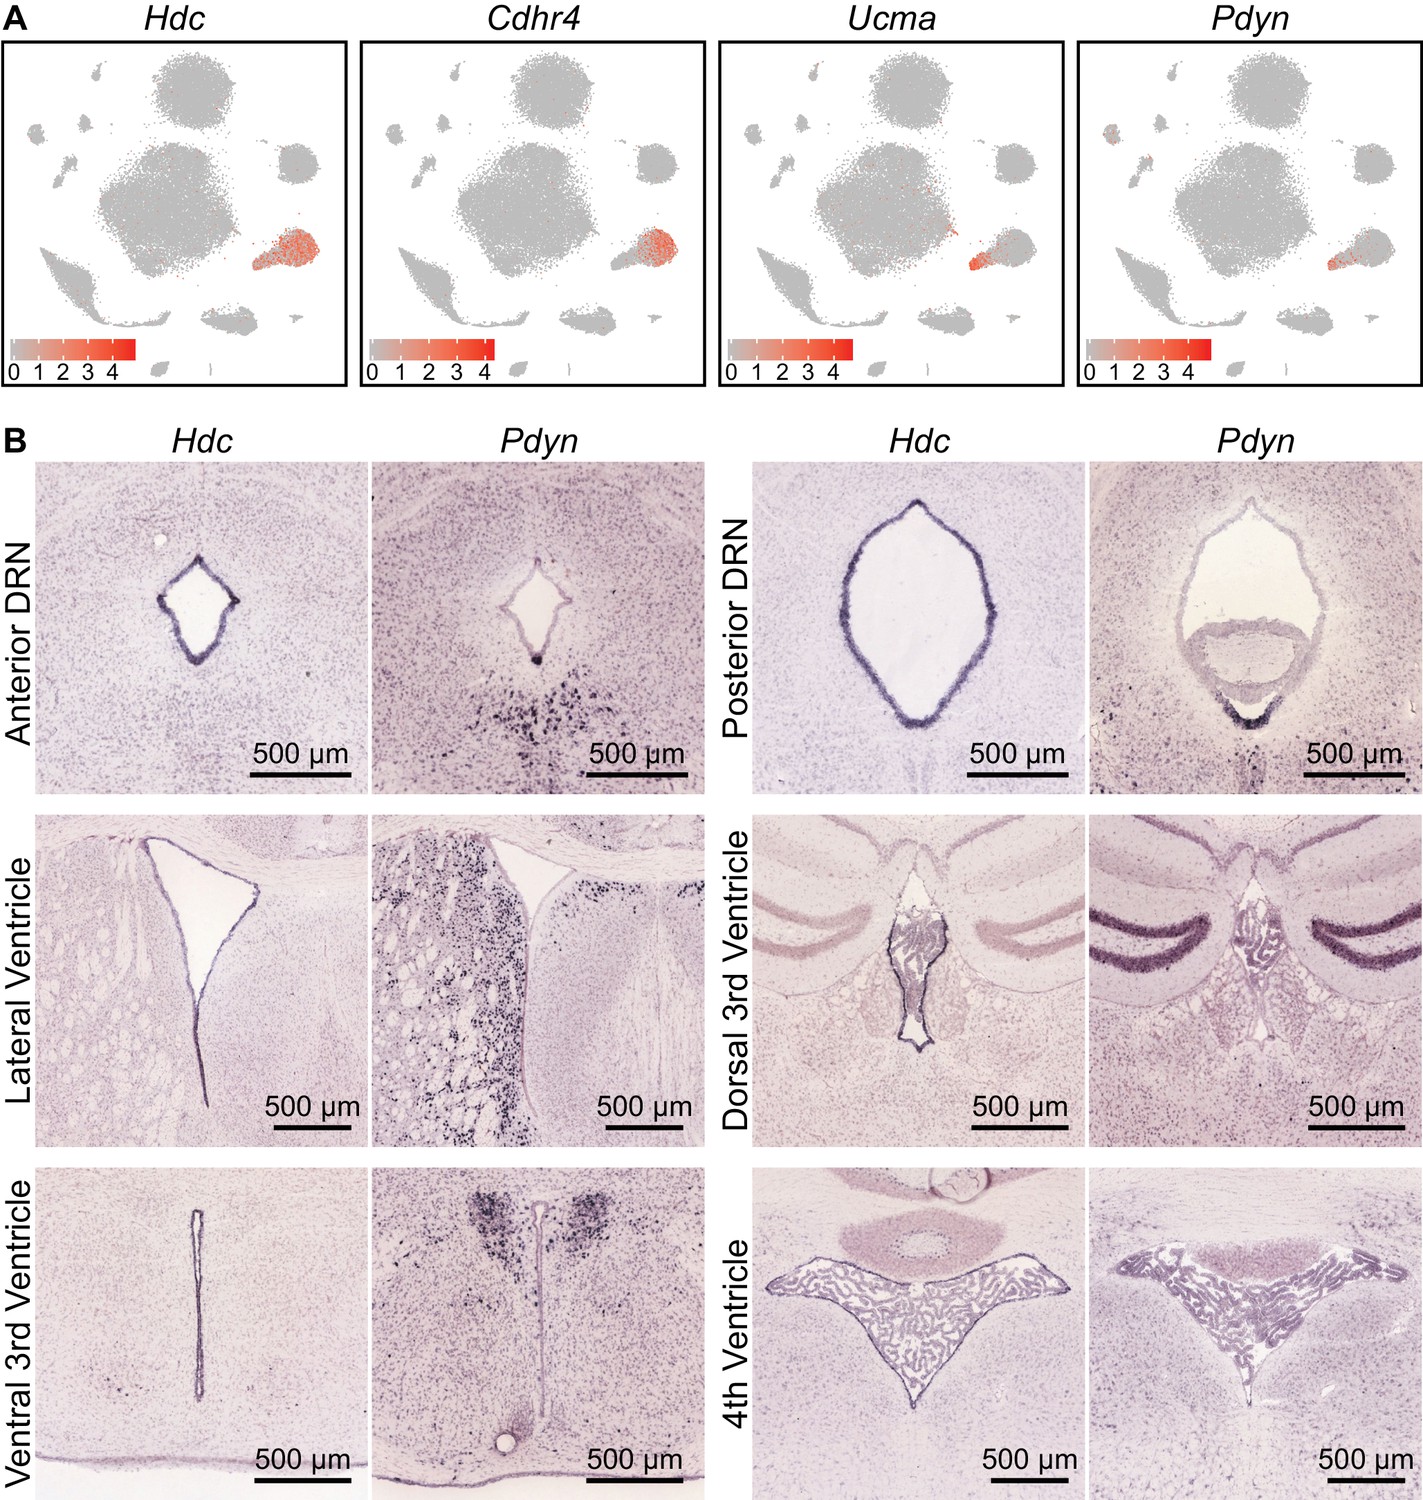
Ependymal cells lining the ventral cerebral aqueduct are of several distinct subtypes.
(A) t-SNE plots of the dataset, with cells color-coded by their expression of genes identifying different subsets of ependymal cell. Hdc is expressed in all ependymal cells, whereas genes such as Cdhr4, Ucma, and Pdyn are expressed in distinct subsets. (B) Images of coronal ISH from the Allen Brain Atlas showing expression of Hdc and Pdyn at various parts of the ventricular system. Hdc is expressed by ependymal cells lining most of the ventricular system. Pdyn expression is specific to the cells lining the ventromedial part of the posterior ventricular system, where it is highly expressed in the cerebral aqueduct, but not the lateral ventricles or 3rd ventricle.
Figure 2
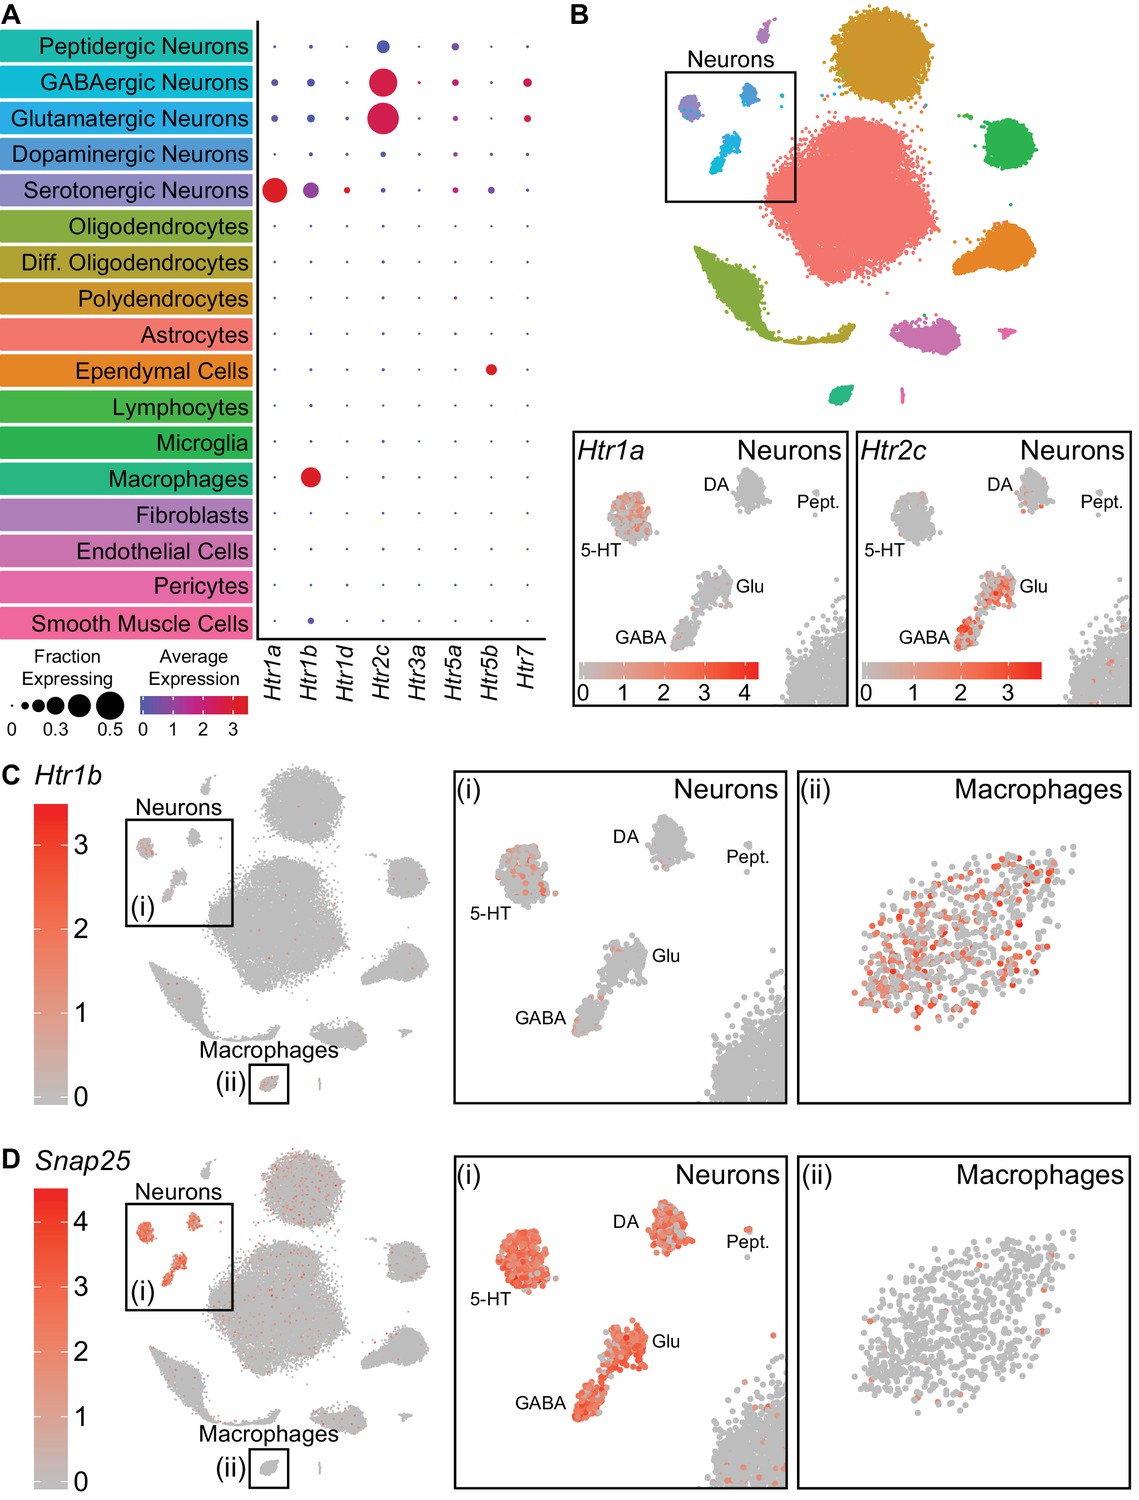
Serotonin receptors are expressed in both neurons and non-neuronal cells.
(A) Dot plots showing expression of the serotonin receptors present in the scRNA-seq dataset in each major cell class. Htr1a is expressed specifically in 5-HT neurons, whereas Htr1b is expressed in both 5-HT neurons and perivascular macrophages. Htr2c is expressed in both GABAergic and glutamatergic neurons. Htr5b is expressed in ependymal cells and a subset of 5-HT neurons. Htr7 is expressed in subsets of GABAergic and glutamatergic neurons. The remaining 5-HT receptors were detected at low levels. (B) t-SNE plots with the region containing neuronal clusters enlarged to show expression of Htr1a (bottom, left) or Htr2c (bottom, right) in individual cells. Cells are color-coded by expression of each transcript. Scale bars are in log-normalized UMI-filtered counts for the respective transcripts. (C) t-SNE plots with cells color-coded by their expression of Htr1b. Regions containing neuronal or perivascular macrophage clusters are enlarged. (D) t-SNE plots with cells color-coded by their expression of the neuron-specific transcript Snap25. Regions containing neuronal or perivascular macrophage clusters are enlarged. Snap25 transcripts are abundant in all neuronal clusters but not in perivascular macrophages, suggesting that Htr1b transcripts in perivascular macrophages are unlikely to be a result of engulfment of neuronal debris.
Figure 3 with 1 supplement
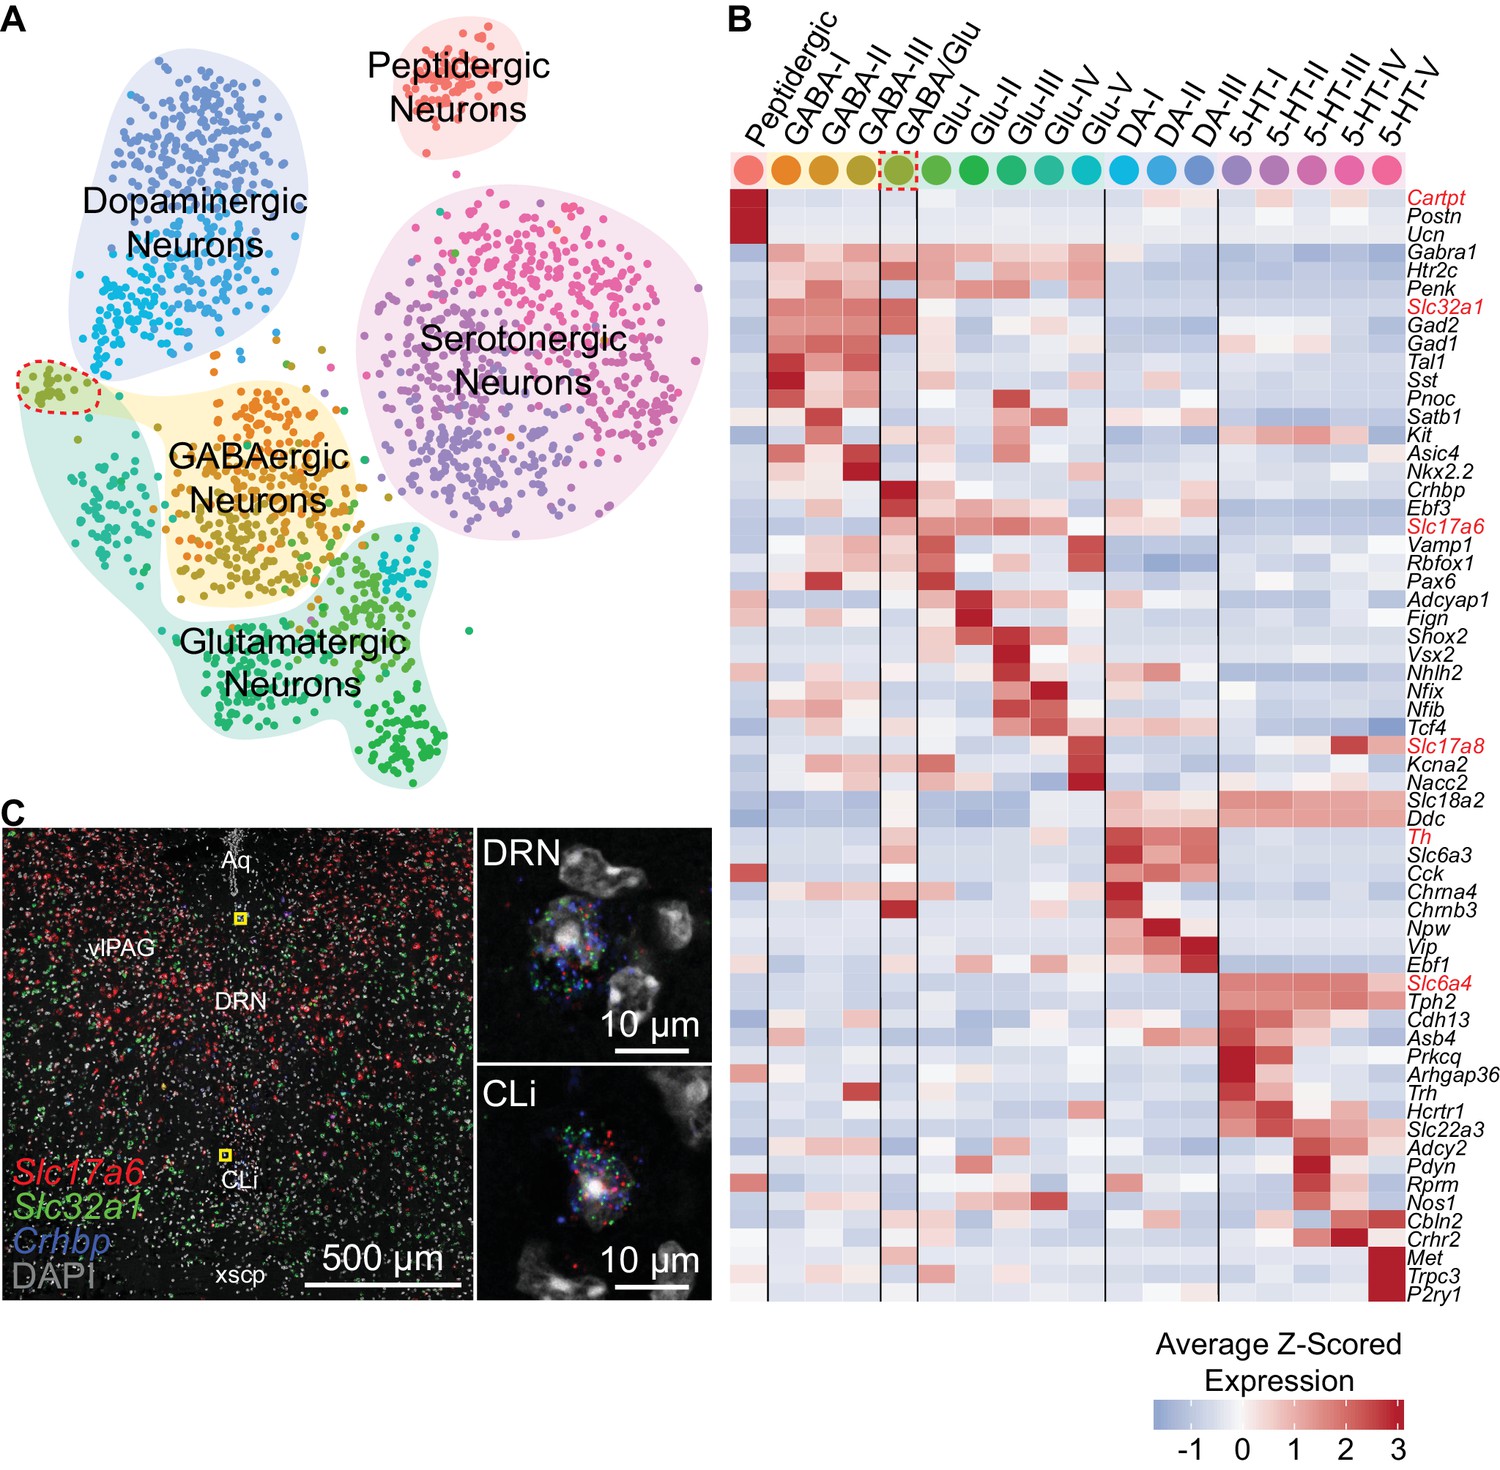
Neuron subtypes can be distinguished transcriptionally.
(A) t-SNE plot of 2,041 neurons. The main neuron types were defined by the expression of genes necessary to make or release specific neurotransmitters or neuropeptides, and are highlighted by the shaded regions. Several subtypes of each class of neuron, designated by the cell color, can be contained in each shaded region. Color codes for subtype identities correspond to column headers in (B). The cluster outlined in red corresponds to cells expressing both glutamatergic and GABAergic markers. (B) Heatmap showing the cluster average Z-scored expression of selected genes that are enriched in each neuron subtype. Genes used to identify major neuronal cell types by their neurotransmitters are labeled in red. (C) Fluorescent in situ hybridization validating the existence of cells expressing both GABAergic and glutamatergic markers. Cells expressing Slc32a1, Slc17a6, and Crhbp were found in anterior regions of the DRN in the caudal linear nucleus (CLi) and dorsomedial DRN in close proximity to the cerebral aqueduct. The regions indicated by the yellow boxes are shown enlarged on the right.
Figure 3—figure supplement 1
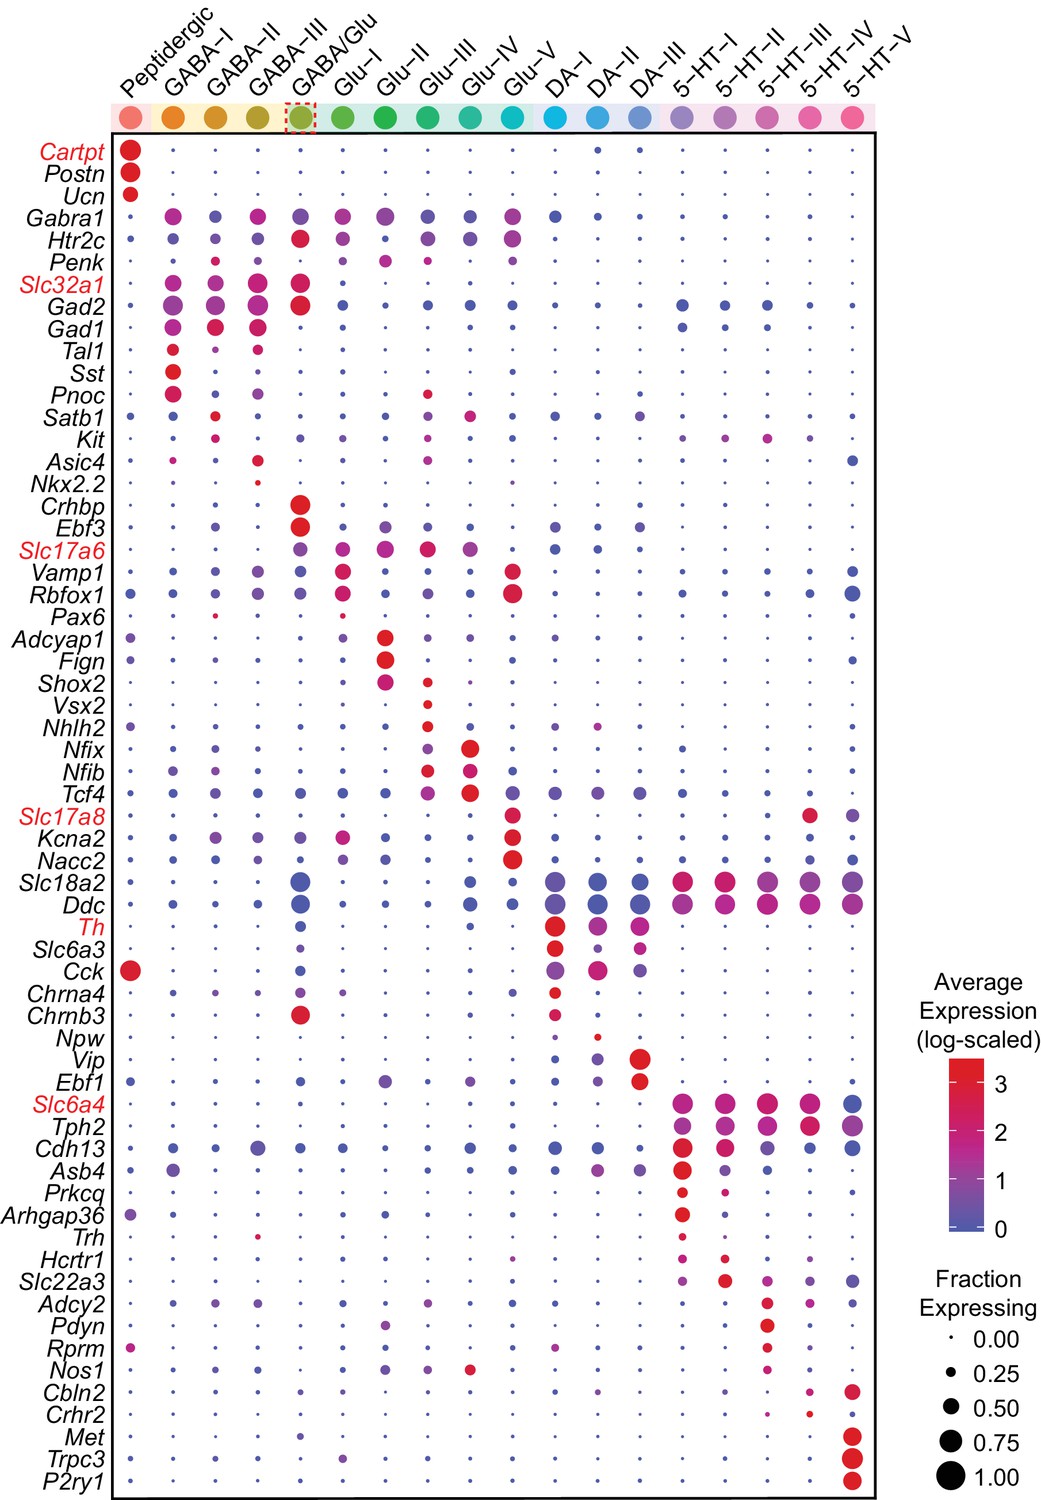
Average log-scaled expression of genes differentially expressed between neuron subtypes.
Dot plot showing the log-scaled expression for each gene shown in Figure 3B. The color of each dot represents the average log-transformed UMI counts for each gene after normalizing for the total transcript count per cell, while the size of the dot represents the fraction of cells in each neuron subtype cluster in which transcripts for that gene were detected.
Figure 4 with 3 supplements
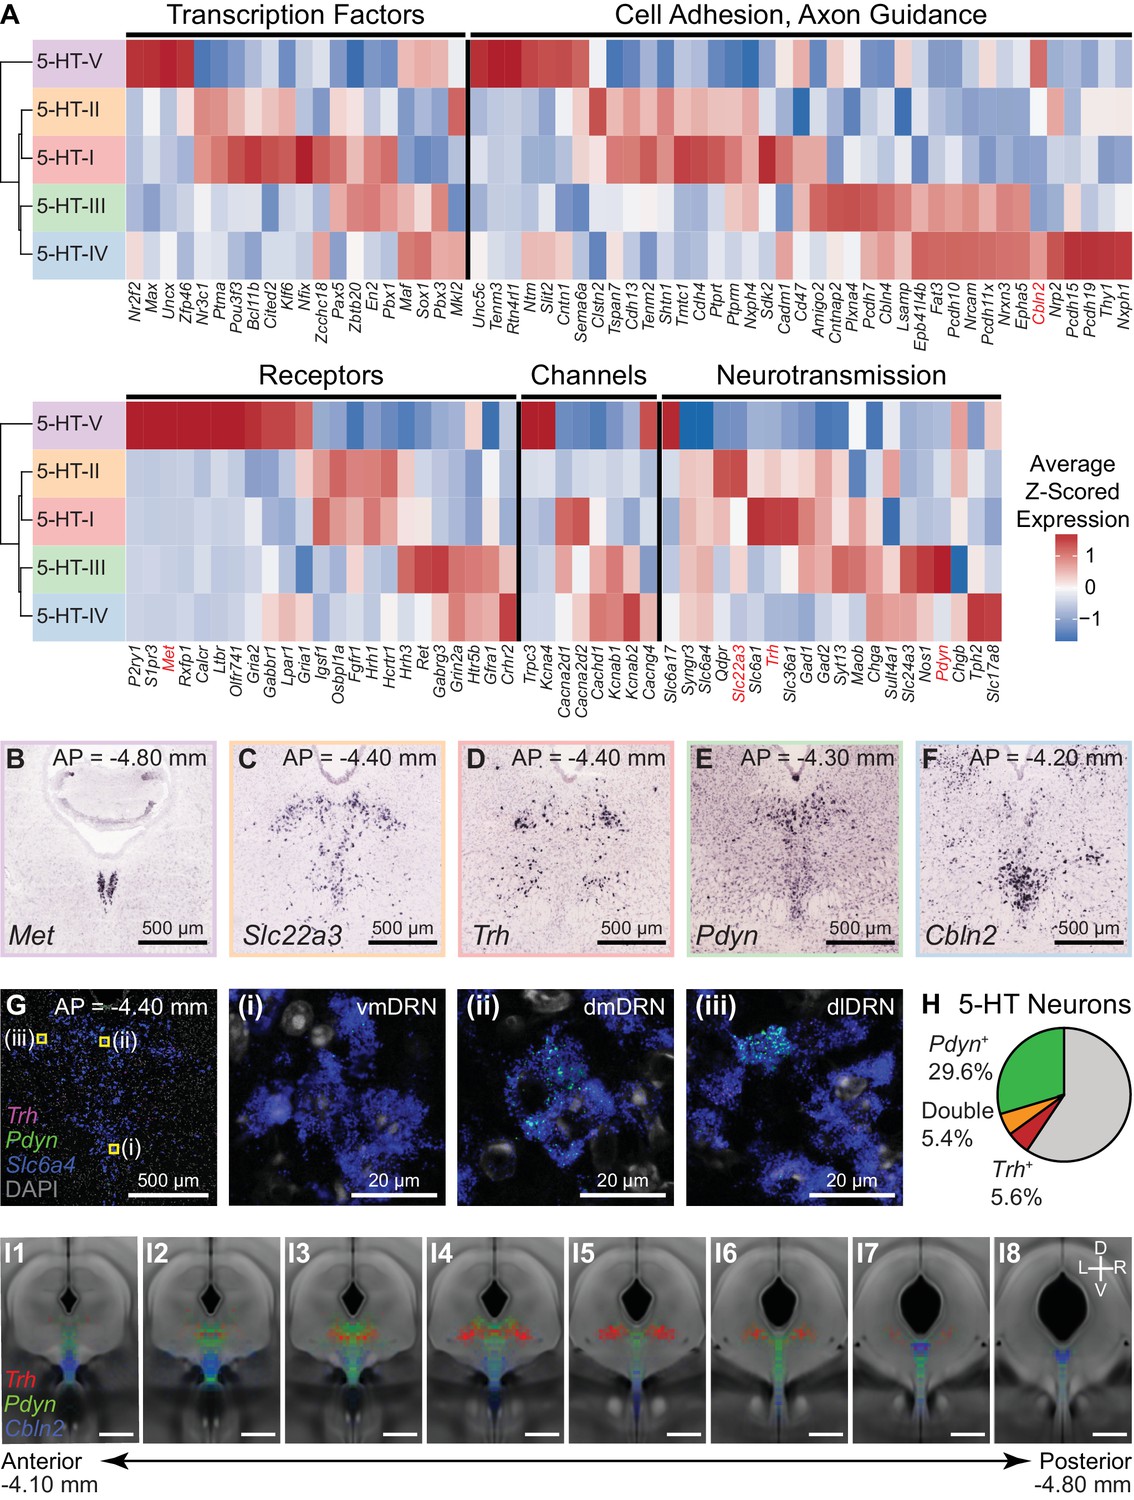
Characterization of genes differentially expressed between serotonergic neuron subtypes.
(A) Z-scored expression heatmaps of selected genes with functional annotations that are differentially expressed between DRN 5-HT neuron subtypes. A total of 333 differentially expressed (DE) genes were found (5% false discovery rate, Benjamini-Hochberg correction). A large proportion of DE genes encode for cell surface and transmembrane proteins. Genes shown are categorized into five groups: transcription factors, cell adhesion and axon guidance molecules, transmembrane receptors, ion channels, and neurotransmission-related genes. (B-F) In situ hybridizations from the Allen Brain Atlas showing the expression patterns of selected DE genes enriched in each of the five 5-HT neuron subtypes. Many DE genes are not expressed uniformly throughout the DRN and are instead spatially heterogenous along the anterior-posterior, medial-lateral, and dorsal-ventral axes, suggesting that 5-HT neuron subtypes are differentially distributed across spatial domains. (G) Confocal images from a representative DRN coronal section (AP = −4.40 mm) stained for mRNA transcripts of Trh (magenta), Pdyn (green), and Slc6a4 (blue) using RNAscope single molecule fluorescent in situ hybridization (FISH). Regions marked in yellow are enlarged in images (i)-(iii) and show differential expression of Trh and Pdyn in three DRN subregions. Trh and Pdyn expression is low in the ventromedial DRN (vmDRN), whereas 5-HT neurons expressing high levels of Trh or Pdyn can be found in the dorsomedial DRN (dmDRN) and dorsolateral DRN (dlDRN). Cells expressing both Pdyn and Trh were occasionally observed in the regions bordering dmDRN and dlDRN. (H) Proportion of 5-HT neurons (Slc6a4+) containing Pdyn or Trh transcripts (minimum of 3 puncta). Trh transcripts were detected in a small proportion of Pdyn+ 5-HT neurons. (I) Probability distribution maps of Slc6a4+ 5-HT neurons containing transcripts for Pdyn (green), Trh (red), or Cbln2 (blue) across multiple FISH experiments. Cells of each category were separately mapped to a reference atlas and counted in 50 µm x 50 µm bins. Bin counts were normalized to the total cell count for each category to obtain the probability maps that are displayed as heatmaps overlaid on the average coronal Nissl template from the Allen Brain Atlas. Pdyn-expressing 5-HT neurons are enriched along the midline, whereas Trh-expressing 5-HT neurons are enriched in dorsolateral regions. Cbln2-expressing 5-HT neurons are distributed more ventrally, and are also found in the posterior B6 tail of the DRN (panel I7). Positions of Slc6a4- cells are not shown. Scale bars: 500 µm, unless otherwise stated.
Figure 4—figure supplement 1
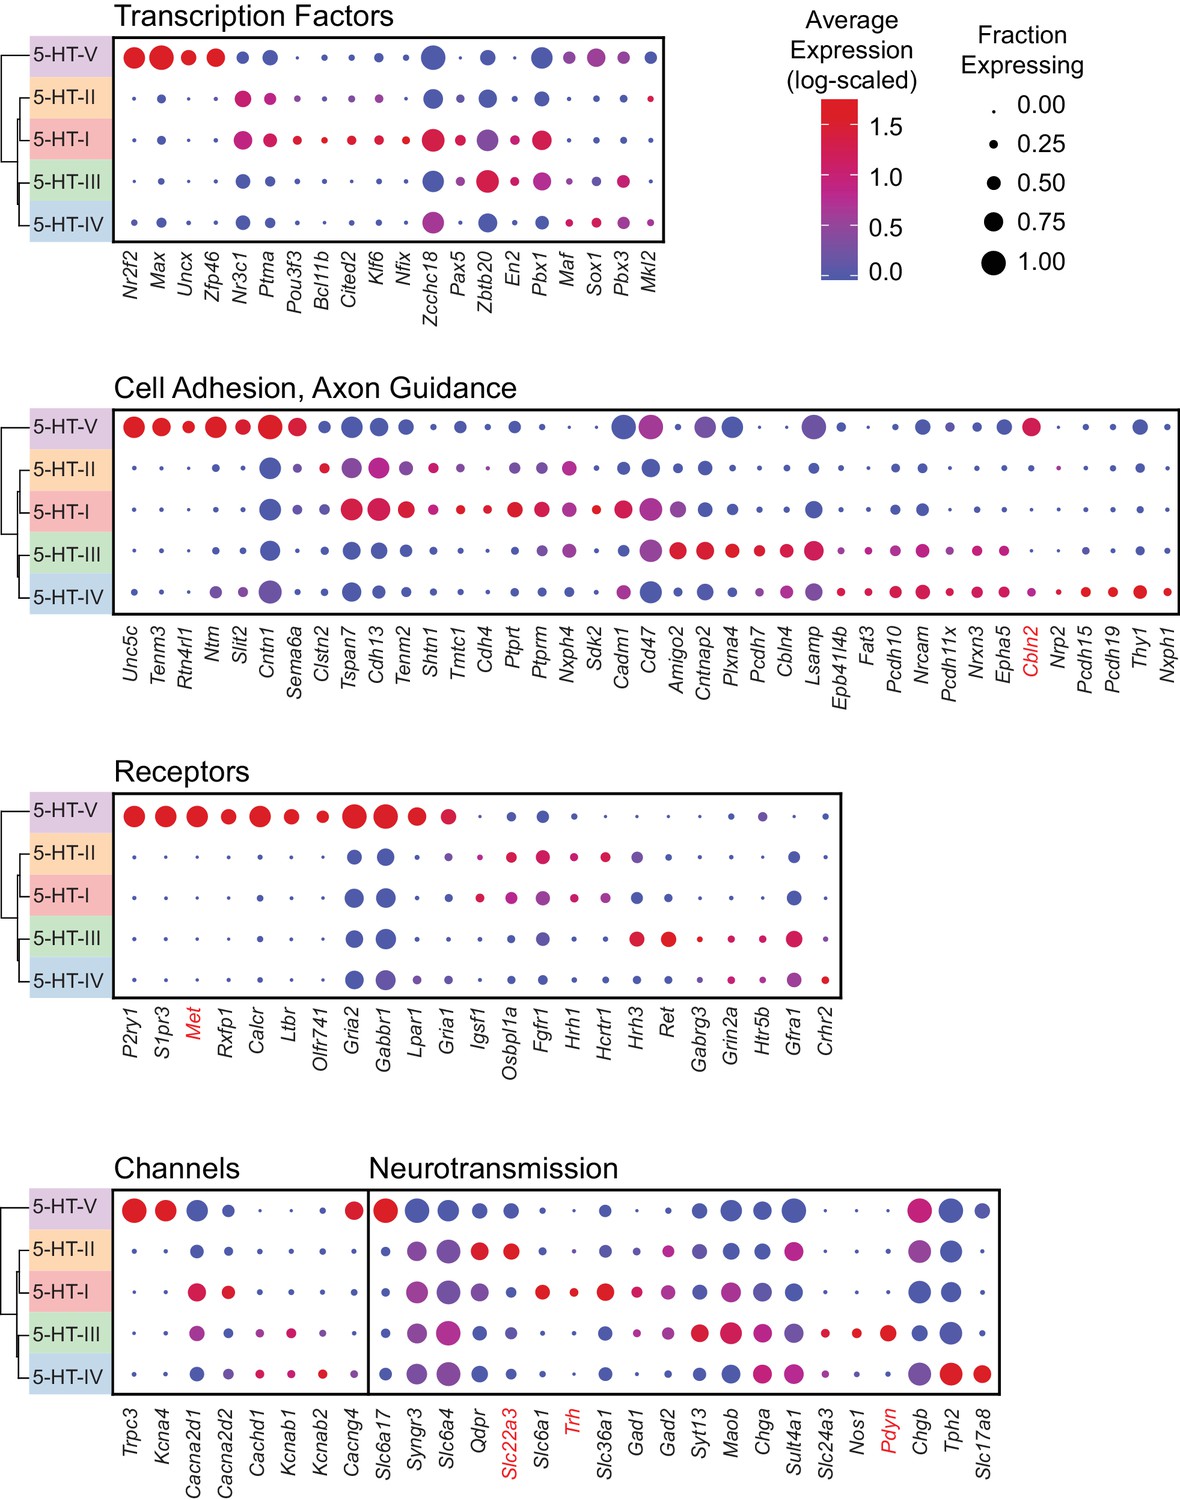
Average log-scaled expression of genes differentially expressed between 5-HT neuron subtypes.
Dot plot showing the log-scaled expression for each gene shown in Figure 4A. Genes are sorted into four separate dot plots based on their functional grouping. The color of each dot represents the average log-transformed UMI counts for each gene after normalizing for the total transcript count per cell, while the size of the dot represents the fraction of cells in each 5-HT neuron subtype cluster in which transcripts for that gene were detected.
Figure 4—figure supplement 2

Enriched gene ontology terms associated with genes differentially expressed between 5-HT neuron subtypes.
Selected gene ontology (GO) terms that were significantly enriched (Q < 0.05, Benjamini-Hochberg correction) were sorted by ontology category and arranged in order of increasing Q values. Q values and the proportion of differentially expressed genes associated with each GO term, expressed as a percentage of genes in the background list associated with the GO term, are shown as bar plots. The majority of genes differentially expressed between 5-HT neuron subtypes were membrane proteins (GO:0016020, 193 of 333 genes) that included transporters, cell adhesion molecules, receptors, and synaptic proteins.
Figure 4—figure supplement 3
Additional validation of differential gene expression between 5-HT neuron subtypes using FISH.
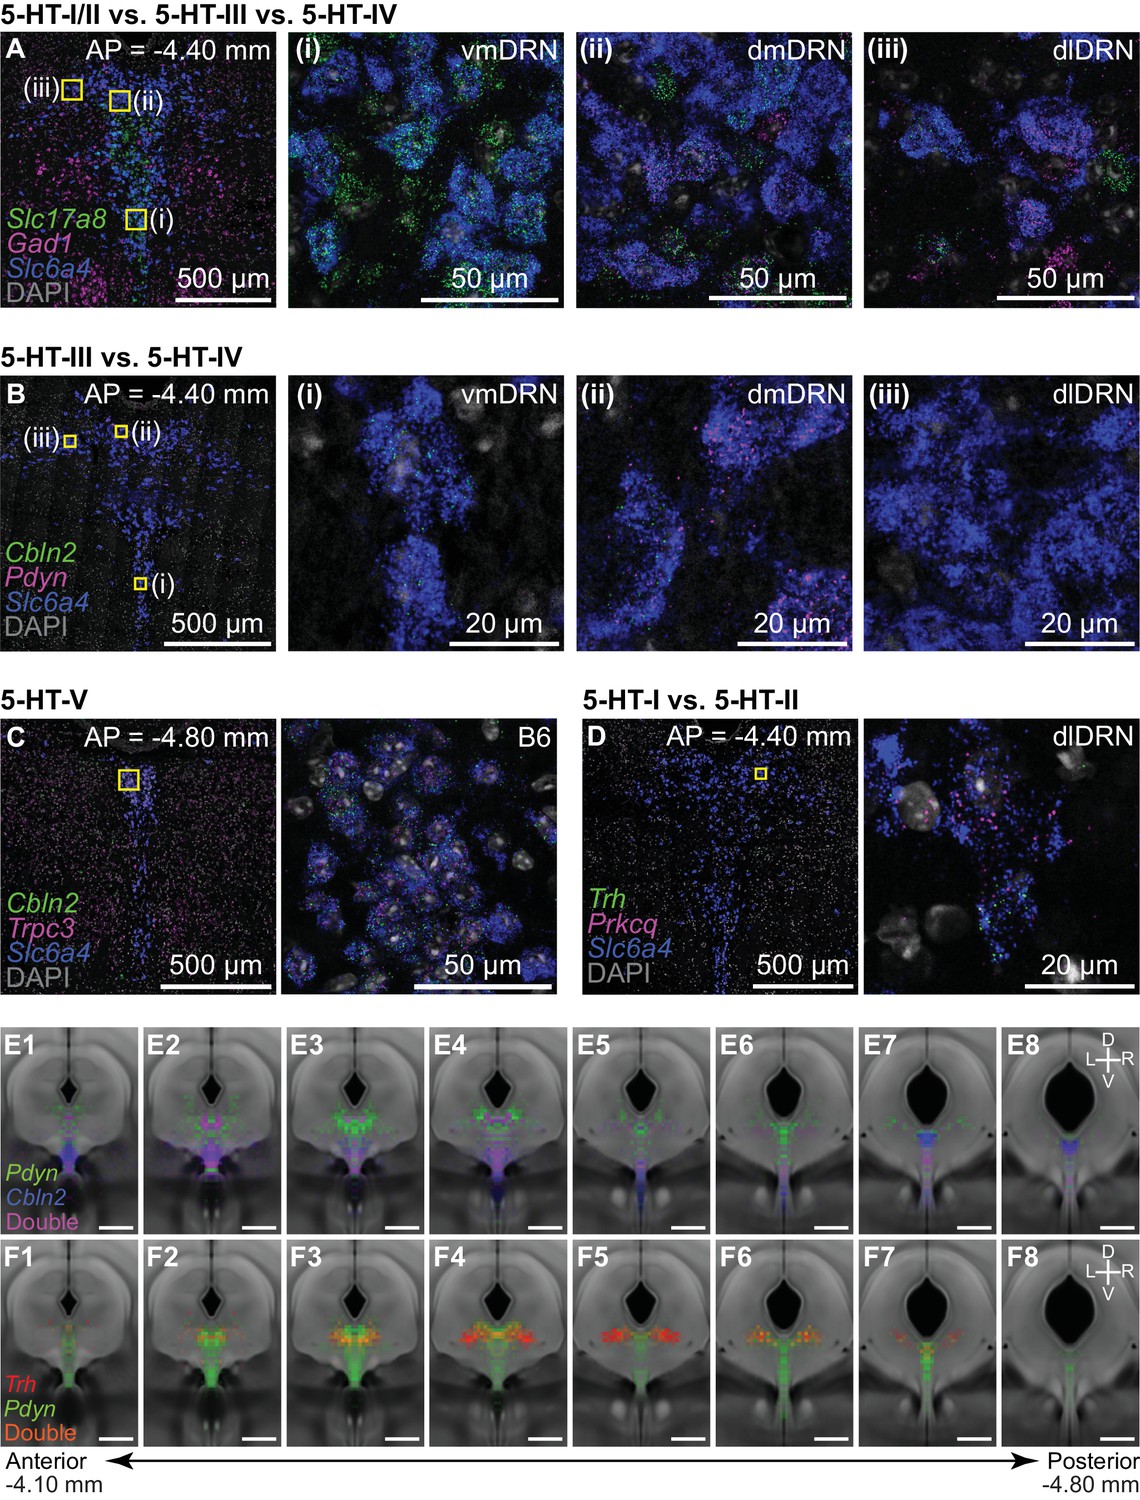
(A-D) Confocal images from representative DRN coronal sections stained for transcripts of interest using multiplexed single molecule FISH. All sections were stained for Slc6a4 (blue) to identify 5-HT neurons, and counterstained using DAPI (gray). For panels A and B, regions outlined in yellow are enlarged in the images on the right labeled (i), (ii), and (iii), which correspond to the ventromedial DRN (vmDRN), dorsomedial DRN (dmDRN), and dorsolateral DRN (dlDRN), respectively. (A) 5-HT neurons expressing Slc17a8 (green) are enriched along the midline in both vmDRN and dmDRN. 5-HT neurons expressing Gad1 (magenta) were found in dmDRN and dlDRN. (B) Cbln2 (green) is expressed in 5-HT neurons along the midline, but is largely absent from dlDRN. 5-HT neurons expressing both Cbln2 and Pdyn were also found in both vmDRN and dmDRN. 5-HT neurons in dmDRN expressed higher levels of Pdyn compared to Pdyn+ 5-HT neurons in vmDRN. (C) Putative 5-HT-V neurons expressing high levels of both Cbln2 (green) and Trpc3 (magenta) were found in the posterior B6 subregion of the DRN, which is enlarged in the image on the right. Cells co-expressing Cbln2 and Trpc3 also showed reduced staining for Slc6a4 transcripts compared to 5-HT neurons in other subregions, consistent with reduced expression of Slc6a4 in the 5-HT-V cluster from the scRNA-seq data. (D) Putative 5-HT-I neurons expressing Trh (green) are a subset of Prkcq+ (magenta) 5-HT neurons. Prkcq+;Trh- 5-HT neurons are putative 5-HT-II neurons. (E) Spatial distribution of 5-HT neurons from a single FISH experiment co-staining for Cbln2, Pdyn, and Slc6a4 (n = 5,806 cells, 3 mice). The locations of 5-HT neurons positive for Cbln2 only (blue; n = 1,926 cells), Pdyn only (green; n = 1,048 cells), or double-positive for both transcripts (magenta; n = 1,517 cells) are displayed as probability heatmaps overlaid on the coronal averaged Nissl template. (F) Probability heatmaps from a separate FISH experiment co-staining for Trh, Pdyn, and Slc6a4 (n = 6304 cells, 3 mice). Heatmaps show the spatial distribution of 5-HT neurons positive for Trh only (red; n = 355 cells), Pdyn only (green; n = 1,867 cells), or double-positive for both transcripts (orange; n = 339 cells). Scale bars: 500 µm, unless otherwise stated.
Figure 5 with 2 supplements
5-HT neuron subtypes are distributed in distinct but overlapping spatial domains.
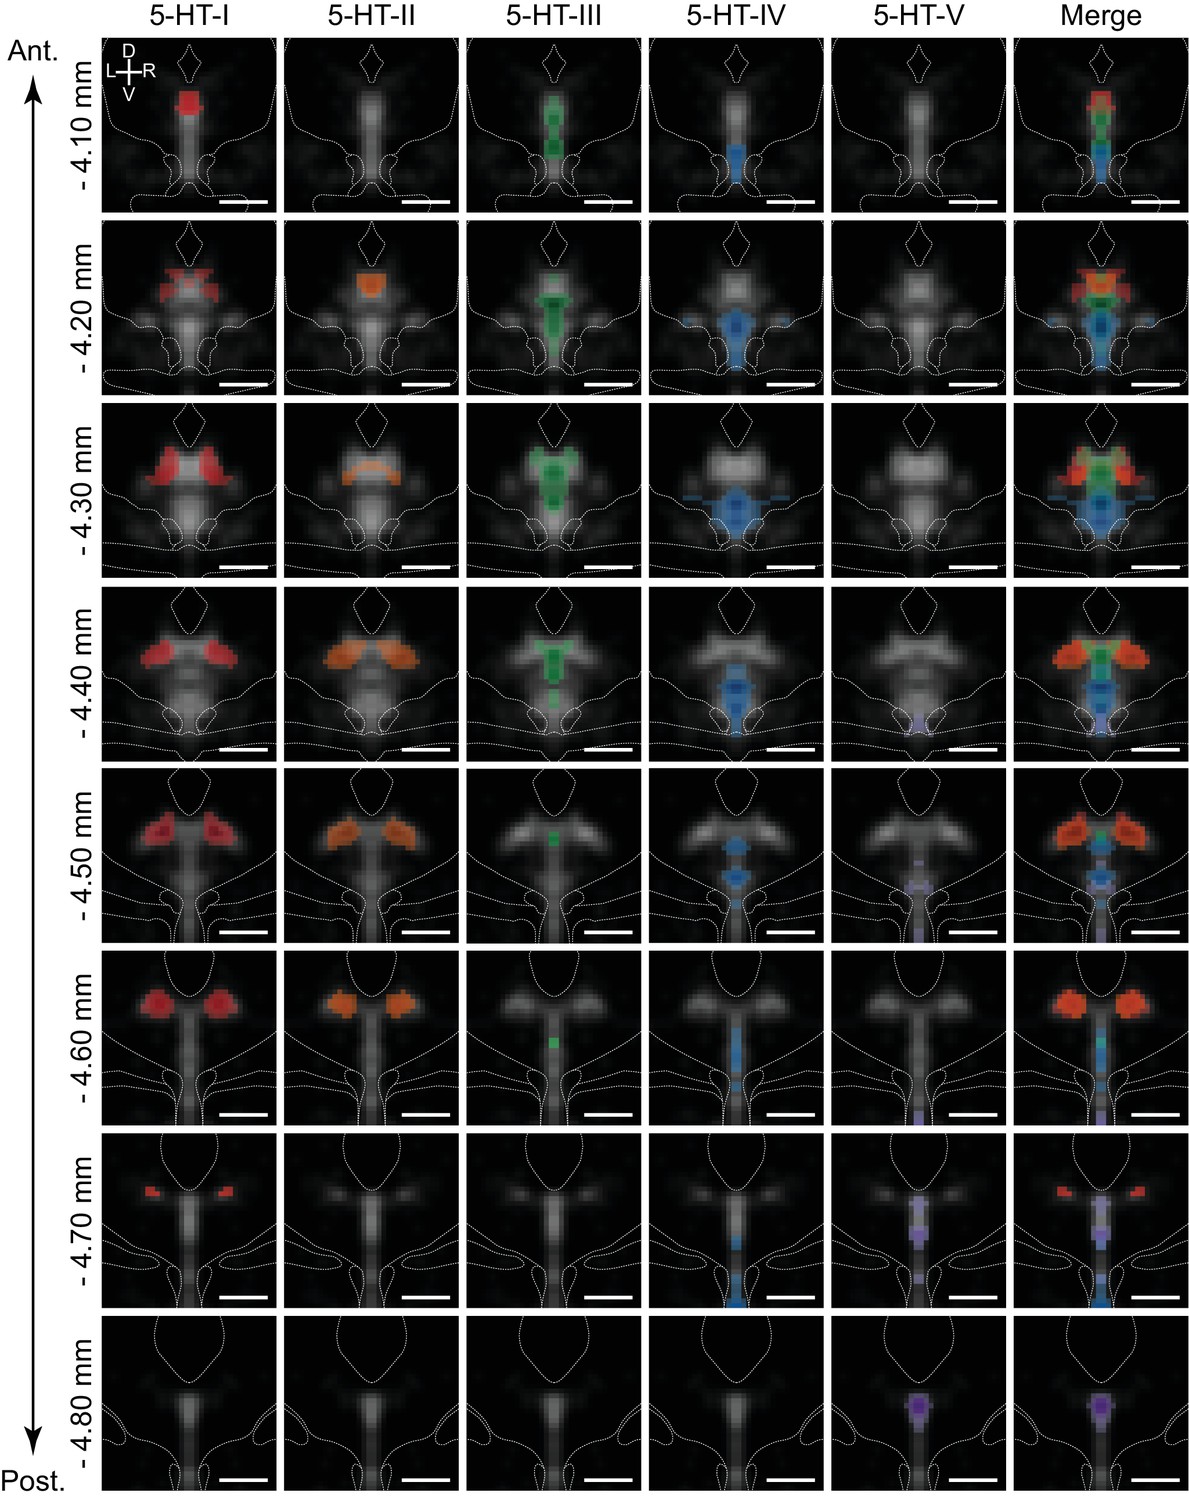
Inferred spatial distributions of 5-HT neuron subtypes displayed as a map of correlation coefficients between profiles of gene expression of each subtype and each spatial bin. Each column shows the correlation map for each 5-HT neuron subtype at different coronal sections along the anterior-posterior axis of the DRN (rows). Only bins with positive correlation coefficients greater than 0.1 are shown, and maps were smoothed using a 2D Gaussian filter (1SD) for display. Correlation maps are overlaid on the averaged Tph2 expression (grayscale, based on ISH data from the Allen Brain Atlas). Anatomical landmarks visible in the averaged Nissl template, such as the cerebral aqueduct and fiber tracts, are outlined and overlaid on each coronal image. Correlation maps for subtypes 5-HT-I and 5-HT-II suggest that they are largely intermingled in the dorsolateral DRN, with some overlap in the anterior DRN with 5-HT-III in the dorsomedial DRN. 5-HT-IV was enriched in the ventral regions of the DRN, while 5-HT-V was highly restricted to the posterior B6 tail of the DRN that was highly enriched in expression of the 5-HT-V enriched gene Met. Scale bars: 500 µm.
Figure 5—figure supplement 1
Processing of ISH images for spatial correlation analysis.
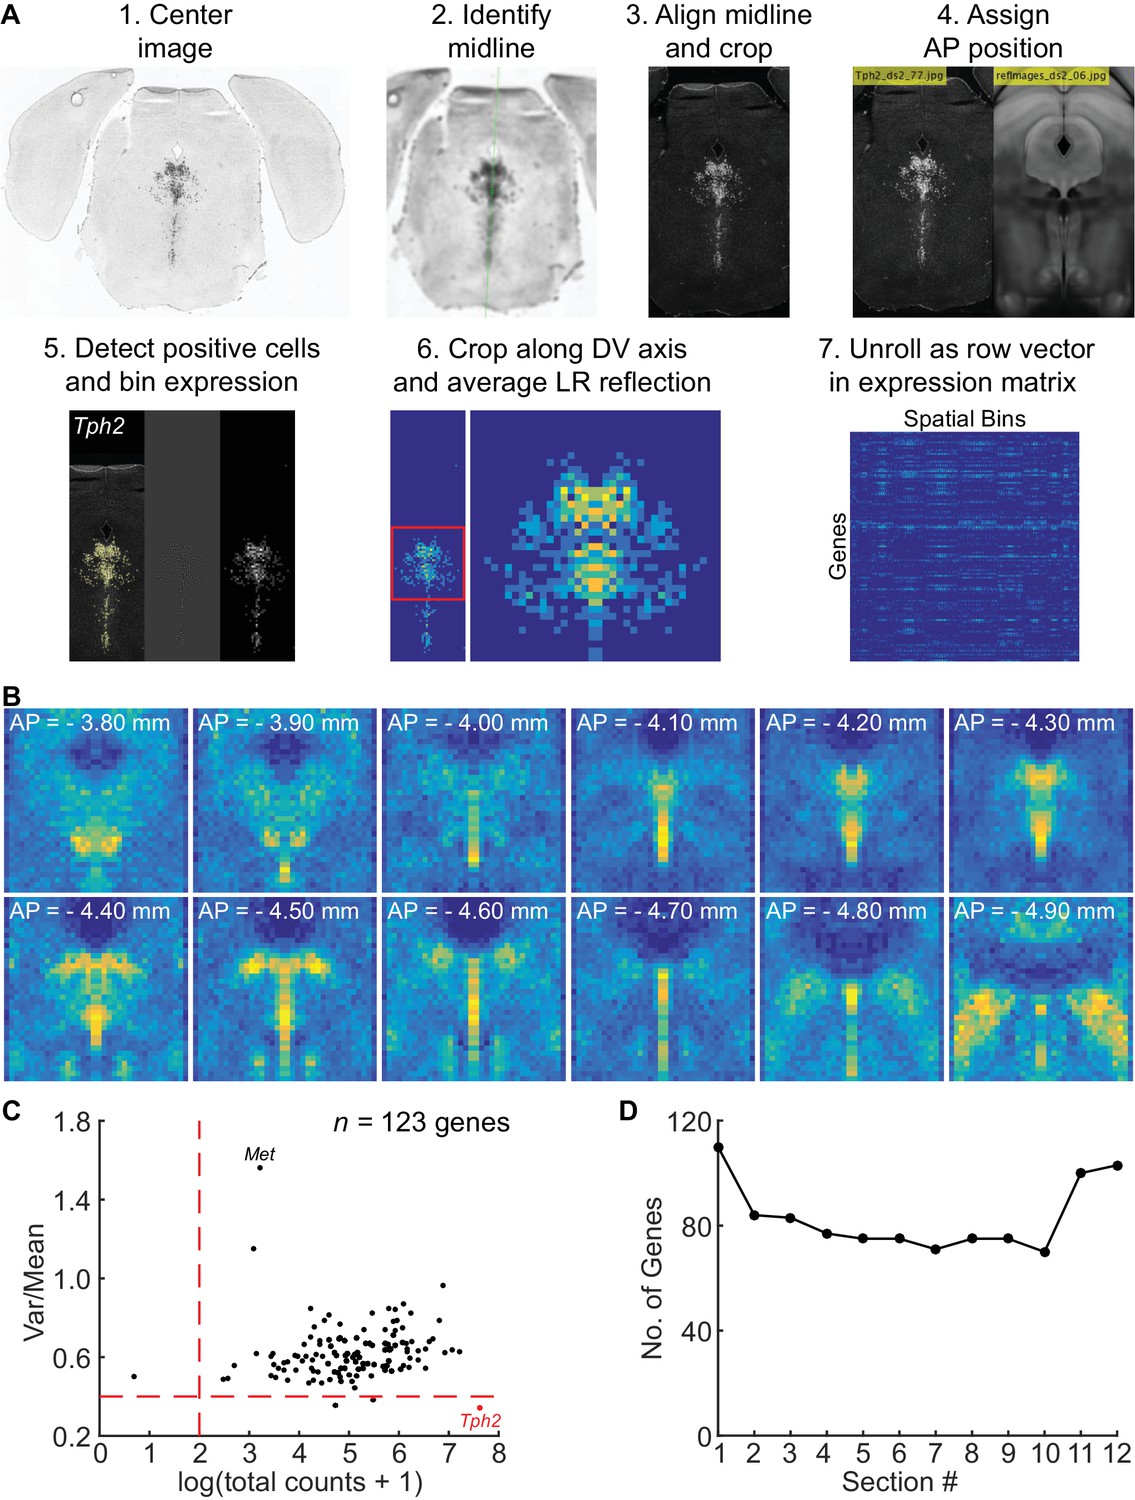
(A) Overview of workflow for processing ISH images from the Allen Brain Atlas to generate the spatial expression matrix. Coronal images spanning the DRN in each ISH experiment were downsampled and centered on the brain slice. The midline in each slice was identified and the image was rotated to align the midline vertically. Rotated images were cropped and assigned to corresponding positions along the anterior-posterior axis relative to the Allen Brain Atlas coronal template. Cells positive for the ISH signal were identified using a spot detection algorithm and counted in 50 × 50 µm bins to generate 2D histograms for each image. 2D histograms, representing the spatial expression profile of the probed gene in a given coronal section, were aligned and cropped along the dorsal-ventral axis to retain only the region containing the DRN (36 X bins x 36 Y bins). Cropped histograms were averaged with the left-right reflection and combined with the other histograms generated from other images in the same experiment image series to generate the volume data (36 X bins x 36 Y bins x 12 images) including NaN values for missing data. Volume data for each gene was unrolled into a single row vector (of 15,552 entries), and row vectors were concatenated to generate the spatial expression matrix for spatial correlation analysis. (B) Sum of 2D histograms generated by the workflow in (A), displayed as a series of 12 coronal sections showing the summed count of cells detected across all ISH images analyzed. Anatomical landmarks such as the cerebral aqueduct, fiber tracts, periaqueductal gray, and DRN are easily discerned from the images of the histograms, suggesting that the histograms were well aligned and have good coverage of the DRN. (C) Scatter plot of the total expression and mean-normalized variance for genes in the spatial expression matrix within the Tph2+ region. Each dot represents 1 of the 123 genes in the expression matrix. Genes with low spatial variability within the masked region, such as Tph2 (marked red), and low total expression were excluded from the spatial correlation analysis. Met, which showed the most spatial variability since its expression is restricted to the posterior cluster, is also marked on the plot. (D) Plot of the number of genes used for the spatial correlation analysis at each of the 12 coronal sections (genes per 2D histogram). Genes with missing data at a given coronal section (i.e. no image or damaged slice) were not included in the count. Approximately 80 genes on average were used for calculating the correlation coefficient for each spatial bin.
Figure 5—figure supplement 2
Correlation coefficient maps for DRN 5-HT neuron subtypes.
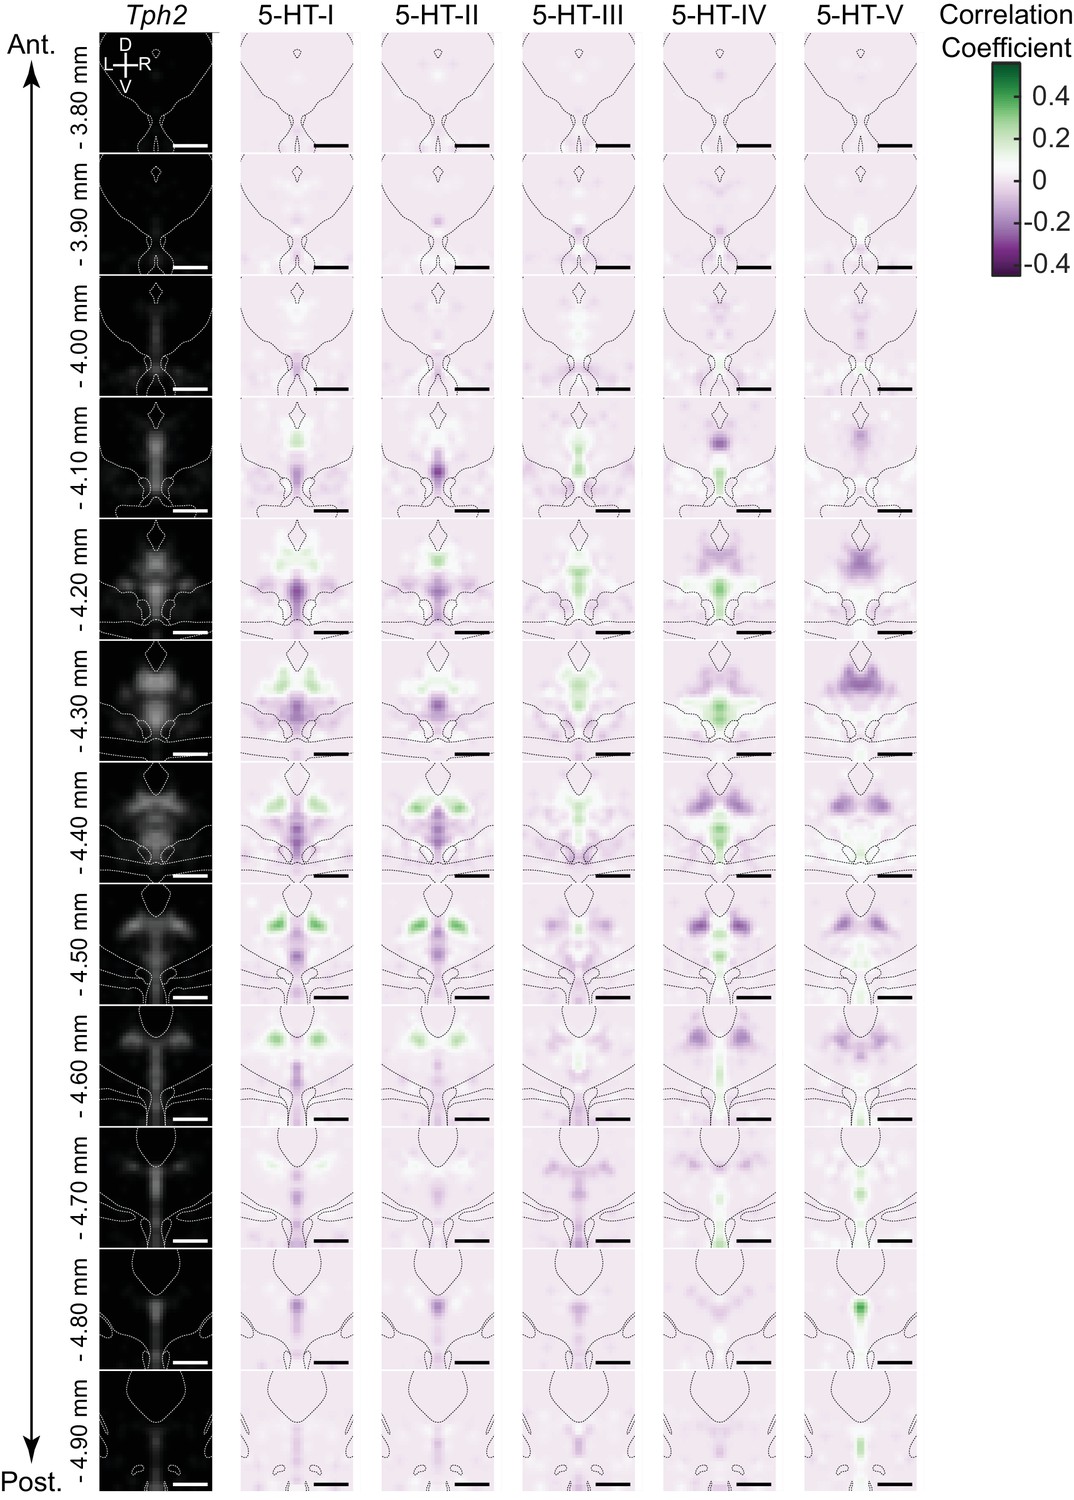
Spatial correlation maps displayed as heatmaps arranged in columns for each 5-HT neuron subtype. Heatmaps correspond to coronal sections, and are arranged vertically in order along the anterior-posterior axis. The averaged Tph2 ISH signal is included in the left-most column as a reference for the DRN outline. Anatomical landmarks visible in the averaged Nissl template, such as the cerebral aqueduct and fiber tracts, are outlined and overlaid on each coronal image. Spatial bins in the heatmaps with positive correlations (green) indicate the most likely locations of each 5-HT neuron subtype. Spatial correlation maps have been smoothed using a 2D Gaussian filter (1SD) for visualization. Since only differentially expressed genes were used for this analysis, negative correlations are also seen. These reflect the locations of 5-HT neurons of other subtypes from which, by definition, the differentially expressed genes that define one subtype are excluded. Scale bars: 500 µm.
Figure 6 with 3 supplements
Projection-defined DRN neuron subpopulations overlap with multiple 5-HT subtypes.
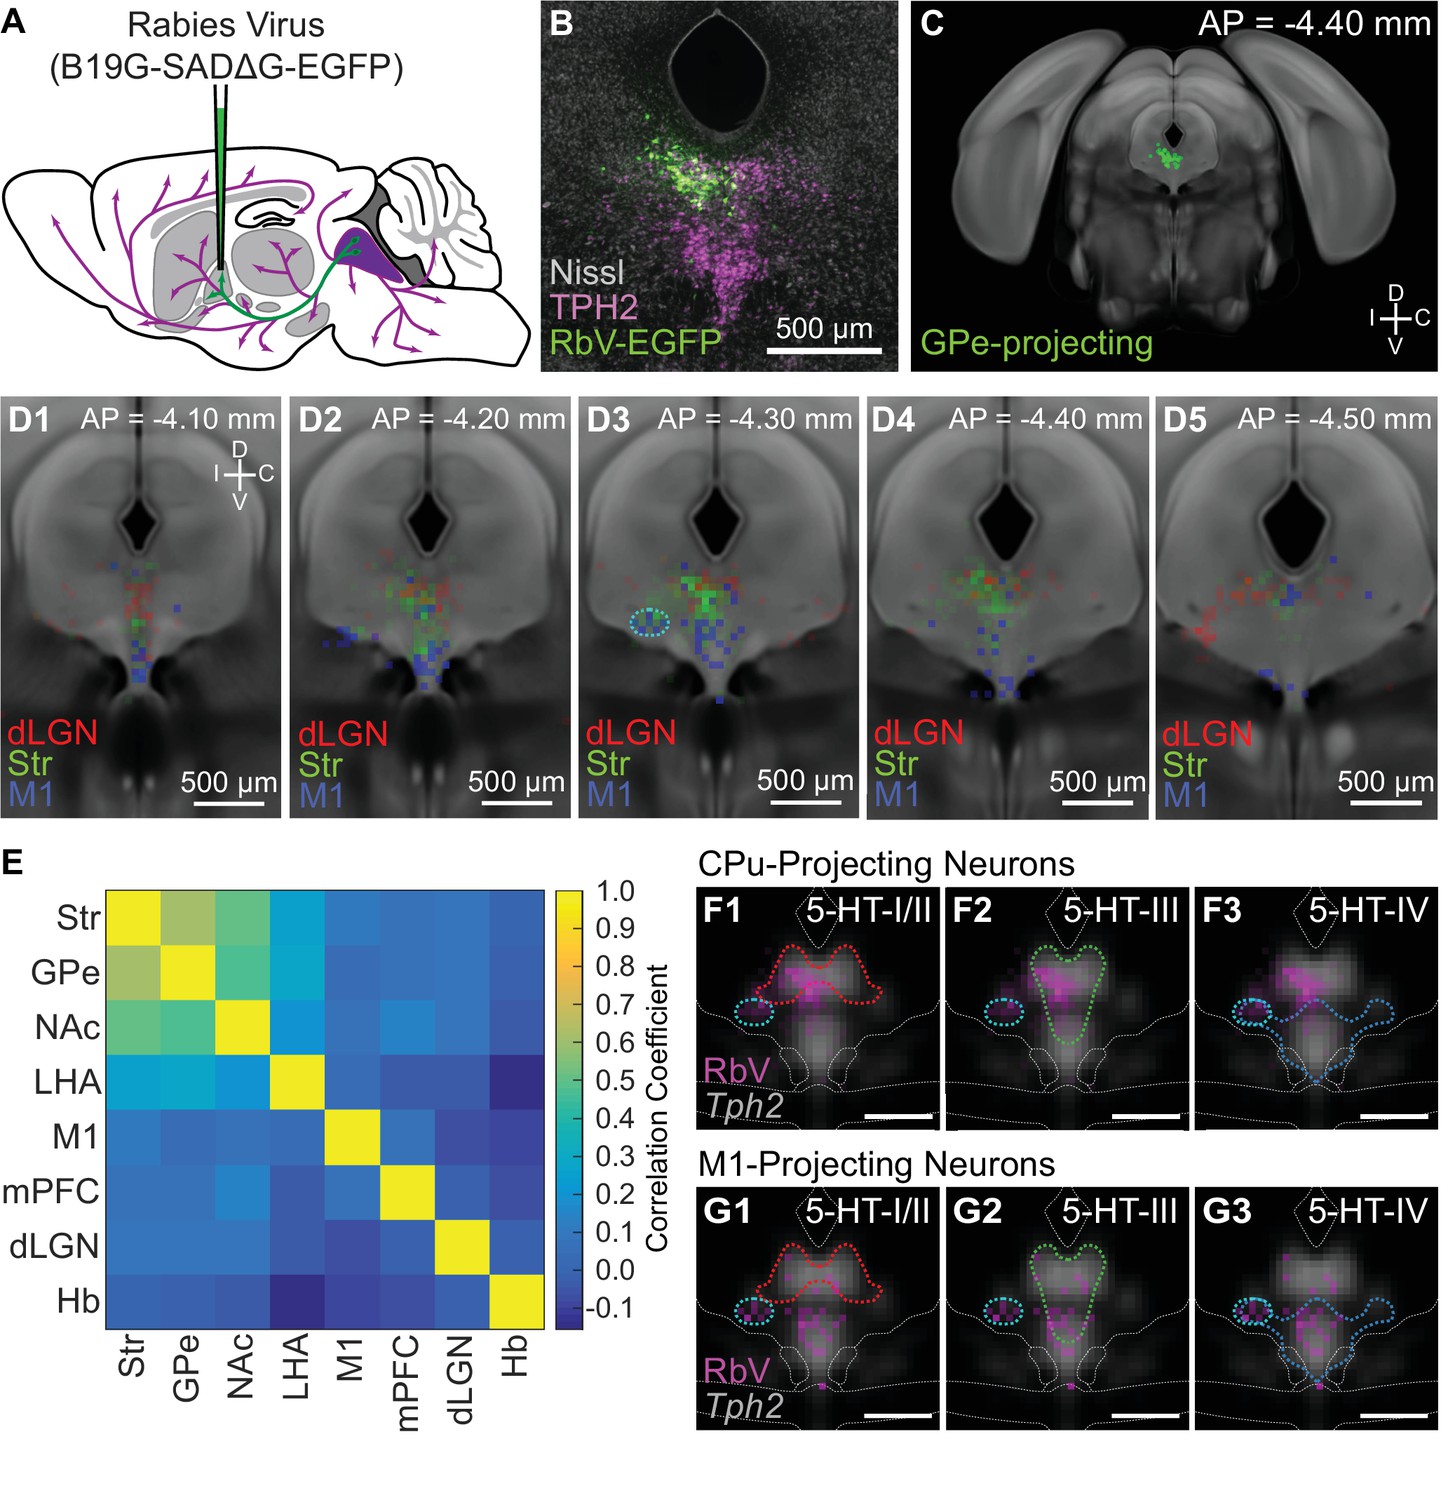
(A) Schematic of retrograde tracing experiments in which unpseudotyped rabies viruses (SADΔG B19 stain) were used to infect and label neurons whose axons innervate the virus-injected target region (GPe in this example). (B) Image of a coronal section of the DRN showing rabies-labeled, GPe-projecting neurons. Brains were fixed 7 days post-injection for histology, and 5-HT neurons in the DRN were visualized using immunohistochemistry against TPH2. Sections were counterstained using a fluorescent Nissl stain (Neurotrace). (C) The location of all rabies-labeled cells within the DRN and vlPAG, such as the GPe-projecting cells in (B), were manually registered onto a coronal template derived from the averaged Allen Brain Atlas coronal Nissl stain. Labeled neurons outside of this region of interest, such as the PPN and dorsal PAG, were not included. (D1-5) Distributions of Str-projecting (green), M1-projecting (blue), and dLGN-projecting (red) subpopulations, displayed as a probability density map (50 µm x 50 µm bins) overlaid on the coronal template. Coronal sections shown are centered in panel D3 at the maximum density of the Str-projecting population. Str- and M1-projecting populations were largely separated along the dorsal-ventral axis, with some overlap. Co-labeled neurons projecting to both Str and M1 were typically found in the ventrolateral DRN, outlined in cyan in D3, and the ventromedial DRN. (E) Pairwise correlations between the distributions of projection-defined subpopulations. Correlations between the Str-projecting subpopulation were higher with other subpopulations that also innervate nuclei of the basal ganglia, compared with subpopulations innervating functionally distinct targets such as M1 or dLGN. (F-G) Overlap between the distributions of neurons innervating Str (F) or M1 (G) and the 5-HT neuron subtype distributions at AP = −4.30 mm. Distributions of each projection-defined subpopulation are represented as probability maps (magenta) overlaid on the averaged Tph2 expression. Subtype distributions are represented as color-coded outlines corresponding to the colors used in Figure 4 for each subtype. Str-projecting neurons largely fell into regions occupied by both 5-HT-III and 5-HT-IV subtypes, suggesting molecular heterogeneity within this projection-defined population. M1-projecting neurons were more confined to the ventral DRN, overlapping with the distribution of the 5-HT-IV subtype. Scale bars: 500 µm.
Figure 6—figure supplement 1

Spatial distributions of projection-defined subpopulations.
Distributions of all projection-defined subpopulations in Figure 5 displayed as probability density maps. Distributions for each subpopulation were projected onto either the horizontal or sagittal plane (50 × 100 µm bins). The midline in horizontal projections is indicated by a straight gray line at 0 mm, and distances from the midline are negative for the hemisphere ipsilateral to the injection site. The region occupied by the cerebral aqueduct is shaded in solid gray in sagittal projections, and the depth indicated is relative to the origin of the PIR space in the Allen Brain Atlas. The flattened projection of the region containing Tph2+ cells is outlined by the gray dashed line in each image. Str-projecting and GPe-projecting subpopulations were the most similar, whereas the Str-projecting and NAc-projecting subpopulations were mostly overlapping in the anterior DRN but differed in the posterior DRN. Cells outside of the ventrolateral periaqueductal gray and DRN, such as cells in the pedunculopontine nucleus or dorsal periaqueductal gray, were excluded from the probability maps. Abbreviations: Str: striatum; GPe: globus pallidus, external; NAc: nucleus accumbens; LHA: lateral hypothalamic area; M1: primary motor cortex; mPFC: medial prefrontal cortex; dLGN: dorsal lateral geniculate nucleus; Hb: habenula.
Figure 6—figure supplement 2
Ventrolateral DRN neurons send axon collaterals to both striatum and motor cortex.
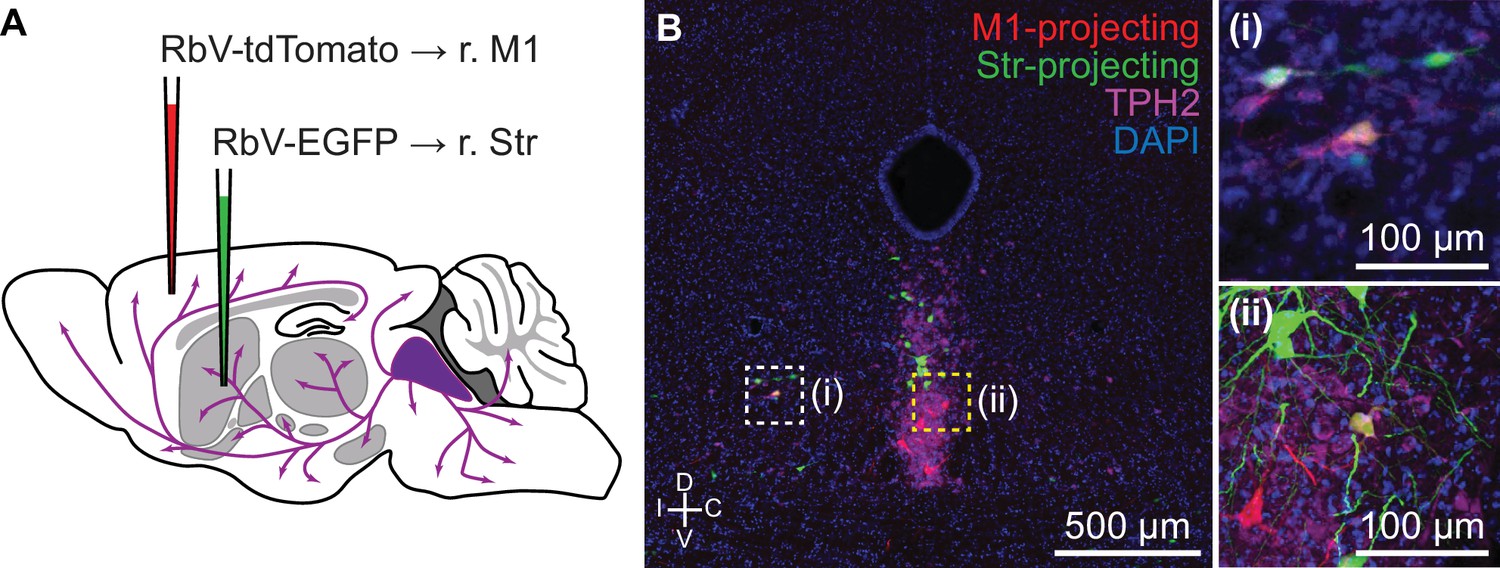
(A) Schematic of double retrograde tracing experiment using unpseudotyped rabies viruses. RbV-tdTomato was injected into primary motor cortex, and RbV-EGFP was injected into the ipsilateral striatum. Tissue collection for histology was performed 7 days post-injection. (B) Representative fluorescent image of a coronal section through the anterior DRN containing both M1- and Str-projecting neurons. 5-HT neurons were labeled by an antibody stain for TPH2. Neurons innervating both M1 and Str were co-labeled by RbV-tdTomato and RbV-EGFP, and were typically found in the ventrolateral DRN and the dorsal border of the ventromedial DRN. Inset (i) is a confocal image of the ventrolateral DRN region in (B) marked by the white dashed box, and inset (ii) is a confocal image of the ventromedial DRN region in (B) marked by the yellow dashed box. Both insets are centered on TPH2+ cells co-labeled by RbV-tdTomato and RbV-EGFP.
Figure 6—figure supplement 3
Caudal DRN B7 neurons innervate ventral striatum and prefrontal cortex.
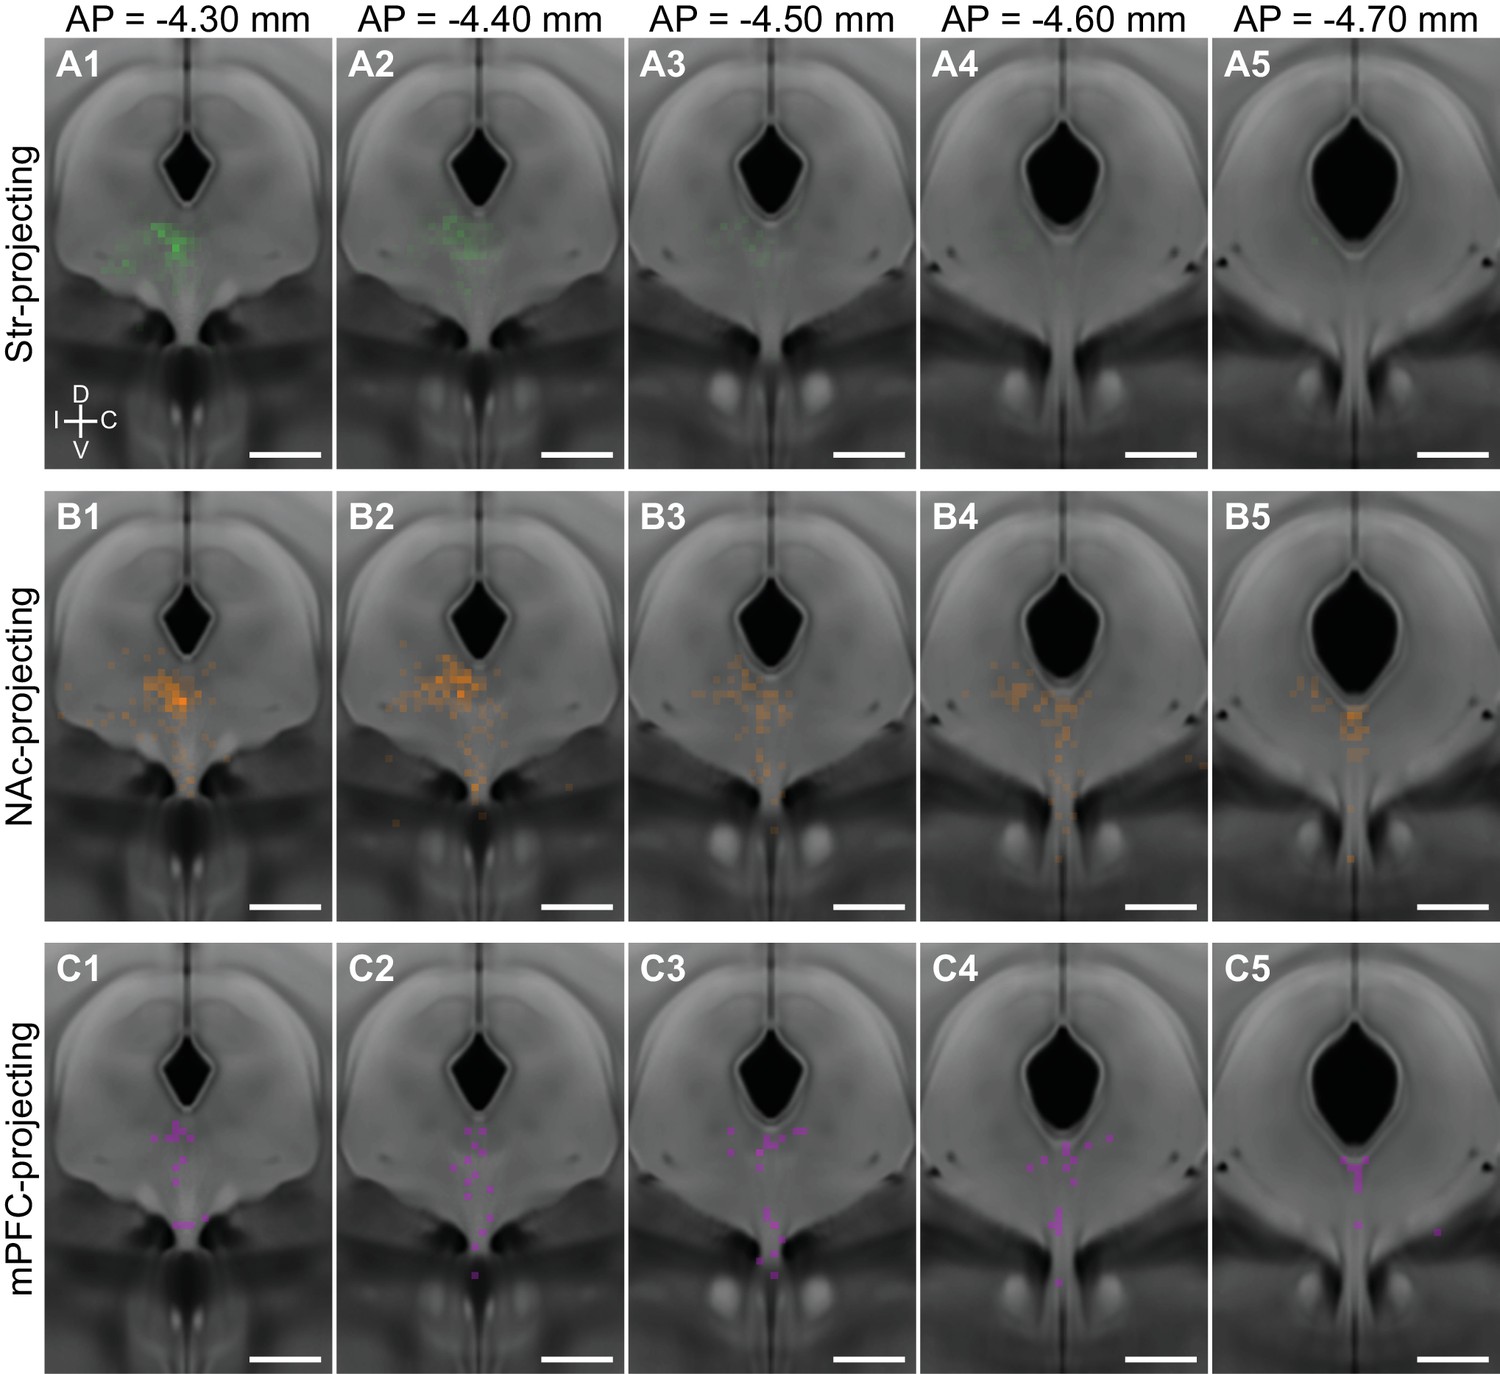
Distributions of Str-projecting (A), NAc-projecting (B), and mPFC-projecting (C) neurons displayed as probability density maps overlaid on the Allen Brain Atlas coronal template. Str-projecting and NAc-projecting are both found in the dorsomedial DRN at anterior sections (columns 1–2). Str-projecting neurons are more restricted to anterior sections of the DRN, whereas the NAc-projecting neurons are also found in posterior sections of the DRN (columns 3–5) where they overlap with the distribution of mPFC-projecting neurons.
Figure 7 with 1 supplement
Striatum receives inputs from multiple DRN 5-HT neuron subtypes.
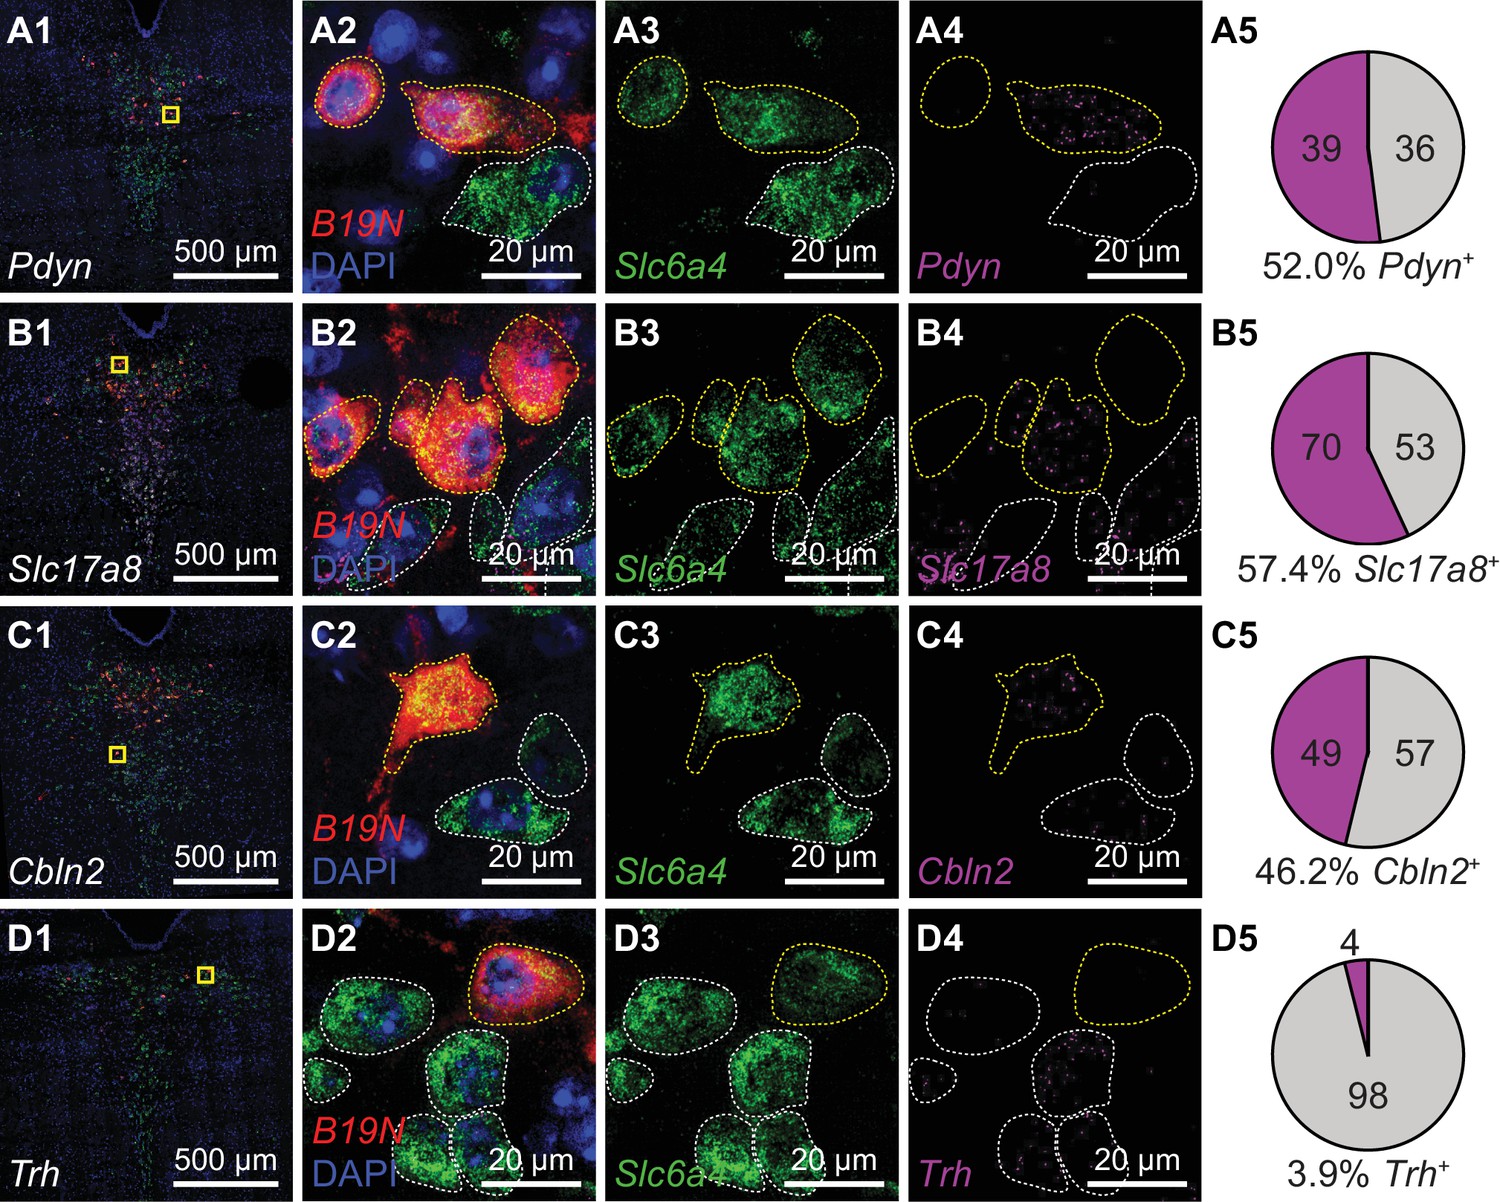
Multiplexed FISH was used to identify rabies-infected Str-projecting 5-HT neurons in the DRN and quantify their expression of 5-HT subtype enriched genes. Rabies-infected neurons are identified by expression of the virus transcript B19N. Confocal images of the DRN from representative coronal sections are shown in column 1, and regions marked in yellow are expanded and separated by channel in columns 2–4. In columns 2–4, rabies-infected cells (B19N+) are outlined in yellow, whereas uninfected 5-HT neurons are outlined in white. The proportions of DRN 5-HT neurons that express each subtype-enriched gene are summarized in pie charts in column 5. Approximately half of the Str-projecting 5-HT neurons express the 5-HT-III enriched gene Pdyn (row A), and a similar proportion express 5-HT-IV enriched genes such as Slc17a8 (row B) and Cbln2 (row C). Most Str-projecting 5-HT neurons do not express the 5-HT-I enriched gene Trh (row D).
Figure 7—figure supplement 1
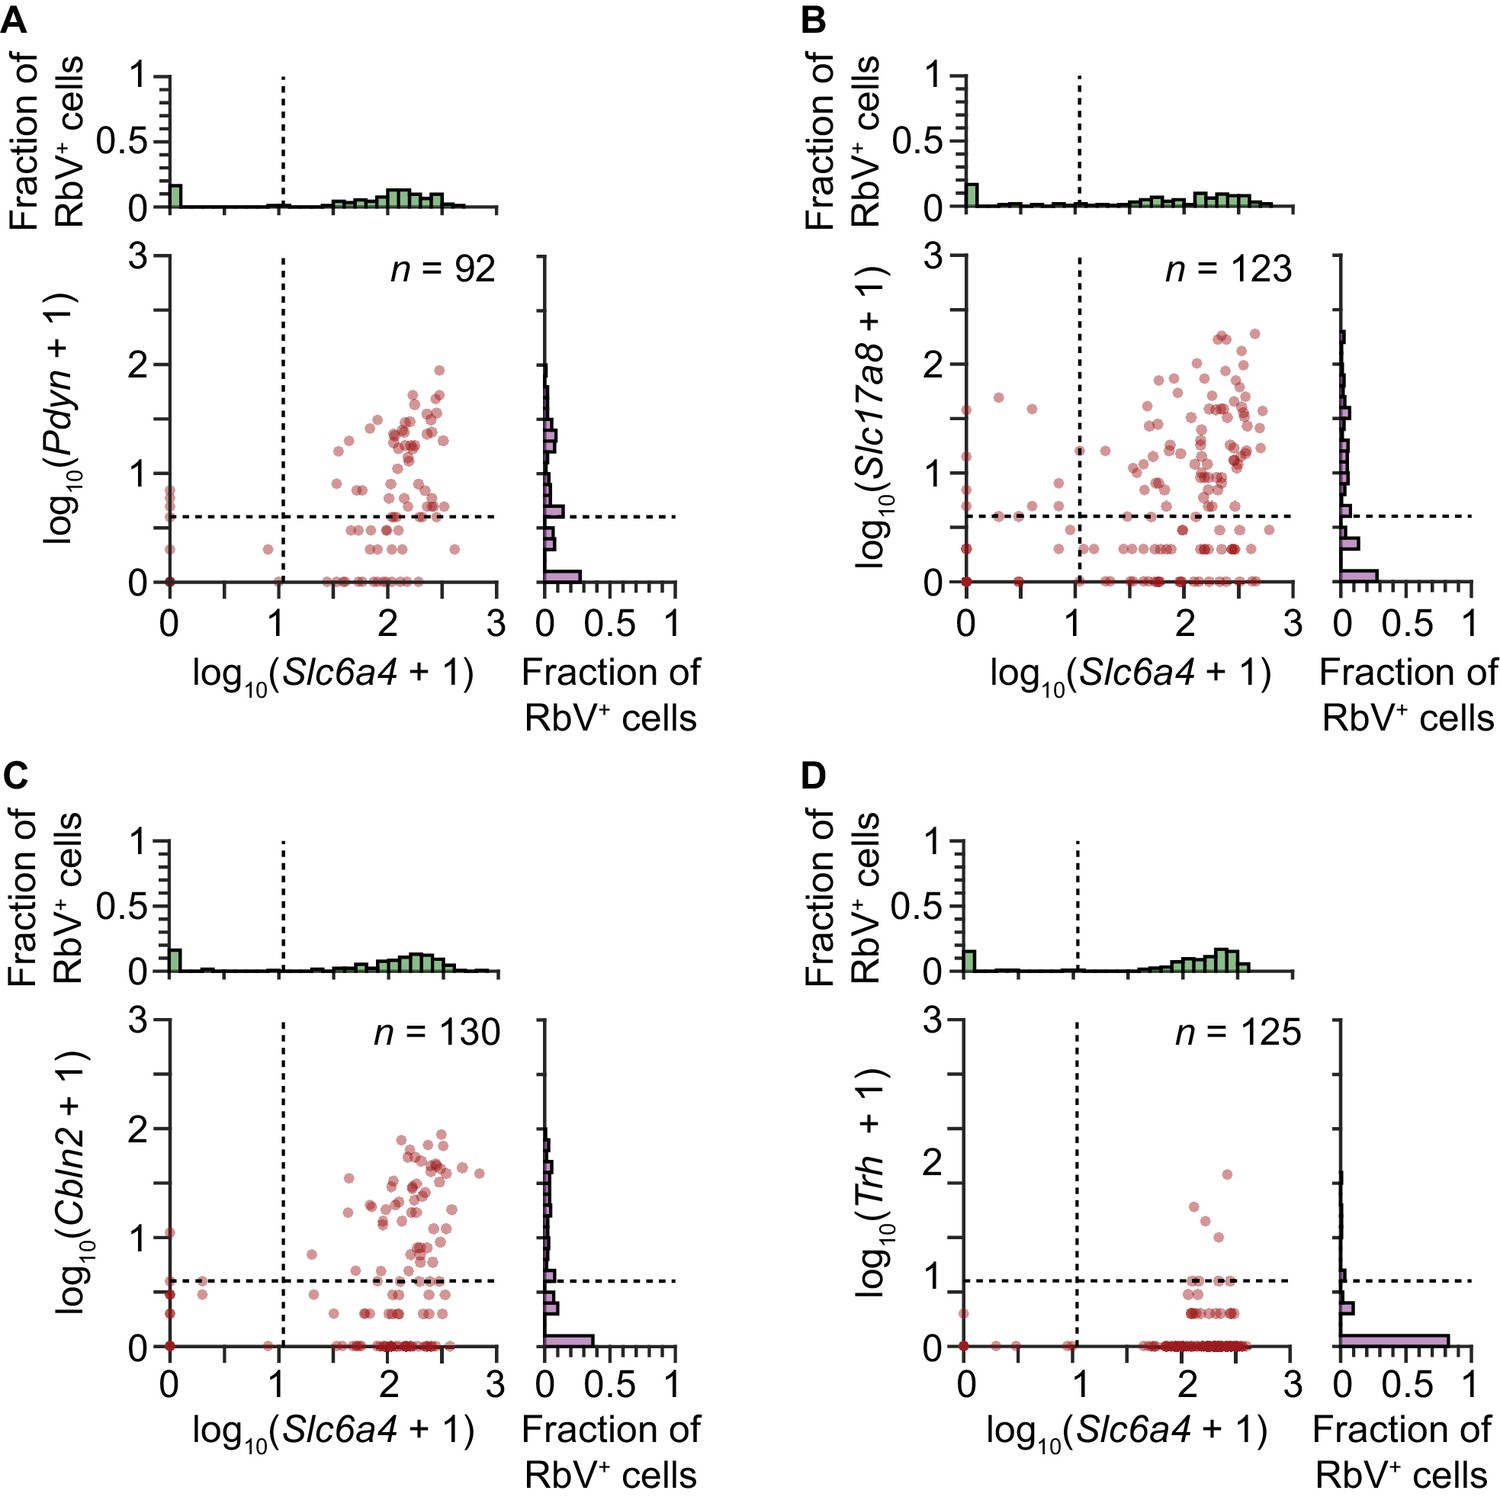
Quantification of RNAscope puncta in Str-projecting neurons.
Scatter plots with marginal histograms showing the quantification of the number of single molecule FISH puncta (RNAscope) in each Str-projecting cell. Each dot represents a single RbV-labeled cell. RbV-labeled cells were categorized based on expression of Slc6a4 and one of four 5-HT subtype enriched genes: Pdyn (A) for 5-HT-III, Slc17a8 (B) and Cbln2 (C) for 5-HT-IV, and Trh (D) for 5-HT-I. Dashed lines in the scatter plots and marginal histograms indicate the thresholds used to binarize expression. Separate RNAscope experiments were performed for each 5-HT subtype enriched gene. All RbV-labeled cells in the analyzed images were included, including some cells in the pedunculopontine nucleus, and the number of RbV-labeled cells in each experiment is indicated in the plot.
Figure 8 with 1 supplement
Pdyn+ 5-HT neurons target basal ganglia circuits.
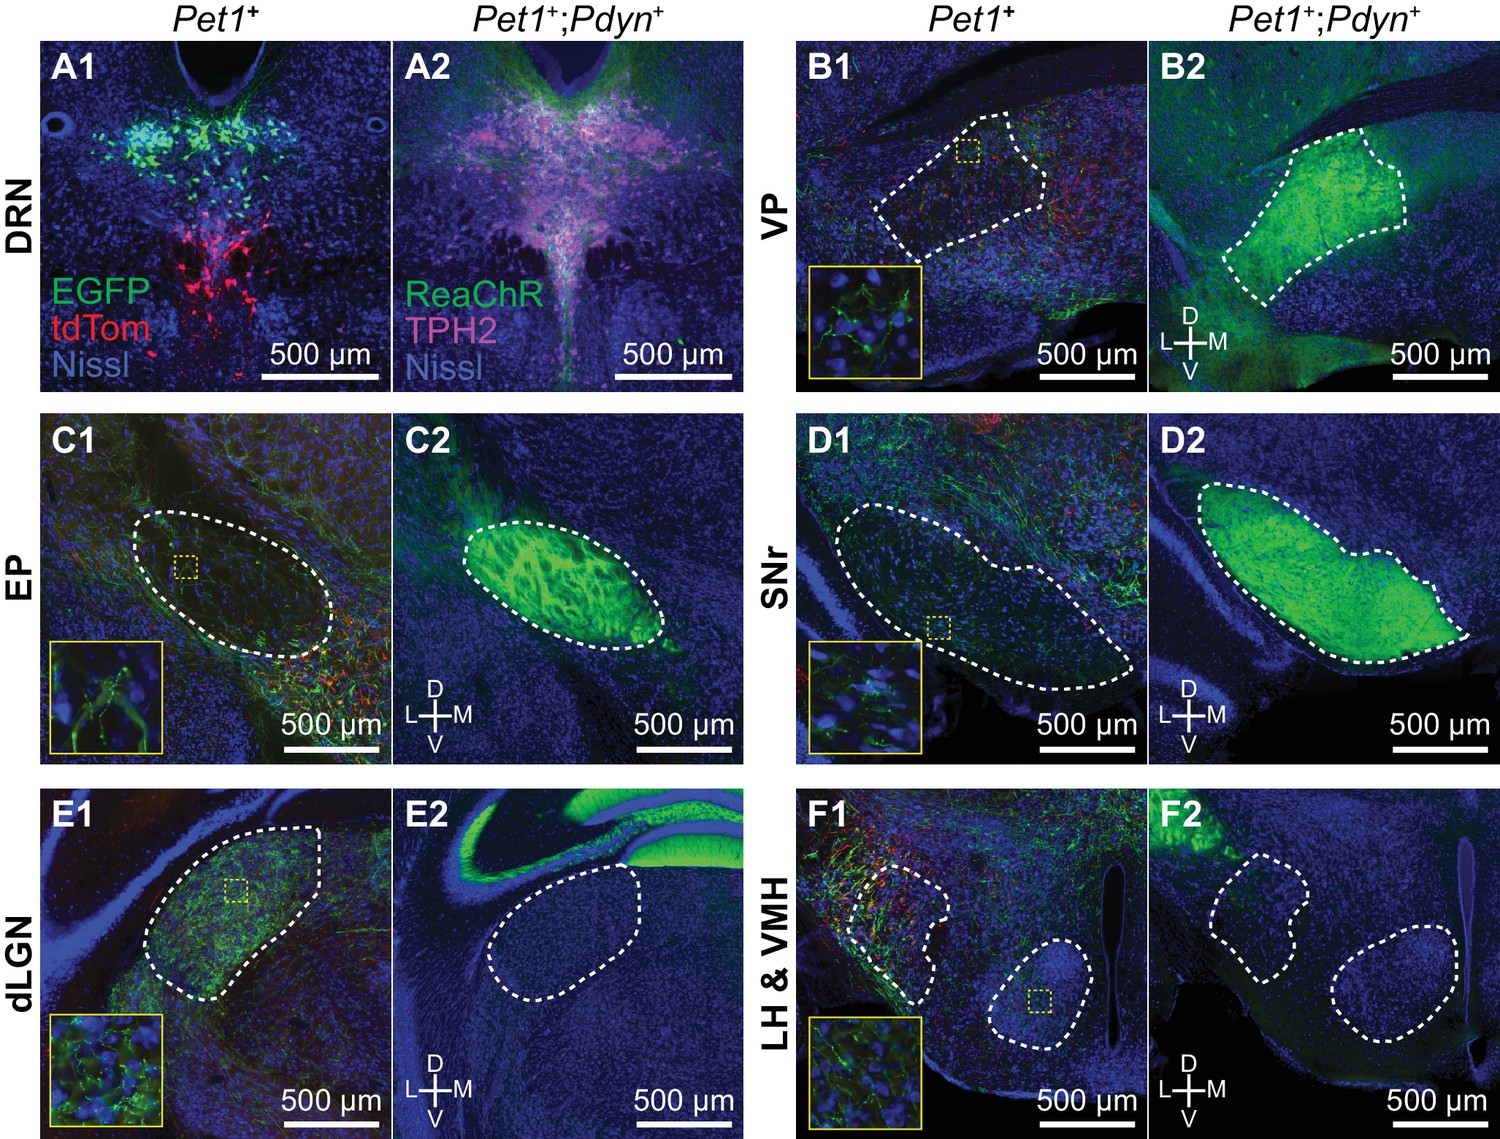
(A) Conditional anterograde tracing from subsets of 5-HT neurons. Anterograde tracing from Pet1+ DRN neurons was performed by injecting AAV2/1-CAG-FLEX-EGFP into the dorsal DRN and AAV2/1-CAG-FLEX-tdTomato into the ventral DRN of ePet1-Cre mice. A coronal section from the DRN injection site containing Pet1+ cells expressing either EGFP or tdTomato is shown on the left in (A1). Pdyn+;Pet1+ neurons were labeled by intersectional genetic targeting with a Cre- and Flp-dependent reporter line R26-LSL-FSF-ReaChR:mCitrine crossed to Pdyn-IRES-Cre;Pet1-Flpe mice. Pdyn+;Pet1+ expressing ReaChR:mCitrine in the DRN are shown on the right in (A2). 5-HT neurons are labeled by immunostaining for TPH2. (B-F) Axonal projections of Pdyn+;Pet1+ neurons were compared to projections of DRN Pet1+ neurons using separate approaches for conditional anterograde tracing. Pdyn+;Pet1+ neurons densely innervate many output nuclei of the basal ganglia, including VP (B2), EP (C2), and SNr (D2), which are also structures innervated by DRN Pet1+ neurons (B1, C1, and D1). Pdyn+;Pet1+ axons were not found in structures that were functionally distant from basal ganglia circuits, such as dLGN (E2) and hypothalamic nuclei (F2), although these structures received dense inputs from DRN Pet1+ neurons (E1 and F1). Regions outlined in yellow in B1 – F1 are enlarged in the insets showing EGFP+/tdTomato+ axon fibers in each region. Abbreviations: DRN – dorsal raphe nucleus. VP – ventral pallidum. EP – entopeduncular nucleus. SNr – substantia nigra pars reticulata. dLGN – dorsal lateral geniculate nucleus. LH – lateral hypothalamus. VMH – ventromedial hypothalamus. All tissue sections are counterstained with fluorescent Neurotrace (Nissl).
Figure 8—figure supplement 1
Pet1+;Pdyn+ neurons innervate a subset of regions targeted by DRN Pet1+ neurons.
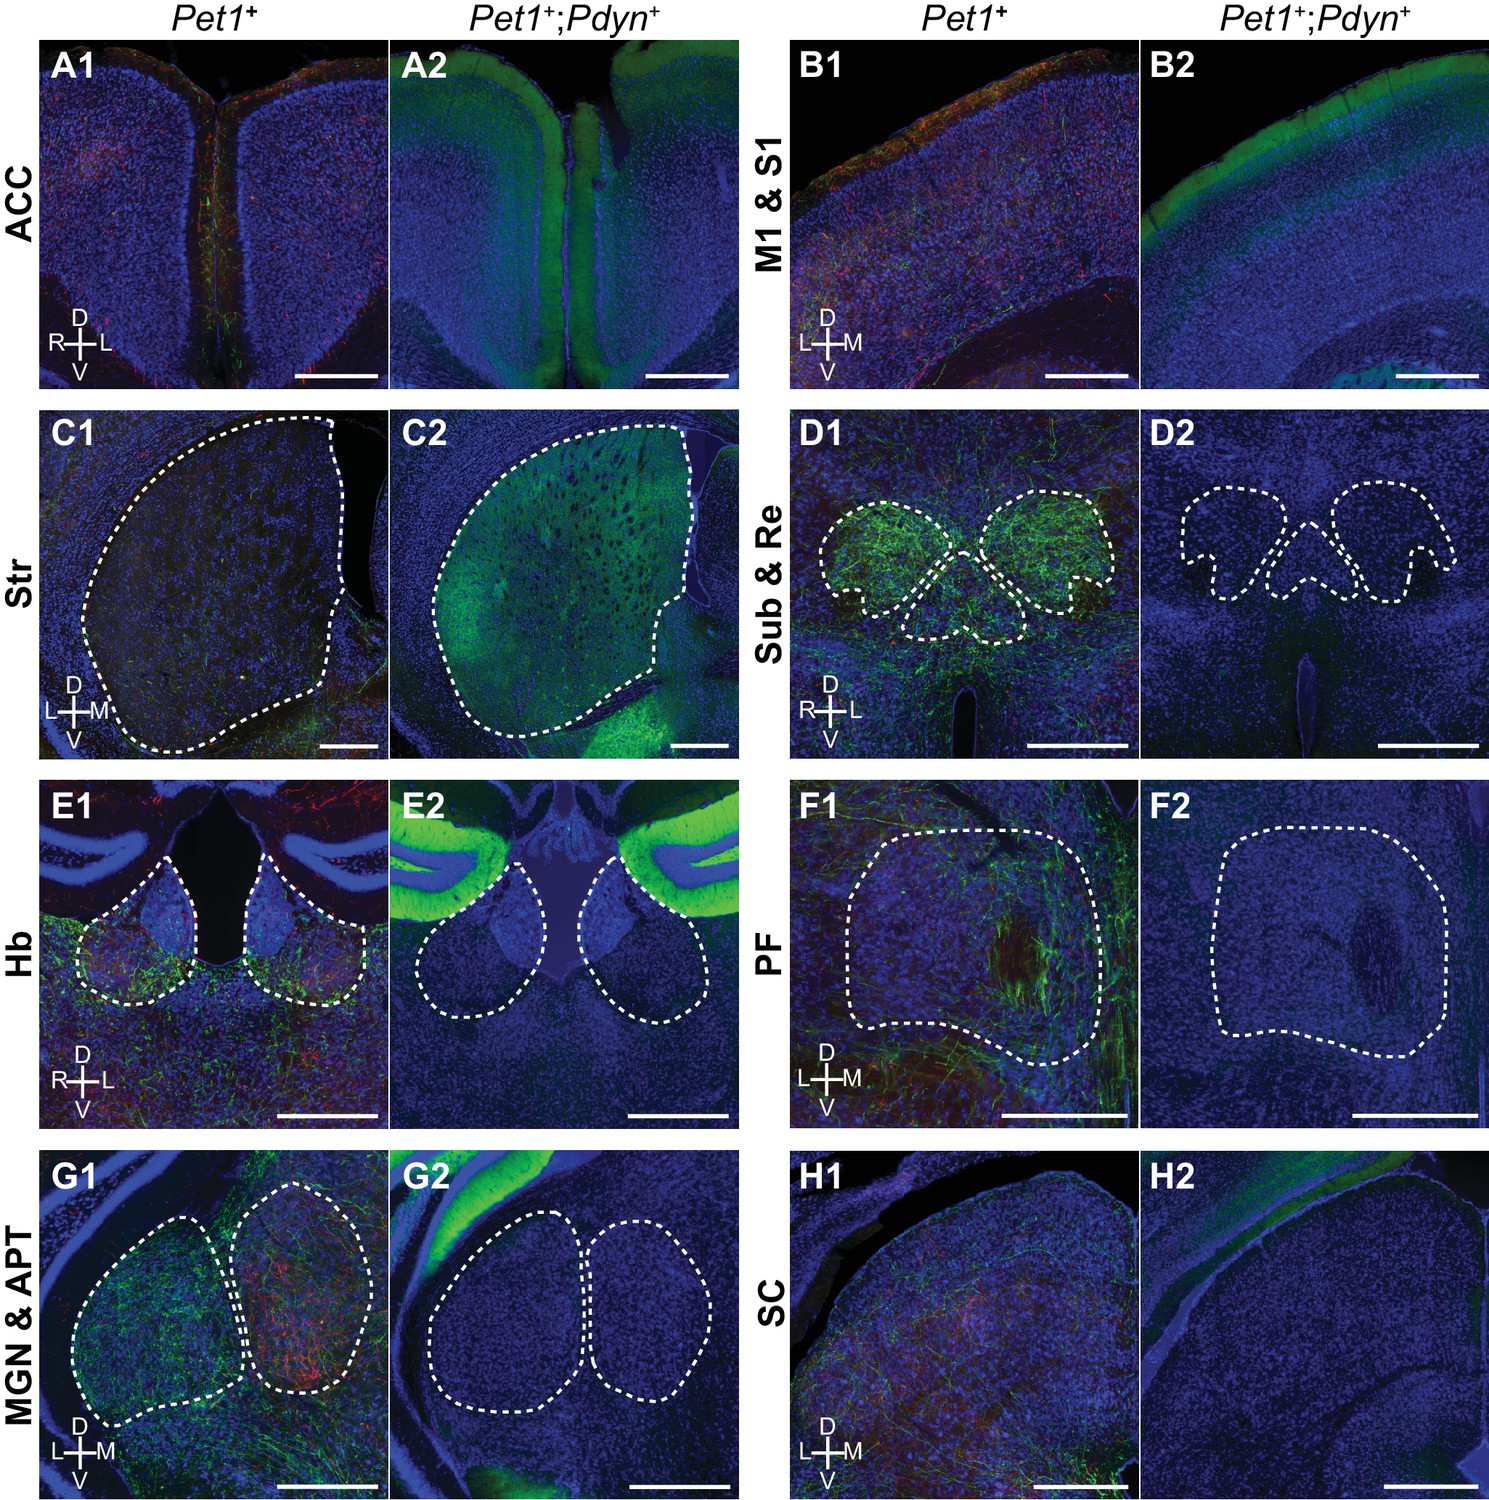
Images of cortical and subcortical regions in the forebrain from conditional anterograde tracing of axons from DRN Pet1+ neurons and Pdyn+;Pet1+ neurons. Axons from Pdyn+;Pet1+ neurons were also found in frontal and prefrontal cortical regions (A-B), but were absent from thalamic nuclei that were innervated by DRN Pet1+ neurons (D-G) and subcortical regions outside of the basal ganglia, such as SC (H). Within Str, Pdyn+;Pet1+ axons were not uniformly distributed, with the highest density in the ventrolateral regions of Str. Abbreviations: ACC: anterior cingulate cortex; M1: primary motor cortex; S1: primary somatosensory cortex; Str: striatum; Sub: submedius thalamic nucleus; Re: nucleus reuniens; Hb: habenula; PF: parafascicular thalamic nucleus; MGN: medial geniculate nucleus; APT: anterior pretectal nucleus; SC: superior colliculus. Scale bars: 500 µm.
Author response image 1
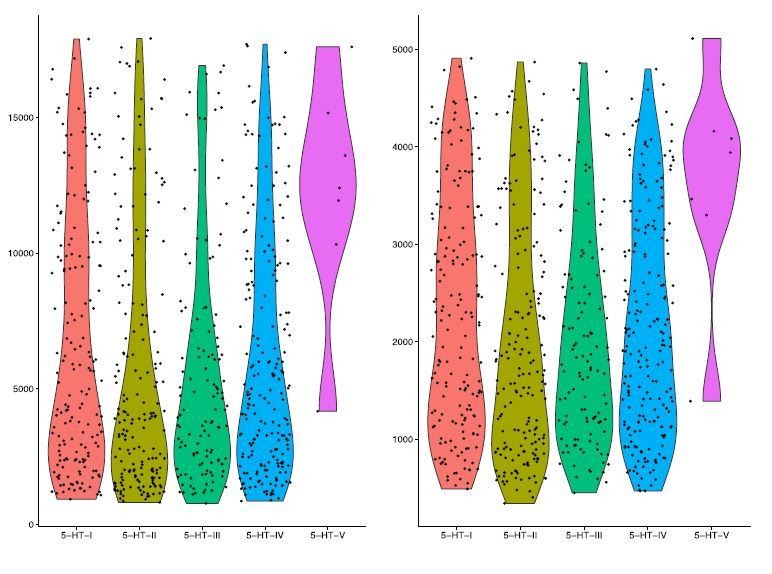
UMI count and gene detection rate for 5-HT neuron clusters.
Violin plots for UMI counts (nUMI, left) and gene detection rate (nGene, right) for each of the 5 5-HT neuron clusters in our scRNA-seq dataset. Columns represent each subtype, and individual points represent single cells.
Author response image 2
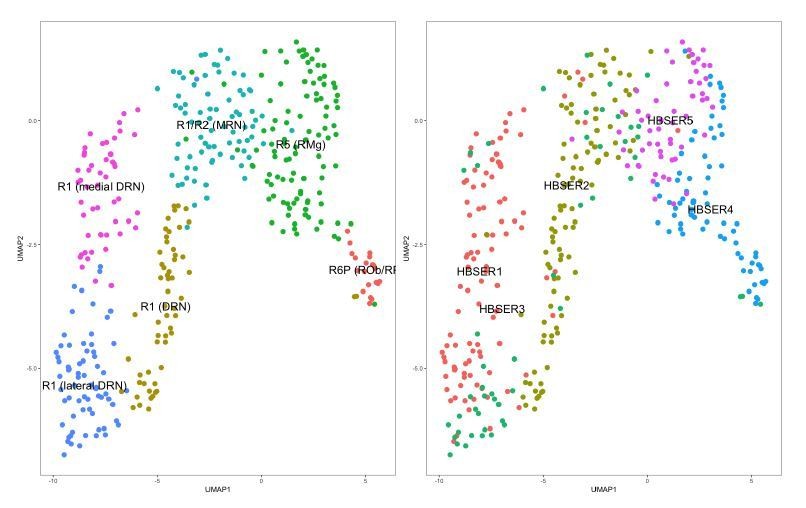
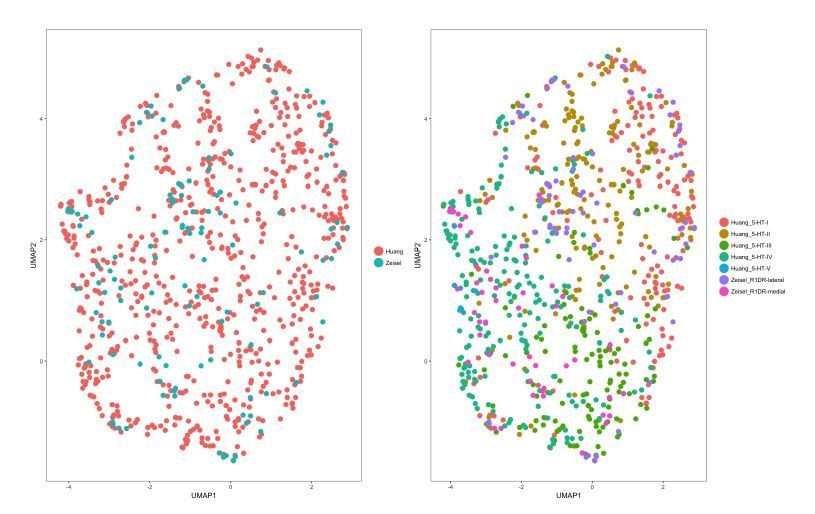
DRN 5-HT neurons are a subset of 5-HT neurons in the dataset from Zeisel et al. (2018).
5-HT neurons from the HBSER1-HBSER5 clusters in the dataset accompanying the publication by Zeisel et al., 2018, were isolated and clustered independently. Left: UMAP plot of 5-HT neurons in the Zeisel 2018 dataset color-coded by cluster assignments from graph-based clustering (Seurat, v. 2.3.1). Clusters identities were assigned by comparing cluster-enriched genes with genes known to be enriched in different 5-HT neuron subsets as described in Okaty et al., 2015. The separation of the “R1 (DRN)” cluster from “R1 (medial DRN)” and “R1 (lateral DRN)” clusters is largely driven by differences in expression of housekeeping genes such as ribosomal genes, and are likely to be technical in nature similar to batch effects (data not shown). Right: UMAP plot of 5-HT neurons in the Zeisel 2018 dataset color-coded by the original cluster assignments. Cluster assignments from the originating publication differ from the clusters that we have identified independently using graph-based clustering methods.
Author response image 3
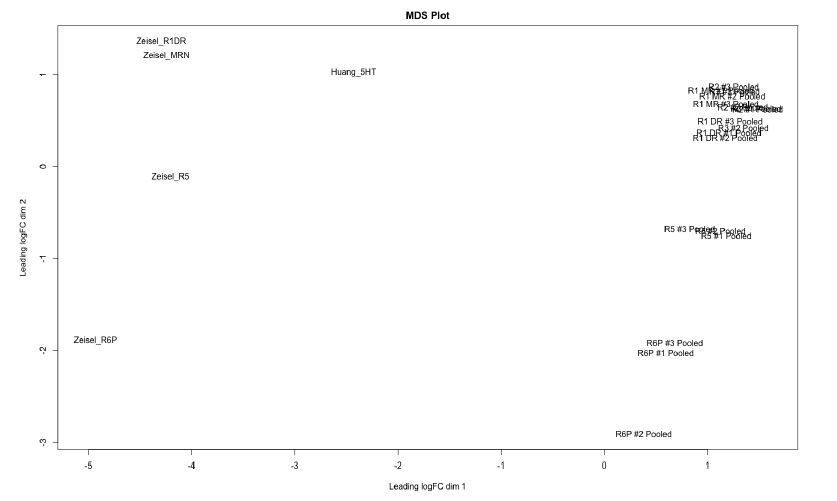
Clusters identified from Zeisel 2018 dataset correspond to 5-HT neurons originating from different rhombomeres.
Multidimensional scaling (MDS) plot of pooled samples from Okaty et al. (2015) and simulated bulk RNA-seq samples from our dataset (Huang_5HT) and clusters we identified in the Zeisel 2018 dataset (Zeisel_R1DR to Zeisel_R6P). Separation of samples along dimension 1 corresponds primarily to the dataset of origin, and is likely to be driven by technical effects. Samples that are biologically similar, i.e. containing cells from similar structures or developmental origin, are closer in position along dimension 2. The MDS plot was generated using the edgeR package.
Author response image 4
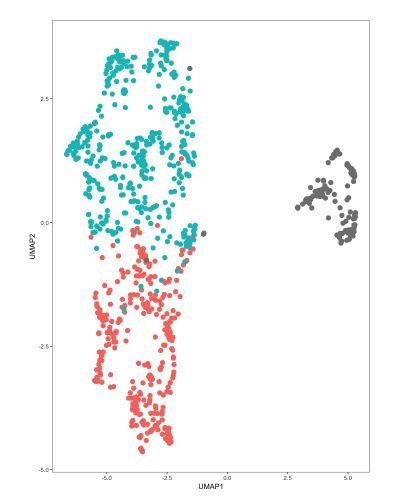
DRN 5-HT neurons in merged dataset separate by study of origin and batch number.
DRN 5-HT neurons from the Zeisel 2018 dataset were merged with 5-HT neurons in our dataset into a single object that was analyzed in Seurat. UMAP plots were generated using the first 11 principal components (PCs). Cells are color-coded by the batch of origin. Red: Huang dataset batch 1. Blue: Huang dataset batch 2. Gray: Zeisel 2018 dataset. Batch information within the Zeisel 2018 dataset was not available.
Author response image 5
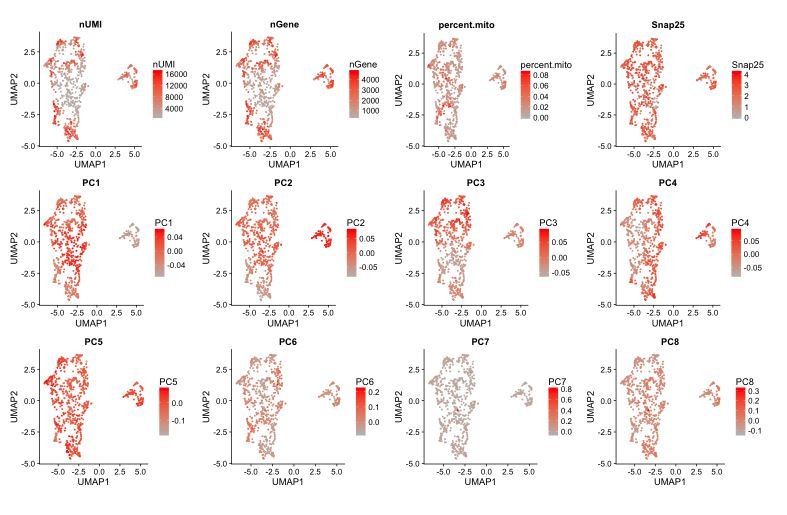
Separation of cells by dataset and batch can be attributed to the first 3 principal components.
UMAP plots of different data features, such as PC loadings and UMI counts per cell where each cell is color-coded by its score for a given feature. PCs 1-3 correlate better with the separation of cells by batch and dataset compared to the UMI count (nUMI) or number of genes (nGene) detected per cell.
Author response image 6

Batch effects are largely driven by differences in ubiquitously expressed genes.
Heatmaps showing the scaled expression (yellow: high, purple: low) of the genes with the highest weights in PCs 1-3 in cells at both extremes of the PC scores. Ubiquitously expressed genes such as ribosomal and mitochondrial genes have the highest weights in these PCs, which correlate with the separation of cells by dataset and batch.
Author response image 7

The Zeisel 2018 dataset 5-HT neuron cluster contains subdivisions corresponding to 5-HT neuron subtypes.
UMAP plots showing the expression of 5-HT neuron marker genes and several subtype enriched genes. Cells are color-coded by their log-normalized expression of the respective genes. 4 subdivisions can be seen within the cluster of cells from the Zeisel 2018 dataset on the right-hand side of each UMAP plot. Each subdivision is enriched in a different set of subtype enriched genes and are likely to correspond to clusters of 5-HT neuron subtypes I-IV. 5-HT-V neurons were not found in this subset of the Zeisel 2018 dataset.
Author response image 8

Cells from different datasets co-cluster after exclusion of PCs related to batch effects.
Exclusion of PCs 1-3 when generating a UMAP plot of the merged dataset removes the separation of cells by dataset and batch. Left: UMAP plot of the merged dataset, with cells color-coded by the dataset of origin. Right: UMAP plot of the merged dataset, with cells color-coded by the cluster identities assigned during separate analysis of each dataset. Cells from the Zeisel 2018 dataset co-cluster with the corresponding subtypes from our dataset.
Author response image 9
Cells from different datasets co-cluster when merged using CCA-based dataset alignment.
CCA-based dataset alignment (Butler et al., 2018) was performed on the merged dataset prior to 2-dimensional UMAP embedding. UMAP plots were generated using the first 7 aligned CVs. Left: UMAP plot of the merged dataset, with cells color-coded by the dataset of origin. Right: UMAP plot of the merged dataset, with cells color-coded by the cluster identities assigned during separate analysis of each dataset.
Tables
Key resources table
| Reagent type (species) or resource | Designation | Source or reference | Identifiers | Additional information |
|---|---|---|---|---|
| Strain (Mus musculus) | C57BL/6J | The Jackson Laboratory | Cat# JAX:000664, RRID:IMSR_JAX:000664 | - |
| Genetic reagent (Mus musculus) | Pet1-Cre | The Jackson Laboratory | Cat# JAX:012712, RRID:IMSR_JAX:012712 | - |
| Genetic reagent (Mus musculus) | Pet1-Flpe | PMID: 18344997 | RRID:MGI:5004974 | Lab of Susan Dymecki |
| Genetic reagent (Mus musculus) | Pdyn-IRES-Cre | The Jackson Laboratory | Cat# JAX:027958, RRID:IMSR_JAX:027958 | Lab of Bradford Lowell |
| Genetic reagent (Mus musculus) | R26-LSL-FSF-ReaChR:mCitrine | The Jackson Laboratory | Cat# JAX:024846, RRID:IMSR_JAX:024846 | - |
| Genetic reagent (Adeno-associated virus) | AAV2/1-CAG-FLEX-EGFP | Penn Vector Core | RRID:Addgene_51502 | 1012 GC/ml |
| Genetic reagent (Adeno-associated virus) | AAV2/1-CAG-FLEX-tdTomato | Penn Vector Core | RRID:Addgene_51503 | 1012 GC/ml |
| Genetic reagent (G-deleted rabies virus) | B19G-SADΔG-EGFP; RbV-EGFP | Other | N/A | Generated in-house (see Materials and methods) 109 IU/ml |
| Genetic reagent (G-deleted rabies virus) | B19G-SADΔG-tdTomato; RbV-tdTomato | Other | N/A | Generated in-house (see Materials and methods) 109 IU/ml |
| Antibody | Anti-TPH2 (rabbit polyclonal) | Millipore | Cat# ABN60, RRID:AB_10806898 | 1:1000 |
| Antibody | Anti-rabbit A647 (goat polyclonal) | ThermoFisher Scientific | Cat# A-21244, RRID:AB_2535812 | 1:500 |
| Chemical compound, drug | (R)-CPP | Tocris Bioscience | Cat# 0247 | 10 µM |
| Chemical compound, drug | Tetrodotoxin | Tocris Bioscience | Cat# 1069 | 1 µM |
| Chemical compound, drug | Kynurenic acid | Millipore Sigma | Cat# K3375 | 0.9 mM |
| Chemical compound, drug | Triptolide | Millipore Sigma | Cat# T3652 | 10 µM |
| Chemical compound, drug | Actinomycin D | Millipore Sigma | Cat# A9415 | 5 µg/ml |
| Chemical compound, drug | Anisomycin | Millipore Sigma | Cat# A5862 | 30 µg/ml |
| Peptide, recombinant protein | Pronase | Millipore Sigma | Cat# 10165921001 | 1 mg/ml |
| Commercial assay, kit | Papain Dissociation System, without EBSS | Worthington | Cat# LK003163 | 20 U/ml papain 0.05 mg/ml DNAse I |
| Commercial assay, kit | RNAscope V1 fluorescent multiplex detection assay reagents | ACDBio | Cat# 320851 | - |
| Commercial assay, kit | RNAscope V1 fluorescent multiplex detection assay probes | ACDBio | Cat# 428551; Cat# 498971; Cat# 400951; Cat# 318771; Cat# 525191; Cat# 319171; Cat# 431261; Cat# 319191; Cat# 315851; Cat# 436811; Cat# 525201; Cat# 456781 | Cbln2 Crhbp Gad1 Pdyn Prkcq Slc17a6 Slc17a8 Slc32a1 Slc6a4 Trh Trpc3 V-RABV-gp1 |
| Software, algorithm | inDrops pipeline (Python) | PMID: 26000487 | N/A | https://github.com/indrops/indrops |
| Software, algorithm | R 3.4.4 | R Project for Statistical Computing | RRID:SCR_001905 | https://cran.r-project.org/ |
| Software, algorithm | Seurat 2.3.1 | PMID: 29608179 | RRID:SCR_016341 | https://satijalab.org/seurat/ |
| Software, algorithm | MAST 1.4.1 | PMID: 26653891 | RRID:SCR_016340 | https://bioconductor.org/packages/release/bioc/html/MAST.html |
| Software, algorithm | goseq 1.30.0 | PMID: 20132535 | RRID:SCR_017052 | https://bioconductor.org/packages/release/bioc/html/goseq.html |
| Software, algorithm | MATLAB (R2016b, R2018b) | MathWorks | RRID:SCR_001622 | - |
| Software, algorithm | Fiji | PMID: 22743772 | RRID:SCR_002285 | https://imagej.net/Fiji |
| Software, algorithm | Ilastik 1.2.2 | DOI: 10.1109/ISBI.2011.5872394 | RRID:SCR_015246 | https://www.ilastik.org/index.html |
| Software, algorithm | CellProfiler 3.1.5 | PMID: 17269487 | RRID:SCR_007358 | https://cellprofiler.org/ |
| Other | Neurotrace 435 | ThermoFisher Scientific | Cat# N21479 | 1:100 |
| Other | VectaShield mounting media | Vector Labs | Cat# H-1000, RRID:AB_2336789 | - |
| Other | ProLong Gold mounting media | ThermoFisher Scientific | Cat# P36934 | - |
Additional files
-
Supplementary file 1
Genes for identification of major cell types.
Several examples of genes used to identify each of the major cell types/classes are listed. Slc17a7 (VGluT1) is typically used to identify glutamatergic neurons but was not detected in our scRNA-seq dataset, and was therefore excluded from this list.
- https://doi.org/10.7554/eLife.46464.023
-
Supplementary file 2
Genes for spatial correlation analysis.
Table of genes and the corresponding experiment IDs from the Allen Brain Atlas that were used for spatial correlation analysis to infer the distribution of 5-HT neuron subtypes. Images, referenced in the table by the image numbers in the experiment image series, were manually matched to a corresponding image in the coronal reference that consisted of 12 sections spanning −3.80 mm to −4.90 mm along the anterior-posterior axis (zeroed at Bregma). Missing data (e.g. no image, damaged section), is denoted with a "-" and assigned a NaN value. Sections containing data for the same gene from different experiments were averaged to obtain a single entry for each gene.
- https://doi.org/10.7554/eLife.46464.024
-
Transparent reporting form
- https://doi.org/10.7554/eLife.46464.025
Download links
A two-part list of links to download the article, or parts of the article, in various formats.
Downloads (link to download the article as PDF)
Open citations (links to open the citations from this article in various online reference manager services)
Cite this article (links to download the citations from this article in formats compatible with various reference manager tools)
Molecular and anatomical organization of the dorsal raphe nucleus
eLife 8:e46464.
https://doi.org/10.7554/eLife.46464


